Article

Hematite Exsolutions in Corundum from Cenozoic Basalts in Changle, Shandong Province, China: Crystallographic Orientation Relationships and Interface Characters

School of Earth Science, China University of Geosciences, Wuhan 430074, China
*
Author to whom correspondence should be addressed.
Crystals 2022, 12(7), 905; https://doi.org/10.3390/cryst12070905
Submission received: 19 May 2022 / Revised: 21 June 2022 / Accepted: 22 June 2022 / Published: 24 June 2022
(This article belongs to the Special Issue Dislocation in Minerals)

Abstract

:
Here, we present well-oriented hematite exsolutions in corundum megacrysts from Cenozoic basalt in China. Crystallographic orientation relationships (CORs) and the interface characters between the hematite exsolutions and the corundum host were analyzed by electron backscatter diffraction (EBSD) and high-resolution transmission electron microscope (HRTEM), respectively. The CORs and the regular interface confirm the exsolution and the exsolution was formed under depressurization based on the crystal chemistry theory. There are three groups of exsolutions intersected with ~60°. Two groups of the exsolutions have the same orientation with the host and the other group is twinned to those two groups. Focused ion beam (FIB) for HRTEM foil preparation was carried out. HRTEM photographs show that there are periodic coherency units at (0001) interface. The measured unit lengths are 6.71–6.72 nm, which are in good agreement with every 17- D C r n 01 1 ¯ 2 p r o j e c t i o n or 16- D H e m 01 1 ¯ 2 p r o j e c t i o n . Based on the results, the possibility is that at the interface, the hematite-corundum phases tend to modulate to achieve the maximum coherency in the geological process during exsolution. This research is helpful to understand the interface characters between the exsolution and host.

1. Introduction

Oriented acicular/rod/plate-shaped Fe-Ti oxides exsolutions in minerals have been widely reported in the past, such as titanite and rutile in biotite [1,2], rutile in quartz [3], ilmenite in amphibole [4], ilmenite, spinel and magnetite in clinopyroxene [5,6], and hematite in rutile [7]. During recent years, crystallographic orientation relationships (CORs) between the exsolutions and the hosts have attracted scholars’ attention greatly. Hwang et al. (2010) reported that CORs of hematite exsolutions and their rutile hosts and suggested the CORs were controlled by misfit oxygen layers and interface energy [7]. Xu and Zhao (2020) studied ilmenite in amphibole hosts and established specific CORs between them and found the maximum formation temperature of the ilmenite exsolutions [4]. Corundum minerals are widespread and occur in a range of rocks, and can be formed during magmatism, contact metamorphism and regional metamorphism [8]. In corundum, there are generally Fe-Ti oxides exsolutions. Moon and Phillips (1984) and Saminpanya (2001) identified that acicular exsolutions were an intermediary state between ilmenite and hematite series [9,10]. He et al. (2011) studied TiO2 in corundum and found that twinned α-TiO2 transformed to rutile structure at specific temperature [11]. Bui et al. (2015) studied ilmenite exsolutions in asterism corundum by Raman spectroscopy and found that ilmenite exsolutions occurred in four arrays elongated parallel to the cleavage cracks [12]. Furthermore, interface structures between hematite-corundum phases have been researched. Wang et al. (2002) studied the interface characters of synthetic hematite on corundum, analyzed the structure across the interface and pointed out that it presented disordered misfit dislocations [13]. Maheswaran et al. (2005) also studied synthetic hematite–corundum interface dislocations, and revealed the dislocations distributed at the interface presenting growth ledge and disordered misfit dislocations [14].
However, more detailed work about CORs and interface characters at the nm-scale between exsolved hematite and the corundum host is still necessary.
Well-oriented exsolutions have been found in corundum megacrysts from Cenozoic basalt, Changle county, Shandong Province, eastern China. In order to characterize the CORs and interface between the exsolutions and the host, the corundum megacryst and the exsolutions have been investigated by electron backscatter diffraction (EBSD) combined with electron probe microanalyzer (EPMA), X-ray powder diffraction (XRD) and HRTEM. The CORs and the interface characters are discussed.

2. Materials and Methods

2.1. Sample Preparation

Changle is located on the Cenozioc basalt belt of eastern China. This basalt belt is over a distance of ~260 km along southeast to northwest China. Most of these basalts are alkali-rich [15,16]. One corundum megacryst (10.2 mm in length, 8.8 mm in width and 5.6 mm in depth) was collected from Cenozioc basalt of Niushan Formation located at Changle county (Red star represents the location in Figure 1, i.e., N 36°33′20″, E 118°48′0″), Shandong Province, eastern China. This specimen was glued by epoxy resin in a copper ring with a few exsolutions exposed. Then the assembled specimen was polished using several mechanical steps; a series of decreasing grain-size diamond powders from 3 μm via 1μm to 0.3μm were used for surface grinding. In addition, to remove the remaining surface damage, 0.1μm and 0.03μm diamond suspensions were used for elaborate polishing. The glossy specimen surface was coated with a thin conductive carbon film prior to the EBSD and energy-dispersive spectroscopy (EDS) tests. The exsolutions were cut by focused ion beam (FIB) and attached to a foil for high-resolution transmission electron microscopy (HRTEM) observation.

2.2. Mineralogical Compositions and Phase Identification

The mineralogical composition test was carried out by EPMA. The test was performed at Microbeam Analysis Technology Co., Ltd., Wuhan, China, using a JEOL JXA-8230 EPMA (JEOL Company, Tokyo, Japan) equipped with five wavelength-dispersive spectrometers. Operating conditions for quantitative analyses involved an accelerating voltage of 15 kV, a beam current of 20 nA and a 1µm spot size. The peak counting time was 10 s for Al, Si, Fe, V, Cr and 20 s for Ti, Mn. The background counting time was 1/2 of the peak counting time on the high- and low-energy background positions. The influence of overlap from V Kβ to Cr Kα and Ti Kβ to V Kα has been corrected. The detection limit of quantitative analysis is ~100 ppm.
The phase identification was tested by XRD. The test was carried out in the State Key Laboratory of Geological Processes and Mineral Resources, Wuhan, China, using a Panaco X ‘Pert Pro DY 2198 XRD (PANalytical Company, Almelo, The Netherlands). The accuracy of the diffraction peak was < 0.01, the maximum count rate of the ultra-pure detector was >130 × 106 cps, and the monochromatic light scattered by small angle was <0.01.

2.3. CORs and Interface Observation

2.3.1. EBSD Analysis

The CORs measurements were obtained using an EBSD facility. The polished specimen was examined in backscatter electron mode using a Tescan (Brno, Czech Republic) Mira-3 Scanning electron microscope (SEM) equipped with an EDS and an EBSD. The EBSD patterns were generated by the interaction of a vertical electron beam with the polished specimen, tilted at 70° to the horizontal in the SEM. The operating conditions were as follows: accelerating voltage of 20 kV, working distance of 12 mm, low-vacuum mode.
Backscatter diffraction patterns were collected and indexed manually with an interactive mode using the CHANNEL 5.0 software from the HKL Technology, Oxford Instruments (Oxford, UK).

2.3.2. FIB Cut

The foil for HRTEM study was prepared using a Tescan (Brno, Czech Republic) Gaia-3 GMU Model dual FIB-SEM, at 30 kV with Ga+ ion beam, the polished specimen was carbon-coated and mounted in the instrument.

2.3.3. HRTEM Analysis

HRTEM imaging and energy dispersive X-ray detector (EDX) measurements were performed on an ultra-high-resolution, probe corrected, FEI (USA) Talos F200X HRTEM, which is equipped with the X-FEG Schottky electron source, Si (Li) detector at 0.3 steradian, X-ray collection angel and Super-XTM EDX geometry. The tests were operated at 200 kV, using a double-tilt holder and a Ceta-CMOS digital camera. Initial angles are: α = −29.6°, β = −126°, γ = 20.7°. Selected area electron diffraction (SAED) patterns were acquired.
The EBSD, FIB and HRTEM work was performed at the Analyses Center, Shanghai Jiao Tong University, China.

3. Results

Two corundum megacrysts in a Cenozoic basalt rock are shown in Figure 2a. Optical microscopic photograph of the specimen is shown in Figure 2b, viewed down the z-axis of the corundum host. Three groups of exsolutions intersect with ~60° can be observed. Abbreviations for the mineral names are: Crn for corundum, Hem for hematite in this article.
The SEM photograph in Figure 2c and HRTEM photograph in Figure 2e reveal that the dimensions of the exsolutions are ~10 μm × ~1 μm × 0.1–0.2 μm. We use FIB to dig into the cross-section area [yellow box in Figure 2d]. The cross-sections of the exsolutions are rectangular according to the photographs in Figure 2e,f labeled with white arrows. In Figure 2f (microscopic element mapping photograph of the foil), yellow and green parts represent Fe and Al, respectively, the exsolution is arrowed.

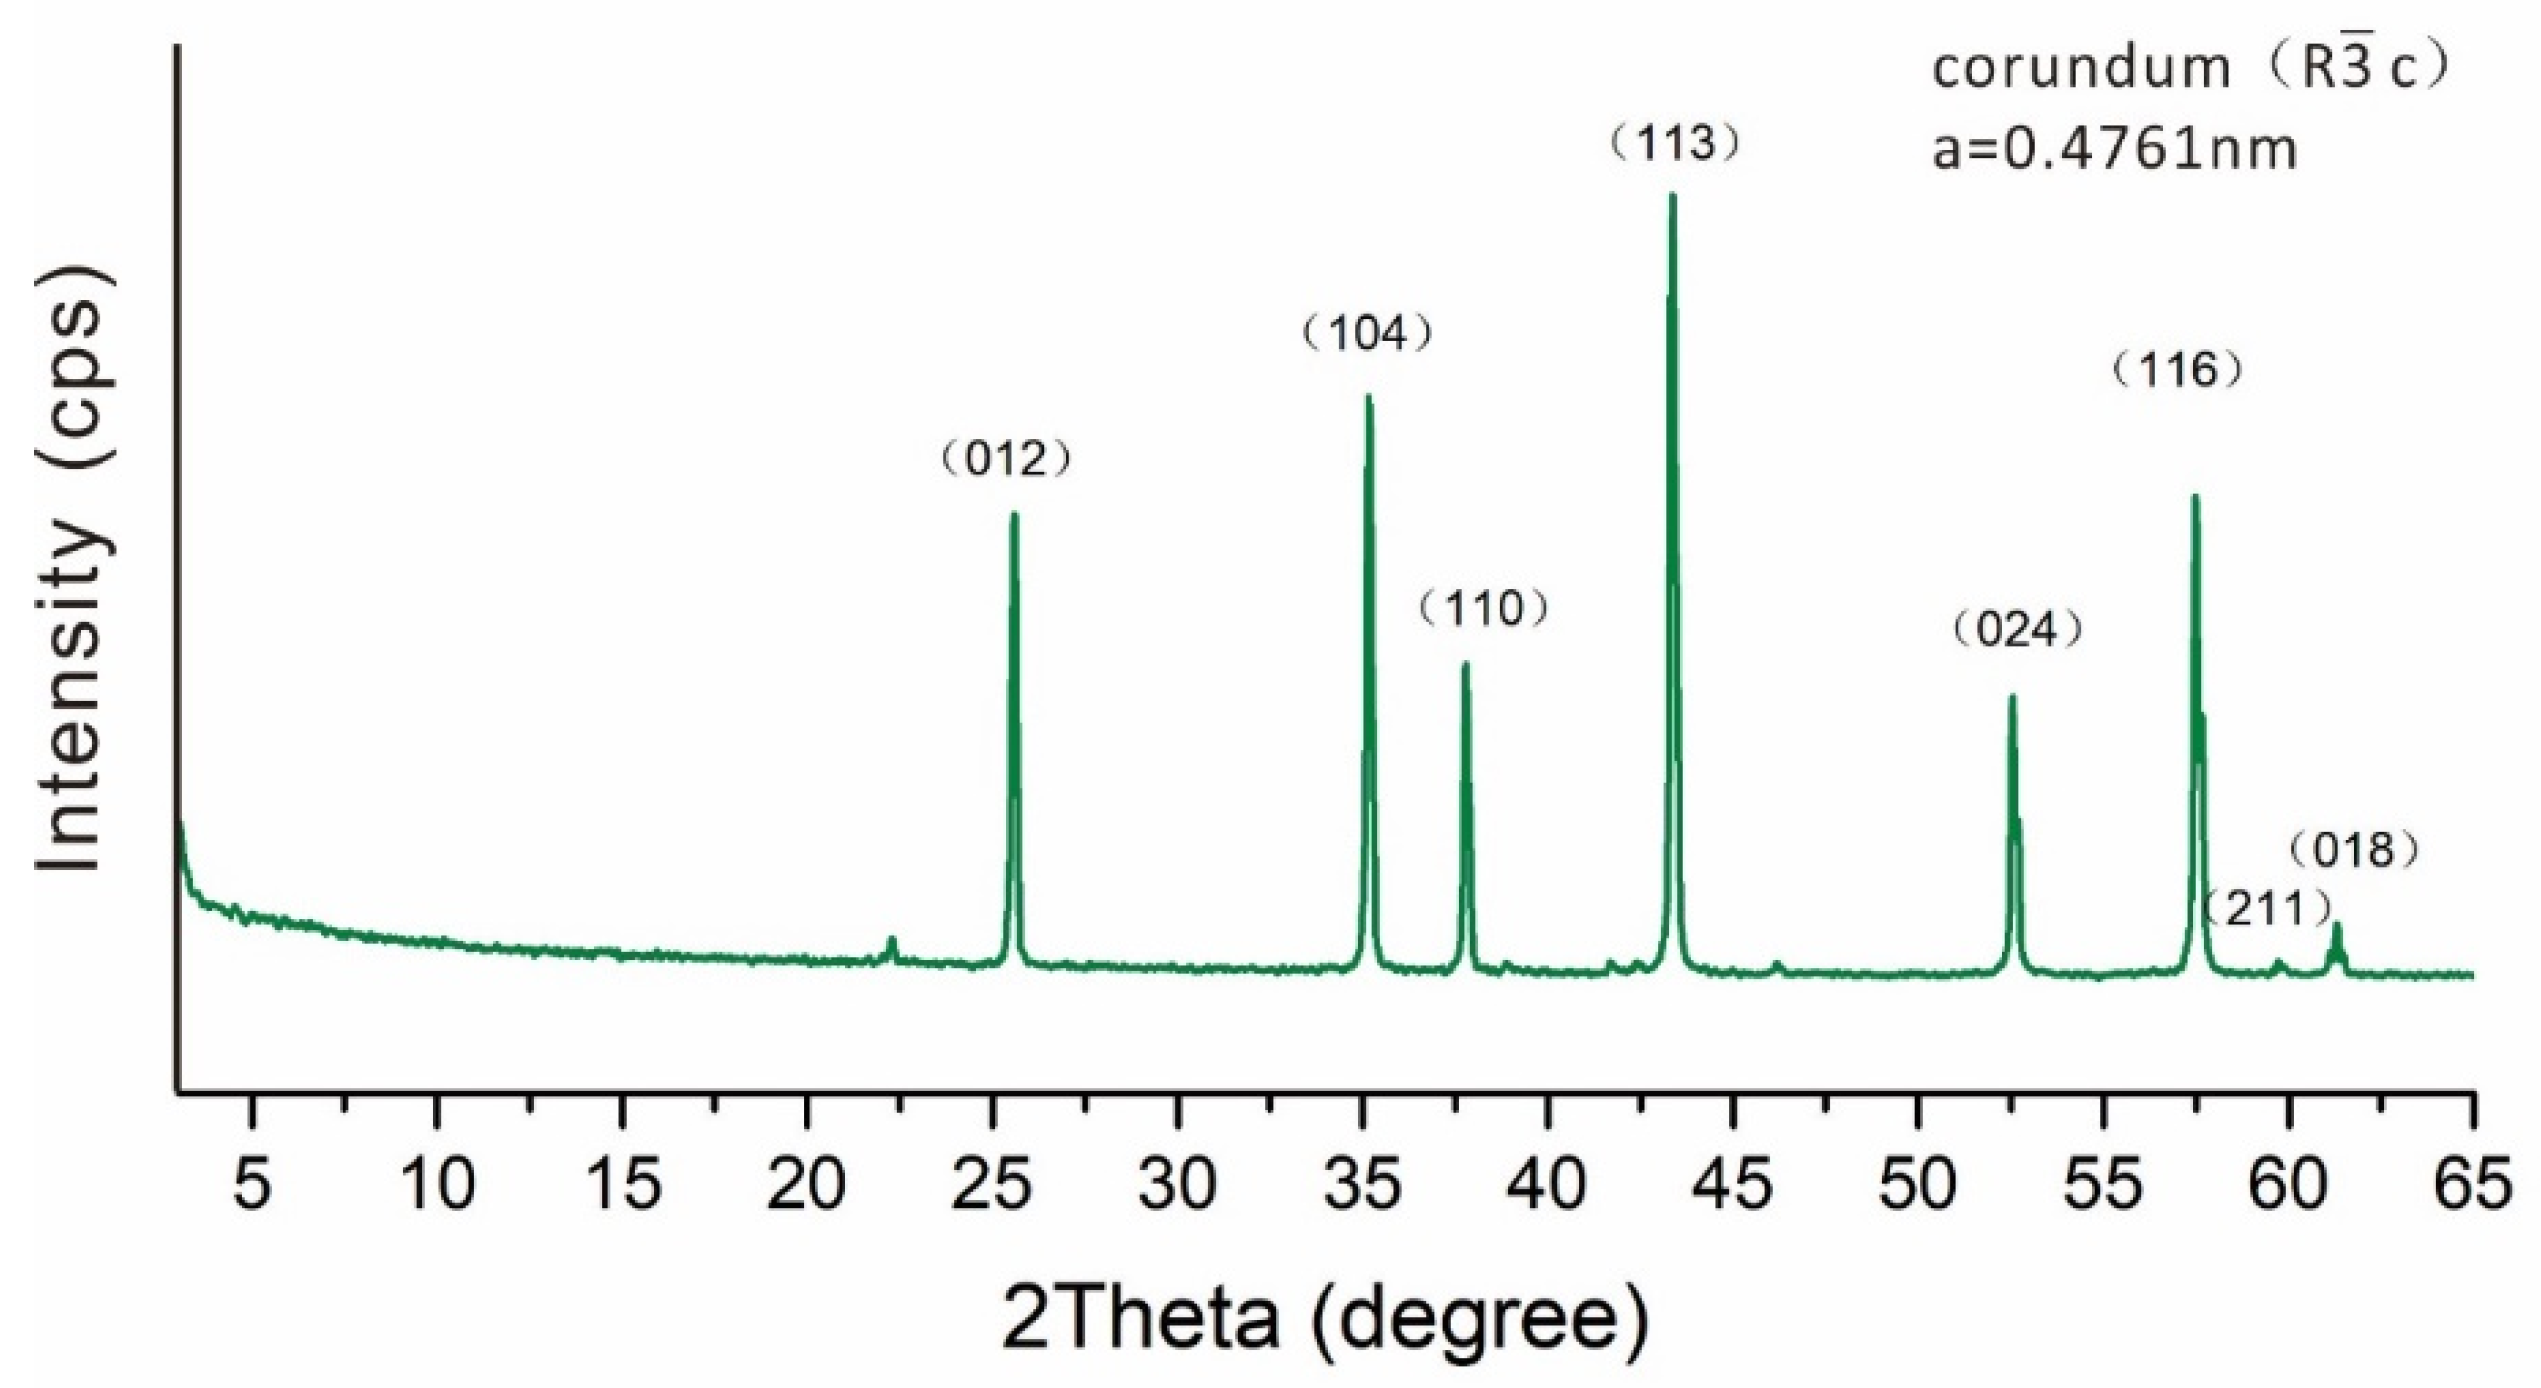
3.1. EPMA and XRD Results

The host was tested by EPMA, and the compositions of the core and the rim of corundum are listed in Table 1. The average composition of the host is [Al1.99Fe0.022.01O3. The host is corundum with homogeneous composition.
XRD results are plotted in Figure 3. Due to the slight amount of the exsolutions, we could not identify the exsolution phase with XRD. The host is typical corundum phase (according to PDF74-1081 from the Inorganic Crystal Structure Database).

3.2. EBSD Results

Electron backscatter patterns (EBSP) of corundum were indexed by: space group R 3 ¯ c, a = 0.4847 nm, c = 1.2576 nm. EBSP of hematite were indexed by: space group R 3 ¯ c, a = 0.5162 nm, c = 1.3698 nm. To acquire accurate data, only the measurements with mean angular deviation values below 1° were accepted for analyses.
The SEM-BSE of the exsolutions and the host are shown in Figure 4a–e. A total of 17 points were investigated by EBSD. Points 1–2 in Figure 4a, 3–5 in Figure 4b, 8–9, 11 in Figure 4c, 12–14 in Figure 4d and 16–17 in Figure 4e were tested on the exsolutions. Points 6–7 in Figure 4b, 10 in Figure 4c and 15 in Figure 4d were probed on the corundum host.
Due to the crystallographic similarity of the two phases, the exsolutions and the corundum host might be misidentified if using mapping method, thus point measurements were carried out manually instead. The Kikuchi patterns inserted in Figure 4b,c indicate that the exsolutions and the corundum host are with the same patterns, thus the two phases were identified by an additional accessory named TruPhase, which is essentially EDS. EDS (TruPhase) mapping is shown in Figure 4f, and blue, green, and red parts represent Fe, Al, and O elements, respectively. Fe and O is dominate in the exsolution. Elements mapping combined with EDS in Figure 4f show the exsolutions are hematite. In Figure 4g, EDS spectrogram indicates that the exsolutions is abundant in Fe.
The SEM-BSE photographs of the hematite exsolutions and the corundum host are shown in Figure 4. Four points on corundum distributing in different domains of the host were tested, and Figure 5a shows that the host is a single crystal.
To legibly see the relationships of the selected exsolutions, the outline of six actual hematite exsolutions in Figure 4a–e are drawn and merged into Figure 6. The hematite exsolutions can be subdivided into three groups, each group of the exsolutions are approximately parallel to each side of the equilateral triangle.
Pole figures of the host and all the hematite exsolutions are shown in Figure 5a,b, respectively. We plotted, both corundum and hematite 0001 ,   10 1 ¯ 0 ,   11 2 ¯ 0 ,     10 1 ¯ 1 ,   11 2 ¯ 1   and   10 1 ¯ 2 poles.
By comparing Figure 5a,b, it is easily found that the 0001 ,   10 1 ¯ 0 ,   11 2 ¯ 0 ,     10 1 ¯ 1 ,   11 2 ¯ 1   and   10 1 ¯ 2 poles of corundum host overlap with those of hematite exsolutions in group 1 and group 2, respectively. This indicates that the hematite exsolutions of groups 1 and 2 have the same crystallographic orientation with the host. The 0001 ,   10 1 ¯ 0 ,   11 2 ¯ 0   and   11 2 ¯ 1 poles of corundum host overlap with that of hematite exsolutions in group 3, but the 10 1 ¯ 1 and 10 1 ¯ 2 poles of corundum host do not overlap with that of hematite exsolutions in group 3. From the symmetric distribution of poles 10 1 ¯ 1 and 10 1 ¯ 2 , it is shown that group 3 is twinned with group 1 and 2. The twin axis is <0001> and the twin plane is 10 1 ¯ 0 .
After analyzing the pole figures, one piece of representative exsolution (with points 12–13) was selected to be observed by HRTEM.

3.3. HRTEM Results

HRTEM analysis was carried out on a thinned foil. The foil was extracted from the middle part of the exsolution in Figure 2b together with the corundum host. The FIB-cut procedure is shown in Figure 2c,d. The foil was sputtered by platinum.
Figure 7a shows high resolution photograph at the corundum–hematite interface, and the periodic units are labeled with white/symbols. The periodic units are measured from high-resolution photographs using TEM Imaging & Analysis software. Figure 7b,c show SAED patterns. The indexation is performed using DigitalMicrographTM 3.11.1 software. The fringes are marked as 01 1 ¯ 2 and 0 1 ¯ 14 on the patterns, respectively. The lattice distances are marked as d C r n 01 1 ¯ 2 , d H e m 01 1 ¯ 2 , d C r n 0 1 ¯ 14 , d H e m 0 1 ¯ 14 , respectively. The zone axis is calculated as [ 10 1 ¯ 0 ] by 01 1 ¯ 2 × 0 1 ¯ 14 for both of the two phases.
The interface is relatively straight. However, Wang et al. (2002), Gao et al. (2003) and Maheswaran et al. (2005) studied synthetic hematite film on corundum and interfaces in their studies varied a lot, including those that were zigzag-shaped, ledge-shaped, and so on [13,14,17].

4. Discussion

4.1. Formation of Hematite in Corundum

Causes for oriented oxide inclusions in corundum can vary and are complex [18]. Three mechanisms for the origin of oriented oxide inclusions in corundum have been proposed: (1) Primary inclusions trapped during the host crystal growth [18,19]. (2) open system replacement reactions along the cleavages and other defects [20]. (3) closed system exsolution [9,10,12].
Primary inclusions generally present random arrangement. Most of the hematite replacement reaction inclusions in the corundum are generally along the cleavages and other defects. In this paper, all the hematites have the same CORs with the corundum host, and the contact interface between the hematite and corundum is regular. Thus, the hematites are neither primary inclusions nor formed by replacement reaction. They should be formed by exsolutions.
Before the exsolution, the isomorphic substitutes of Fe3+ in hematite to Al3+ in the corundum crystal structure must occur. The ionic radius of Fe3+ (0.064 nm) is bigger than that of Al3+(0.051 nm). Therefore, the isomorphic substitution of Fe3+ to Al3+ needs high pressure [21]. Our sample is from Cenozioc basalt originally from the mantle, which is formed under deep earth. That is, the corundum formed under high pressure. As the pressure decreases, Fe3+ must be instable in the corundum crystal structure and the hematite is exsolved. The content of Fe3+ in corundum must relate to the formation pressure. We estimate that the exsolution hematite in the corundum host is about 1–2%, and there is still some FeO and Fe2O3 in the host after exsolution (see Table 1). If we can find a geobarometer of Fe3+ content in corundum, the formation pressure and the exsolution pressure should be determined. Unfortunately, we cannot find this geobarometer now and will do more in the future.

4.2. Hematite-Corundum Interface Characters

The {0001} interface of corundum and hematite is partly coherent, i.e., shows coherency periodically. According to the coherency positions, the interface domain presents periodic units as shown in Figure 7a. At the two ends of one unit, the corundum–hematite interface is coherent. As measured in Figure 7a, the units are with specific lengths within 6.71–6.72 nm. Also based on the measurements in Figure 7a, d C r n 01 1 ¯ 2 = 0.3481 nm, d H e m 01 1 ¯ 2 = 0.3664 nm, d C r n 0 1 ¯ 14 = 0.2552 nm and d H e m 0 1 ¯ 14 = 0.2681 nm, respectively.
The angles between 01 1 ¯ 2 Crn ^ (0001)interface and 01 1 ¯ 2 Hem ^ (0001)interface are 61.6° and 60.83°, respectively, marked in Figure 8. The projection lengths at (0001)interface can be calculated by d C r n 01 1 ¯ 2 /sin61.6° [marked as D C r n 01 1 ¯ 2 p r o j e c t i o n ] and dHem ( 01 1 ¯ 2 ) /sin60.83° [marked as D H e m 01 1 ¯ 2 p r o j e c t i o n ], respectively. We discover a regularity of that: in one unit, 17 ×   D C r n 01 1 ¯ 2 p r o j e c t i o n =~6.72 nm (1), 16 ×   D C r n 01 1 ¯ 2 p r o j e c t i o n = ~6.71 nm (2), these two results are extremely close. So, the regularity can be expressed as (n + 1) D C r n 01 1 ¯ 2 p r o j e c t i o n   = n D H e m 01 1 ¯ 2 p r o j e c t i o n (n = 16) (3). In Figure 8, we sketch a diagram of 17- D C r n 01 1 ¯ 2 p r o j e c t i o n and 16- D H e m 01 1 ¯ 2 p r o j e c t i o n unit at (0001) interface.
We are interested whether the data is consistent with the measurement data at the interface. The calculation data by 17- D C r n 01 1 ¯ 2 p r o j e c t i o n or 16- D H e m 01 1 ¯ 2 p r o j e c t i o n (~6.71–6.72 nm) is in good agreement with the practical unit lengths (~6.71–6.72 nm) and the difference value is within ±0.01 nm. This discovery implies that the periodic coherency of corundum and hematite is accommodated mainly by a practical slight mismatch at the interface.
Based on the synthetic hematite–corundum interface characters reported by Wang et al. (2002) and Maheswaran et al. (2005), the interface presents disordered incoherency [13,14]. There is a possibility that the periodicity in Figure 7a might have slowly modulated during the exsolution.
To verify the interface modulation, Chen et al. (2018) observed the MgAl2O4/Al2O3 interfaces at early to late stages over a couple of hours. Indeed, the phases glided at the interface from early to late stages [22]. The exsolutions we studied endured many more years than synthesisthe synthesis process, and the periodic coherency might modulate spontaneously and slowly to accommodate the mismatch and achieve the maximum coherency between two minerals.
In addition, in the middle part of the units, the interface presents a complicate twist in Figure 7a. This character might be formed by multi-dimension mismatches; otherwise, it might be caused by the inclined perspective angle or the thickness of the sample.
To sum up, at the interface, the hematite-corundum phases tend to modulate to achieve the maximum coherency in the geological process. Limited to the existence of the lattice mismatch, the periodicity would be the ultimate state to acquire their interface consistency.

5. Conclusions

In this work, we present EBSD and HRTEM analyses for the hematite exsolutions and corundum host in combination with EPMA, XRD and FIB. Crystallographic orientation relationships and the interface characteristics between them were discussed. The main conclusions are as follows.
The CORs and the regular interface between the exsolution and host confirm that the hematites were exsolved from the corundum. The exsolution was formed under depressurzation based on the crystal chemistry theory. Two groups of the exsolutions have the same orientation with the host and the other group is twinned to those two groups. Periodic coherency units distribute orderly between the two phases at (0001) interface; the measured unit lengths are 6.71–6.72 nm, which are in good agreement with every 17- D C r n 01 1 ¯ 2 p r o j e c t i o n or 16- D H e m 01 1 ¯ 2 p r o j e c t i o n . The periodic coherency at the interface is accommodated mainly by slight mismatch. The possibility is that at the interface, the hematite-corundum phases tend to modulate to achieve the maximum coherency in the geological process during exsolution.

Author Contributions

Q.Z. and C.X. performed sample preparation and data collection with the help with S.Z. on EBSD, EPMA, and HRTEM analyses; Q.Z. wrote the manuscript together with S.Z. and C.X.; C.X. and S.Z. contributed to the supervisor and interpretation of the data and S.Z. revised the manuscript. All authors have read and agreed to the published version of the manuscript.

Funding

This research was funded by the National Natural Science Foundation of China (grant number 41872037 and 41802042) and the University-enterprise Cooperation Project (KH156030).

Institutional Review Board Statement

Not applicable.

Informed Consent Statement

Not applicable.

Data Availability Statement

Not applicable.

Acknowledgments

We sincerely acknowledge Xiangwen Liu with the HRTEM data analyses. Fabin Pan for the help with the EPMA test, Yao Han and Xinqiu Guo with the FIB and HRTEM test in SJTU. We thank the anonymous reviewers for their constructive comments.

Conflicts of Interest

The authors declare no conflict of interest.

References

  1. Shau, Y.; Yang, H.; Peacor, D.R. On oriented titanite and rutile inclusions in sagenitic biotite. Am. Mineral. 1991, 76, 1205–1217. [Google Scholar]
  2. Yui, T.; Shen, P.; Liu, H. Titanite inclusions in altered biotite from granitoids of Taiwan: Microstructures and origins. J. Asian Earth Sci. 2001, 19, 165–175. [Google Scholar] [CrossRef]
  3. Schmetzer, K.; Steinbach, M.P.; Gilg, H.A.; Blake, A.R. Dual-color double stars in ruby, sapphire, and quartz: Cause and historical account. Gems Gemol. 2015, 51, 112–143. [Google Scholar] [CrossRef]
  4. Xu, C.; Zhao, S.; Zhou, J. Crystallographic orientation of ilmenite inclusions in amphibole-an electron backscatter diffraction study. J. Appl. Crystallogr. 2020, 235, 105–116. [Google Scholar] [CrossRef]
  5. Hwang, S.; Yui, T.; Chu, H.; Shen, P.; Zhang, R.; Liou, J.G. An AEM study of garnet clinopyroxenite from the Sulu ultrahigh-pressure terrane: Formation mechanisms of oriented ilmenite, spinel, magnetite, amphibole and garnet inclusions in clinopyroxene. Contrib. Mineral. Petr. 2011, 161, 901–920. [Google Scholar] [CrossRef]
  6. Ageeva, O.; Habler, G.; Pertsev, A.; Abart, R. Fe-Ti oxide micro-inclusions in clinopyroxene of oceanic gabbro: Phase content, orientation relations and petrogenetic implication. Lithos 2017, 290, 104–115. [Google Scholar] [CrossRef]
  7. Hwang, S.; Shen, P.; Yui, T.; Chu, H. On the coherency-controlled growth habit of precipitates in minerals. J. Appl. Crystallogr. 2010, 43, 417–428. [Google Scholar] [CrossRef]
  8. Simonet, C.; Fritsch, E.; Lasnier, B. A classification of gem corundum deposits aimed towards gem exploration. Ore Geol. Rev. 2008, 34, 127–133. [Google Scholar] [CrossRef]
  9. Moon, A.R.; Phillips, M.R. An electron microscopy study of exsolved phases in natural black Australian sapphire. Micron Microsc. Acta 1984, 15, 143–146. [Google Scholar] [CrossRef]
  10. Saminpanya, S. Ti-Fe mineral inclusions in star sapphires from Thailand. Aust. Gemmol. 2001, 21, 125–128. [Google Scholar]
  11. He, J.; Lagerlof, K.P.D.; Heuer, A.H. Structural Evolution of TiO2 Precipitates in Ti-Doped Sapphire (α-Al2O3). J. Am. Ceram. Soc. 2011, 94, 1272–1280. [Google Scholar] [CrossRef]
  12. Bui, T.N.; Deliousi, K.; Malik, T.K.; De Corte, K. From exsolution to ‘gold sheen’: A new variety of corundum. J. Gemmol. 2015, 8, 678–691. [Google Scholar] [CrossRef]
  13. Wang, C.M.; Thevuthasan, S.; Gao, F.; McCready, D.E.; Chambers, S.A. The characteristics of interface misfit dislocations for epitaxial α-Fe2O3 on α-Al2O3 (0001). Thin Solid Films 2002, 414, 31–38. [Google Scholar] [CrossRef]
  14. Maheswaran, S.; Thevuthasan, S.; Gao, F.; Shutthanandan, V.; Wang, C.M.; Smith, R.J. Misfit dislocations at the single-crystal Fe2O3/Al2O3 interface. Phys. Rev. B Condens. Matter Mater. Phys. 2005, 72, 075403. [Google Scholar] [CrossRef]
  15. Sun, P.; Niu, Y.; Guo, P.; Ye, L.; Liu, J.; Feng, Y. Elemental and Sr–Nd–Pb isotope geochemistry of the Cenozoic basalts in Southeast China: Insights into their mantle sources and melting processes. Lithos 2017, 272, 16–30. [Google Scholar] [CrossRef] [Green Version]
  16. Guo, P.; Niu, Y.; Sun, P.; Gong, H.; Wang, X. Lithosphere thickness controls continental basalt compositions: An illustration using Cenozoic basalts from eastern China. Geology 2020, 48, 128–133. [Google Scholar] [CrossRef] [Green Version]
  17. Gao, F.; Wang, C.M.; Maheswaran, S.; Thevuthasan, S. Atomic-level simulations of misfit dislocation at the interface of Fe2O3/Al2O3 system. Nucl. Instrum. Methods Phys. Res. Sect. B Beam Interact. Mater. At. 2003, 207, 63–71. [Google Scholar] [CrossRef]
  18. Sutherland, F.L. Sapphire, a not so simple gemstone. Am. Mineral. 2017, 102, 1373–1374. [Google Scholar] [CrossRef]
  19. Liu, J.; Cao, S.; Zhou, D.; Li, X.; Wu, Y.; Wang, H.; Li, W. Characteristics and Formation of Corundum within Syenite in the Yushishan Rare Metal Deposits in the Northeastern Tibetan Plateau. Am. Mineral. 2022; in press. [Google Scholar]
  20. Palke, A.C.; Breeding, C.M. The origin of needle-like rutile inclusions in natural gem corundum: A combined EPMA, LA-ICP-MS, and nanoSIMS investigation. Am. Mineral. 2017, 102, 1451–1461. [Google Scholar] [CrossRef]
  21. Zhao, S.; Bian, Q.; Wang, Q. Crystallography and Mineralogy; Higher Education Press: Beijing, China, 2004; pp. 167–176. (In Chinese) [Google Scholar]
  22. Li, C.; Habler, G.; Griffiths, T.; Rečnik, A.; Jeřábek, P.; Götze, L.C.; Mangler, C.; Pennycook, T.J.; Meyer, J.; Abart, R. Structure evolution of h.c.p./c.c.p. metal oxide interfaces in solid-state reactions. Acta Crystallogr. Sect. A Found. Adv. 2018, 74, 466–480. [Google Scholar] [CrossRef] [PubMed] [Green Version]
Figure 1. Geological sketch map of the eastern-China basalt area and its adjacent regions. Red star represents the area where the megacrysts were collected, i.e., Changle county, Shandong, China. Inserted photo on the right top shows the basalt exposures near the crater in this area.
Crystals 12 00905 g001
Figure 2. Optical microscope and SEM-FIB photographs of the exsolutions and the host. (a) Two corundum megacrysts in a Cenozoic basalt rock. (b) Corundum specimen under optical microscope viewed down z-axis. The exsolutions can be observed through the transparent specimen using crossed polarized light (50×). Three groups of exsolutions intersect with ~60°. (c) Scanning electron microscope-Back scattered electrons (SEM-BSE) photograph of the selected exsolution for FIB cut. (d) Scattered electrons photograph of the FIB-milled pit from lift-out perspective. A certain part for the HRTEM observation is shown in the yellow box. It is a cross-section of the middle part of the exsolution in (b). (e) High-angle annular dark field HRTEM photograph of the foil. (f) Microscopic element mapping photograph of the foil. Yellow represents Fe, green represents Al, respectively. The hematite exsolution is arrowed.
Crystals 12 00905 g002
Figure 3. XRD patterns of the specimen.
Crystals 12 00905 g003
Figure 4. SEM-BSE, EDX and EDS results of the exsolutions and the host. Crn represents for corundum, Hem for hematite, the symbols + and numbers (1–17) for the selected test points, respectively. (ae) SEM-BSE photographs of the exsolutions and the host. Points 1–2 in (a), 3–5 in (b), 8–9, 11 in (c), 12–14 in (d) and 16–17 in (e) were tested on the exsolutions, and the others were tested on the corundum host. The inserted patterns in (b,c) are Kikuchi patterns for point 3 on the exsolution and point 10 on the host, respectively. (f) SEM-EDS mapping of the exsolution. Fe and O is dominate in the exsolution. (g) SEM-EDS spectrogram reveals that the exsolutions are mainly composed by Fe. The ordinate represents X-ray relative intensity, the Cu signal is from the copper grid.
Crystals 12 00905 g004
Figure 5. Pole figures of the corundum host and its hematite exsolutions. Upper hemisphere stereographic projections. (a) Pole figures of the corundum host. (b) Pole figures of hematite exsolutions. The pole points of hematite exsolutions are marked as 1, 2, 3 groups to distinguish the groups in three directions. The outline of actual hematite exsolutions is traced in (b) {10 1 ¯ 0} and {11 2 ¯ 0}.
Crystals 12 00905 g005
Figure 6. Outline traced on exsolutions from the SEM-BSE. The orange line triangle is equilateral. The exsolutions are approximately parallel to each side of the triangle.
Crystals 12 00905 g006
Figure 7. High resolution photograph and SAED patterns of the exsolutions and the host.(a) HRTEM photograph of the hematite-corundum interface domain, the lattice distances (dCrn and dHem) of the two phases are measured in the photograph. The angel between 01 1 ¯ 2 and 0 1 ¯ 14 is 84.2°. The period lengths of 6.71–6.72 nm are marked on the photograph, respectively. (b) SAED patterns of the corundum host in reciprocal space. The angle between <R1, R2> = 95.8°, <R2, R3> = 34.2°, <R1, R3> = 61.6°. The indexation of corundum is labeled. (c) SAED patterns of the interface. The patterns are split into two sets, they represent the corundum and hematite, respectively. The indexation of hematite is labeled. The zone axes are [10 1 ¯ 0] for both corundum and hematite.
Crystals 12 00905 g007
Figure 8. Sketch diagram of 17- d C r n 01 1 ¯ 2 /sin61.6° [17- D C r n 01 1 ¯ 2 p r o j e c t i o n ] and 16- d H e m 01 1 ¯ 2 /sin60.83° [16- D H e m 01 1 ¯ 2 p r o j e c t i o n ] forming a unit at the interface.
Crystals 12 00905 g008
Table 1. Major Chemical composition of the host (EPMA).
SiO2V2O3TiO2MnOAl2O3Cr2O3FeO *Total
Core0.010.020098.8601.26100.15
Rim0.020.0100.0298.5201.2999.87
0.020.0100.0298.9901.39100.43
The composition of FeO * means a total of FeO and Fe2O3.
Publisher’s Note: MDPI stays neutral with regard to jurisdictional claims in published maps and institutional affiliations.

