Article

Photocatalytic Degradation of Phenol Red in Water on Nb(x)/TiO2 Nanocomposites

1
Department of Physics, College of Science, King Faisal University, P.O. Box 400, Al-Ahsa 31982, Saudi Arabia
2
Physics Department, Faculty of Science, Assiut University, Assiut 71516, Egypt
*
Authors to whom correspondence should be addressed.
Crystals 2022, 12(7), 911; https://doi.org/10.3390/cryst12070911
Submission received: 10 June 2022 / Revised: 22 June 2022 / Accepted: 23 June 2022 / Published: 26 June 2022
(This article belongs to the Special Issue New Trends in Crystals at Saudi Arabia (Volume II))

Abstract

:
In this paper, the photocatalytic effect of Nb(x)/TiO2 nanocomposites on the degradation of phenol red (PR) was studied. Nb(x)/TiO2 nanocomposites are fabricated by a simple sol-gel route with new experimental conditions. The structural and optical properties were determined using high transmission electron microscopy (HRTEM), X-ray diffraction, Raman spectroscopy, photoluminescence, and UV-vis absorbance spectroscopy. Compared to pure anatase TiO2, the recently fabricated Nb(x)/TiO2 nanocomposite has a shift in the optical band edge to the visible wavelength. Consequently, it has high performance in adsorption capacity and photocatalytic activities. A time of 160 min has been observed to be suitable for mostly degradable 20 mgL−1 of phenol red on Nb(2.0)/TiO2 composite. The kinetic results were in good agreement with the first-order kinetic model at different concentrations. In addition, the results showed that the addition of Nb led to a significant degradation process. The decomposition of phenol red pollutants showed a synergistic effect of the Nb(2.0)/TiO2 nanocomposites on wastewater treatment.

1. Introduction

The fast expansion of the world population and the flagrant unregulated industrial growth has led to the release of toxic agents and industrial waste into the air and water, resulting in pollution-related diseases and global warming. One of the problems facing the world today is water shortage, which necessitates the treatment of wastewater with industrial organic pollutants. Wide semiconductor photocatalysts are very promising to treat wastewater via the advanced oxidation process (AOP).
Semiconductor photocatalysts, such as anatase TiO2, have played an important role in providing the solution due to their important optical and electronic properties that make them an excellent candidates in different applications such as solar fuel production, CO2 reduction, pollution degradation, and hydrogen production [1,2,3,4,5]. Despite the large number of studies on TiO2, there remains a big challenge related to its wide band gap that forbids the absorbance of light in the visible range and consequently reduces its photocatalytic efficiency. Different studies have reported the usage of metal/transition metal (Cu, Ag, Au, Cu, Ni, Pd, Fe, Zn) to reduce the band gap of anatase TiO2 following different ways of synthesis, e.g., sol-gel method, sputtering, deposition, impregnation, etc. [6,7,8,9,10,11,12]. The ions and atoms can enter the structure of TiO2 structure creating trapping sites and consequently extending a charge-carrier recombination lifetime that led to improving the efficiency of photocatalytic activity [13,14,15].
Niobium-doped TiO2 has drawn much attention due to its high photocatalytic activity in the degradation of pollutants and dyes, and solar photocatalysts [10,16,17]. Doping anatase TiO2 with Nb has been widely used to narrow its band gap, change its phase, and introduce more electrons in the conduction. Niobium ion (Nb+5) is pentavalent and has a radius close to that of titanium [17,18,19]. These properties make Nb an excellent and promising candidate to be used with anatase TiO2. Different methods were used to fabricate Nb/TiO2 to improve their photocatalytic activity by shifting its absorbance wavelength towards the visible range. Despite each method providing different order of magnitude of shifting, the shift is still not well significant and needs to be improved. The main issue is related to the large size obtained of Nb/TiO2 and the formation of Nb-O clusters that increase the charge-carrier recombination rate [20,21].
In this context, the novelty of this work consists of different parts: (1) using a simple sol-gel method of synthesis to fabricate nanocomposites of Nb(x)/TiO2 by using very fine anatase TiO2 nanoparticles with an average size of 5 nm, (2) the fast kinetic rate of pollutants due to the effect of Nb to a high concentration of phenol red of 20 mgL−1 on 5.0 mg of the photocatalysts. We fabricate new Nb(x)/TiO2 (x = 0.0, 0.2, 0.5, 2%) nanocomposites by a simple sol-gel method with different molar fractions of niobium. Structural studies are performed using HRTEM, XRD, and Raman spectroscopy. Optical properties have been investigated by a UV–vis photo-spectrometer. Photocatalytic activities of the samples are tested by performing a photodegradation study of phenol red under UV-vis irradiation light.

2. Materials and Methods

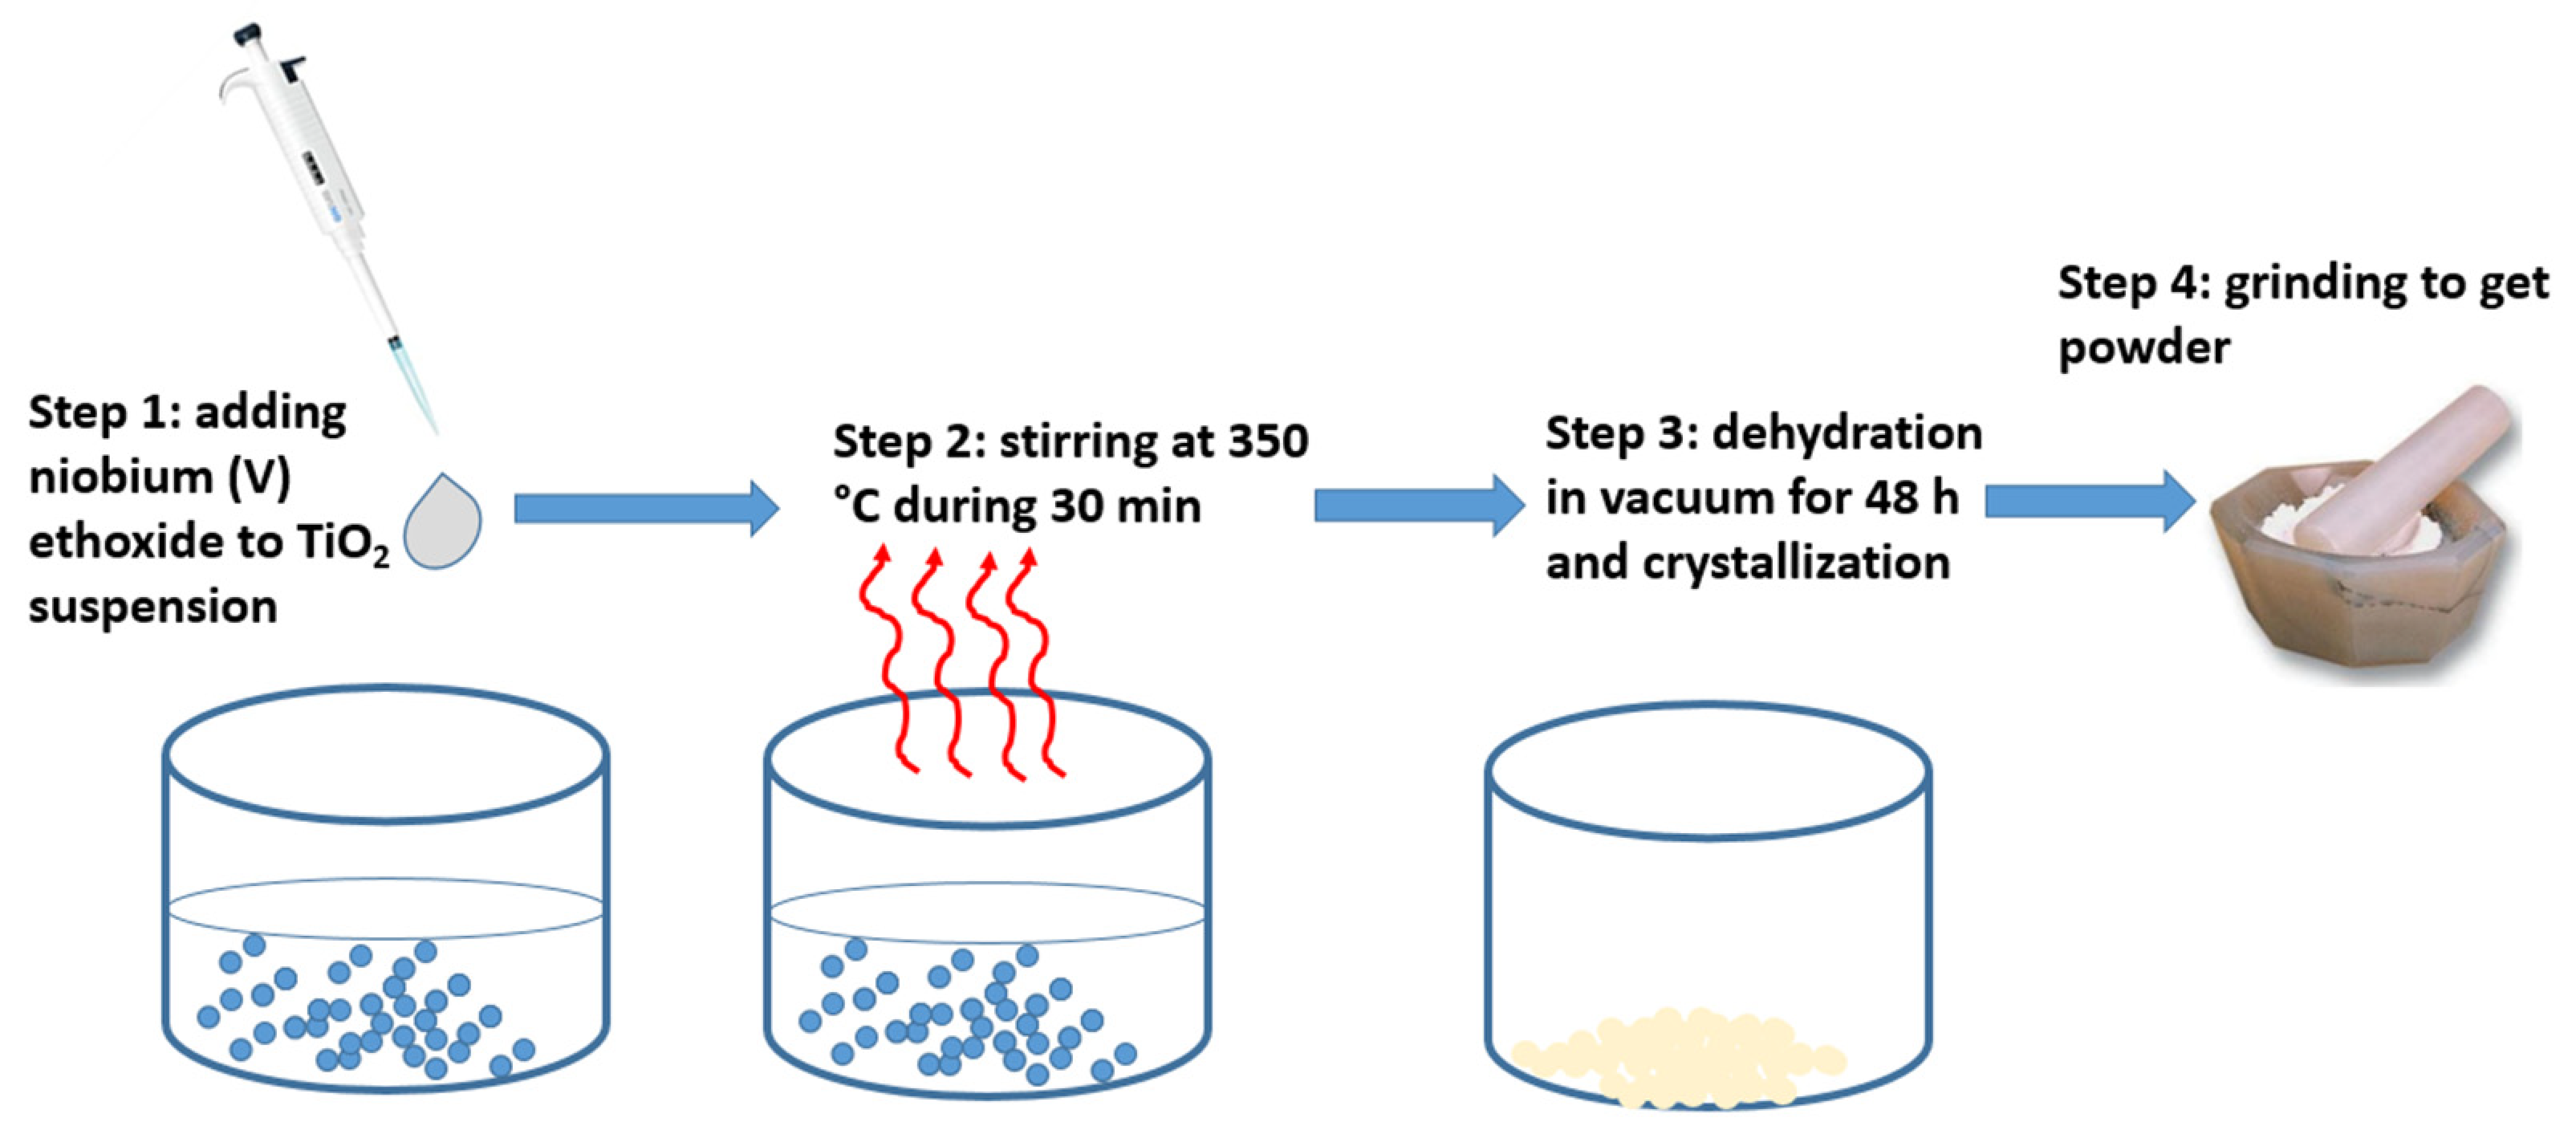
2.1. Materials Preparation

Commercial anatase TiO2 nanopowders made from nanoparticles with an average diameter of 5 nm were purchased from Skyspring Nanomaterials (product ID: 7930DL, Houston, TX, USA). Niobium (V) ethoxide was purchased from Sigma-Aldrich (CAS number 3236-82-6), Schnelldorf, Germany. As shown in Figure 1, the method of synthesis consists of four steps: (1) dropping different volumes of niobium ethoxide in a suspension of TiO2 nanopowders with a different molar ratio of Nb(x)/TiO2 (x = 0.0, 0.2, 0.5, 2%), (2) stirring the solution at 350 °C during 30 min, (3) dehydrating and crystallization of the gel in a vacuum chamber for 48 h, and (4) grinding with a mortar to obtain fine powders of Nb(x)/TiO2.

2.2. Experimental Methods

For the high transmission electronic microscopy (HRTEM) measurement, the sample was sonicated for 10 min, and then 5 μL of the dispersed solution was dried on a carbon-coated copper grid. The equipment (JEOL, JEM-2100F, Tokyo, Japan) works with 200 kV was used for HRTEM. The crystal structure of the prepared samples was investigated by an X-ray diffractometer (Philips Type PW 1710, Amsterdam, The Netherlands) with CuKα radiation. XRD patterns were recorded in a range of 10°–90° with a scanning rate of 2°/min. Raman measurements were conducted using a confocal Raman microscope (LabRAM HR800) connected to a multichannel charge-coupled detector (CCD). A red laser (He-Ne) with a wavelength of 632.8 nm and 2 mW output power was used as a source of excitation. We measured the Raman spectra at ambient temperature in a backscattering configuration with a spectral resolution of 0.3 cm−1.
For the photocatalysis analysis, a solution of Phenol red of 20 mg/L was prepared in advance. Then, 5.0 mg of photocatalyst was added to 50 mL of PR solution. Hitachi UV-3600 spectrophotometers with scanning rates of 5.0 nm/s were used to record UV–Vis absorbance spectra of phenol red. The same system was used to measure the absorbance spectra of photocatalysts in suspension. A high-intensity discharge 400 W iron-doped metal halide UV bulb with light in the spectral region 315–400 nm (UV 400 HL230 Fe Clear-A, UV Light Technology Limited) was used for the irradiation. A Pyrex reactor was irradiated with an intensity of 100 mW/cm2. The deterioration of phenol red was concluded by measuring the variation of the absorbance intensity of the main absorbance peak at a wavelength of 450 nm.

3. Results and Discussion

3.1. Structure Analysis of TiO2/xNb Nanocomposites

TEM images show the distribution of very fine nanoparticles with an average size of 5 nm anatase TiO2 (see Figure 2a). HRTEM confirms the crystallinity of the nanoparticles at approximately 5 nm with different crystal orientations, see Figure 2b. In addition, Figure 2c shows the interplanar distance of 0.33 nm for the (101) plane in TiO2. The selected area electron diffraction (SAED) pattern clearly shows the rings corresponding to (101), (004), (200), (211), and (204) planes, as shown in Figure 2d.
XRD patterns were measured to show the structure and phase composition of Nb(x)/TiO2 nanocomposites, as shown in Figure 3. We can observe clearly in Figure 3a the XRD patterns attributed to pure TiO2 and Nb(x)/TiO2 nanocomposites with different concentrations of niobium. The XRD patterns show different diffraction peaks at 2θ angles 25.3, 37.9, 48.05, 53.9, 55.06, 62.4, 68.76, 70.3, and 75.06 assigned to the crystal planes of the anatase phase TiO2 ((101), (004), (200), (105), (211), (204), (116), (220), (215)), as reported in JCPDS card no. 21-1272. We can observe clear sharp peaks with no impurity peaks, confirming the purity of the anatase phase of TiO2. On the other hand, a peak at 2θ angle 55.96 is observed in the samples Nb(2.0)/TiO2. This peak belongs to the crystal plane of niobium oxide (102), as reported in JCPDS card No. 30-0873 [22]. We can observe a slight shift in the crystal plane (101) of the anatase phase with increasing Nb concentration, as it is known that XRD is very sensitive to the change in the crystallinity and also lattice strain or lattice stress [23,24,25]. It can be observed that with Nd additives, the diffraction angle was shifted toward a higher value, especially for the 2θ = 25.3, which means that the lattice parameters may shrink. Thus, the d-spacing between the crystalline planes was reduced compared to the respective values of the untreated TiO2 nanostructure. It can be ascribed to compressive stress due to the kinetic growth of Nb(x)/TiO2, which is determined by temperature, pressure, nature, and quantities of atoms involved near the surface [24,25]. Thus, it is mostly dependent on the sintering temperature used for this growth.
Figure 4a shows the Raman spectra of pure Pure TiO2, Nb(0.2)/TiO2, Nb(0.5)/TiO2, and Nb(2.0)/TiO2. We can observe the six basic Raman active modes A 1 g + 2 B 1 g + 3 E g for the anatase phase correspond to 148 (Eg), 196 (Eg), 396 (B1g), 515 (A1g), 519 (B1g), and 638 (Eg) [26,27]. The very low blue shift of the Eg mode 148 cm−1 relative to the bulk mode is due to the effect of the small size on the phonon confinement [28]. Figure 4b shows the fitting of the Eg mode located at 148 cm−1 with a Lorentzian function; it is seen that the shift of the peak is not significant. We plotted the variation of the Raman shift of the Eg mode as a function of the molar fraction of Nb. Figure 4c clearly shows the plot when the molar fraction varies between 0.5 to 2; a very small effect of Nb on the TiO2 vibrational mode can be concluded. This effect may be ascribed to the surface adhesion between the two molecules or surface mismatching. However, this shift can be ignored, where it has a difference in wavenumber of ~0.15 cm−1. Thus, the tendency is not well-considered and can be also ignored.

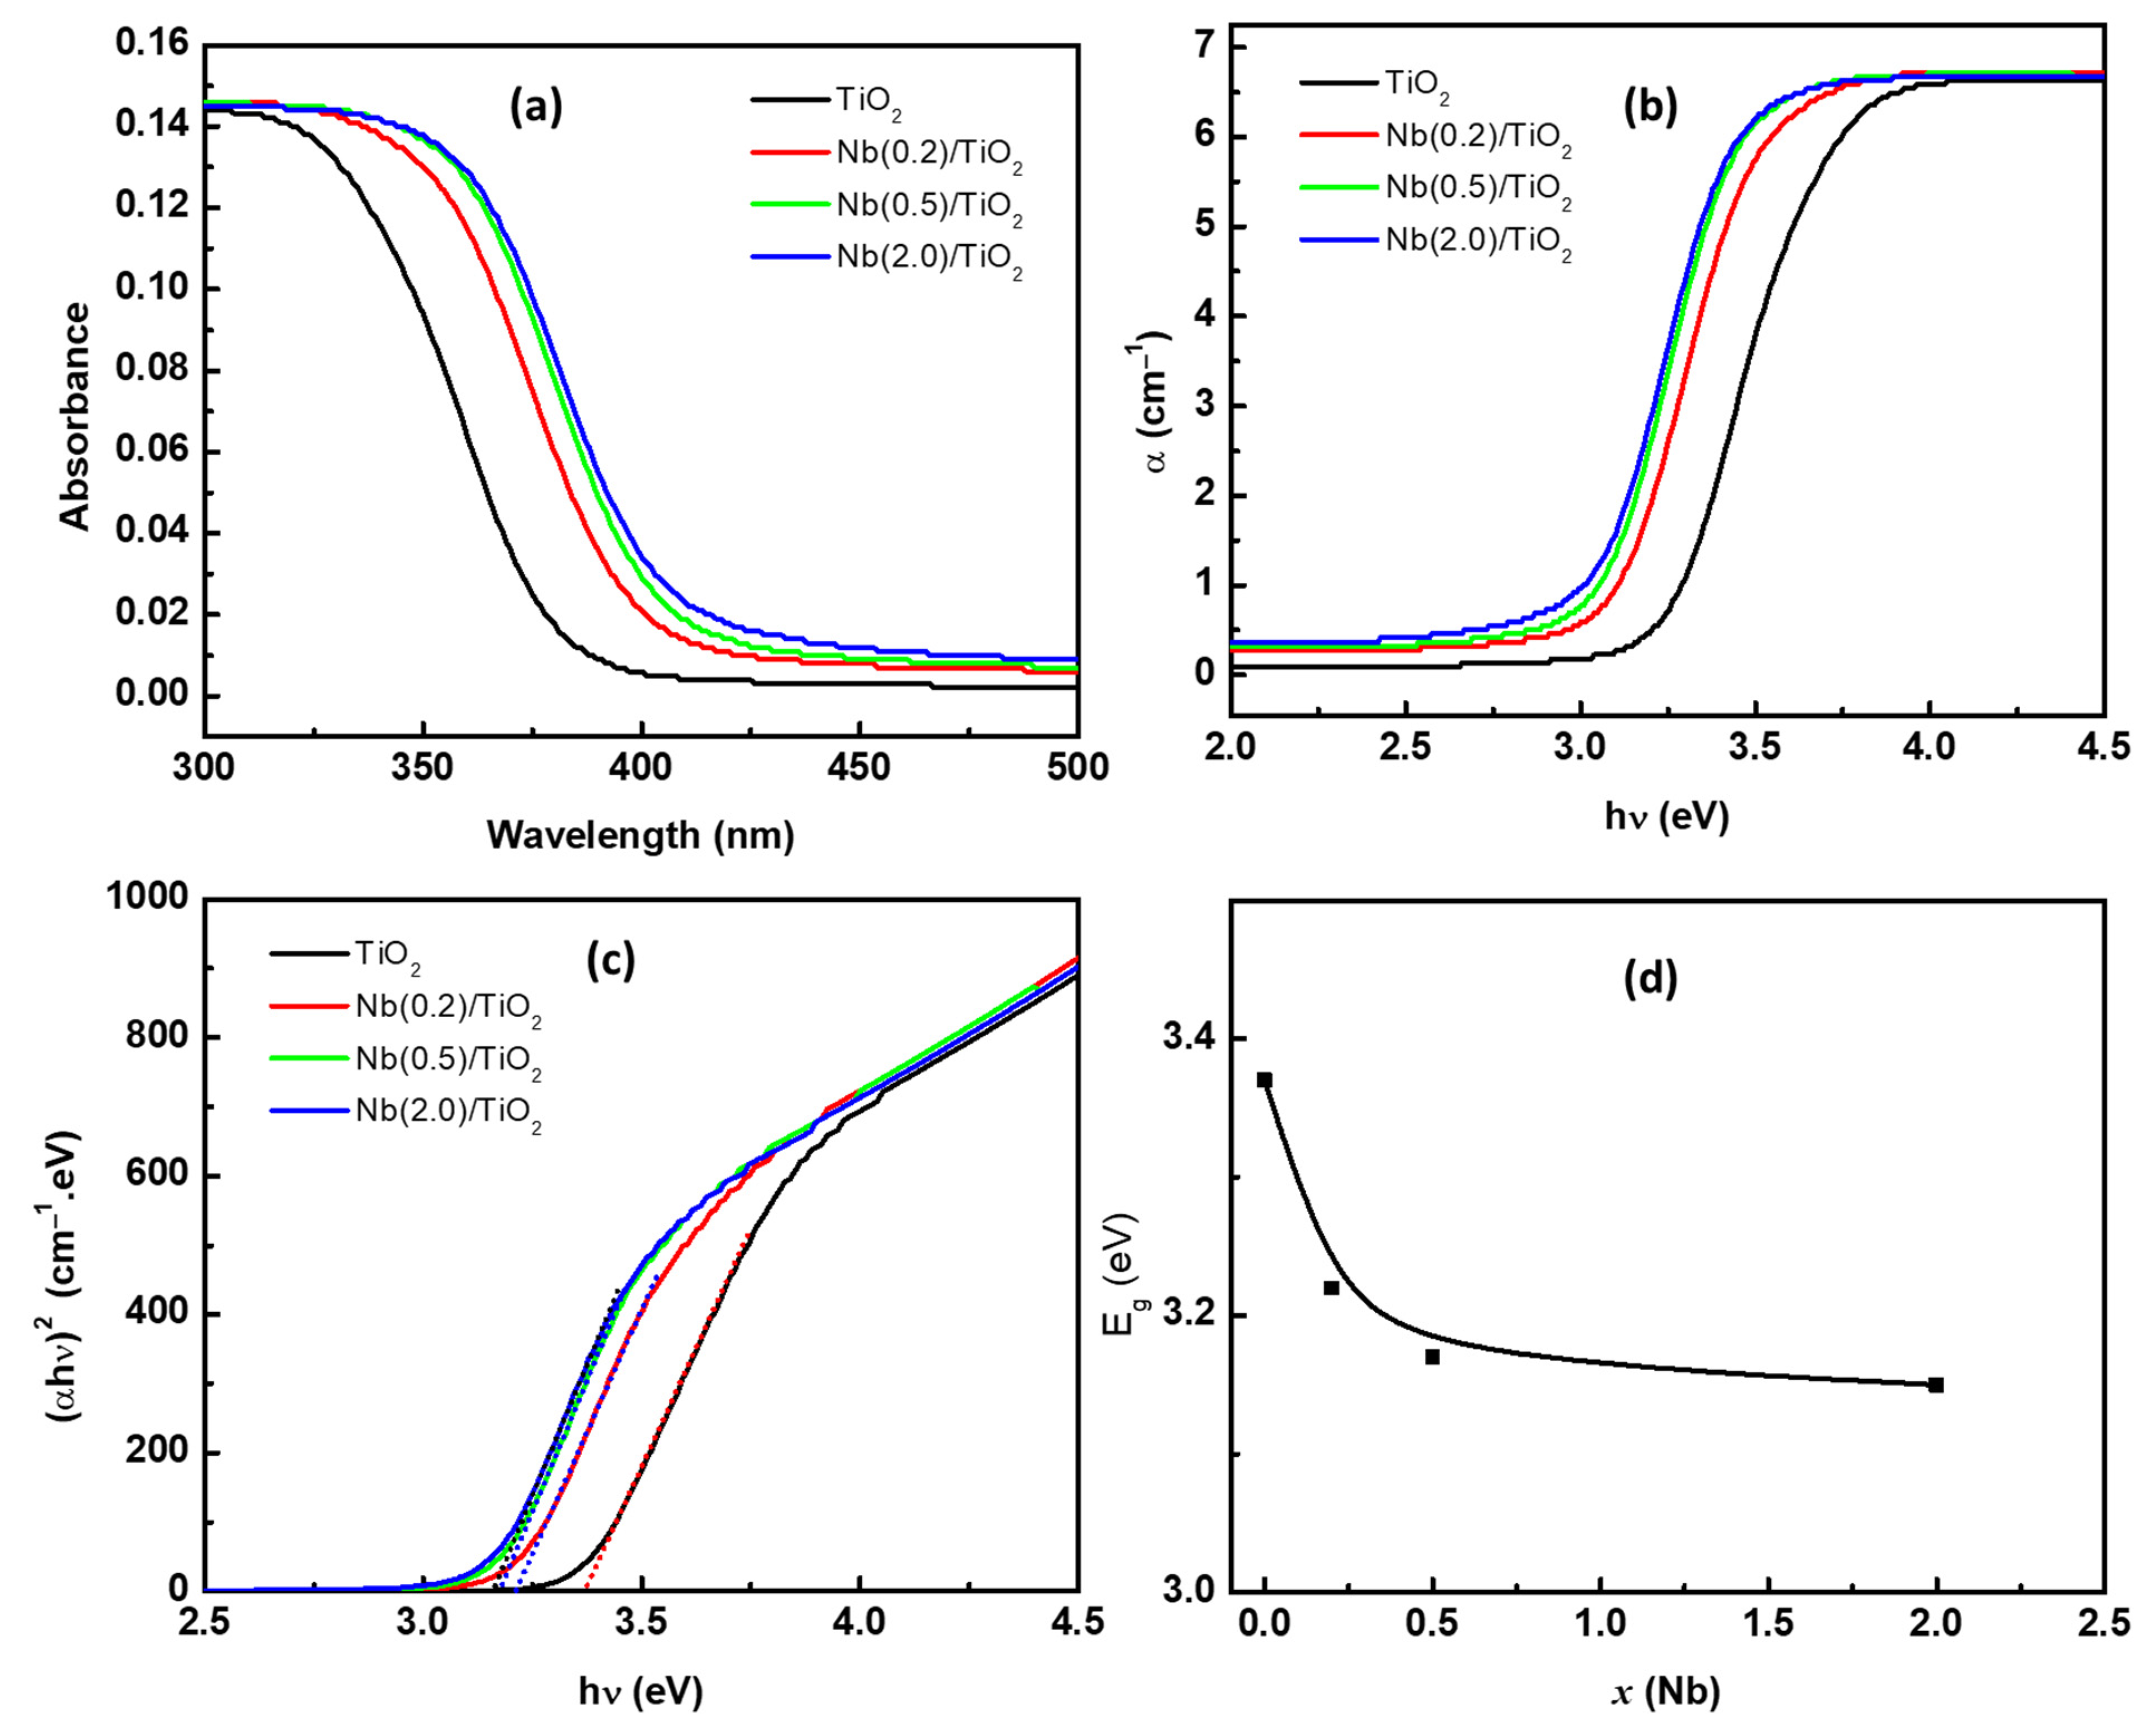
3.2. Optical Band Gap Characterizations

The optical properties of the fabricated nanocomposites are important to understanding the limitations of the excitation energy. The photon energy is absorbed by the electrons in the valence band, and then the electrons jump to the conduction band, leaving the holes behind. The photon energy absorption is determined by the electronic band structure. The light absorption efficiency is indicated by the band gap of the nanocomposite. The measured absorbance (A) and the calculated absorption coefficient (α) for solid Nb(x)/TiO2 nanocomposites are shown in Figure 5a,b. A red shift was observed due to the addition of Nb to the TiO2. However, it shows a band edge with the direct transition. Thus, Equation (1) was used to determine the optical band gap, Eg [29]:
( α h ν ) r = B   ( h ν E g )
B is constant, and r is the transition-type parameter [30]. In the current case, r is equal to 2 for describing the direct allowed transitions. Figure 5c shows the relation between ( α h ν ) 2 and the incident photon energy near the absorption edges. Therefore, the direct allowed transition of functionalized TiO2 is the dominant transition here. From these optical properties, we have calculated the band gap. From this figure, we can observe how the light interacts with the material in the wide range of the incident photons’ wavelength of 3.0–3.75 eV. The optical band gap of photocatalysts seems to be much affected by the concentration of Nb, where the Nb(2.0)/TiO2 sample has the lowest optical band gap around 3.15 eV, which increased by decreasing the Nb concentration, reaching 3.37 eV for pure TiO2 nanoparticles, as shown in the inset of Figure 5d. The red shift in the optical band gap was observed with increasing the Nb concentration in different studies [18]. These results made the fabricated nanocomposites promising in photocatalysis performance.

3.3. Photoluminescence Measurements

The photoluminescence measurements were performed at room temperature using a He-Cd laser (wavelength 442 nm, output laser power 20 mW) as an excitation source, a grating 1800/mm, and an objective with a magnification of 50× to record the PL spectra. The excitation and collection were measured in a backscattering configuration. Figure 6a shows PL spectra of Nb(x)/TiO2 where different emissions are observed at different wavelengths. In the four samples, we observe the same PL emission peaks located at 520 nm, 540 nm, 612 nm, and 660 nm. The peaks emitted at 520 nm, 540 nm, and 612 nm could be due to the deexcitation from lower vibronic levels in the oxygen vacancies of the TiO2 lattice to the ground state [31]. These emissions are mostly a surface phenomenon as a result of the large surface area of the nanoparticles being very sensitive to any change in the surface environment. The large band emitted at 660 nm corresponds to radiative emission between trapped electrons and valence band holes caused by the recombination of photogenerated holes with electrons occupying states below the Fermi level before the laser excitation [15].
Figure 6b shows an Nb-dependent concentration study; we can observe a decrease in the PL intensity of 520 nm with the increase in the Nb entity. Nb(2.0)/TiO2 exhibits a lower intensity and consequently a lower electron-hole recombination rate. The latter confirms its higher photocatalytic activities. However, for the Nb(0.2)/TiO2 and Nb(0.5)/TiO2, the PL intensity is very close, and these correlate well with their measured photocatalytic efficiency.
When a photon is absorbed by a molecule or atom, it gains energy and enters an excited state. One way the molecule or atom relaxes is by emitting a photon, thus losing its energy (radiative recombination). Another method is the loss of energy as translational mode energy via vibrational or transitional electronic processes of collisions with other atoms or molecules. When the emitted photon has less energy than the absorbed photon, this energy difference is called the Stokes shift. By comparing the absorption curve in Figure 5a and the emission curve in Figure 6, we find that the values of the Stokes shift are 1.5 to 1.2 eV when Nb(x) changed from 0.0 to 2.0%. There is a large red shift due to the vibrational relaxation of the initially excited states to the lowest states of the first electronic excited state.

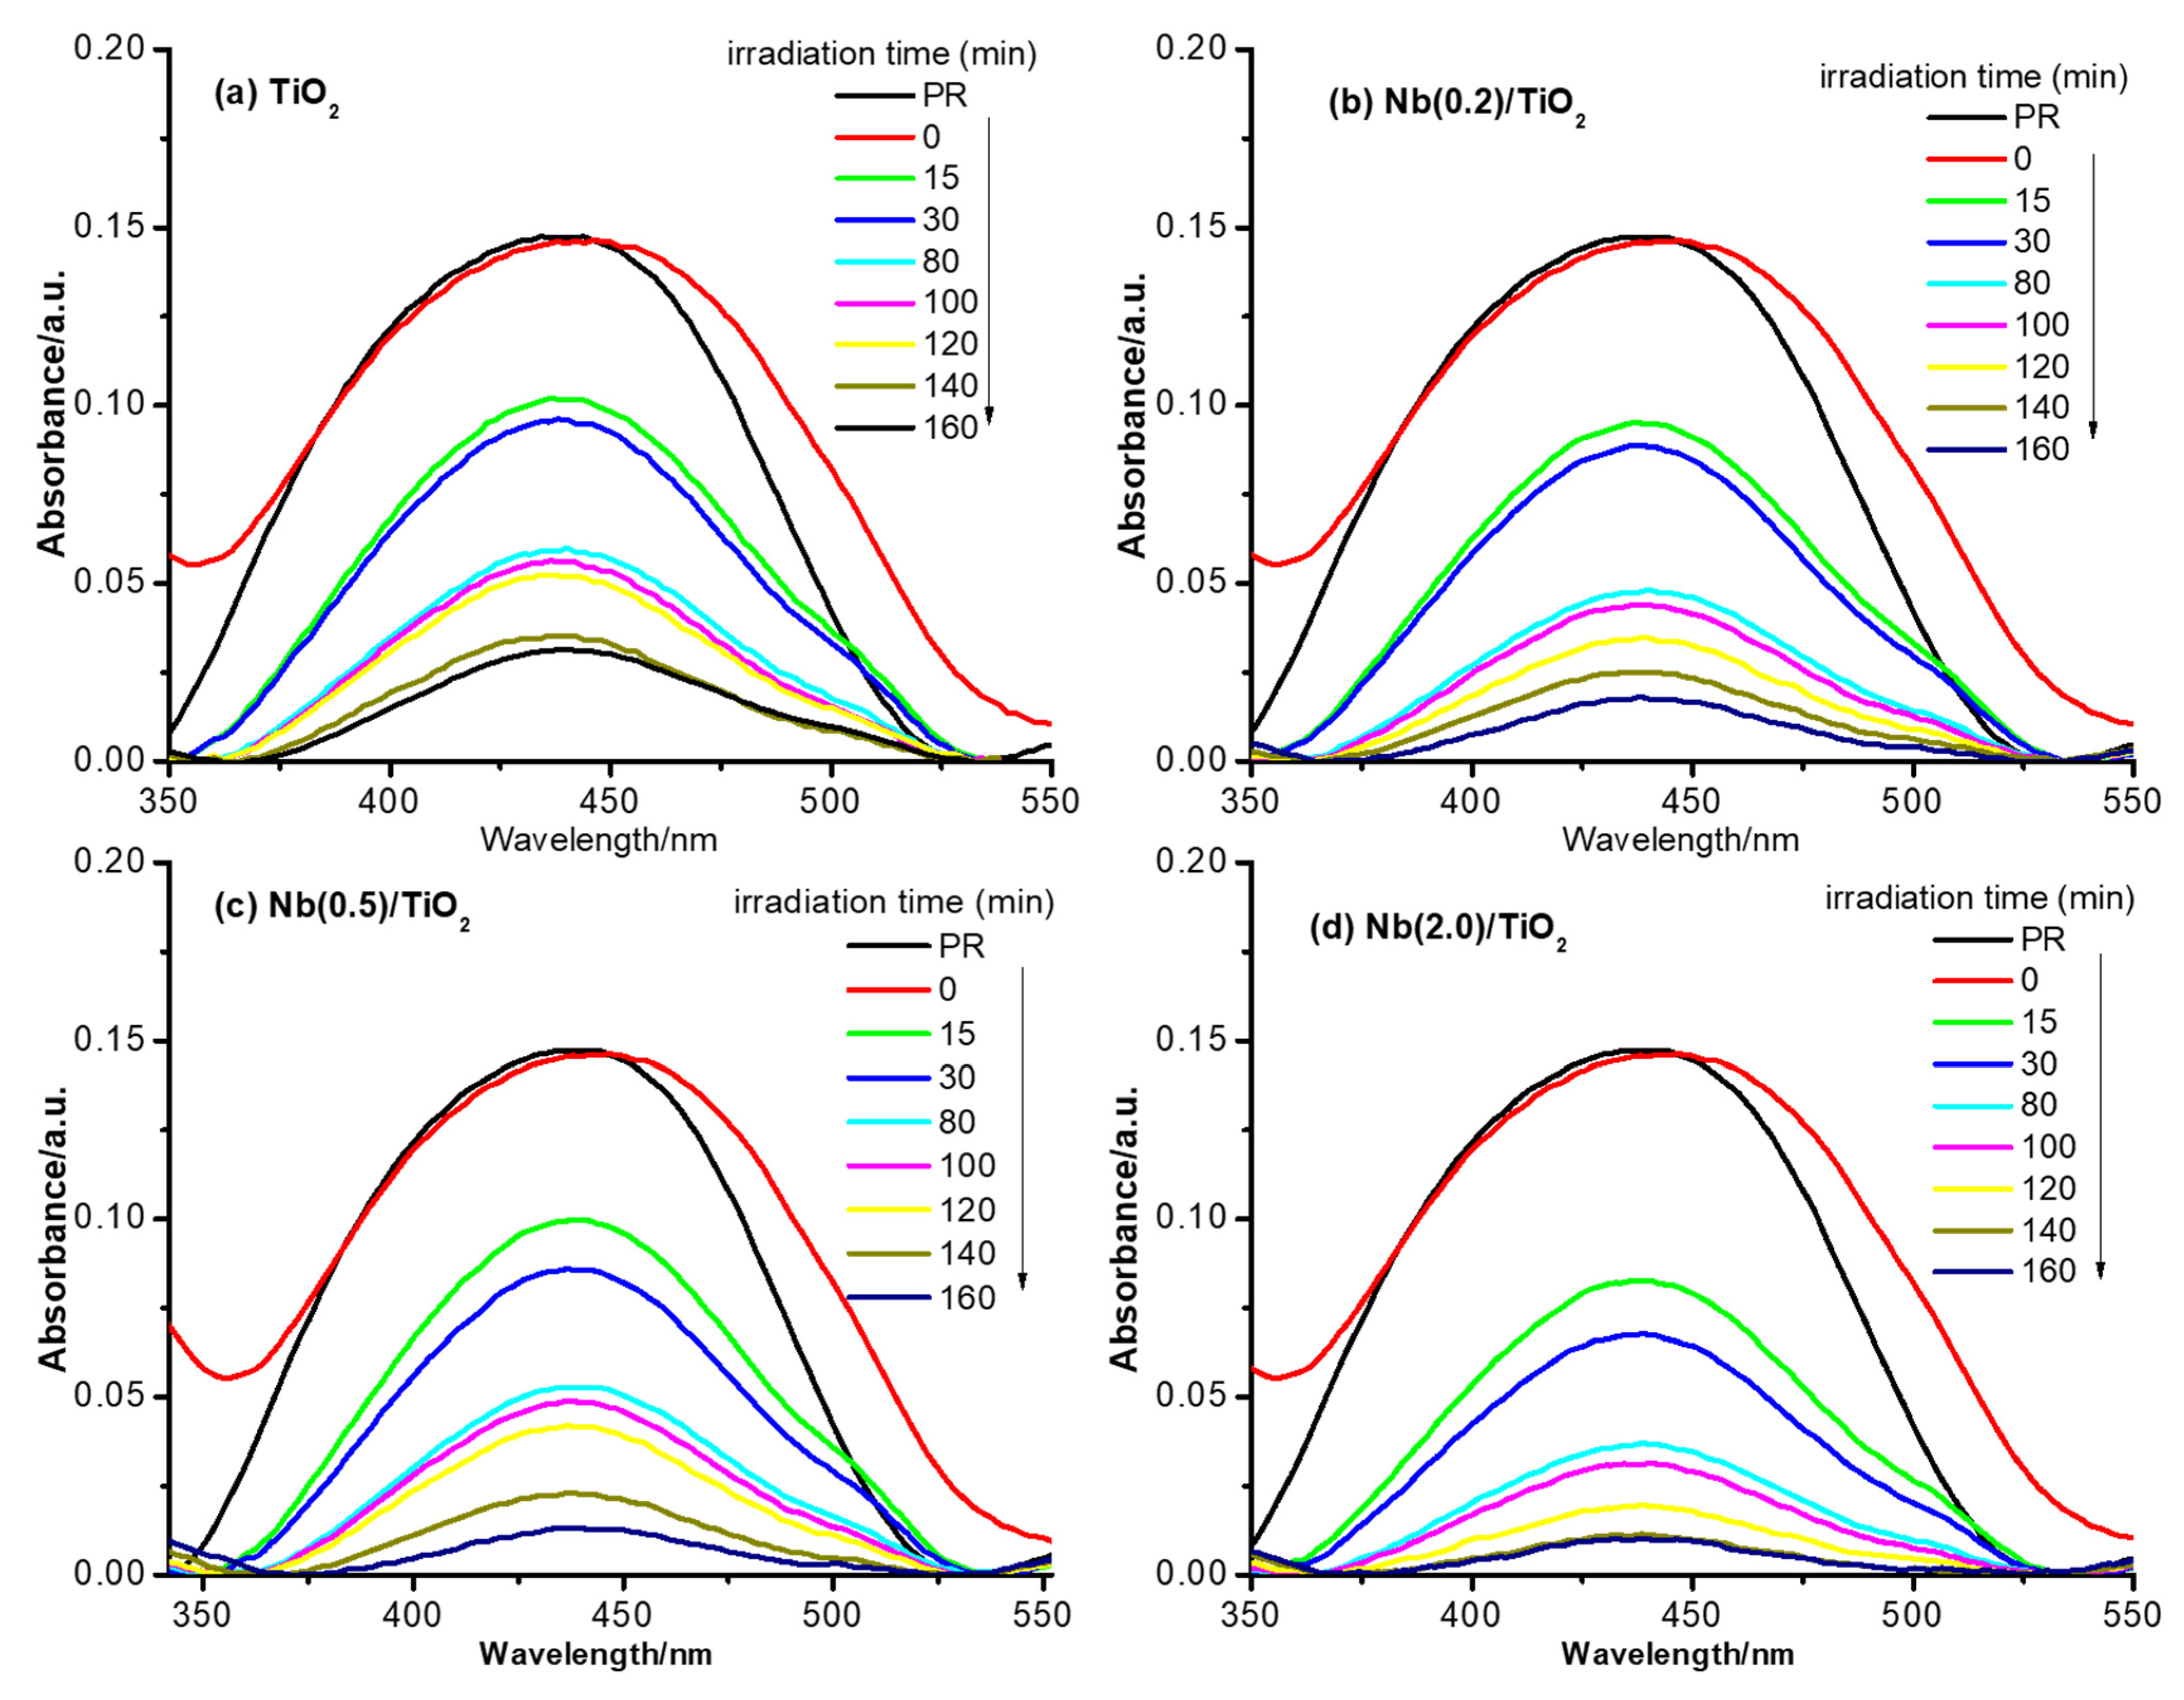
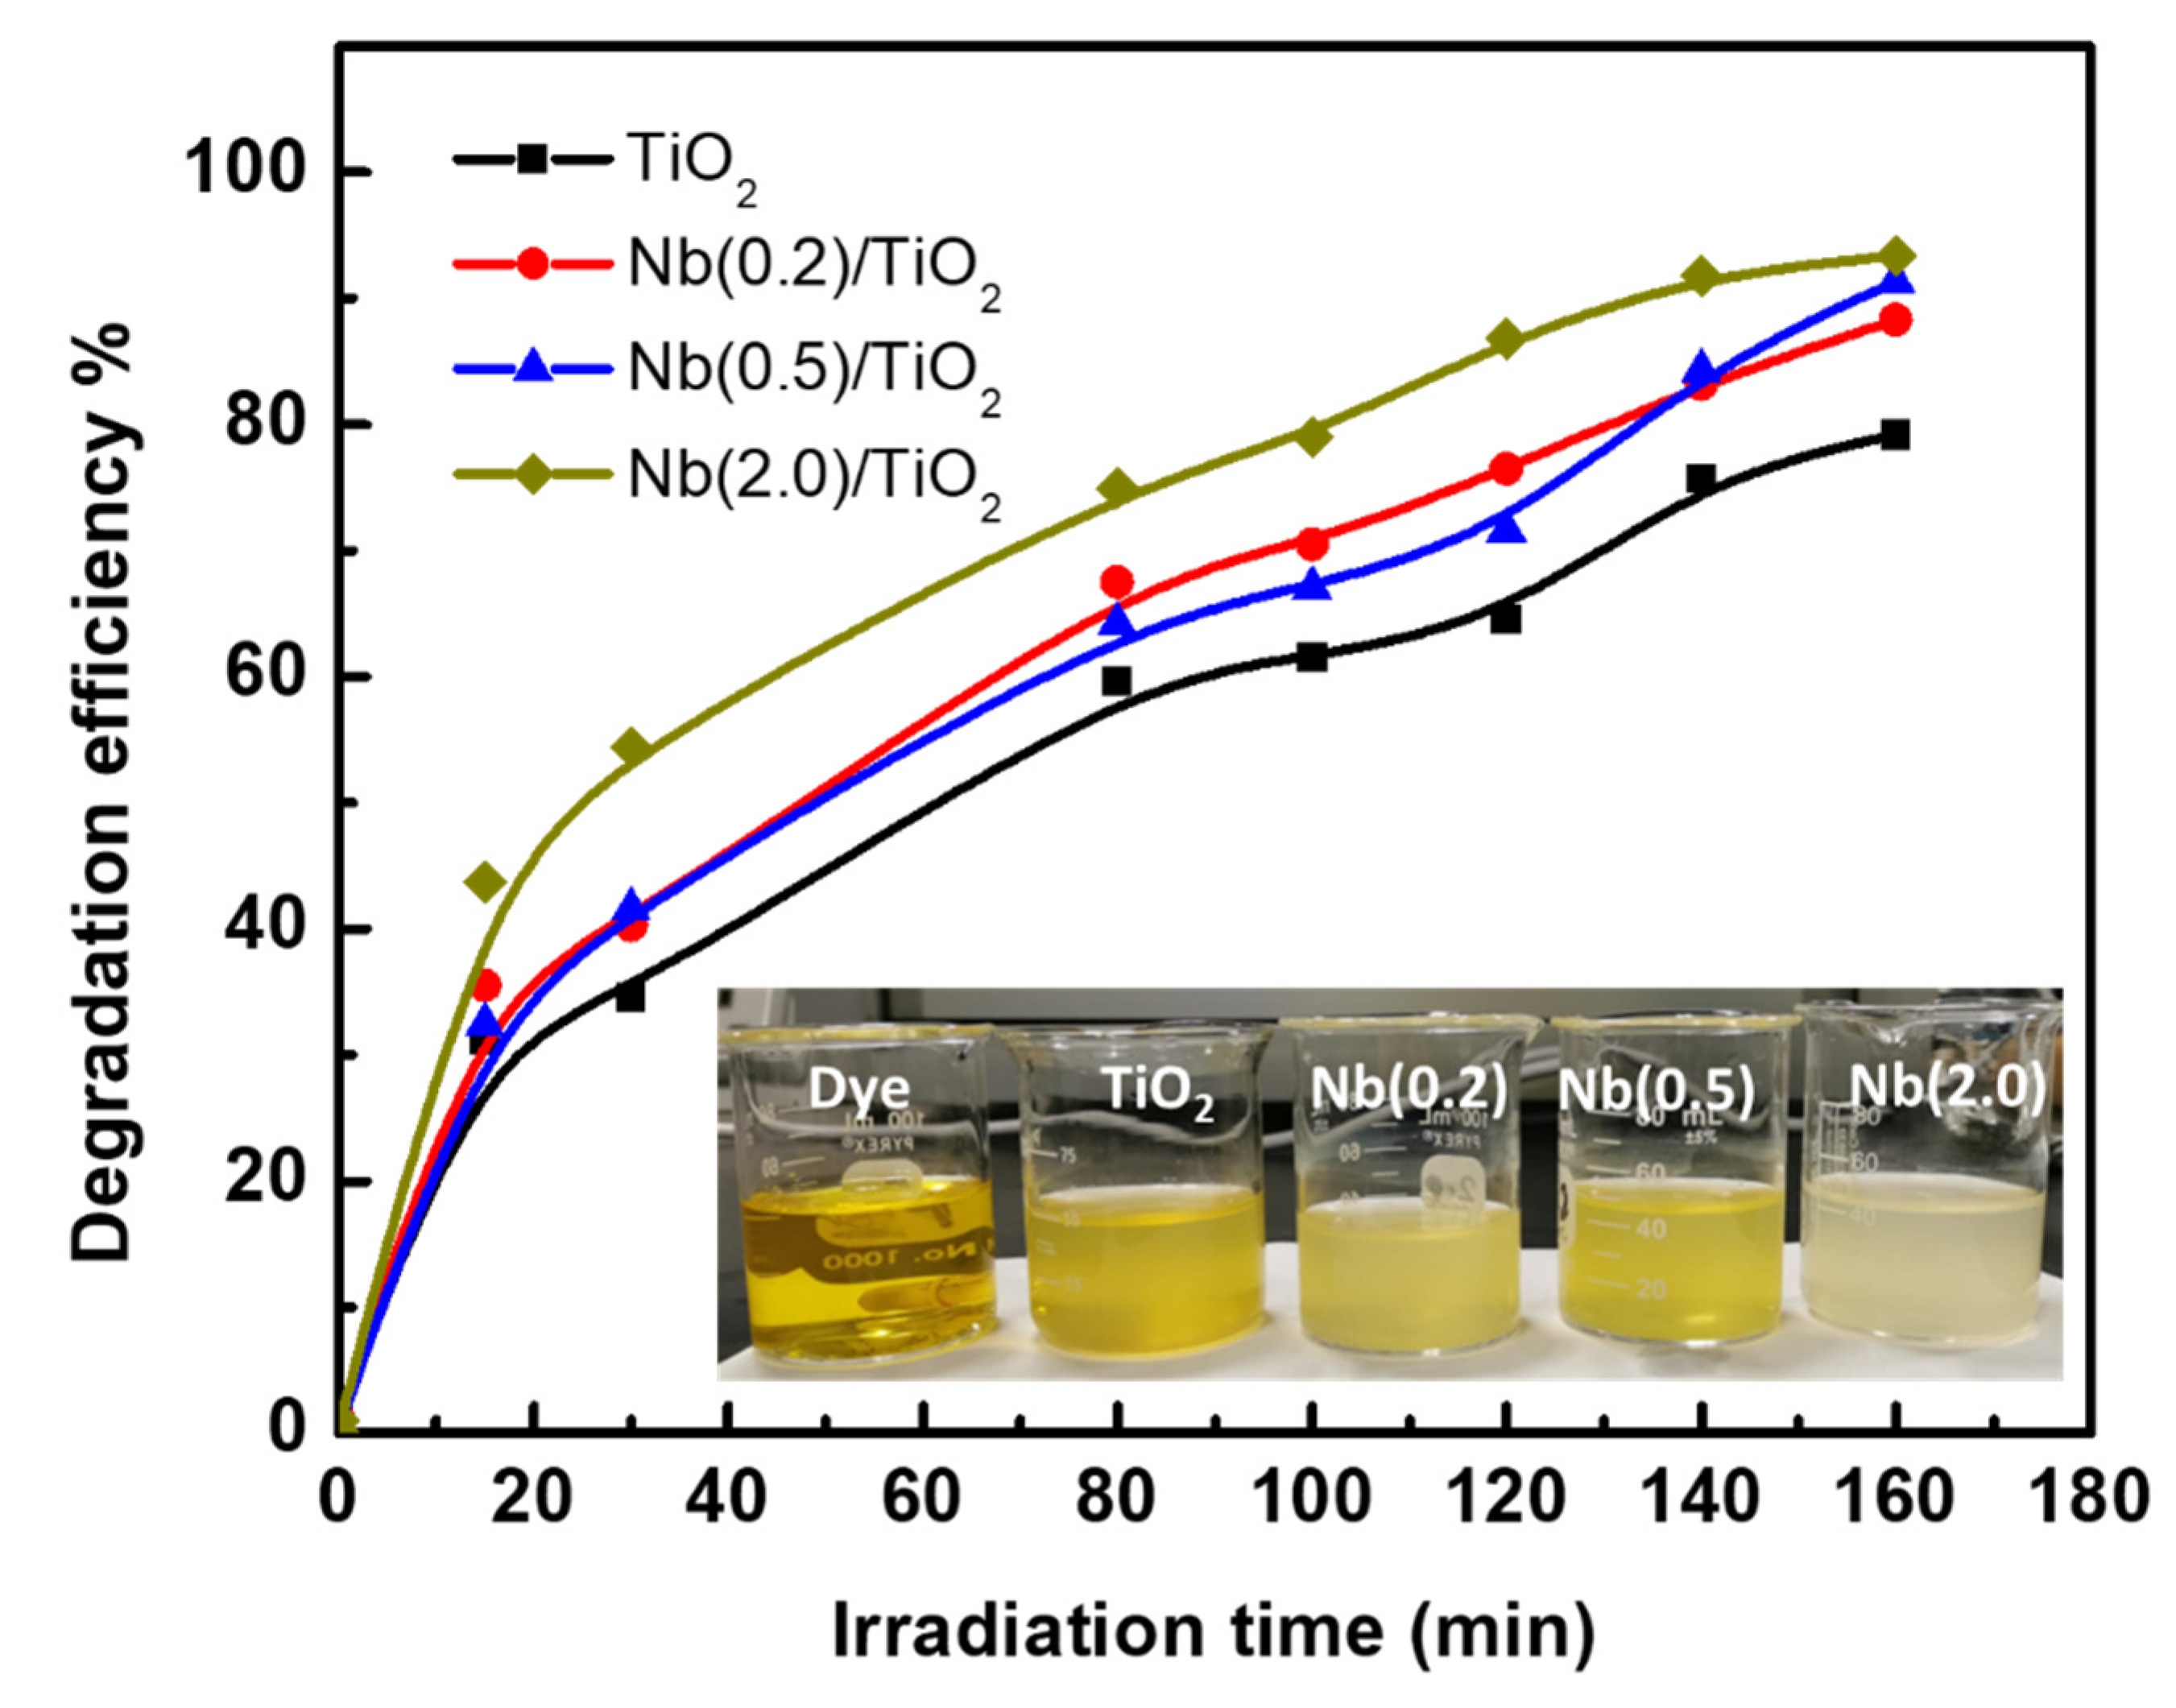
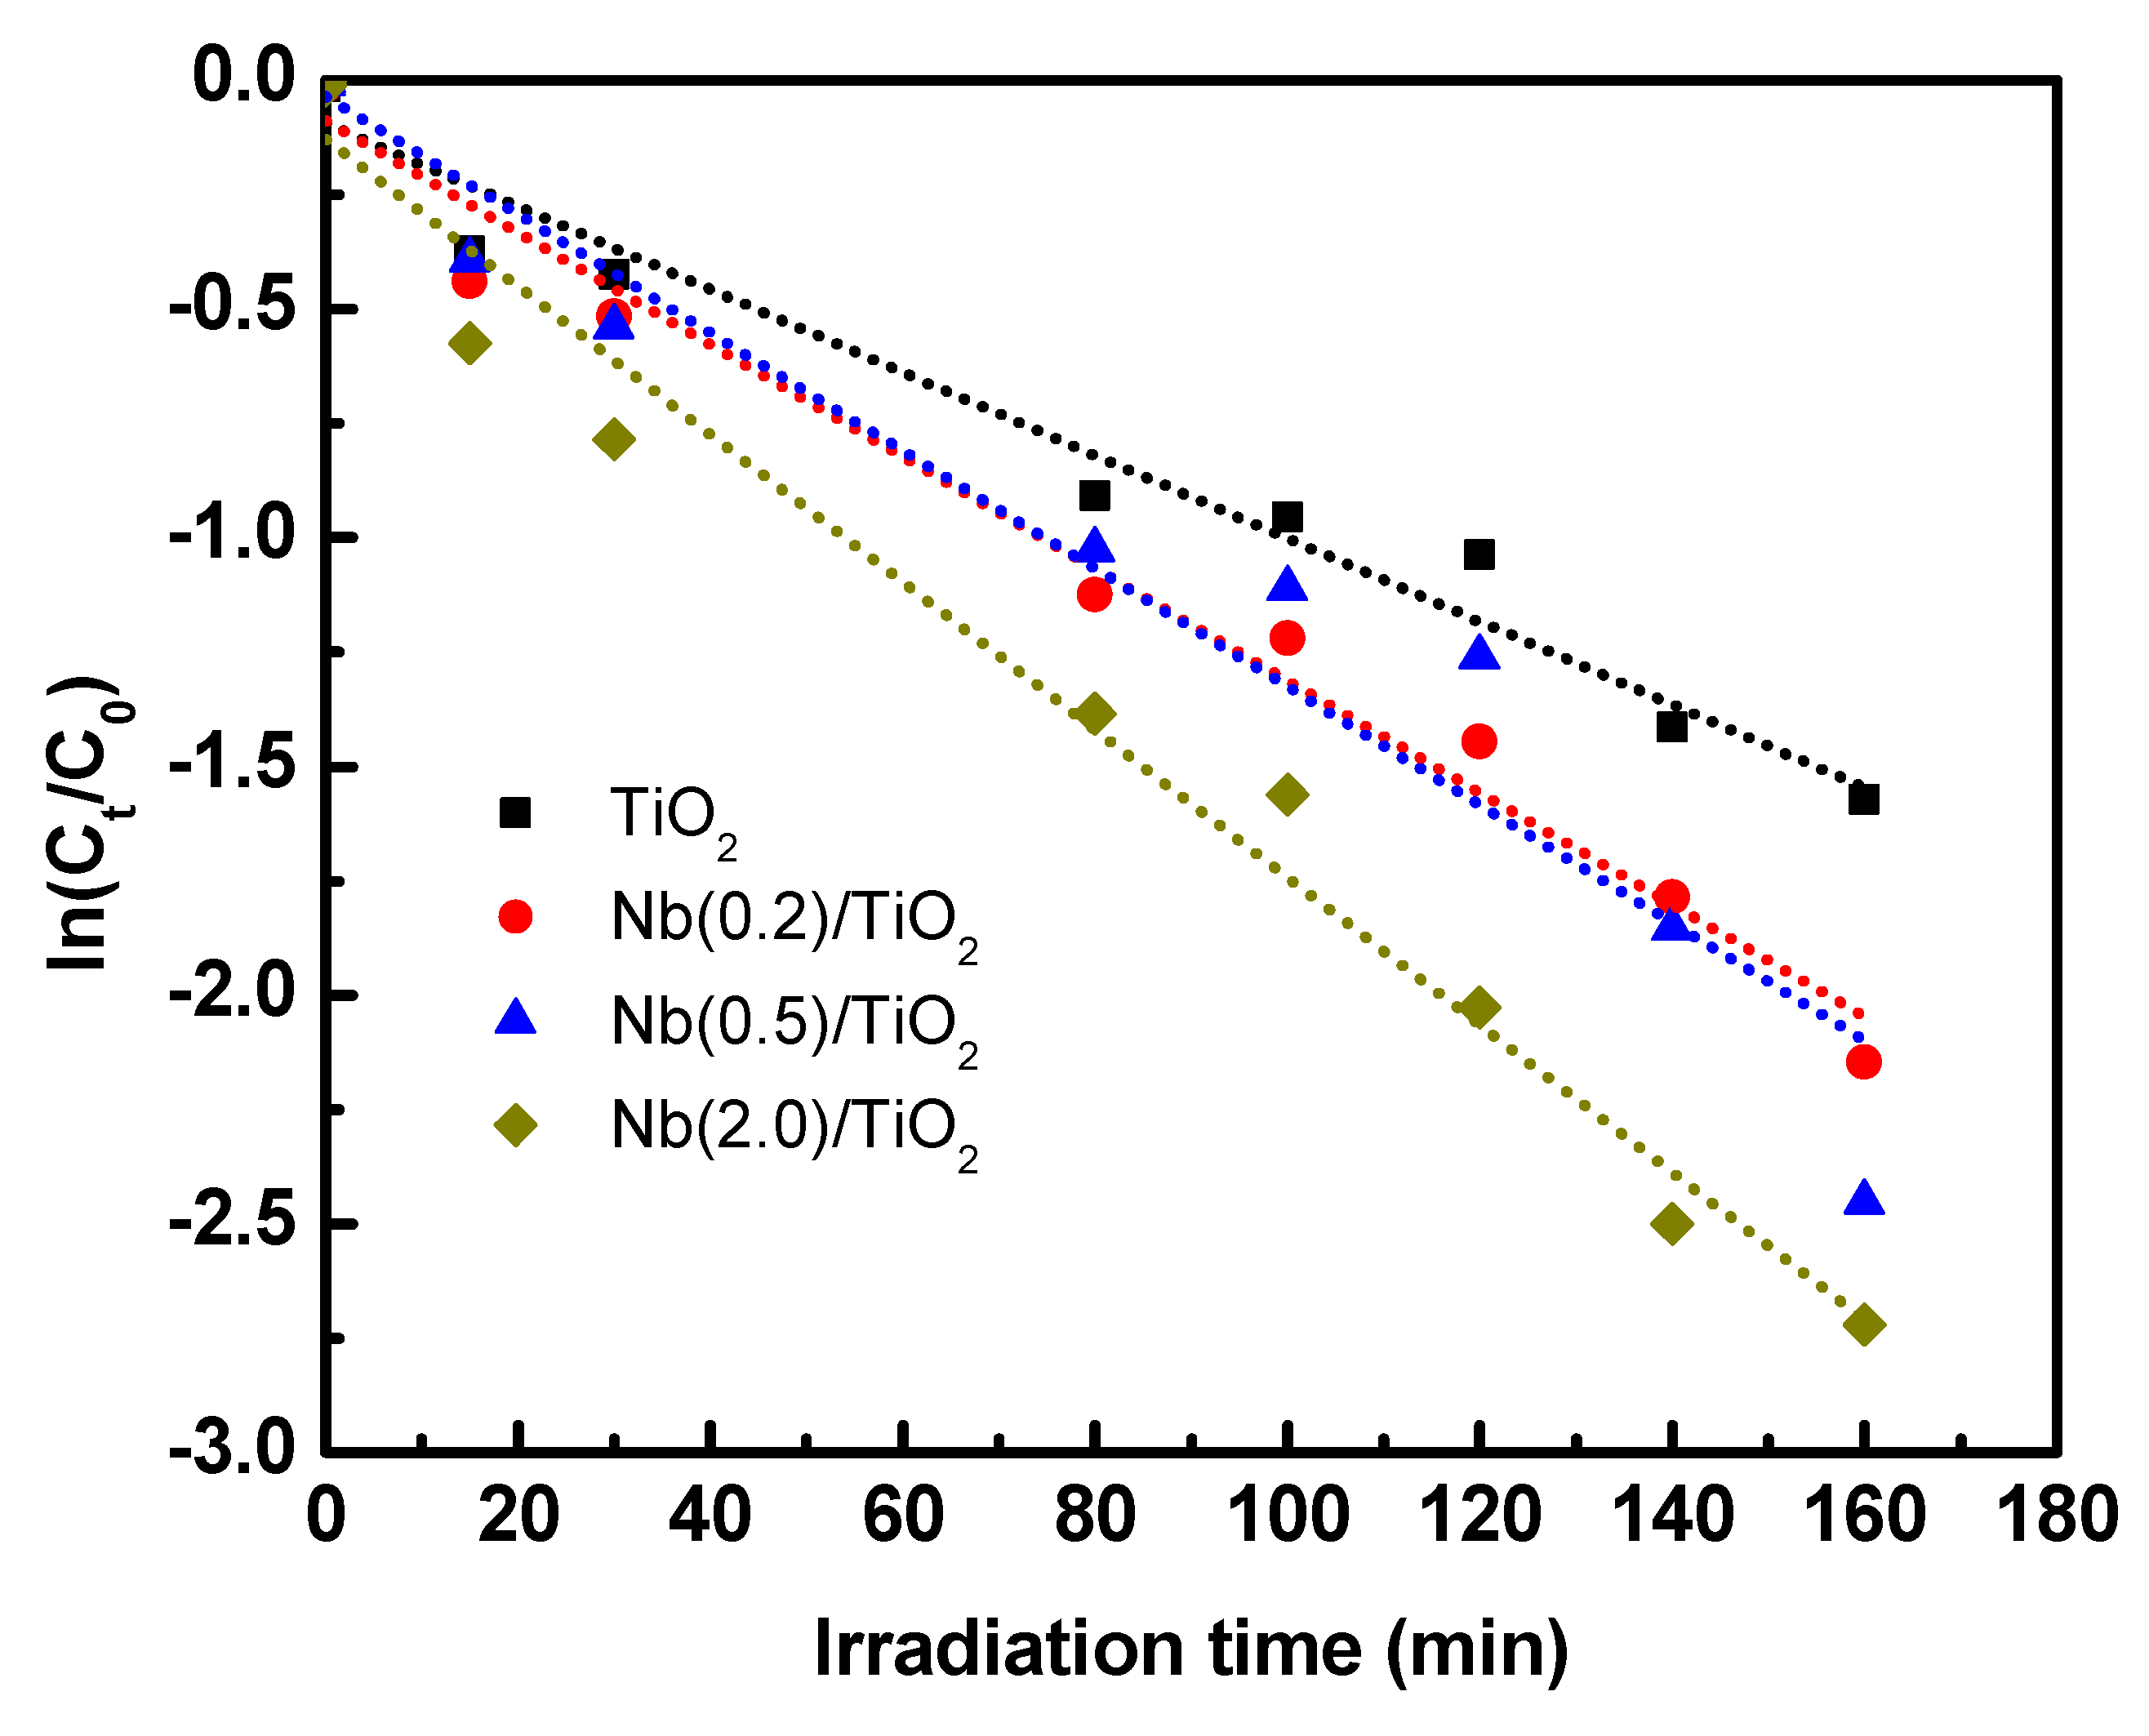
3.4. Photocatalytic Degradation of Phenol Red

For the photocatalysis study, the absorbance measurement was carried out by using a spectrophotometer UV-3600 series Shimadzu in the wavelength interval of 350–550 nm. The concentration of the phenol red was 20 mg/L, which is considered a high concentration measured overall in the reported literature. The nanocomposite of 5 mg was placed in a Pyrex beaker of 50 mL diluted phenol dye. Five samples were prepared for this study; standalone phenol red and phenol red-based Nb(x)/TiO2 nanocomposites. A blank experiment for the phenol red is to ensure that there is no effect on the phenol red concentration coming from the exposure to the UV light. In addition, the experiment was placed in the dark for the whole night to assure that the removal is due to the photodegradation process and not the surface adsorption. The absorbance spectra of the five samples were measured after irradiation of a duration. The absorbance spectra were observed to decrease for the four samples prepared based on Nb(x)/TiO2, as shown in Figure 7. However, the degradation of the phenol red seems fast for the samples prepared from Nb(x)/TiO2, and the highest was observed for Nb(2.0)/TiO2.
The unique optical properties put these nanocomposites in the category of competitive catalysts. Nb(x)/TiO2 nanocomposites with their broadband gap and high excitation binding energy are promising materials for the degradation of organic dye pollutants [32]. Figure 8 shows the degradation efficiency of 20 mg/L phenol red through 5.0 mg of Nb(x)/TiO2 at various irradiation times. The efficiency was calculated by the following equation:
η % = C 0 C t C 0 × 100
where C 0 is the phenol red initial concentration and C t is the instant phenol red concentration at a specific irradiation time, t. Firstly, the efficiency increased with increasing the irradiation time. Secondly, it was recorded as high for the sample mixed with Nb contents, and high efficiency was observed for Nb(2.0)/TiO2.
If we suppose that the Nb compound is stuck to the TiO2 surface or the opposite, we have proposed a typical catalytic mechanism for the photodegradation of phenol red on the surface of Nb(x)/TiO2 nanocomposites. The phenomena of photocatalytic reaction were well defined in previous reports [33,34]. The photolysis of the dye in solution is initiated by the optical excitation of the semiconductor, followed by the formation of an electron-hole pair on the surface of the catalyst, as in Equation (3).
T i O 2 + h ν T i O 2   ( e + h + )
The high oxidizing potential of the hole in the catalyst allows direct oxidation of the dye to a reactive intermediate catalyst, as in Equation (4).
h + + d y e d y e . + o x i d a t i o n   o f   t h e   d y e
Another reactive intermediate responsible for photolysis is the hydroxyl radical (OH). It is formed either by the decomposition of water by the hole or by the reaction of the hole with (OH), as in Equations (5) and (6), respectively.
h + + H 2 O H + + · O H
h + + O H · O H
The electrons in the conduction band on the surface of the catalyst can reduce the molecular oxygen to the peroxide anion. It is also responsible for producing hydroxyl radicals.
e + O 2 · O 2
· O 2 + d y e d y e O O ·
· O H + d y e   P h o t o d e g r a d a t i o n   o f   t h e   d y e
Hydroxyl radical species have been indicated as the primary reason for organic matter mineralization, as in Equation (9). The hydroxyl radical is a high oxidizer with an oxidation potential of 2.8 eV and a non-selective oxidizer, resulting in partial or complete mineralization of many organic compounds [34]. Experimental results indicated that the photodegradation of phenol red on Nb(x)/TiO2 is faster than the photodegradation on pure TiO2, which is due to the low recombination of the exciting charge carriers T i O 2   ( e + h + ) . We suppose that the surface of Nb may receive conduction electrons traveling from the high conduction band of TiO2. This results in capturing the electron not recombining quickly back to the valence band of the oxide. This fact has been confirmed by PL measurements in Figure 5 when the emission peak was reduced in intensity with increasing Nb content.
It is well known that the optical absorbance value is directly proportional to the concentration of the dye degradation. Based on this fact, a calibration curve between the dye concentration and the absorbance spectra was carried out. From this result, we could calculate the dye concentration based on the corresponding absorbance spectra measured in the presence of Nb(x)/TiO2 nanocomposites. The constant of the first-order reaction rate (k) and the constant of the adsorption equilibrium (K) at Uv-vis light can be calculated when we plot ln ( C t / C 0 ) as a function of the irradiation time, t [35]:
ln ( C t C o ) = k K t + K C o
where C o and C t are the basic concentration of the phenol red and the instant concentration after a certain irradiation time. This semi-logarithmic equation results in a straight line, as shown in Figure 9. The constant of the adsorption equilibrium can be calculated from the intercept part, and the constant of the first-order reaction can be calculated from the slope part [35,36]. Their values are listed in Table 1. The values of both constants are dependent on the presence of Nb on the nanoparticles, where k increased from 0.01 for TiO2 to 0.19 for Nb(2.0)/TiO2 nanocomposite, while K decreased from 0.63 to 0.08 for the same nanocomposites. These results reveal the large effect of the existence of niobium on the degradation reaction. The degraded amount ( q e ) of the phenol red on the surface of the oxide materials at equilibrium at an irradiation time of 160 min is known as the amount of dye (in mg) per unit mass of oxide (in g), i.e., q e in mg/g, and was estimated as follows [37]:
q e = C 0 C e m   V ,  
where Ce is the equilibrium concentration in mgL−1 at irradiation time of 160 min, m is the adsorbent mass, and V is the solution volume. The amount of dye degraded on 1.0 g of the oxide increased from 158 mg for TiO2 up to 187 mg for Nb(2.0)/TiO2, as listed in Table 1.
The instantaneous amount or quantity ( q t ) of degraded dye as a function of irradiation time is estimated by Equation (12) [38]:
q t = ( C 0 C t ) m V
where C t is the instant phenol red concentration. The amount of degraded phenol red as a function of irradiation time is shown in Figure 10, which indicates the adsorption capacity dependence. The adsorption capacity was improved with increasing the time, as with the photocatalysis efficiency curve observed in Figure 8. The capacity of the Nb(2.0)/TiO2 nanocomposite is higher than the others.

4. Conclusions

In summary, novel Nb(x)/TiO2 nanocomposites were fabricated by a simple sol-gel method for the photocatalysis degradation toward the phenol red. Different contents of Nb were mixed with TiO2. The structural and optical properties were determined using high-transmission electron microscopy (HRTEM), X-ray diffraction, Raman spectroscopy, photoluminescence, and UV-vis absorbance spectroscopy. A systematic study of adding Nb ions to TiO2 correlated with the photocatalysis properties was investigated. The nanocomposites exhibited an improvement toward the degradation of the phenol red with a high concentration of 20 mg/L. The degradation efficiency was improved from 79% for TiO2 fine particles to 94% for Nb(2.0)/TiO2 nanocomposite. Moreover, the nanocomposite had a higher adsorption capacity compared to TiO2, and the highest value was observed for Nb(2.0)/TiO2 nanocomposite, which reaches 183 mg phenol red for each 1.0 g nanocomposite. The decomposition of cationic phenol red observed in the present study showed a synergistic effect of the Nb(x)/TiO2 nanocomposites for wastewater treatment by the advanced oxidation process (AOP).

Author Contributions

Conceptualization, N.A., C.A. and N.M.S.; methodology, N.A., C.A. and N.M.S.; software, N.A., C.A. and N.M.S.; validation, N.A., C.A. and N.M.S.; formal analysis, N.A., C.A. and N.M.S.; investigation, N.A., C.A. and N.M.S.; resources, N.A., C.A. and N.M.S.; data curation, N.A., C.A. and N.M.S.; writing—original draft preparation, C.A. and N.M.S.; writing—review and editing, N.A., C.A. and N.M.S.; visualization, N.A., C.A. and N.M.S.; supervision, N.A.; project administration, N.A.; funding acquisition, N.A. All authors have read and agreed to the published version of the manuscript.

Funding

This research was funded by the Deanship of Scientific Research at King Faisal University (Saudi Arabia), grant number 217003 and The APC was funded by the same grant number 217003.

Institutional Review Board Statement

Not applicable.

Informed Consent Statement

Not applicable.

Acknowledgments

The authors acknowledge the Deanship of Scientific Research at King Faisal University for the financial support under RA’ED Track (Grant No. 217003).

Conflicts of Interest

The authors declare no conflict of interest.

References

  1. Xiao, M.; Luo, B.; Lyu, M.; Wang, S.; Wang, L. Photocatalysis: Single-Crystalline Nanomesh Tantalum Nitride Photocatalyst with Improved Hydrogen-Evolving Performance. Adv. Energy Mater. 2018, 8, 1770138. [Google Scholar] [CrossRef] [Green Version]
  2. Zhang, L.; Zhao, Z.-J.; Wang, T.; Gong, J. Nano-Designed Semiconductors for Electro- and Photoelectro-Catalytic Conversion of Carbon Dioxide. Chem. Soc. Rev. 2018, 47, 5423–5443. [Google Scholar] [CrossRef] [PubMed]
  3. Yoon, J.W.; Kim, J.-H.; Jo, Y.-M.; Lee, J.-H. Heterojunction between Bimetallic Metal-Organic Framework and TiO2: Band-Structure Engineering for Effective Photoelectrochemical Water Splitting. Nano Res. 2022. [Google Scholar] [CrossRef]
  4. Chatterjee, D.; Dasgupta, S. Visible Light Induced Photocatalytic Degradation of Organic Pollutants. J. Photochem. Photobiol. C Photochem. Rev. 2005, 6, 186–205. [Google Scholar] [CrossRef]
  5. Peerakiatkhajohn, P.; Butburee, T.; Sul, J.-H.; Thaweesak, S.; Yun, J.-H. Efficient and Rapid Photocatalytic Degradation of Methyl Orange Dye Using Al/ZnO Nanoparticles. Nanomaterials 2021, 11, 1059. [Google Scholar] [CrossRef] [PubMed]
  6. Pozan, G.S.; Isleyen, M.; Gokcen, S. Transition Metal Coated TiO2 Nanoparticles: Synthesis, Characterization and Their Photocatalytic Activity. Appl. Catal. B Environ. 2013, 140, 537–545. [Google Scholar] [CrossRef]
  7. Tayade, R.J.; Kulkarni, R.G.; Jasra, R. V Transition Metal Ion Impregnated Mesoporous TiO2 for Photocatalytic Degradation of Organic Contaminants in Water. Ind. Eng. Chem. Res. 2006, 45, 5231–5238. [Google Scholar] [CrossRef]
  8. Mathew, S.; Ganguly, P.; Rhatigan, S.; Kumaravel, V.; Byrne, C.; Hinder, S.J.; Bartlett, J.; Nolan, M.; Pillai, S.C. Cu-Doped TiO2: Visible Light Assisted Photocatalytic Antimicrobial Activity. Appl. Sci. 2018, 11, 2067. [Google Scholar] [CrossRef] [Green Version]
  9. Verbruggen, S.W.; Keulemans, M.; Filippousi, M.; Flahaut, D.; Van Tendeloo, G.; Lacombe, S.; Martens, J.A.; Lenaerts, S. Plasmonic Gold–Silver Alloy on TiO2 Photocatalysts with Tunable Visible Light Activity. Appl. Catal. B Environ. 2014, 156, 116–121. [Google Scholar] [CrossRef]
  10. Yang, X.; Min, Y.; Li, S.; Wang, D.; Mei, Z.; Liang, J.; Pan, F. Conductive Nb-Doped TiO2 Thin Films with Whole Visible Absorption to Degrade Pollutants. Catal. Sci. Technol. 2018, 8, 1357–1365. [Google Scholar] [CrossRef]
  11. Ahmed, F.; Kanoun, M.B.; Awada, C.; Jonin, C.; Brevet, P.-F. An Experimental and Theoretical Study on the Effect of Silver Nanoparticles Concentration on the Structural, Morphological, Optical, and Electronic Properties of TiO2 Nanocrystals. Crystals 2021, 11, 1488. [Google Scholar] [CrossRef]
  12. Al Suliman, N.; Awada, C.; Alshoaibi, A.; Shaalan, N.M. Simple Preparation of Ceramic-like Materials Based on 1D-Agx(x=0, 5, 10, 20, 40 mM)/TiO2 Nanostructures and Their Photocatalysis Performance. Crystals 2020, 10, 1024. [Google Scholar] [CrossRef]
  13. Schneider, J.; Matsuoka, M.; Takeuchi, M.; Zhang, J.; Horiuchi, Y.; Anpo, M.; Bahnemann, D.W. Understanding TiO2 Photocatalysis: Mechanisms and Materials. Chem. Rev. 2014, 114, 9919–9986. [Google Scholar] [CrossRef]
  14. Etacheri, V.; Di Valentin, C.; Schneider, J.; Bahnemann, D.; Pillai, S.C. Visible-Light Activation of TiO2 Photocatalysts: Advances in Theory and Experiments. J. Photochem. Photobiol. C Photochem. Rev. 2015, 25, 1–29. [Google Scholar] [CrossRef] [Green Version]
  15. Pallotti, D.K.; Passoni, L.; Maddalena, P.; Di Fonzo, F.; Lettieri, S. Photoluminescence Mechanisms in Anatase and Rutile TiO2. J. Phys. Chem. C 2017, 121, 9011–9021. [Google Scholar] [CrossRef]
  16. Kou, Y.; Yang, J.; Li, B.; Fu, S. Solar Photocatalytic Activities of Porous Nb-Doped TiO2 Microspheres by Coupling with Tungsten Oxide. Mater. Res. Bull. 2015, 63, 105–111. [Google Scholar] [CrossRef]
  17. Wu, M.-C.; Lin, T.-H.; Chih, J.-S.; Hsiao, K.-C.; Wu, P.-Y. Niobium Doping Induced Morphological Changes and Enhanced Photocatalytic Performance of Anatase TiO2. Jpn. J. Appl. Phys. 2017, 56, 04CP07. [Google Scholar] [CrossRef]
  18. Zhao, Y.; Zhou, X.; Ye, L.; Chi Edman Tsang, S. Nanostructured Nb2O5 Catalysts. Nano Rev. 2012, 3, 17631. [Google Scholar] [CrossRef] [Green Version]
  19. Kim, Y.S.; Jin, H.-J.; Jung, H.R.; Kim, J.; Nguyen, B.P.; Kim, J.; Jo, W. Reduced Extrinsic Recombination Process in Anatase and Rutile TiO2 Epitaxial Thin Films for Efficient Electron Transport Layers. Sci. Rep. 2021, 11, 6810. [Google Scholar] [CrossRef]
  20. Yang, J.; Zhang, X.; Wang, C.; Sun, P.; Wang, L.; Xia, B.; Liu, Y. Solar Photocatalytic Activities of Porous Nb-Doped TiO2 Microspheres Prepared by Ultrasonic Spray Pyrolysis. Solid State Sci. 2012, 14, 139–144. [Google Scholar] [CrossRef]
  21. Barbosa López, A.L.; Castro, I.M. Niobium-Titanium-Based Photocatalysts: Its Potentials for Free Cyanide Oxidation in Residual Aqueous Effluent. Front. Chem. 2020, 8, 99. [Google Scholar] [CrossRef] [PubMed]
  22. Liu, J.; Xue, D.; Li, K. Single-Crystalline Nanoporous Nb2O5 Nanotubes. Nanoscale Res. Lett. 2011, 6, 138. [Google Scholar] [CrossRef] [PubMed] [Green Version]
  23. Boulle, A.; Chartier, A.; Crocombette, J.; Jourdan, T.; Pellegrino, S.; Debelle, A. Strain and Damage Build-up in Irradiated Crystals: Coupling X-ray Diffraction with Numerical Simulations. Nucl. Instrum. Methods Phys. Res. Sect. B Beam Interact. Mater. At. 2019, 458, 143–150. [Google Scholar] [CrossRef] [Green Version]
  24. Shaalan, N.M.; Rashad, M.; Abdel-Rahim, M.A. Repeatability of Indium Oxide Gas Sensors for Detecting Methane at Low Temperature. Mater. Sci. Semicond. Process. 2016, 56, 260–264. [Google Scholar] [CrossRef]
  25. Ghazzal, M.N.; Chaoui, N.; Genet, M.; Gaigneaux, E.M.; Robert, D. Effect of Compressive Stress Inducing a Band Gap Narrowing on the Photoinduced Activities of Sol–Gel TiO2 Films. Thin Solid Film. 2011, 520, 1147–1154. [Google Scholar] [CrossRef]
  26. Orendorz, A.; Brodyanski, A.; Lösch, J.; Bai, L.H.; Chen, Z.H.; Le, Y.K.; Ziegler, C.; Gnaser, H. Phase Transformation and Particle Growth in Nanocrystalline Anatase TiO2 Films Analyzed by X-ray Diffraction and Raman Spectroscopy. Surf. Sci. 2007, 601, 4390–4394. [Google Scholar] [CrossRef]
  27. Cheng, G.; Akhtar, M.S.; Yang, O.-B.; Stadler, F.J. Structure Modification of Anatase TiO2 Nanomaterials-Based Photoanodes for Efficient Dye-Sensitized Solar Cells. Electrochim. Acta 2013, 113, 527–535. [Google Scholar] [CrossRef]
  28. Zhang, W.F.; He, Y.L.; Zhang, M.S.; Yin, Z.; Chen, Q. Raman Scattering Study on Anatase TiO2 nanocrystals. J. Phys. D Appl. Phys. 2000, 33, 912–916. [Google Scholar] [CrossRef]
  29. Hendi, A.A.; Rashad, M. Photo-Induced Changes in Nano-Copper Oxide for Optoelectronic Applications. Phys. B Condens. Matter. 2018, 538, 185–190. [Google Scholar] [CrossRef]
  30. El-Menyawy, E.M.; Elagamey, A.A.; Elgogary, S.R.; Abu El-Enein, R.A.N. Synthesis, Crystal Structure and Thin-Film-Optical Properties of 3-Amino-2-(2-Nitrophenyl)Diazinyl-3-(Morpholin-1-Yl)Acrylonitrile. Spectrochim. Acta Part A Mol. Biomol. Spectrosc. 2013, 108, 75–81. [Google Scholar] [CrossRef]
  31. Mathew, S.; kumar Prasad, A.; Benoy, T.; Rakesh, P.P.; Hari, M.; Libish, T.M.; Radhakrishnan, P.; Nampoori, V.P.N.; Vallabhan, C.P.G. UV-Visible Photoluminescence of TiO2 Nanoparticles Prepared by Hydrothermal Method. J. Fluoresc. 2012, 22, 1563–1569. [Google Scholar] [CrossRef] [PubMed]
  32. El-Shafai, N.M.; El-Khouly, M.E.; El-Kemary, M.; Ramadan, M.S.; Masoud, M.S. Graphene Oxide–Metal Oxide Nanocomposites: Fabrication, Characterization and Removal of Cationic Rhodamine B Dye. RSC Adv. 2018, 8, 13323–13332. [Google Scholar] [CrossRef] [PubMed] [Green Version]
  33. Asiri, A.M.; Al-Amoudi, M.S.; Al-Talhi, T.A.; Al-Talhi, A.D. Photodegradation of Rhodamine 6G and Phenol Red by Nanosized TiO2 under Solar Irradiation. J. Saudi Chem. Soc. 2011, 15, 121–128. [Google Scholar] [CrossRef] [Green Version]
  34. Daneshvar, N.; Salari, D.; Khataee, A.R. Photocatalytic Degradation of Azo Dye Acid Red 14 in Water on ZnO as an Alternative Catalyst to TiO2. J. Photochem. Photobiol. A Chem. 2004, 162, 317–322. [Google Scholar] [CrossRef]
  35. Rashad, M.; Shaalan, N.M.; Abd-Elnaiem, A.M. Degradation Enhancement of Methylene Blue on ZnO Nanocombs Synthesized by Thermal Evaporation Technique. Desalin. Water Treat. 2016, 57, 26267–26273. [Google Scholar] [CrossRef]
  36. Yan, H.; Hou, J.; Fu, Z.; Yang, B.; Yang, P.; Liu, K.; Wen, M.; Chen, Y.; Fu, S.; Li, F. Growth and Photocatalytic Properties of One-Dimensional ZnO Nanostructures Prepared by Thermal Evaporation. Mater. Res. Bull. 2009, 44, 1954–1958. [Google Scholar] [CrossRef]
  37. Al-Aoh, H.A.; Mihaina, I.A.M.; Alsharif, M.A.; Darwish, A.A.A.; Rashad, M.; Mustafa, S.K.; Aljohani, M.M.H.; Al-Duais, M.A.; Al-Shehri, H.S. Removal of Methylene Blue from Synthetic Wastewater by the Selected Metallic Oxides Nanoparticles Adsorbent: Equilibrium, Kinetic and Thermodynamic Studies. Chem. Eng. Commun. 2020, 207, 1719–1735. [Google Scholar] [CrossRef]
  38. Rashad, M. Performance Efficiency and Kinetic Studies of Water Purification Using ZnO and MgO Nanoparticles for Potassium Permanganate. Opt. Quantum Electron. 2019, 51, 291. [Google Scholar] [CrossRef]
Figure 1. Schematic representation of different steps for the preparation of Nb(x)/TiO2 nanocomposites.
Crystals 12 00911 g001
Figure 2. (a,b) TEM images, (c) HRTEM image, and (d) SAED pattern of 5 nm TiO2 nanoparticles.
Crystals 12 00911 g002
Figure 3. (a) XRD patterns of Nb(x)/TiO2 samples with different molar fractions of niobium (0, 0.2, 0.5, and 2%), and (b) shift of the crystal plane (101) due to the effect of Nb. The peak marked by an asterisk * belongs to niobium oxide.
Crystals 12 00911 g003
Figure 4. (a) Room-temperature Raman spectra of pure TiO2 and Nb(x)/TiO2 nanocomposites. (b) Fitting of the Eg mode with a Lorentzian function of Pure TiO2, Nb(0.2)/TiO2, Nb(0.5)/TiO2, and Nb(2.0)/TiO2. (c) Variation of the Eg mode position versus the molar fraction of Nb.
Crystals 12 00911 g004
Figure 5. (a) The absorbance spectra, (b) the absorption coefficient, (c) the Tauc-plot, and (d) the optical band gap of the Nb(x)/TiO2 nanocomposites.
Crystals 12 00911 g005
Figure 6. (a) PL spectra of pure TiO2 and Nb(x)/TiO2 nanocomposites. (b) Zoom-in of the PL spectra around the peak located at 520 nm.
Crystals 12 00911 g006
Figure 7. Absorbance spectra of the degradable phenol red at various irradiation times for TiO2, Nb(0.2)/TiO2, Nb(0.5)/TiO2, and Nb(2.0)/TiO2.
Crystals 12 00911 g007
Figure 8. The efficiency of photocatalytic degradation for Phenol red with a concentration of 20 mg/L on the surface of TiO2, Nb(0.2)/TiO2, Nb(0.5)/TiO2, and Nb(2.0)/TiO2. The inset shows the difference in watercolor for these various nanocomposites after 160 min exposure to the light.
Crystals 12 00911 g008
Figure 9. Semi-logarithmic graph of phenol red concentration of 20 mg/L as a function of the irradiation time on the surface of TiO2, Nb(0.2)/TiO2, Nb(0.5)/TiO2, and Nb(2.0)/TiO2.
Crystals 12 00911 g009
Figure 10. Effect of the contact time on the adsorption capacity of phenol red concentration as a function of irradiation time for TiO2, TiO2/0.2Nb, TiO2/0.5Nb, and TiO2/2.0Nb.
Crystals 12 00911 g010
Table 1. First-order reaction rate constants (k) and the adsorption equilibrium constant (K), and calculated qe values.
Sampleqe
mg/g
kK
TiO21580.010.63
Nb(0.2)/TiO21760.020.59
Nb(0.5)/TiO21830.050.23
Nb(2.0)/TiO21870.190.08
Publisher’s Note: MDPI stays neutral with regard to jurisdictional claims in published maps and institutional affiliations.

