Article

Initial Microstructure Effects on Hot Tensile Deformation and Fracture Mechanisms of Ti-5Al-5Mo-5V-1Cr-1Fe Alloy Using In Situ Observation

1
School of Materials Science and Engineering, Central South University, Changsha 410083, China
2
Advanced Research Center, Central South University, Changsha 410083, China
3
State Key Laboratory of Powder Metallurgy, Central South University, Changsha 410083, China
4
Hunan Engineering Research Center of Forming Technology and Damage Resistance Evaluation for High Efficiency Light Alloy Components, Hunan University of Science and Technology, Xiangtan 411201, China
*
Authors to whom correspondence should be addressed.
Crystals 2022, 12(7), 934; https://doi.org/10.3390/cryst12070934
Submission received: 16 May 2022 / Revised: 11 June 2022 / Accepted: 23 June 2022 / Published: 1 July 2022
(This article belongs to the Special Issue Mechanical Properties of Advanced Metallic Materials)

Abstract

:
The hot tensile deformation and fracture mechanisms of a Ti-5Al-5Mo-5V-1Cr-1Fe alloy with bimodal and lamellar microstructures were investigated by in situ tensile tests under scanning electron microscopy (SEM) and electron backscatter diffraction (EBSD). The results show that the main slip deformation modes are prismatic slip ({1 1 ¯ 00}<11 2 ¯ 0>) and pyramidal slip ({1 1 ¯ 01}<11 2 ¯ 0>) under tension at 350 °C. In the bimodal microstructure, several parallel slip bands (SBs) first form within the primary α (αP) phase. As the strain increases, the number of SBs in the αP phase increases significantly and multislip systems are activated to help further coordinate the increasing deformation. Consequently, the microcracks nucleate and generally propagate along the SBs in the αP phase. The direction of propagation of the cracks deflects significantly when it crosses the αP/β interface, resulting in a tortuous crack path. In the lamellar microstructure, many dislocations pile up at the coarse-lath α (αL) phase near the grain boundaries (GBs) due to the strong fencing effect thereof. As a result, SBs develop first; then, microcracks nucleate at the αL phase boundary. During propagation, the cracks tend to propagate along the GB and thus lead to the intergranular fracture of the lamellar microstructure.

1. Introduction

Near-β-titanium alloys have been widely used in aerospace applications as important structural materials, such as in aeroengine compressor disks and turbo blades, due to the excellent corrosion resistance, high-temperature mechanical properties, and creep performance [1,2,3]. The damage and fracture behaviors of titanium alloy subject to high-temperature environments are very important for the safety of aerospace systems [4,5]. The improvement in high-temperature performance and service security of titanium alloy is always a focus among researchers exploring both the deformation and fracture behaviors of titanium alloys at high temperature [6,7,8].
Recently, the microstructural evolution and deformation mechanism of titanium alloys during thermal deformation processes have been studied: these were found to be closely associated with the size, volume, morphology, and distribution of the α phase [9,10]. Luo et al. [11] discovered that the flow stress of Ti-6Al-4V alloy increases with the volume fraction of equiaxed α phase but decreases with α-grain size. Wang et al. [12] found that the effects of microstructure on the deformation mechanism of TG6 alloy were mainly determined by the morphology and size of the αL and α colonies (small α phases lying parallel to the same orientation within the initial β grain). Lin et al. [13] revealed the effects of initial microstructures on hot tensile deformation behaviors and fracture characteristics of Ti-6Al-4V alloy. They found that the equiaxed α phases can prevent the formation and coalescence of microvoids, which is beneficial to improving the ductility. Jiang et al. [14] suggested that significant dynamic softening could occur during uniaxial hot tensile straining of the lamellar microstructure. This was mainly induced by the globularization of αL phases accompanied by the formation of high-angle grain boundaries (HAGBs). Although many mechanisms have been proposed, there is still no consensus on what the fundamental effect of microstructure characteristics on the hot deformation behavior of titanium alloy is. This could be due to the ex situ observation methods performed by previous researchers which made it difficult to obtain the original information concerning the deformation behavior of alloy directly.
In situ scanning electron microscopy (SEM) is an emerging technique used to characterize the deformation mechanism of materials and has been successfully applied to study the deformation behavior of titanium alloys at room temperature. Huang et al. [15] observed the in situ tensile behavior of Ti-6Al alloy with extra-low interstitial at room temperature and found that there were various coordinated deformation mechanisms such as crystalline orientation rotation, slip transmission, and deformation twinning. Wang et al. [16] investigated the fracture behavior of a new metastable β titanium alloy (Ti-5Cr-4Al-4Zr-3Mo-2W-0.8Fe) at room temperature. They stated that the deformation behavior of Ti-54432 alloy was strongly dependent on dislocation slip, and the deflection of the crack as it propagated; however, there is still a lack of the detailed information concerning the microstructure effect on the crack propagation behavior and slip activation of titanium alloys at high temperature which might be obtained by using an in situ SEM method.
Ti-55511 alloy has been widely used in aircraft casings, engine fan disks, etc., which requires long-term service at 350 °C [17,18]. In this study, the effects of bimodal and lamellar microstructures on the mechanical deformation behavior of Ti-55511 alloy at 350 °C were investigated by in situ SEM. Using electron backscatter diffraction (EBSD), the activation of slip system in deformation region was studied in detail. The results would benefit the microstructure design and deformation mechanism of titanium alloys for high-temperature application.

2. Materials and Methods
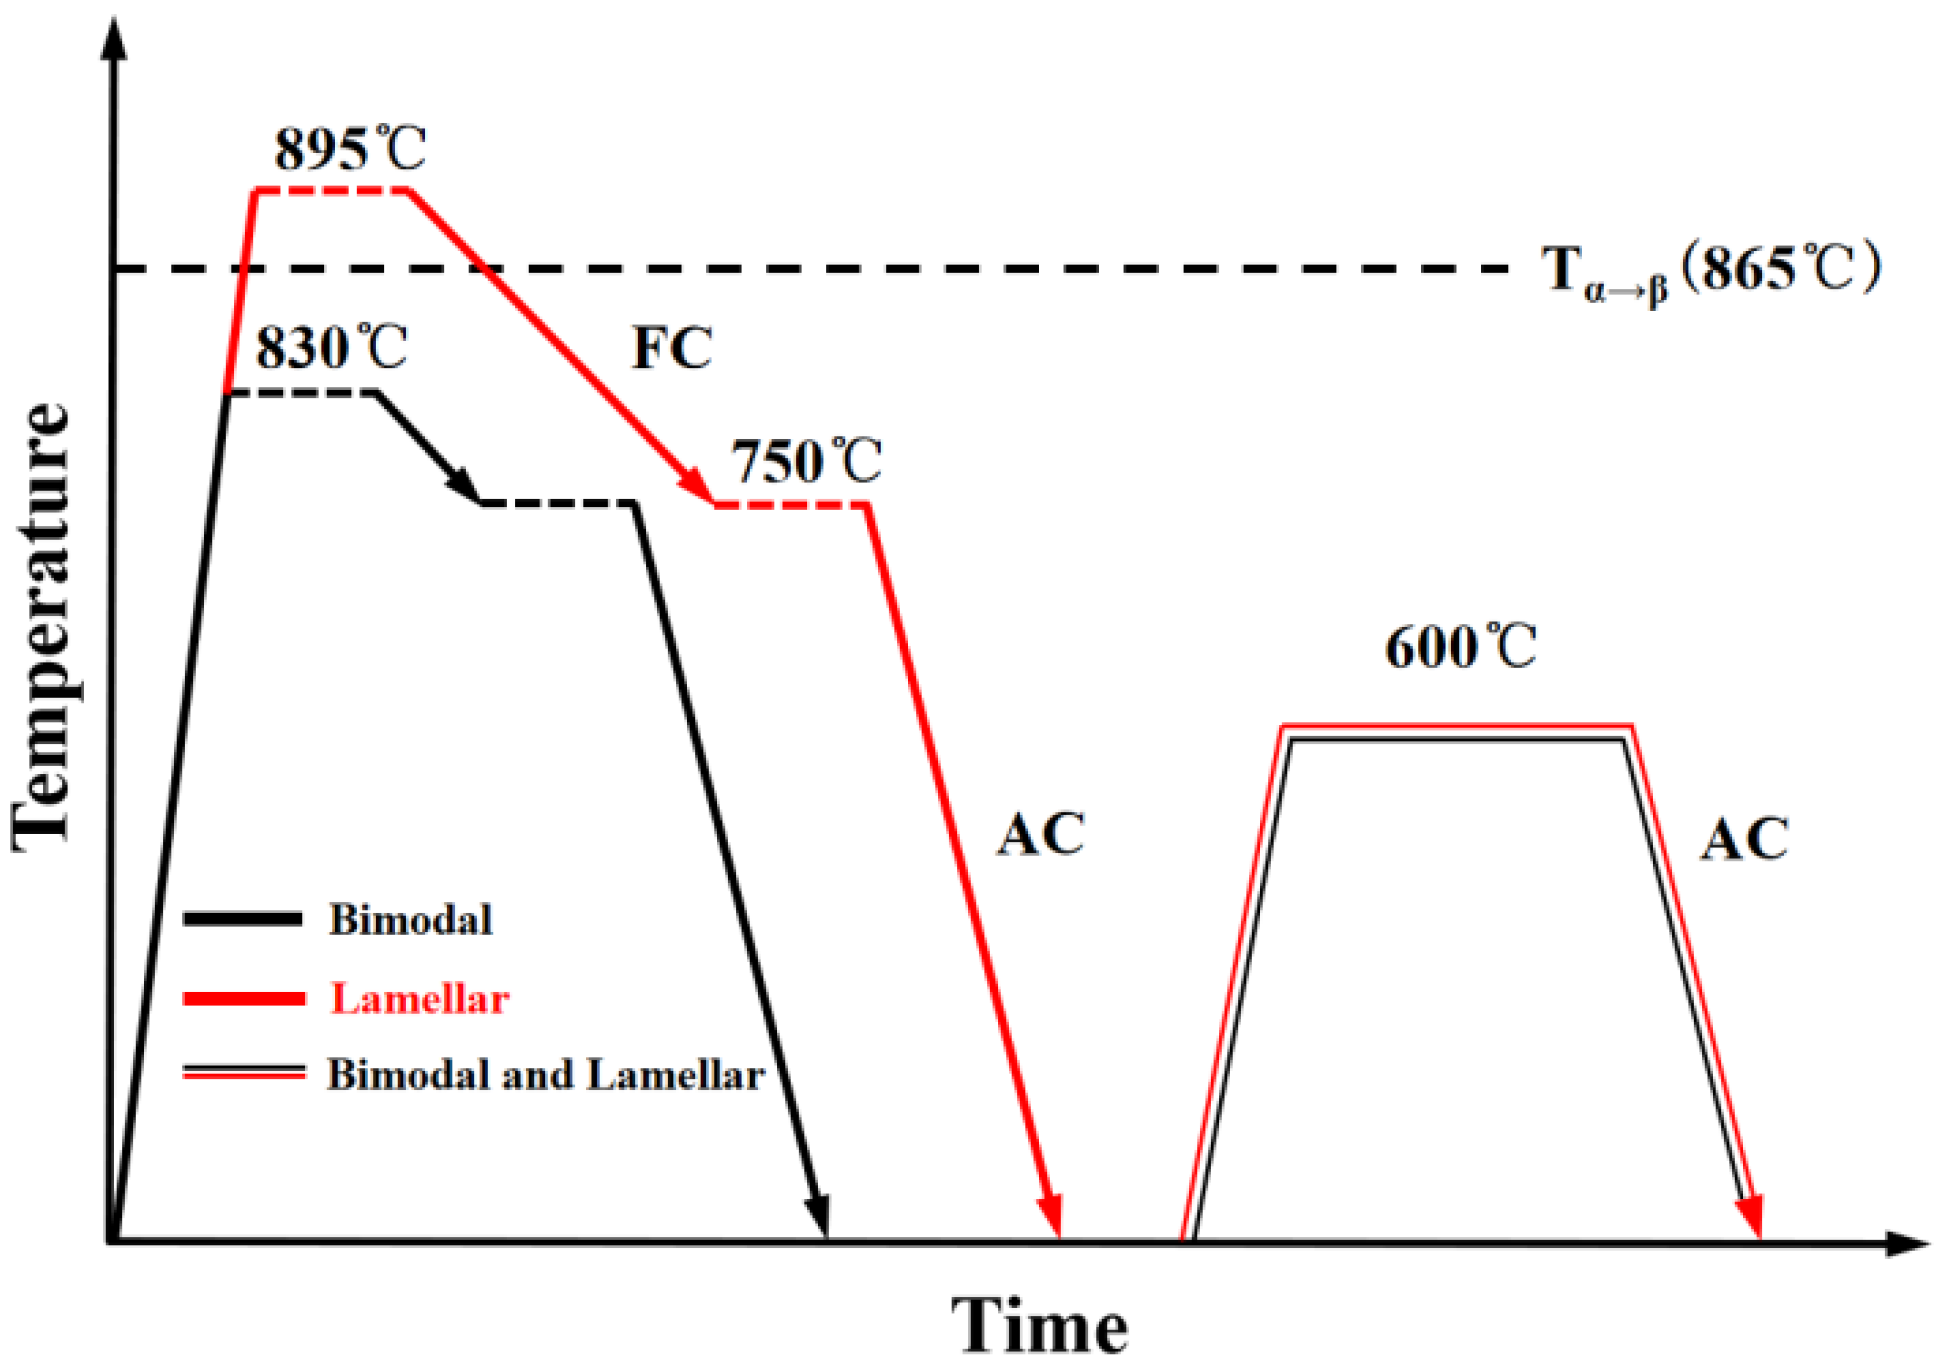
2.1. Materials

The as-received material in this study was a forged TC18 alloy provided by BAOTI Group Ltd. (Baoji, China) as cuboid (98.0 mm in length, 20.0 mm in width, and 7.0 mm in height). The experimental alloy had the chemical composition (wt.%) given in Table 1. The α+β/β transition temperature (Tα+β→β) of this alloy is about 865 °C.
The heat treatment methods of Ti-55511 alloy are shown in Figure 1. To obtain a bimodal microstructure, the sample was heated at 830 °C (below Tα+β→β) for 2 h. Then, it was furnace-cooled (FC) to 750 °C and held for 2 h followed by air cooling (AC). As a result, the equiaxed primary αP phases were distributed in the β matrix (Figure 2a). To acquire a lamellar microstructure which was characterized by coarse original β grains and coarse αL phase at GBs (Figure 2b), the sample was held at 895 °C (above Tα+β→β) for 2 h and then FC to 750 °C. It was also kept at 750 °C for 2 h followed by AC. The volume fractions of α phase in bimodal and lamellar microstructures were measured to be 39.6% and 11.3%, respectively.
Both bimodal and lamellar microstructures were finally aged at 600 °C for 8 h to obtain a dispersed distribution of fine secondary α (αS) phase embedded in the β matrix. The yield stress (σ0.2) and tensile strength (σb) values of bimodal samples are 1098 MPa and 1133 MPa, respectively, significantly lower than that of lamellar samples (σ0.2 = 1293 MPa, σb = 1309 MPa). On the contrary, the elongation (δ) of the bimodal sample at room temperature is 17.0%, which is significantly higher than that of the lamellar sample (δ = 6.0%).

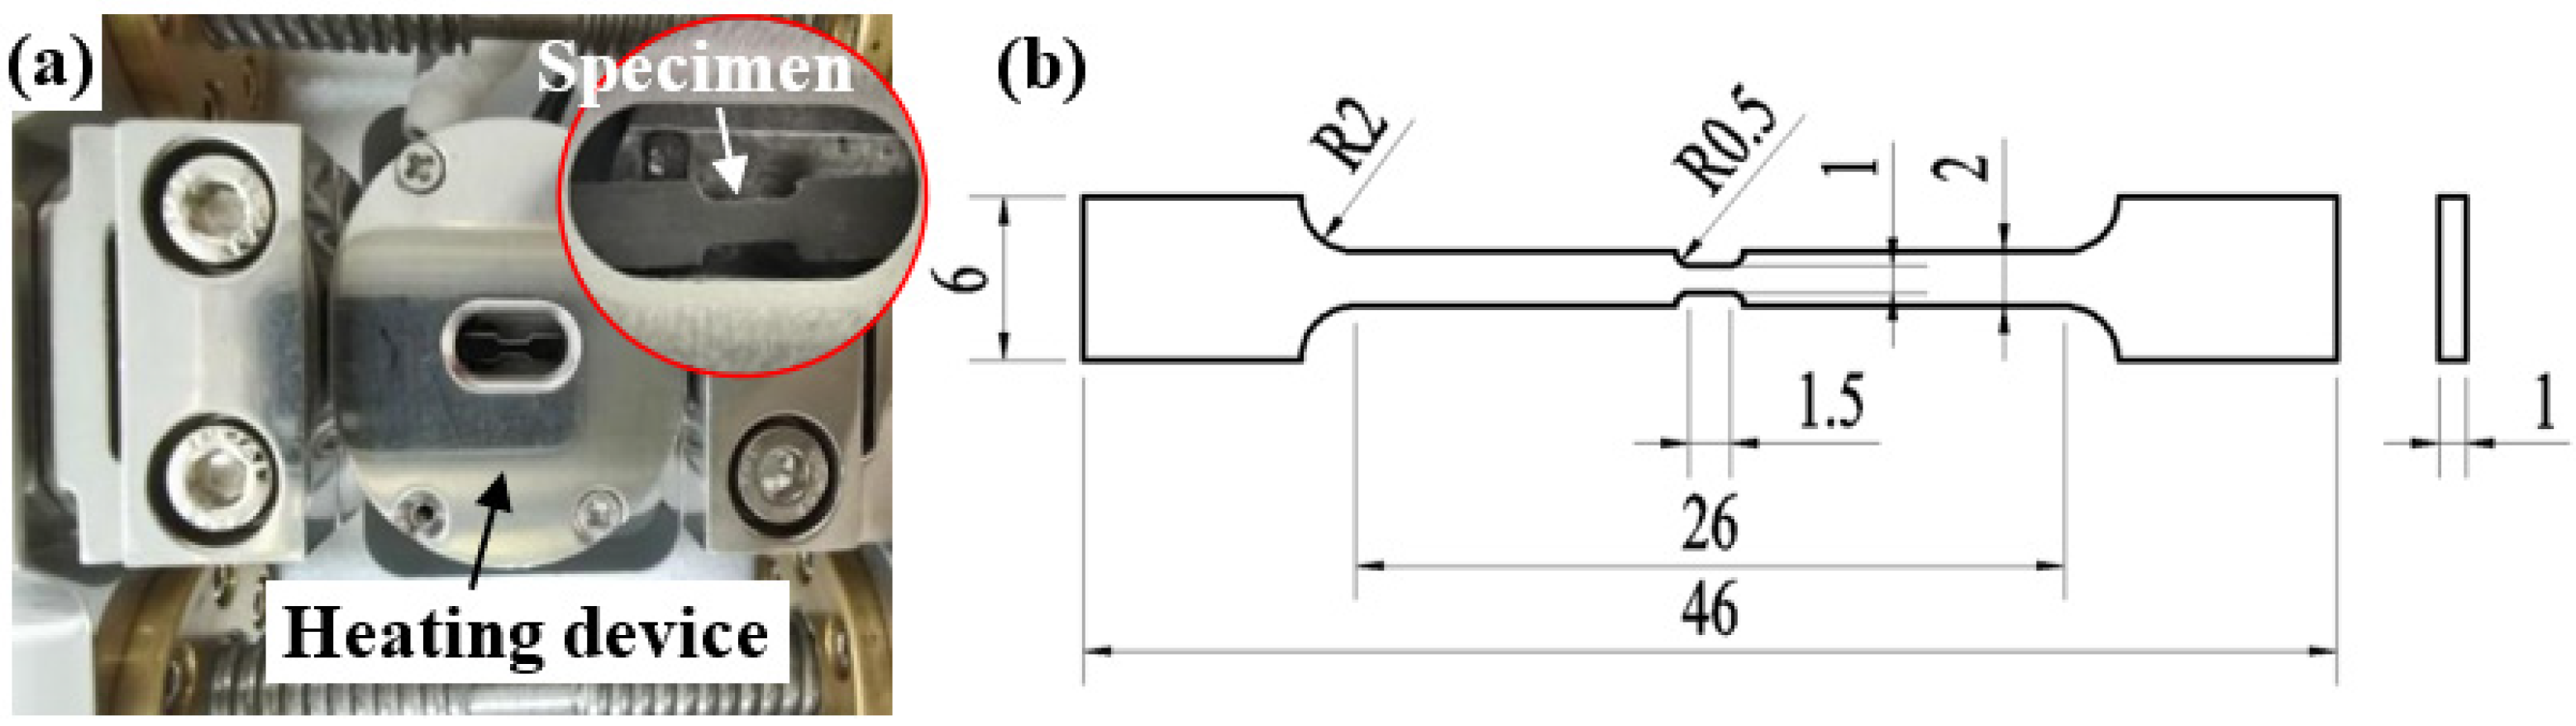
2.2. In Situ Tensile Testing

High-temperature in situ tensile tests were performed on the additional Mini-MTS (Liweiauto Ltd., Hangzhou, China) loading system equipped in a TESCAN MIRA3 SEM (TESCAN Brno,s.r.o, Brno, Czech Republic). The in situ mechanical test bench and heating device are illustrated in Figure 3a. The Mini-MTS Test Control software was used to control the loading speed of 1.5 μm/s and the test temperature of 350 °C. To ensure a uniform temperature distribution, the samples were held for 10 min at the test temperature before stretching. The loading system allows for several interruptions during the tensile test for SEM imaging. By controlling the displacement during in situ stretching, the evolution of the microstructure was observed. The dimensional size of the sample with a thickness of 1 mm is displayed in Figure 3b. The sample surface was polished to a smooth mirror surface with a mixture of SiO2 suspension and 30% H2O2. The in situ tensile tests were repeated three times for each group of experimental conditions, and typical results are provided.

2.3. EBSD Analysis

Electron backscattered diffraction (EBSD) measurements were performed on the samples obtained by in situ tensile testing using an AZtec system (Oxford Instruments Group, Oxford, UK) coupled with a Hitachi-Regulus 8230 cold-field emission SEM (Hitachi High-Technologies Corporation, Tokyo, Japan). The operating voltage used was 20 kV when optimizing the quality of the diffraction patterns. The EBSD samples were electropolished using a solution of 8% perchloric acid (HClO4) and 92% CH4O at −25 °C. A step size of 0.2 μm was used to collect data covering an area of 60 µm × 80 μm. The smaller step size of 0.06 μm was used for microstructural analysis of the 20 µm × 16 µm region. The EBSD data were collected by Channel 5 (HKL-Tango) and ATEX [19].

3. Results

3.1. The Stress–Displacement Curves during In Situ Testing

Figure 4 shows the stress–displacement curves of the bimodal and lamellar microstructures during in situ tensile testing at 350 °C. The drops in the curve indicate that the loading is suspended for SEM imaging during the tensile process. To observe the microstructure evolution during hot stretch, different stages of plastic deformation of the samples were marked, respectively (A, B, and F for the bimodal microstructure, and A’ and F’ for the lamellar microstructure). This indicates that, compared to the lamellar microstructure, the bimodal microstructure results in a lower yield strength (σ0.2) and tensile strength (σb) but a larger tensile displacement (Lmax).
As shown in Table 2, σ0.2 and σb of specimens with a lamellar microstructure are 37.3% and 28.5% higher than those with bimodal microstructure, respectively. On the contrary, Lmax of specimens with a bimodal microstructure is 28.4% larger than that of specimens with a lamellar microstructure.

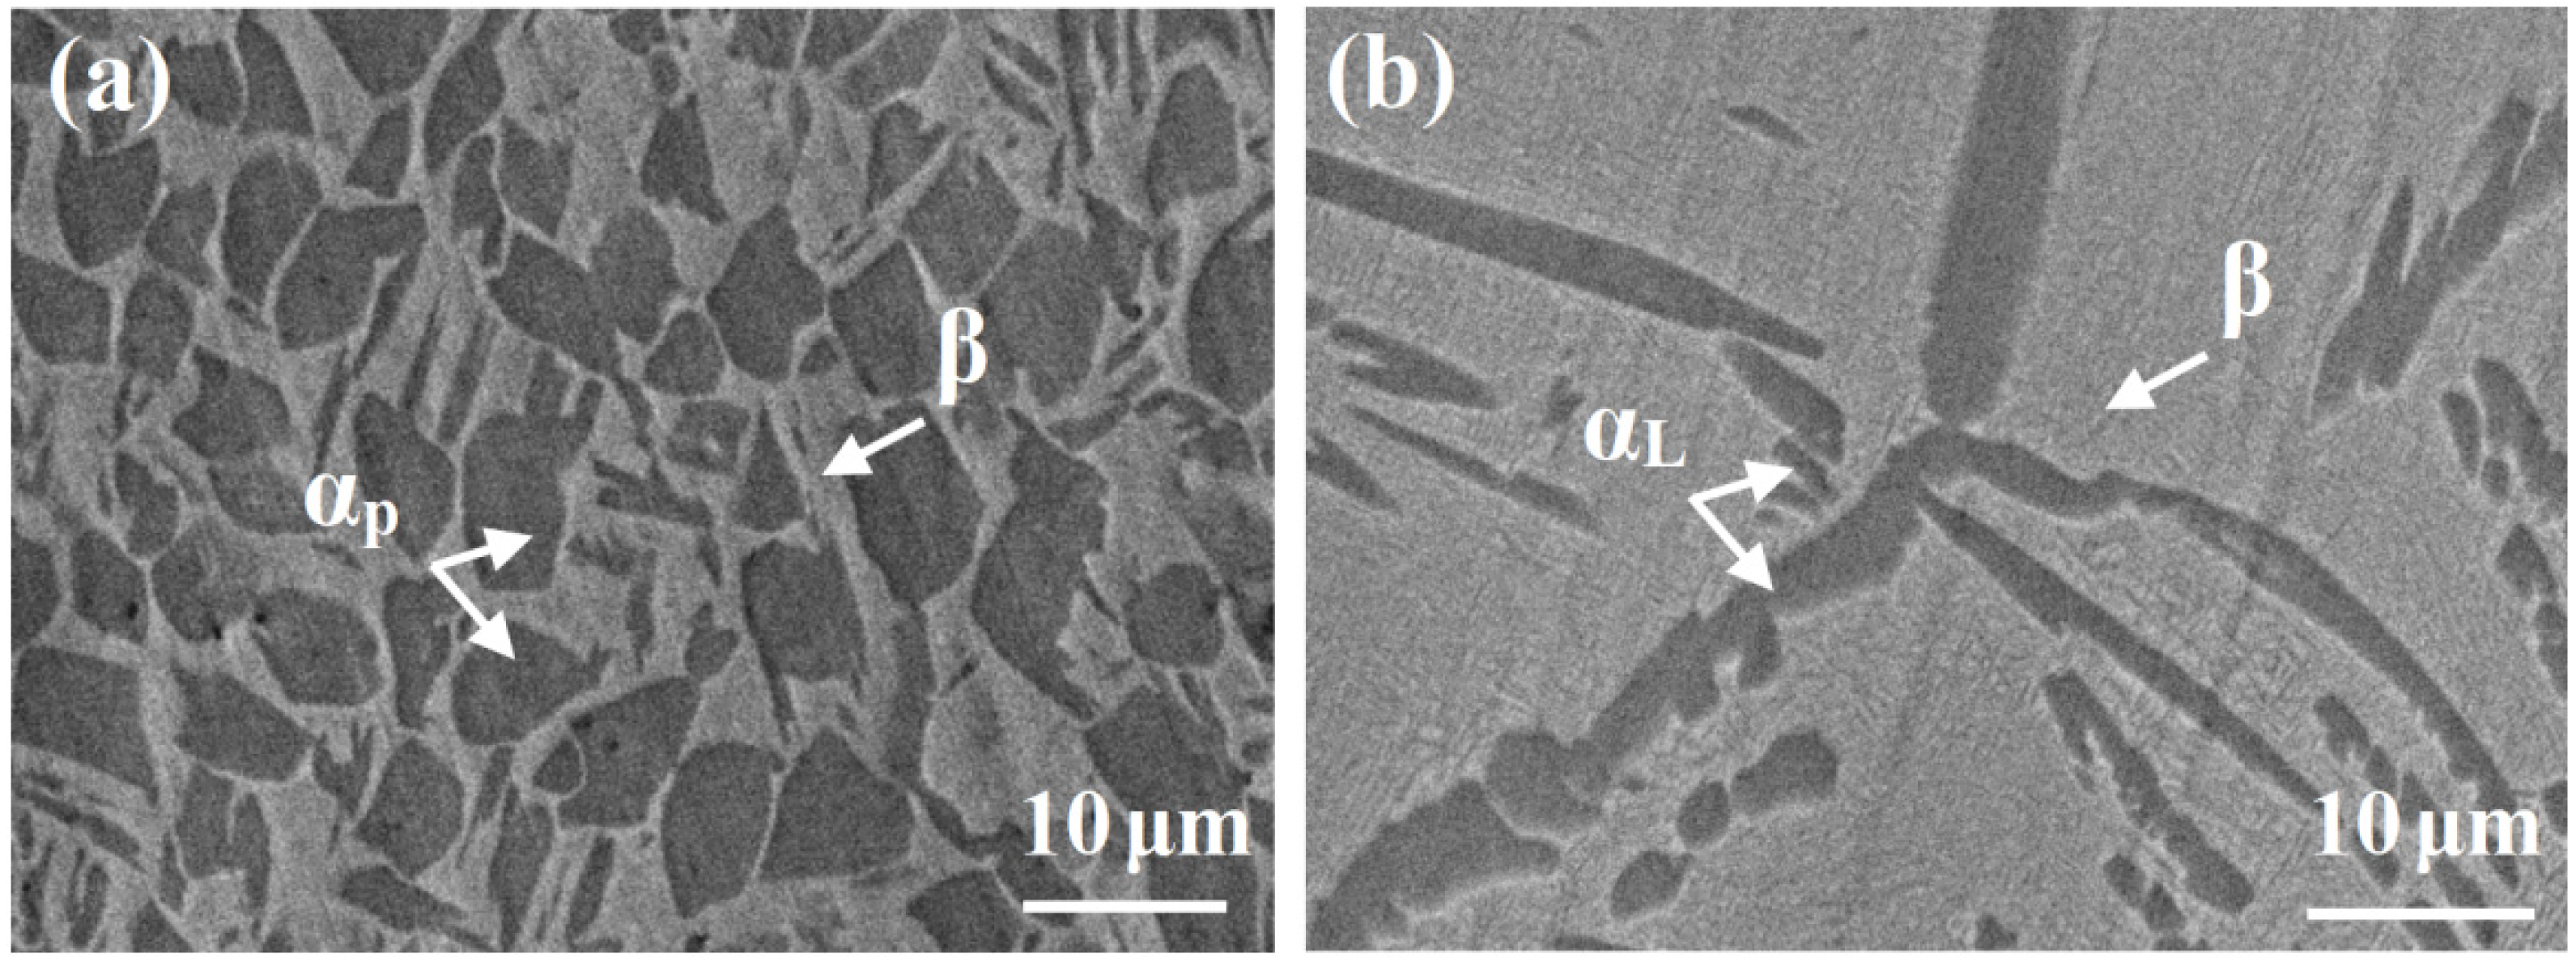
3.2. Microstructural Evolution in the Bimodal Microstructure

Figure 5a illustrates the in situ SEM images of bimodal microstructure at position A. As shown in Figure 5c, some parallel SBs begin to appear within the αP phase. These SBs generally form at an angle of 41° to 49° with the direction of the applied tension [20]. Some of them pass through the αP interface and gradually penetrate the β matrix (Figure 5d). It is worth noting that microcracks first form within the region of the αP phase rather than in the β matrix during the early stage of plastic deformation. As shown in Figure 5b–d, a few microcracks, evolved from the deep SBs in the αP phase, extend macroscopically perpendicular to the tensile direction, which indicates that high stress concentration arises rapidly at the αP phase during hot deformation.
Figure 6 presents the SEM images of bimodal microstructure at position B. As shown in Figure 6a, significant necking is found on the sample. With the increase in strain, the microcracks in Figure 6b widened significantly compared with position A (Figure 5b). Moreover, SBs in the αP phases became more noticeable when they continued by crossing the αp interface and extended into the β matrix. From Figure 6c, the deformation became more severe and SBs occurred in most regions composed of αP phases. In addition, a macrocrack formed at the edge of the sample which exhibited a trend to connect the SBs in the αp phases ahead of the crack tip and gradually grew into the center of the sample. As illustrated in Figure 6d, at the center of the sample, SBs in the αP phases deepened significantly and gradually changed into wave-like shapes due to the increasing distortion in that local region. Moreover, many microcracks were also found to nucleate in these deep SB regions.
Figure 7 shows in situ SEM images of bimodal microstructure at position F (after fracture). The sample was shear-fractured at about 45° to the tensile direction. Its fracture surface is relatively rough and significant necking is observed (Figure 7a). As shown in Figure 7b, many microcracks formed at the region close to the fracture surface which nucleated and generally propagated along the SBs in the αP phase. Moreover, the crack propagation direction always deflected as it crossed the α/β interface, leading to a microscopically tortuous path. This could undoubtedly increase the total length of the crack path and therefore consume more energy before it fractured [21].
Figure 7c illustrates that the SBs in each αP phase had a strong tendency to interconnect. During this process, the direction of SBs changed significantly at the αP interface. Moreover, a dendritic crack formed on the edge of the sample (Figure 7d) whose path deflected or branched frequently during its progress to the center of the sample at about 45° to the tensile direction. Furthermore, many microcracks can be observed near the fractured area (Figure 7f) which implies that the sample underwent severe plastic deformation before fracture.

3.3. Microstructural Evolution in the Lamellar Microstructure

Figure 8 presents SEM images of the lamellar microstructure during in situ stretching at position A’. As shown in Figure 8b,d, many parallel SBs appeared first in the αL phases near GB, while they can hardly be observed in the β matrix. As illustrated in Figure 8c, a microcrack developed in a long, coarse αL phase at a trigeminal GB. This was akin to the findings of Wang et al. [16] from the in situ tensile testing of Ti-54432 alloy at room temperature, which indicated that microcracks readily nucleated at trigeminal GBs due to the significant stress concentration therein.
Figure 9 illustrates SEM images of a lamellar sample during stretching in situ at position F’. Differing from bimodal samples, no obvious necking can be observed until the fracture of the lamellar sample (Figure 9a). This indicates that the plastic deformation therein is not evident. This can be further proved from Figure 9b,c that only slight distortion and certain microcracks are illustrated in the β matrix in the region adjacent to the fracture surface which is significantly smaller than that in specimens with a bimodal microstructure.
Figure 9d shows that, at the region near the fracture surface, a microcrack just initiated at and propagated along the large αL phase at GB. The main crack of the lamellar microstructure grew almost only along the GB which led to the intergranular fracture of the sample (Figure 9e,f). The magnified image in Figure 9f clearly indicates that a microcrack nucleated and grew only along the αL phase at GB. Moreover, there were many fine dimples and tearing ridges at the fracture surface which might be caused by the plastic deformation of the αL phase at GB during the final fracture process. This explains the minor elongation of the lamellar microstructure at the elevated temperature.

4. Discussion

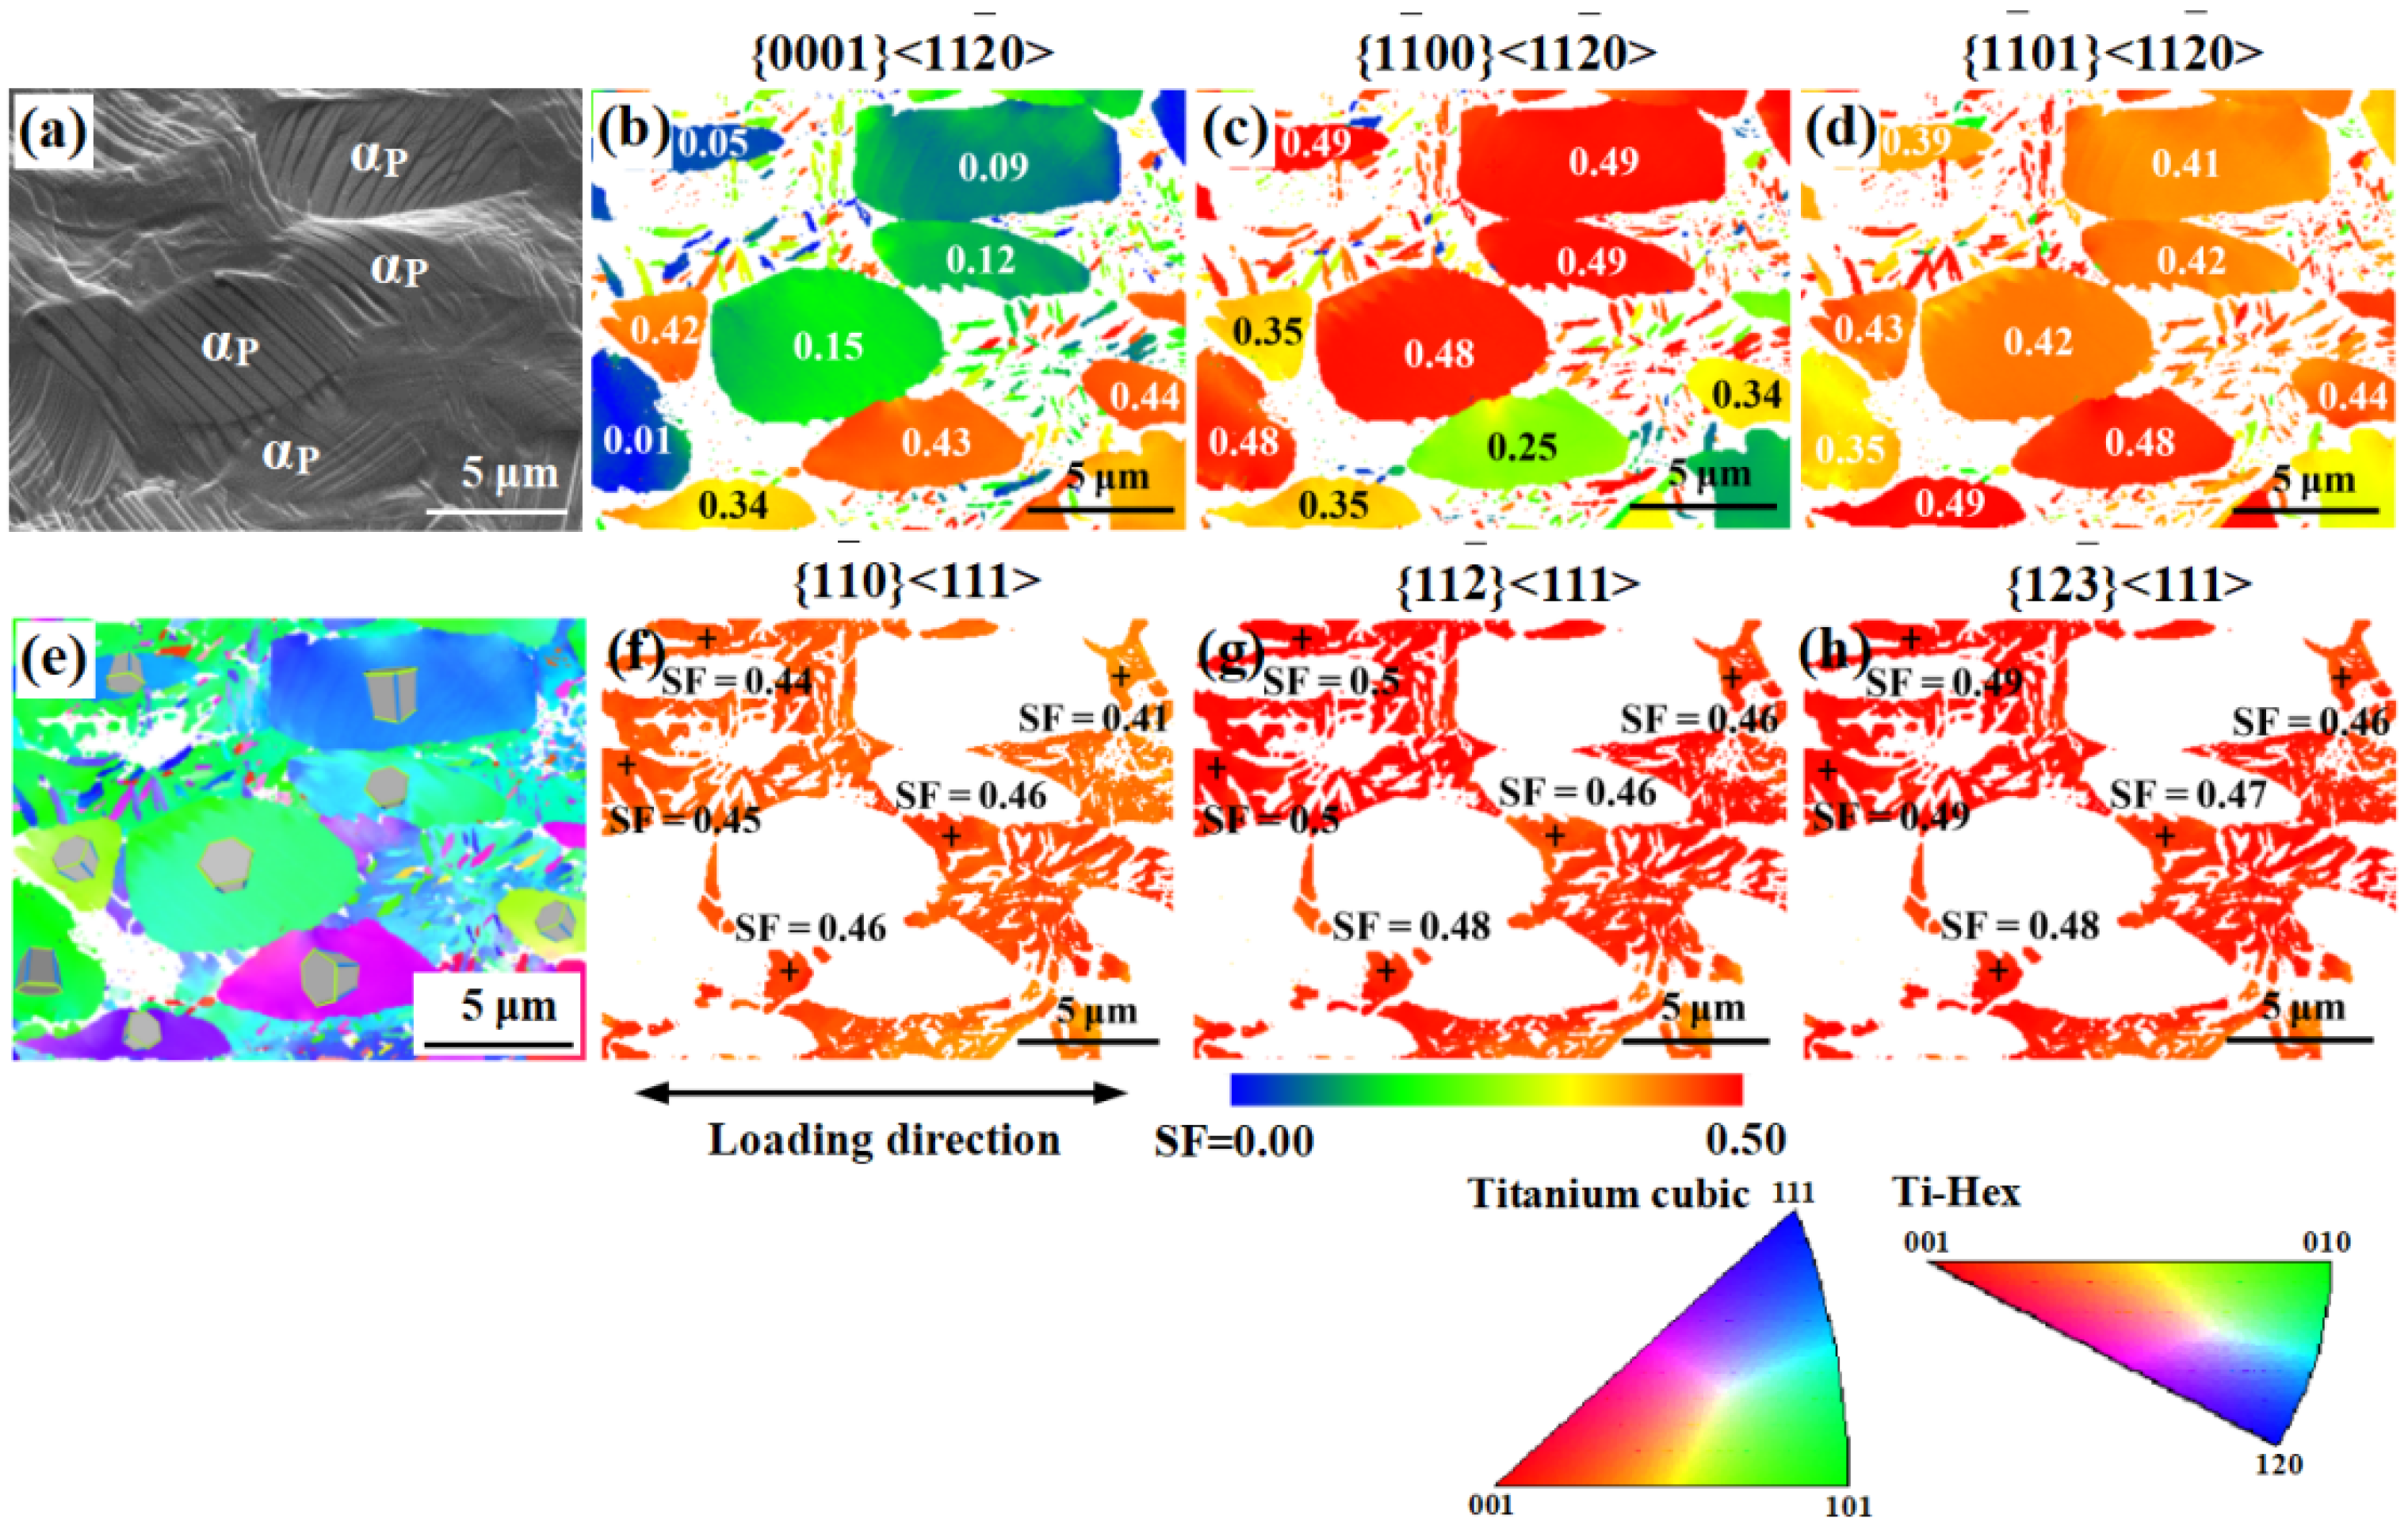
4.1. Activation of Slip Systems

To identify the activated slip systems of the alloy during hot deformation, EBSD of the bimodal microstructure after in situ stretching was analyzed and the results are illustrated in Figure 10.
In Figure 10a, many SBs are generated within regions composed of αP phases. This indicates that dislocation slip is the dominant deformation mechanism of the α phase at the applied temperature [22]. Our previous study indicated that pyramidal slip is difficult to take place within the αP phase which is more likely to slip along its basal or prismatic plane at room temperature [23]. In the present study, Figure 10b–d show that prismatic slip ({1 1 ¯ 00}<11 2 ¯ 0>) and pyramidal slip ({1 1 ¯ 01}<11 2 ¯ 0>) were prevalent in the αP phase compared with basal slip ({0001}<11 2 ¯ 0>). According to the study by Lecomte et al. [24], the most common slip system is the pyramidal system for α phases in the range of 150–300 °C, and prismatic slip is the common mode of deformation at temperatures above 300 °C. The fact that basal slip is not the main slip system is the result of the combined influence of the hcp crystal structure properties of the α phase and the applied temperature. Turner et al. [25] stated that due to the changes in lattice parameters at an elevated temperature, the c/a ratio of the α phase with hcp crystals might be less than 1.6333. This leads to the (0001) basal plane no longer being the only close-packed plane, whereas the prismatic slip and pyramidal slip become the main mode of deformation [25].
As presented in Figure 10f–h, there are no significant differences in the Schmidt factor (SF) values among the main slip systems in the β phase [26,27], i.e., {1 1 ¯ 0}<111>, {11 2 ¯ }<111>, and {12 3 ¯ }<111>. Thus, a variety of slip systems can be activated simultaneously and the long-range slip along a single slip system might not be able to take place in the β matrix. Consequently, it is difficult to observe significant SBs along some specific crystal planes in the β matrix. Due to its excellent coordinated deformation capacity, the microcrack can seldomly initiate in the β matrix [28].
To explore the slip characteristics in the bimodal microstructure during hot deformation, a EBSD analysis of a large number of αP grains were carried out for the sample in situ stretched at 350 °C, which allowed a statistical analysis of the nature (basal, prismatic, and pyramidal) and distribution of the slip systems in αP.
According to the statistical results in Figure 11a, the SF values of prismatic slip in αP mostly concentrated at the range of 0.35–0.50. Therefore, this relatively large SF value distribution in the αP phase might account for the main slip system of prismatic slip during in situ stretching at 350 °C. Figure 11b–g present several typical SB morphologies in αP phases. As shown in Figure 11b, multislip systems were activated in grain 1. Combined with Figure 11h,i, it can be determined that the specific slip systems activated were the (001)[1 2 ¯ 0] of basal slip and (0 1 ¯ 0)[2 1 ¯ 0] of prismatic slip. The activation of the multislip system helped to coordinate further the overall deformation of the polycrystal. Grains 2 and 3 formed slip steps on the surface due to the repeated dislocation slipping along certain planes since the mobility of dislocations was enhanced significantly at a higher temperature. During high-temperature in situ stretching, microcracks tend to initiate at SBs in the αP phase, probably due to the increasing demand for stress relief [29].
By calculating SF values, it is possible to reveal qualitatively the initiation trend in various dislocation slip mechanisms in specimens with a lamellar microstructure. Figure 12 shows the SF distribution in the observation region. Figure 12b implies that the SF value of basal slip in the αL phase is less than 0.10, namely, the basal slip system is hard-orientated and difficult to activate. In Figure 12c,d, the SFs of prismatic and pyramidal slip systems are soft-orientated and easy to activate with relatively large values (SF ≥ 0.37). Therefore, in specimens with a lamellar microstructure, the αL phase was more inclined to activate prismatic slip and pyramidal slip.
Figure 13 shows statistics of slip deformation modes and SF distributions of the αL phase in specimens with a lamellar microstructure. As shown in Figure 13a, the SF values of prismatic slip were mainly concentrated between 0.45 and 0.50, which dominated the slip activities during the in situ tensile process at 350 °C. In Figure 13b–g, two typical slip systems were activated in the αL phase: (100)[ 1 ¯ 20] of prismatic slip (grain 4) and (011)[ 2 ¯ 10] of pyramidal slip (grain 5). During plastic deformation at elevated temperature, to coordinate deformation, slip cannot only be activated in the optimal orientation of the grain, but also in the relatively more difficult orientation [30].
Due to the limited slip systems of the α phase, once the plastic deformation in the αL phase accumulated to a certain extent and no new plastic deformation mechanism (e.g., mechanical twinning and phase transformation) was generated to coordinate the deformation, microcrack nucleation would occur at SBs in the αL phase due to the pile-up of a large number of dislocations therein [31].

4.2. Characteristics of Deformation and Fracture

The in situ observation of microstructure evolution of bimodal and lamellar microstructures during in situ stretching at 350 °C infers that the deformation and fracture behavior of Ti-55511 alloy are closely related to slip characteristics in the α phase.
Figure 14 shows the schematic diagram of the deformation mechanisms and microstructure evolution of bimodal and lamellar microstructures at 350 °C. At the initial stage of bimodal microstructural deformation (Figure 14b), several parallel SBs along certain slip planes formed within the αP phase. Since the αP phase has a limited deformation coordination ability [29], the formation of SBs inside the αP phase can be deemed a good way of releasing the local stress concentration therein. As the deformation further progresses, some slip systems (focused on prismatic slip and pyramidal slip) were activated to further coordinate the rising deformation during which multislip occurred. Dislocation climbing might occur at an elevated temperature [32,33], which weakened the hindering effect of the αP/β interface on dislocations to a significant extent. Thus, with the further increase in strain, the SBs gradually cut across the αP/β interface and extended into the β matrix or adjacent αP phase. During this process, the SB deflected significantly to accommodate the slip systems between the neighboring grains. Meanwhile, the SBs in adjacent αP phases exhibited a strong tendency to bridge with each other because of the significant stress concentration present in the region between SBs.
With the cyclic-loading processes, microcracks first initiated within the region of the αP phase due to the repeated dislocation slipping along certain slip planes (Figure 14c). Subsequently, several microcracks could evolve from the deep SBs in the αP phase. Like the deflection of SB, once the microcracks passed through the phase interface, the propagation direction would also change, resulting in a tortuous crack propagation path. Then, many microcracks in the αP phase interconnected along the 45° direction under the strong shearing force in that direction. This finally results in the fracture of the sample. Therefore, as shown in Figure 7, the crack propagation path in the bimodal microstructure is evidently tortuous with frequently deflected or branched cracks. This fracture mechanism endowed the sample with excellent plasticity.
In regions with a lamellar microstructure (Figure 14d), the αL phases are mainly distributed at GBs and separate the β matrix into many relatively isolated regions, which produce a strong fencing effect on the dislocation in β. The dislocations in β do not readily cross regions consisting of the αL phase and enter neighboring β grains. This makes it difficult for the long-range slip of dislocations and large plastic deformation to develop within the β matrix (Figure 14e). Due to this fencing effect of the αL phase, the SBs, dominated by prismatic slip and pyramidal slip, first appear in the αL phase near the GB due to the significant stress concentration therein, especially for the trigeminal GB where deformation coordination is hard to achieve. When the deformation is insufficient to accommodate the plastic strain, microcracks easily nucleate at the αL interface boundary at GB. Once the cracks nucleate, they will propagate along the GBs which are thought to be low-energy channels that facilitate crack propagation (Figure 14f). This accounts for the lower ductility of specimens with a lamellar microstructure compared with those having a bimodal microstructure.

5. Conclusions

In this study, the effects of bimodal and lamellar microstructures on the mechanical deformation behavior of Ti-55511 titanium alloy at 350 °C were investigated. The main findings can be summarized as follows:
(1)
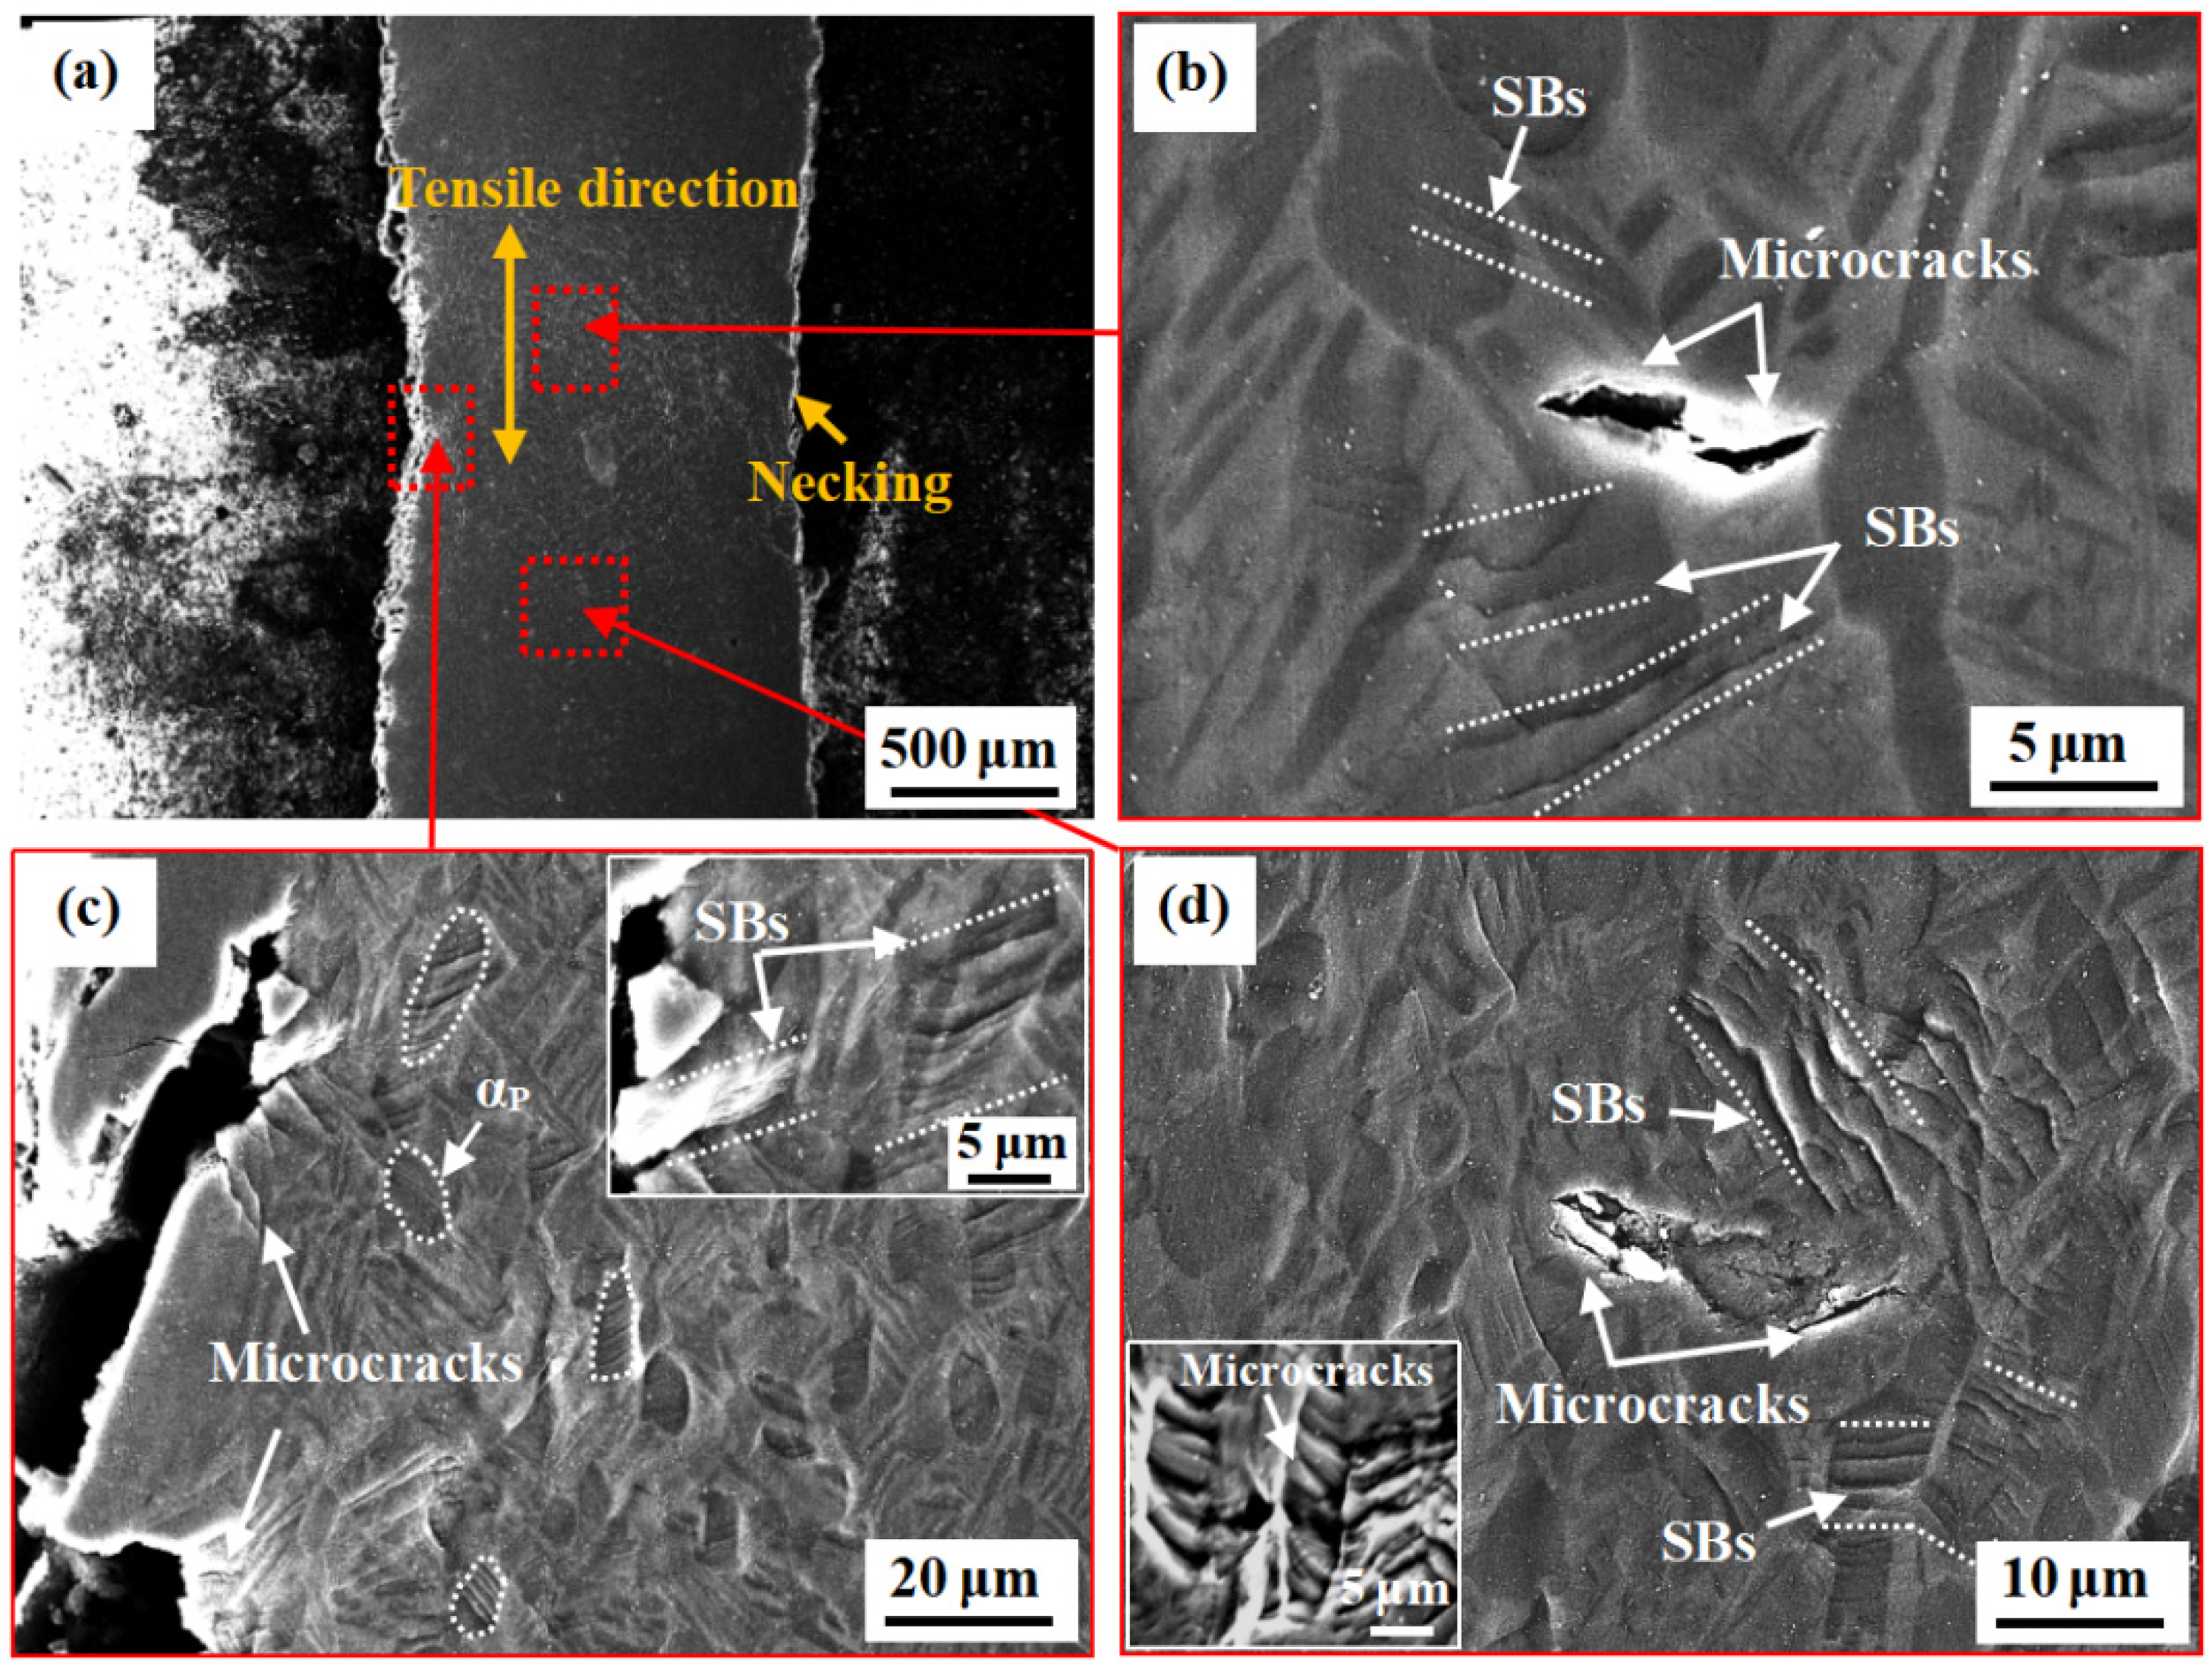
Multislip systems are activated in the αP phase to adapt to the plastic strain during the in situ tensile process of bimodal microstructural evolution. The slip modes are dominated by prismatic slip and pyramidal slip.
(2)
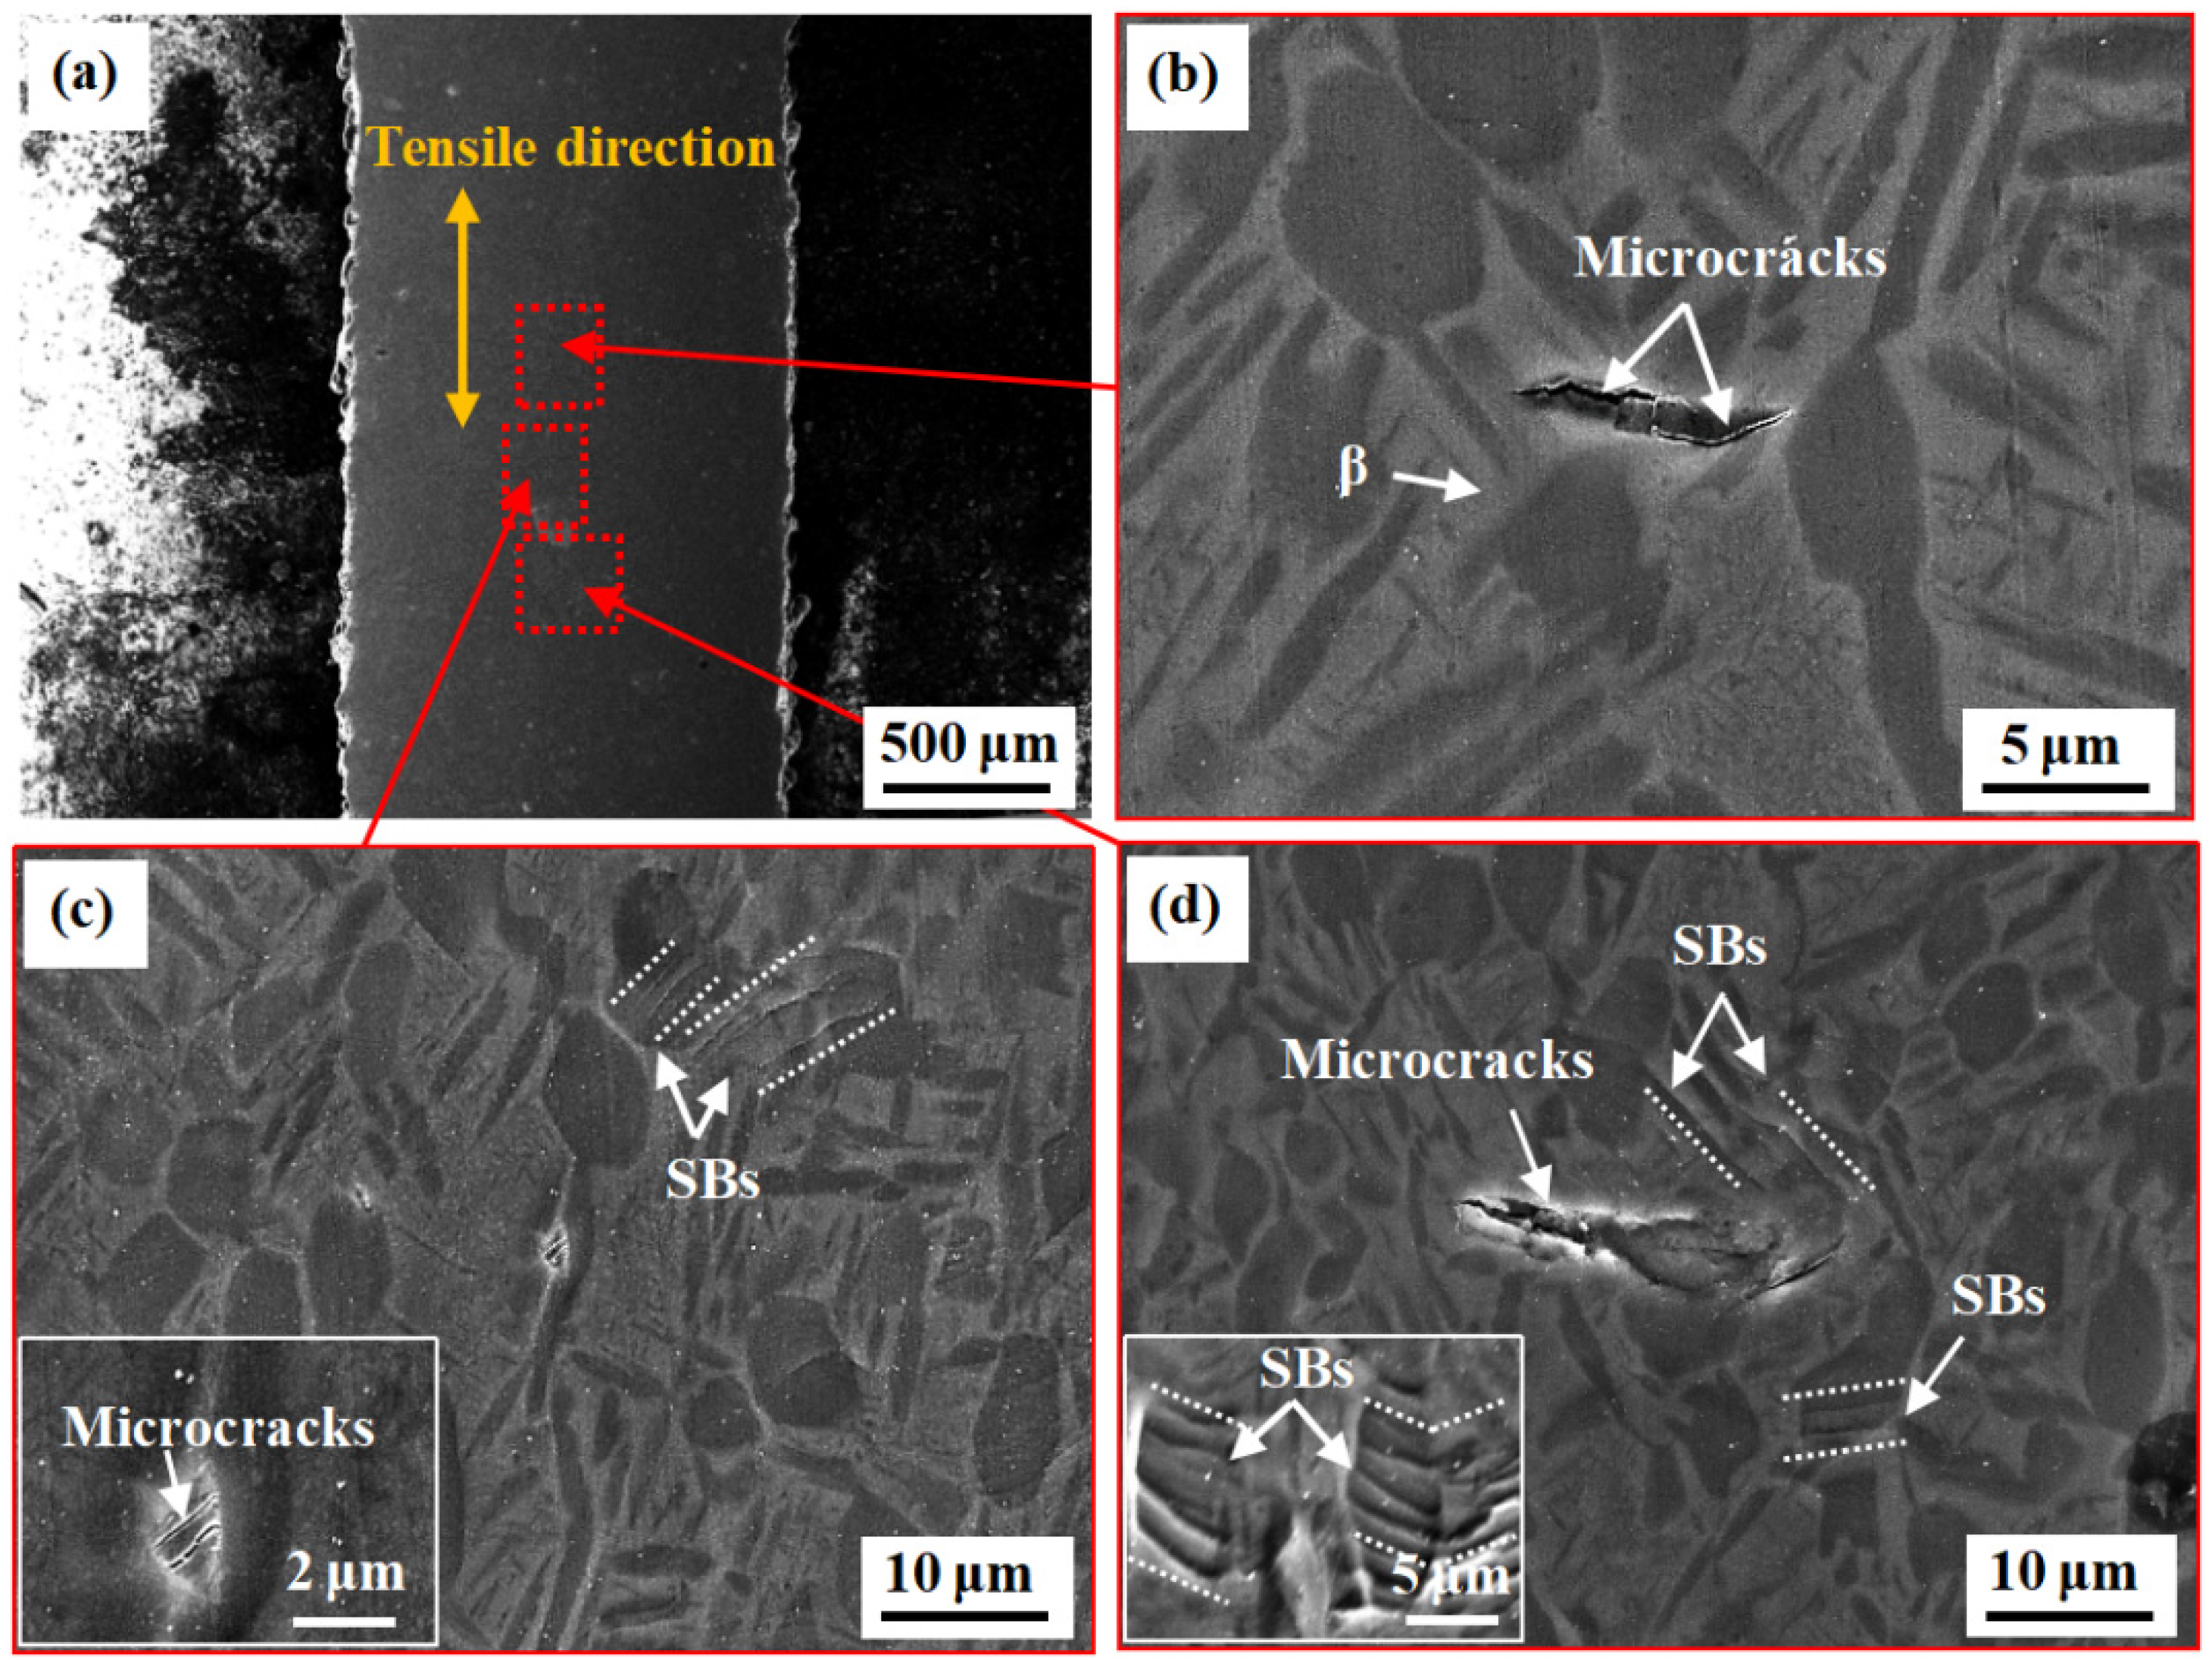
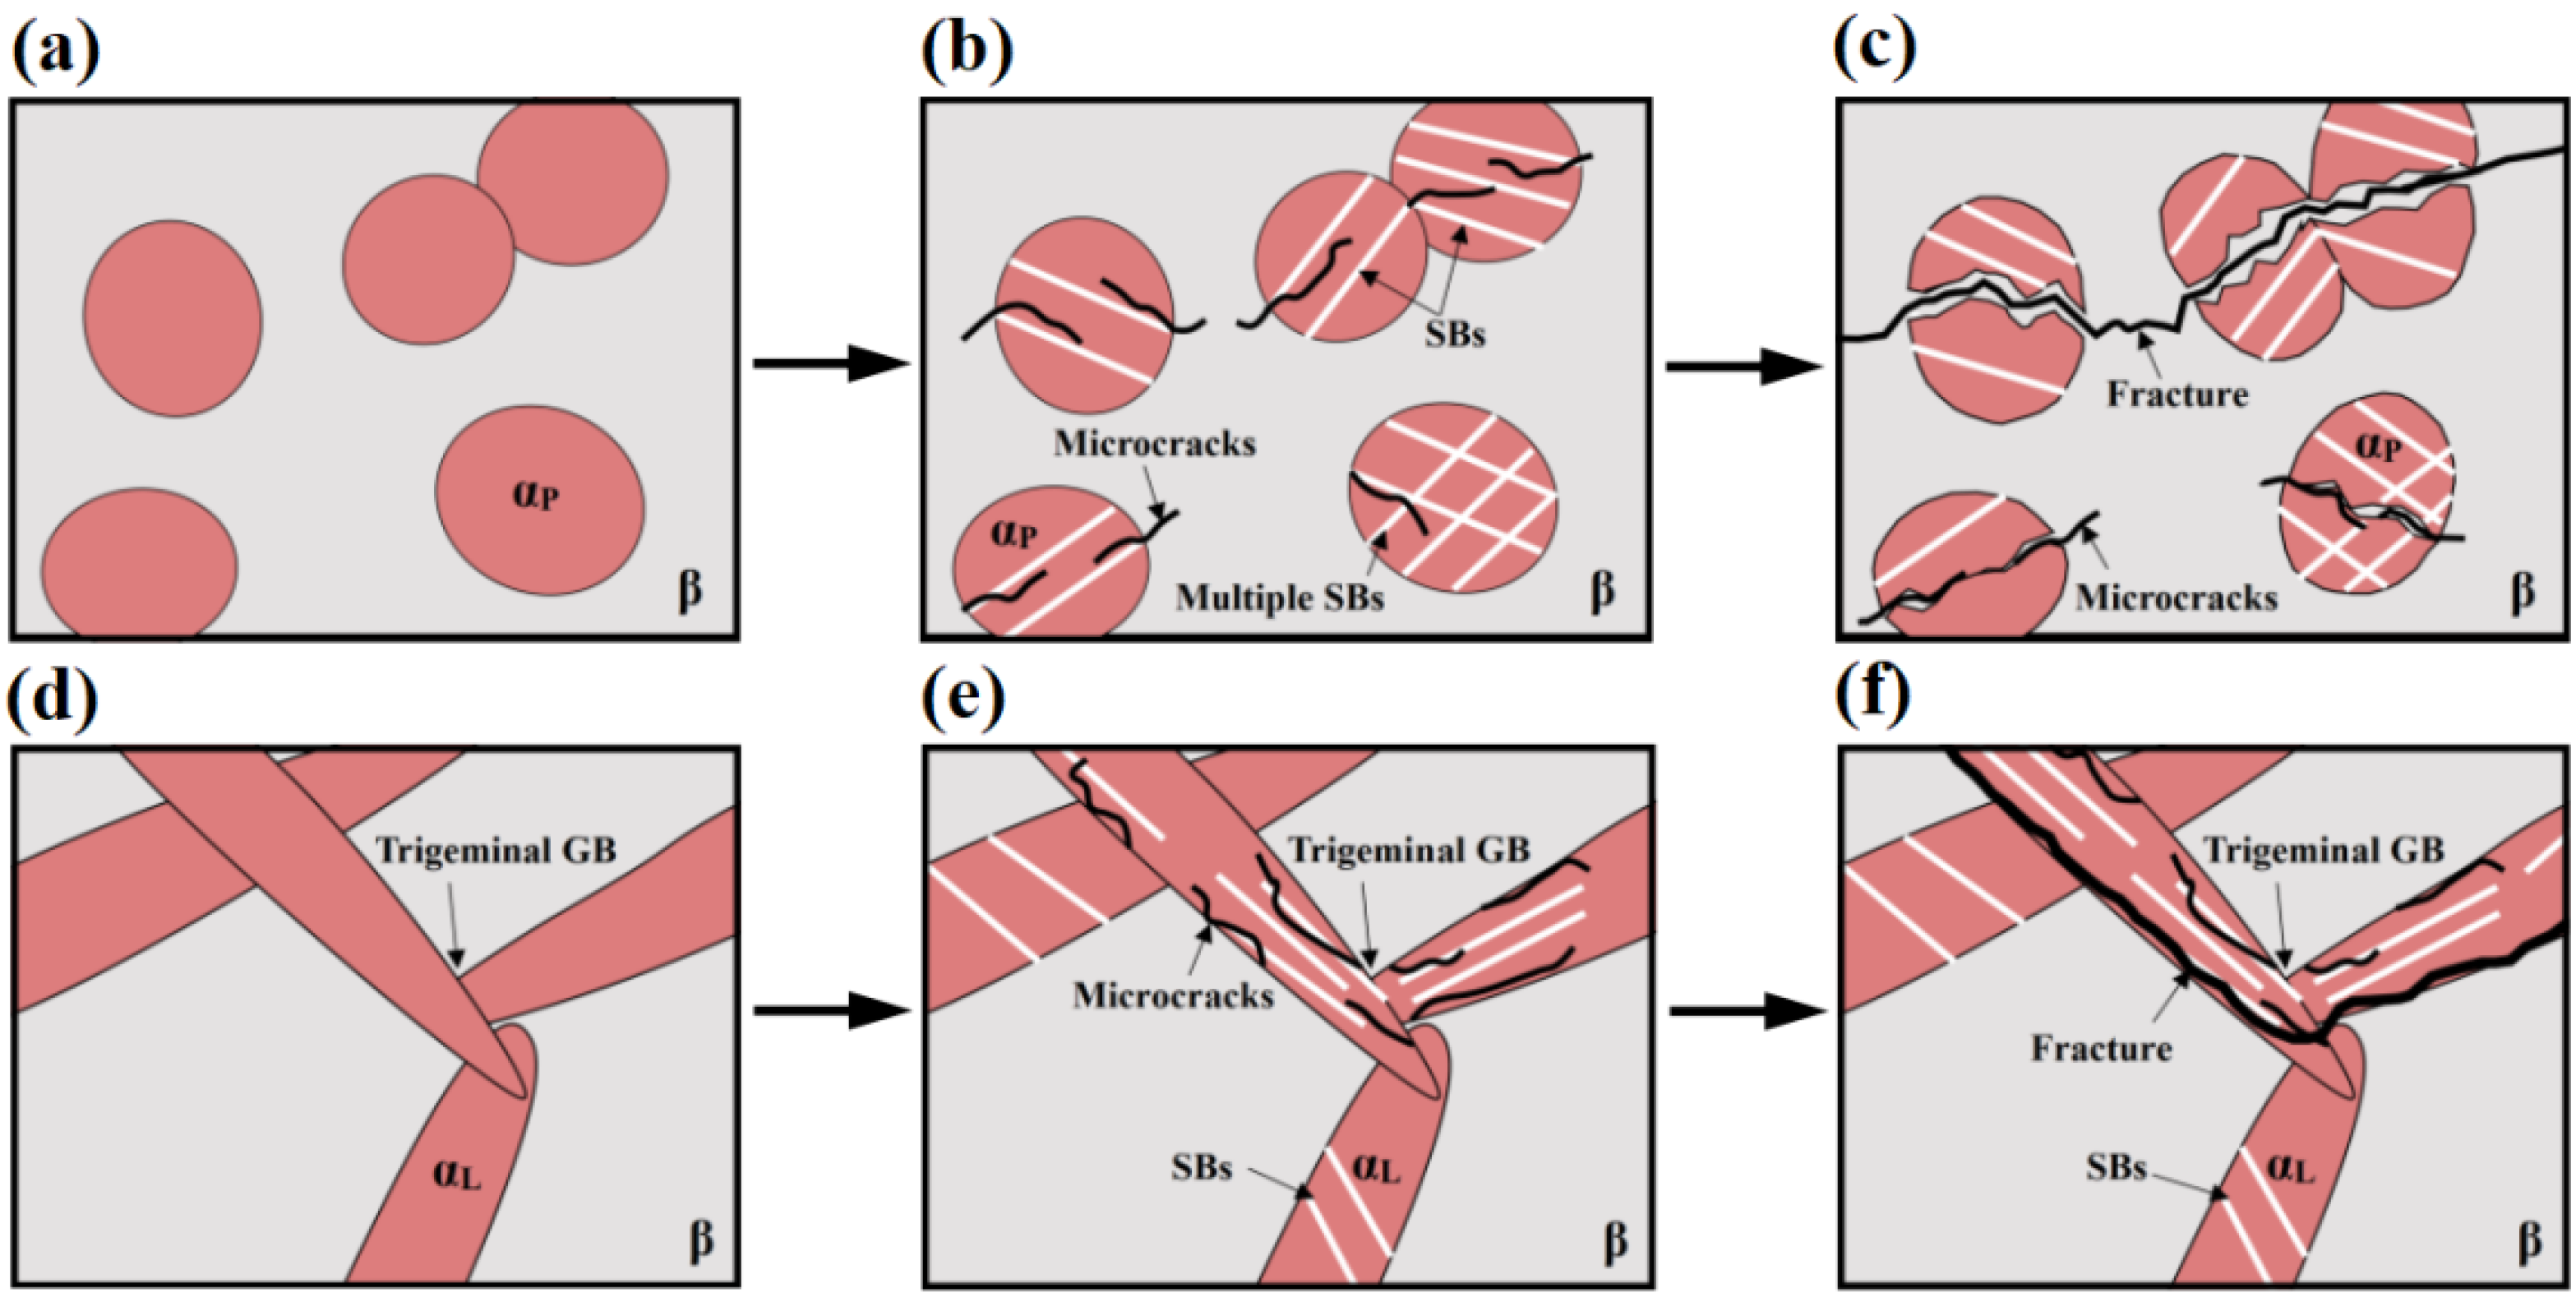
During in situ stretching at 350 °C, there is a strong bridging tendency of SBs in adjacent αP phases towards coordinated deformation and alleviation of the stress concentration.
(3)
The SBs in the αP phase are the preferred crack nucleation sites due to their limited deformation ability. They are also likely to connect with the main crack during crack propagation.
(4)
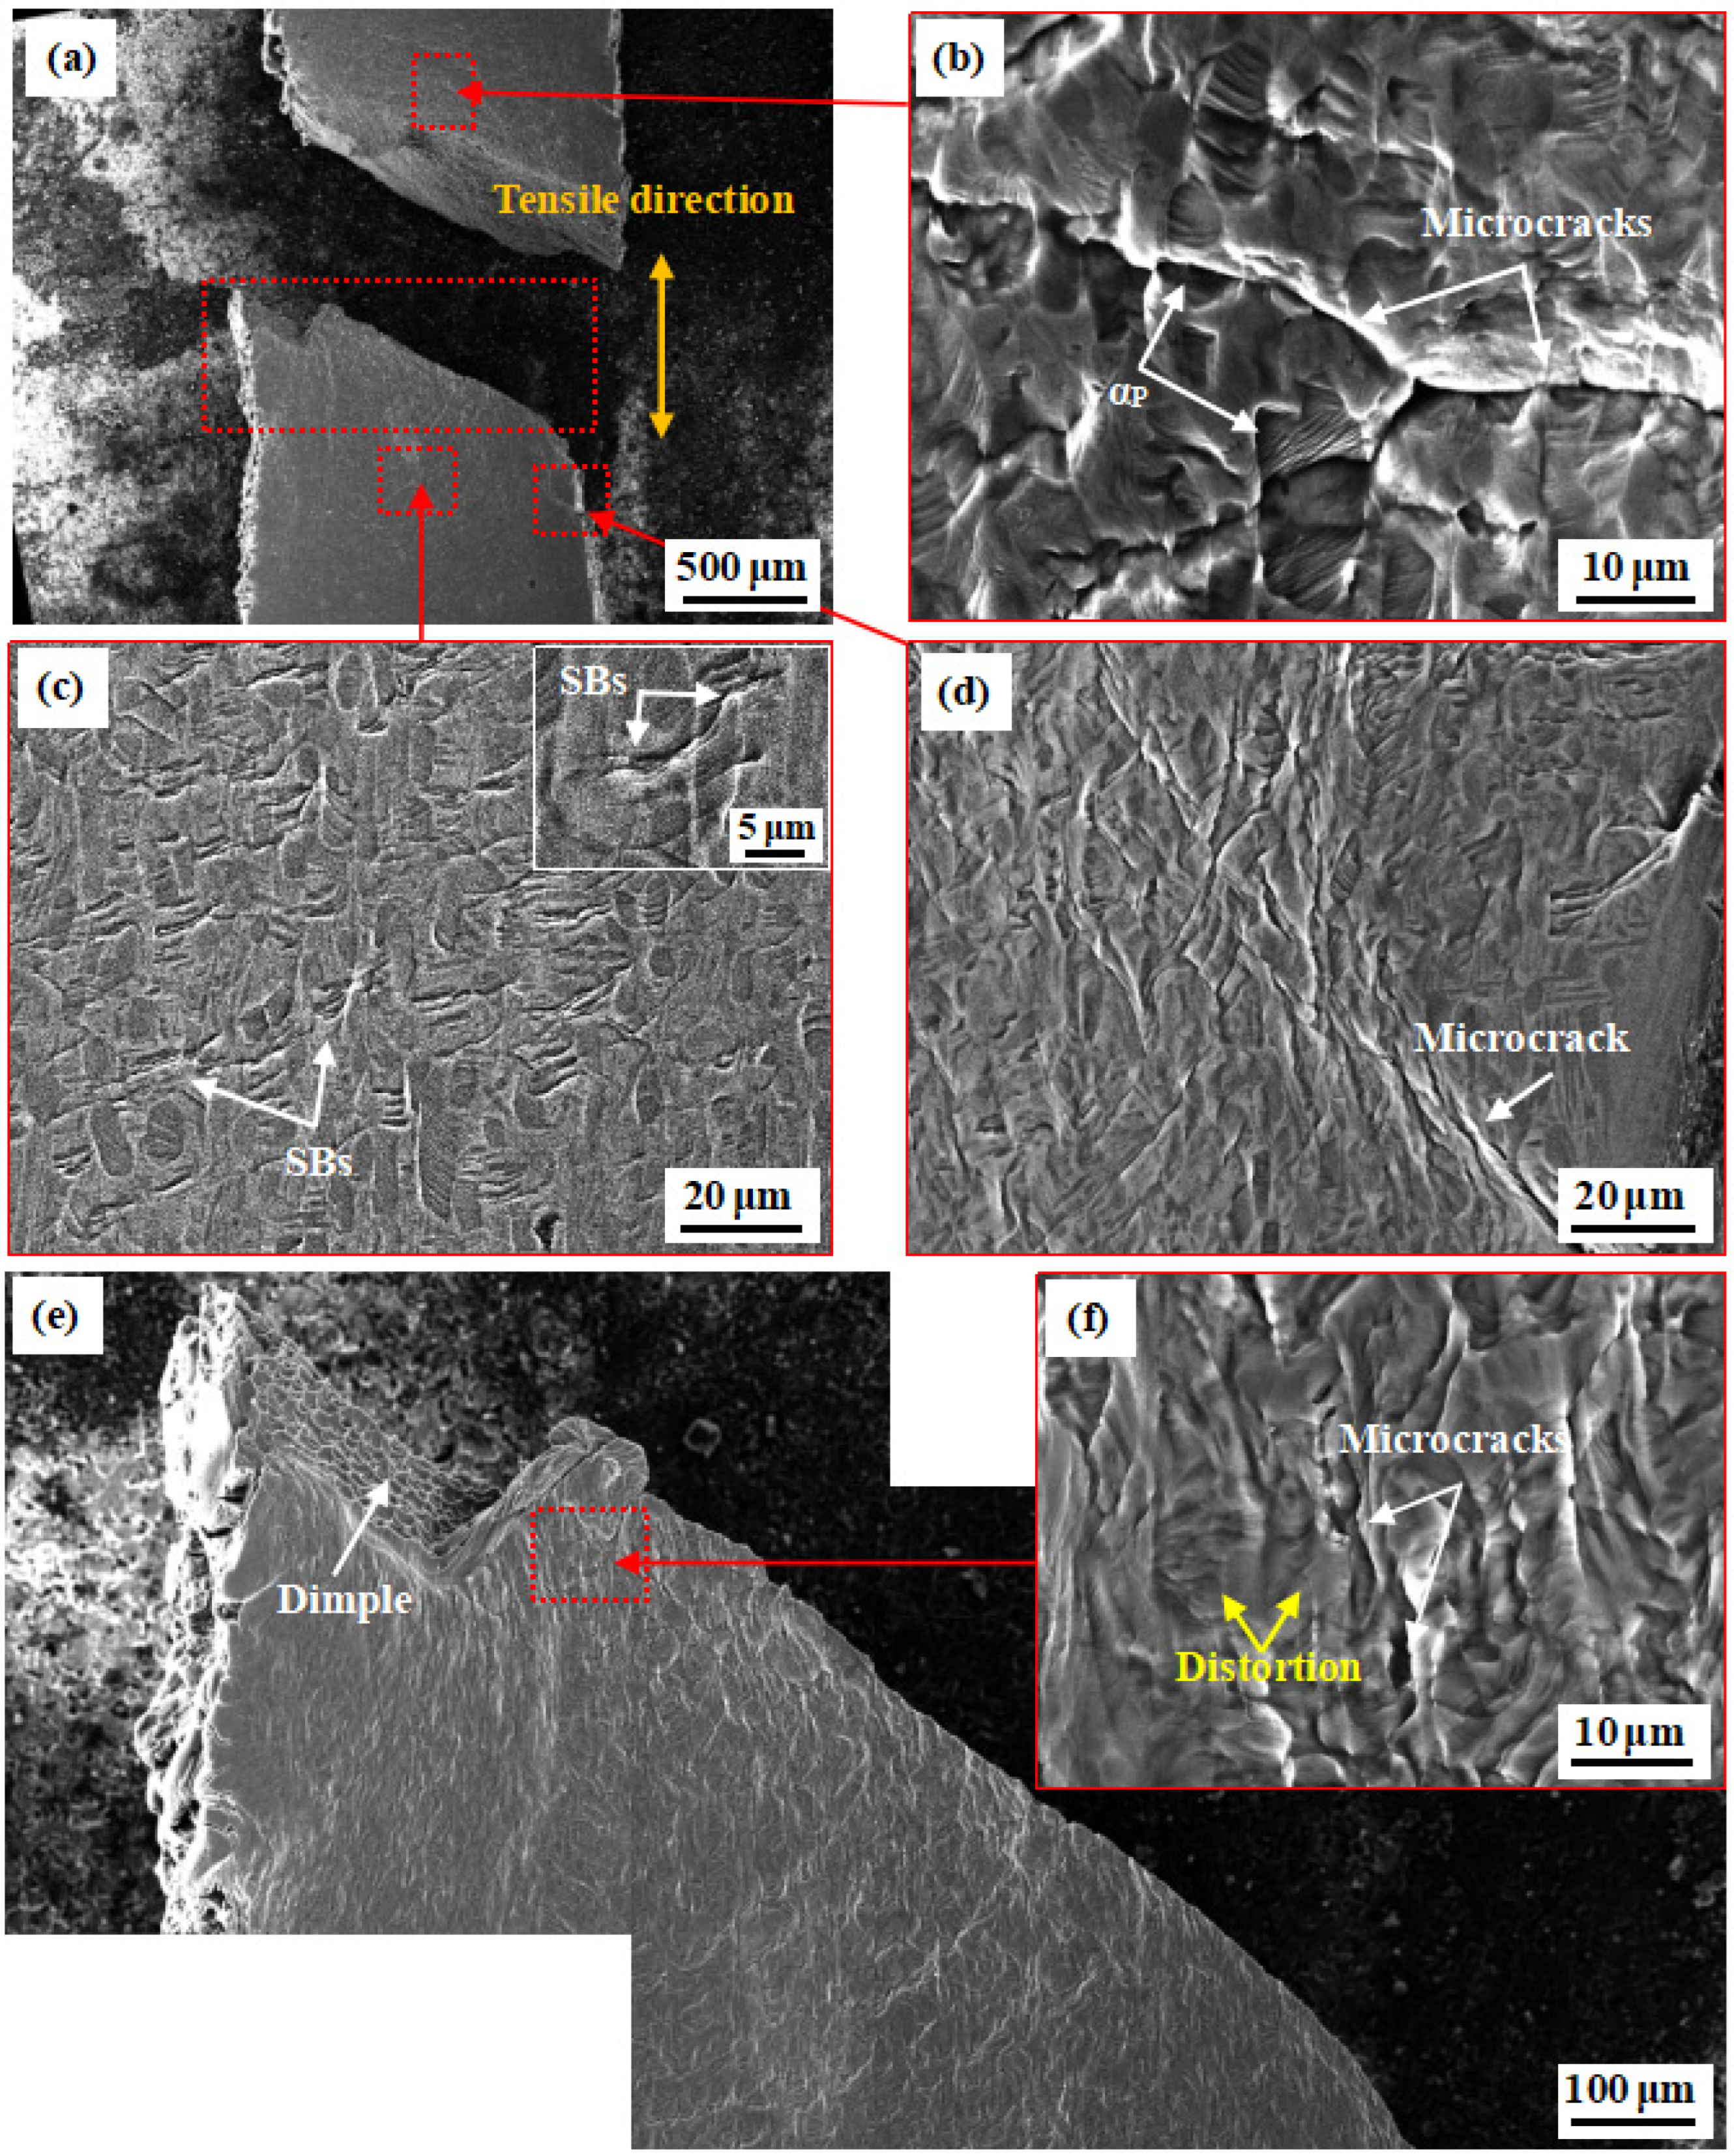
Once the crack crosses the αP/β phase boundary, the crack always deflects significantly, which gives rise to a tortuous crack path and endows specimens with a bimodal microstructure with excellent plasticity.
(5)
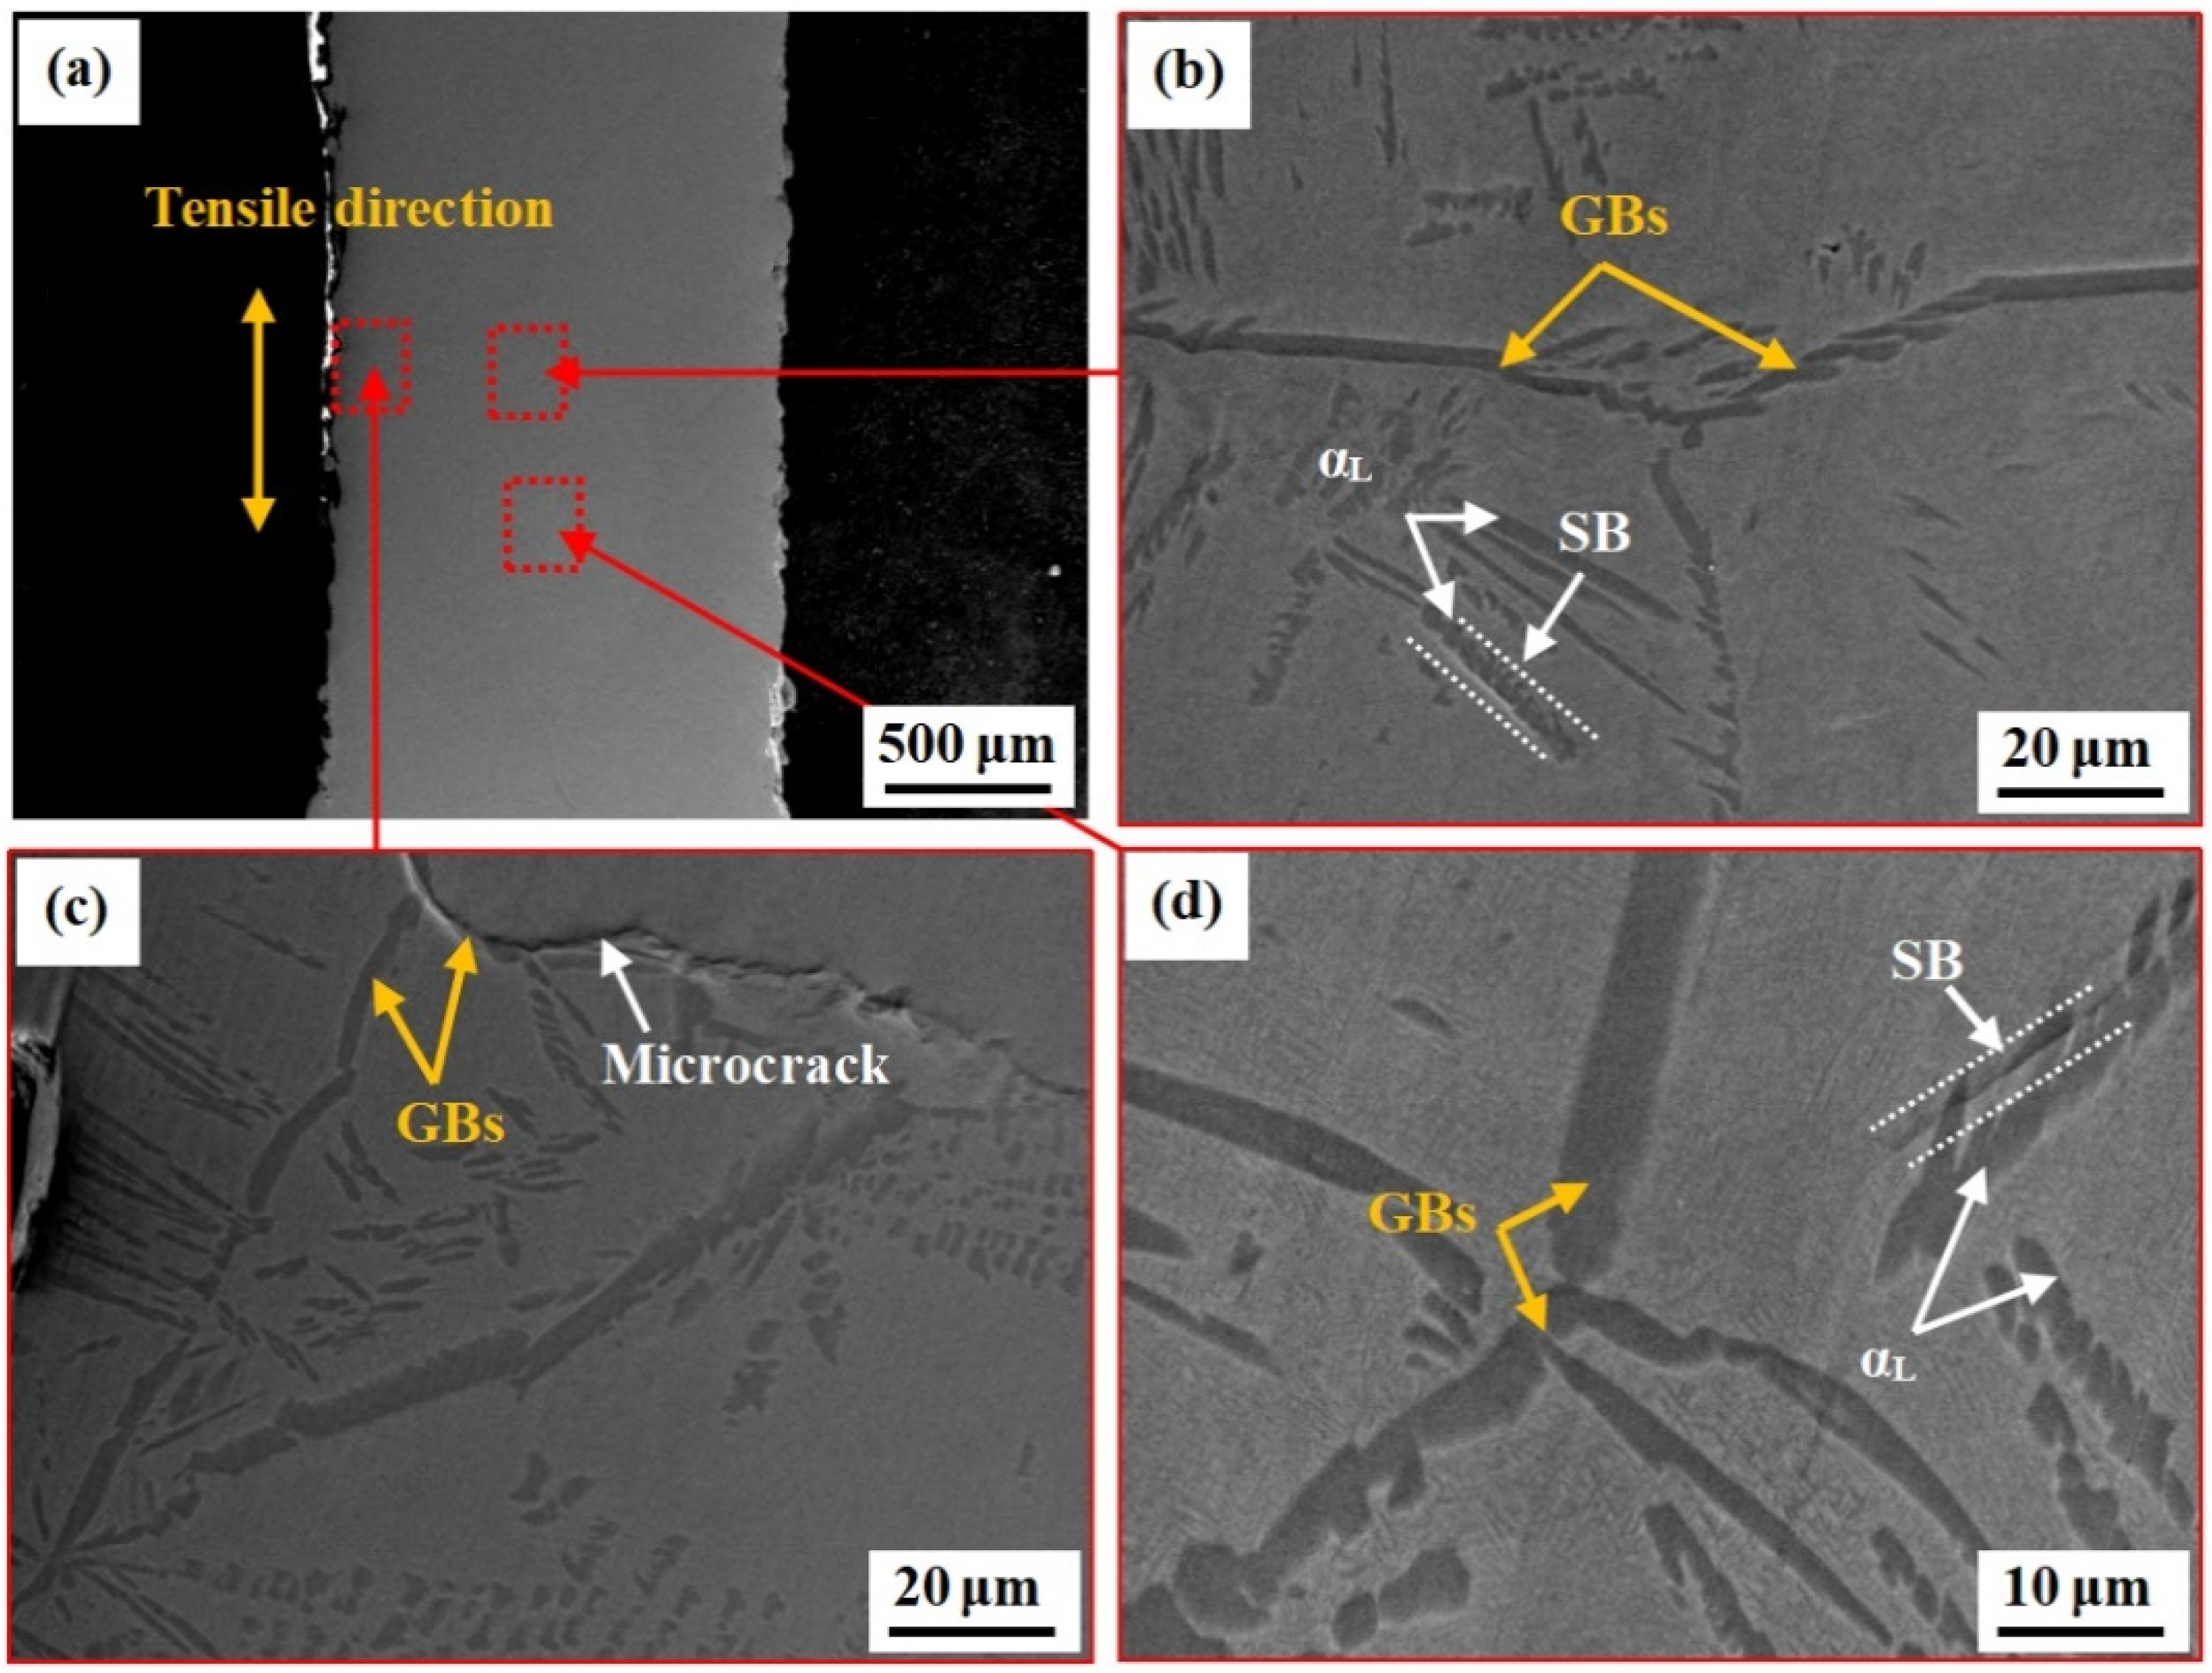
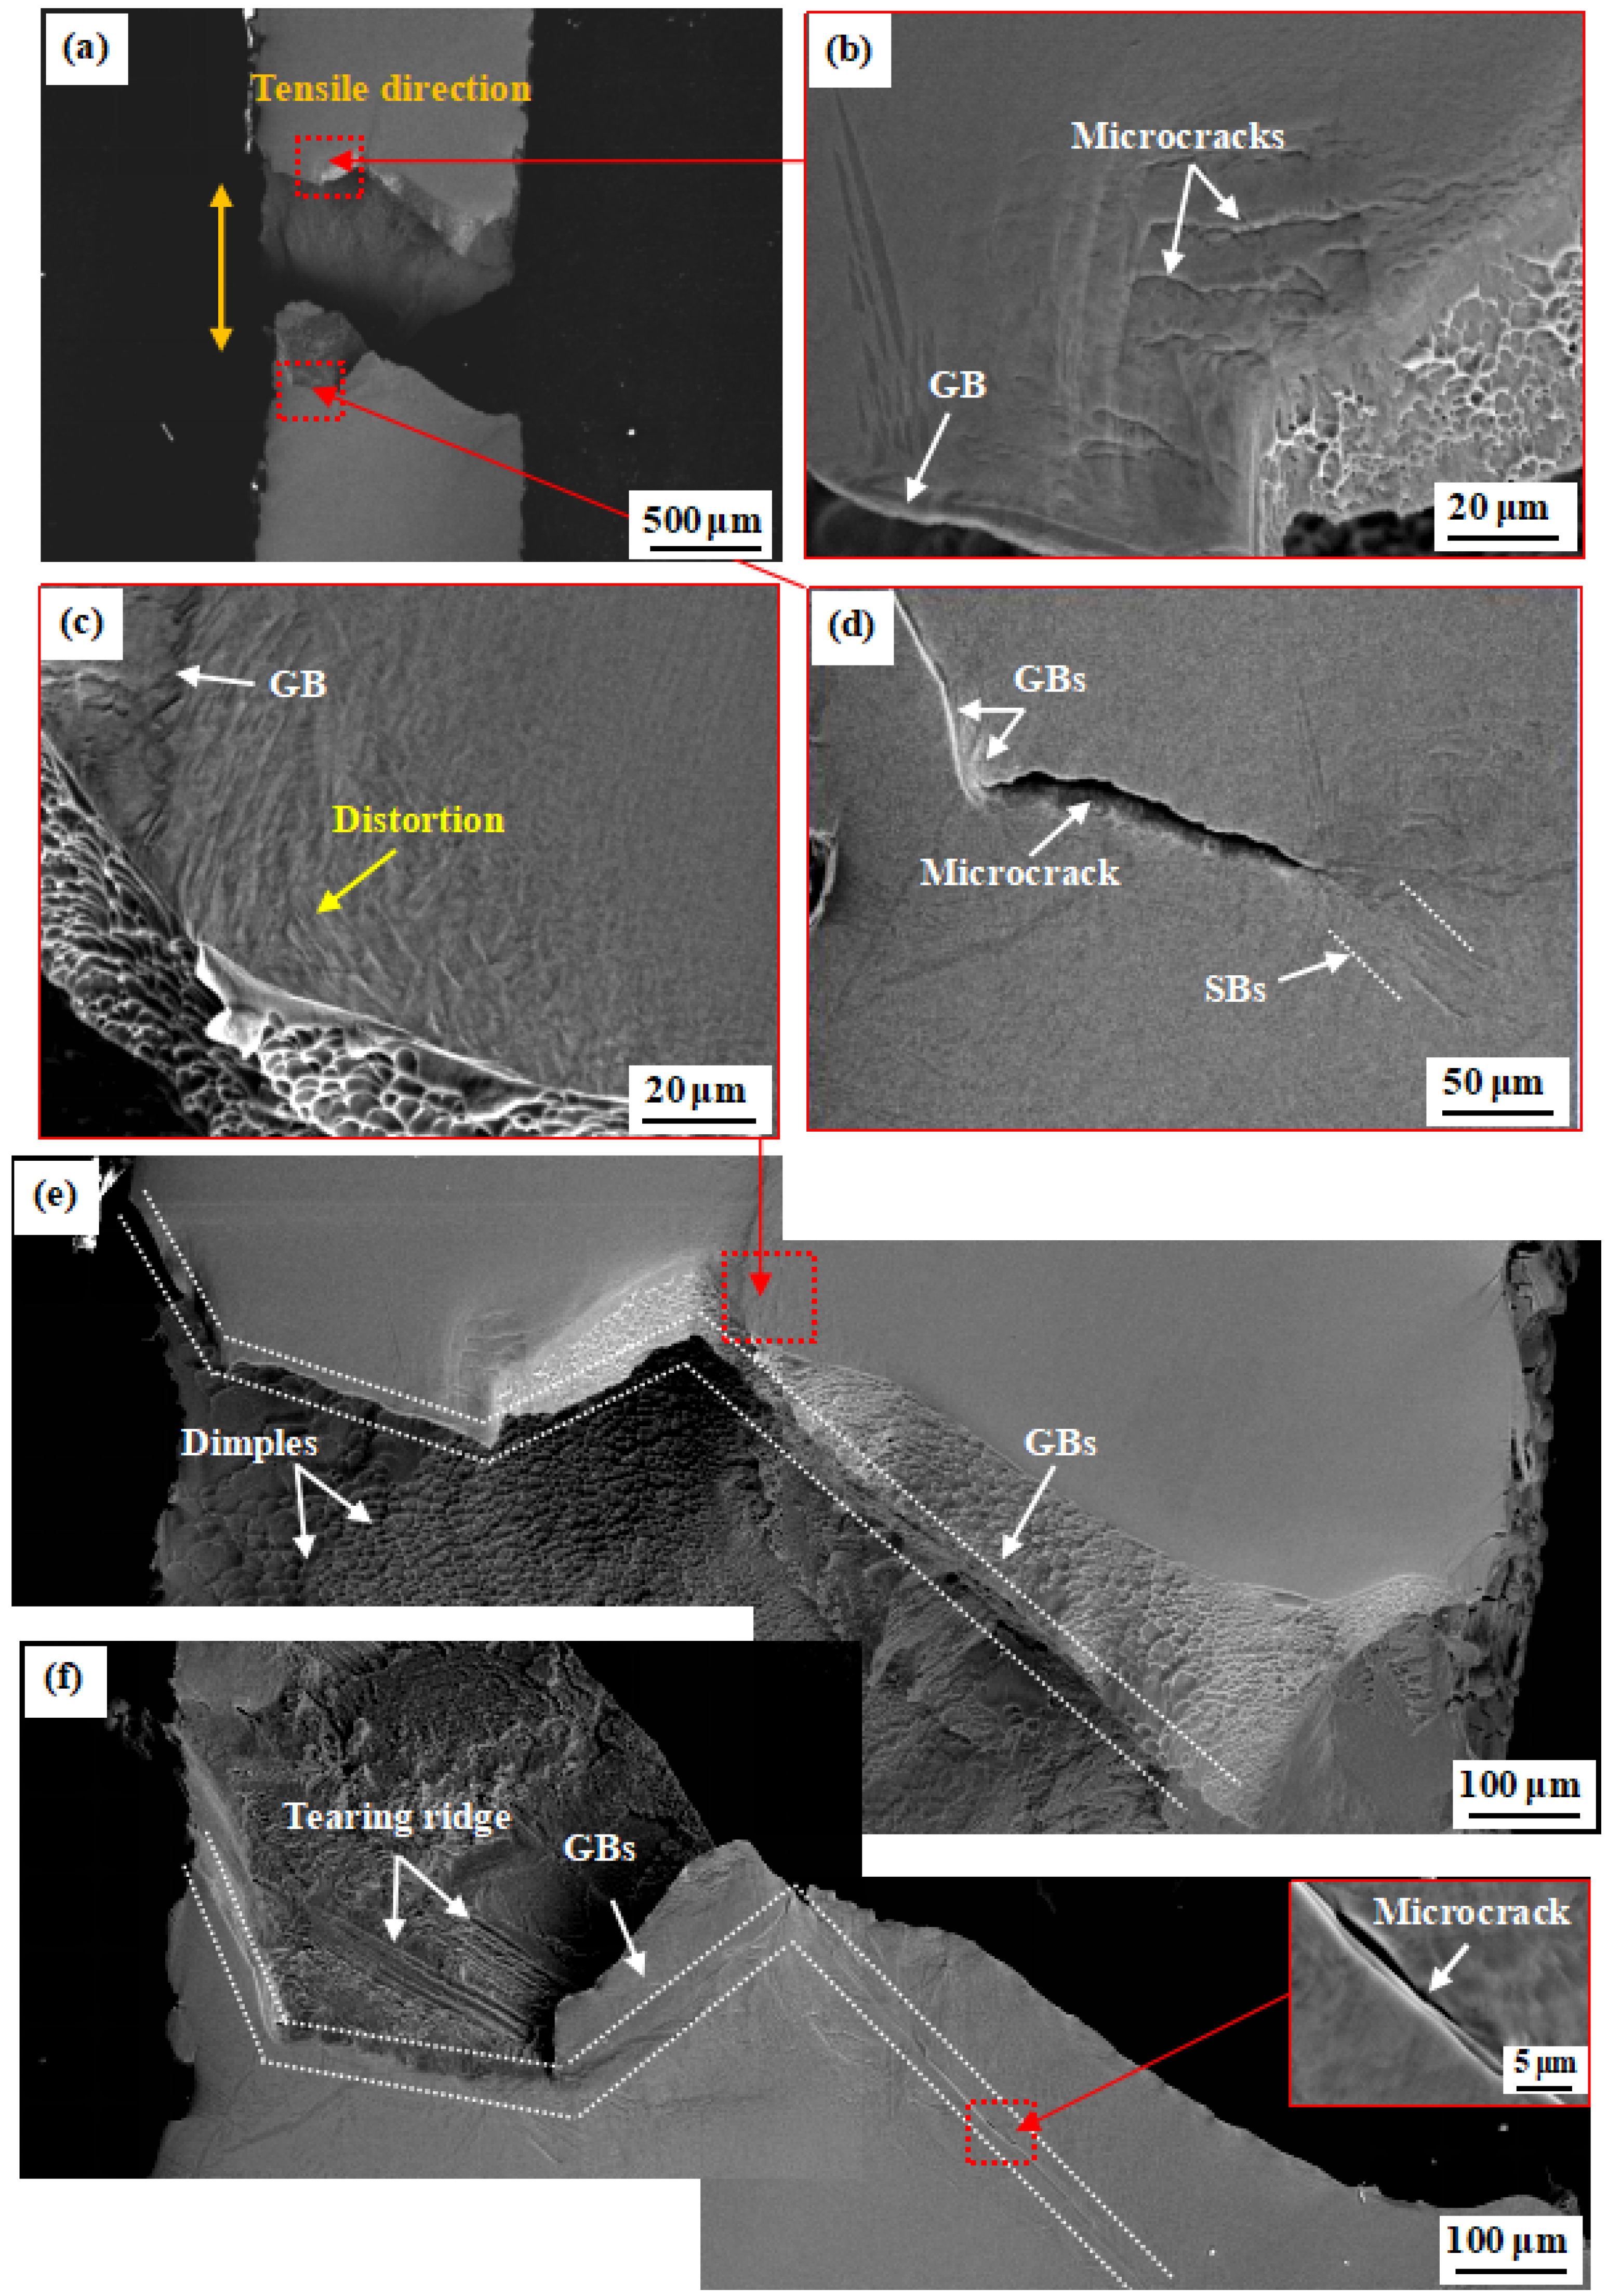
During the stretching of specimens with a lamellar microstructure, high-density dislocations are concentrated in the large αL phase region at GB. Microcracks readily initiate and propagate along the αL phase boundary at GB, leading to the ductile intergranular fracture of the lamellar microstructure.

Author Contributions

Conceptualization, M.F. and S.P.; methodology, S.P., H.L. and M.F.; software, M.F.; formal analysis, M.F., S.P., H.L. and Y.C.; investigation, M.F. and H.L.; resources, S.P., H.L. and Y.C.; data curation, M.F. and Y.C.; writing—original draft, M.F. and Y.C.; supervision, Y.C., S.P., H.L. and M.F. All authors have read and agreed to the published version of the manuscript.

Funding

This research was funded by the State Key Laboratory of Powder Metallurgy (Grant No. 10500-621022001), Central South University, Changsha, China.

Institutional Review Board Statement

Not applicable.

Informed Consent Statement

Informed consent was obtained from all subjects involved in the study.

Data Availability Statement

The data presented in this study are available on request from the corresponding author.

Conflicts of Interest

The authors declare no conflict of interest. The funders had no role in the design of the study; in the collection, analyses, or interpretation of data; in the writing of the manuscript, or in the decision to publish the results.

References

  1. Huang, H.L.; Li, D.; Chen, C.; Li, R.D.; Zhang, X.Y.; Liu, S.C.; Zhou, K.C. Selective laser melted near-beta titanium alloy Ti-5Al-5Mo-5V-1Cr-1Fe: Microstructure and mechanical properties. J. Cent. South Univ. 2021, 28, 1601–1614. [Google Scholar] [CrossRef]
  2. Yadav, P.; Saxena, K.K. Effect of heat -treatment on microstructure and mechanical properties of Ti alloys: An overview. Mater. Today Proc. 2020, 26, 2546–2557. [Google Scholar] [CrossRef]
  3. Antunes, R.A.; Salvador, C.A.F.; de Oliveira, M.C.L. Materials Selection of Optimized Titanium Alloys for Aircraft Applications. Mater. Res. 2018, 21, 979–987. [Google Scholar] [CrossRef] [Green Version]
  4. Pan, S.P.; Liu, H.Q.; Chen, Y.Q.; Zhang, X.Y.; Chen, K.W.; Yi, D.Q. αS dissolving induced mechanical properties decay in Ti-55511 alloy during uniaxial fatigue. Int. J. Fatigue 2020, 132, 105372–105388. [Google Scholar] [CrossRef]
  5. Boyer, R.R.; Cotton, J.D.; Mohaghegh, M.; Schafrik, R.E. Materials considerations for aerospace applications. Mrs Bull. 2015, 40, 1055–1065. [Google Scholar] [CrossRef] [Green Version]
  6. Pan, S.P.; Liu, H.Q.; Chen, Y.Q.; Chi, G.F.; Yi, D.Q. Lamellar α fencing effect for improving stress relaxation resistance in Ti-55511 alloy. Mater. Sci. Eng. A 2021, 808, 140945–140960. [Google Scholar] [CrossRef]
  7. Zhang, H.; Shao, H.; Shan, D.; Wang, K.X.; Cai, L.L.; Yin, E.H.; Wang, Y.L.; Zhuo, L.C. Influence of strain rates on high temperature deformation behaviors and mechanisms of Ti-5Al-5Mo-5V-3Cr-1Zr alloy. Mater. Charact. 2021, 171, 110794–110802. [Google Scholar] [CrossRef]
  8. Zhou, D.Y.; Gao, H.; Guo, Y.H.; Wang, Y.; Dong, Y.C.; Dan, Z.H.; Chang, H. High-Temperature Deformation Behavior and Microstructural Characterization of Ti-35421 Titanium Alloy. Materials 2020, 13, 3623. [Google Scholar] [CrossRef]
  9. Pei, W.; Chen, F.H.; Eckert, J.; Pilz, S.; Scudino, S.; Prashanth, K.G. Microstructural evolution and mechanical properties of selective laser melted Ti-6Al-4V induced by annealing treatment. J. Cent. South Univ. 2021, 28, 1068–1077. [Google Scholar]
  10. Sun, H.; Yu, L.M.; Liu, Y.C.; Zhang, L.Y.; Liu, C.X.; Li, H.J.; Wu, J.F. Effect of heat treatment processing on microstructure and tensile properties of Ti-6Al-4V-10Nb alloy. Trans. Nonferrous Metals Soc. China 2019, 29, 59–66. [Google Scholar] [CrossRef]
  11. Luo, J.; Ye, P.; Li, M.Q.; Liu, L.Y. Effect of the alpha grain size on the deformation behavior during isothermal compression of Ti-6Al-4V alloy. Mater. Des. 2015, 88, 32–40. [Google Scholar] [CrossRef]
  12. Wang, T.; Guo, H.Z.; Wang, Y.W.; Peng, X.N.; Zhao, Y.; Yao, Z.K. The effect of microstructure on tensile properties, deformation mechanisms and fracture models of TG6 high temperature titanium alloy. Mater. Sci. Eng. A 2011, 528, 2370–2379. [Google Scholar] [CrossRef]
  13. Lin, Y.C.; Jiang, X.Y.; Shuai, C.J.; Zhao, C.Y.; He, D.G.; Chen, M.S.; Chen, C. Effects of initial microstructures on hot tensile deformation behaviors and fracture characteristics of Ti-6Al-4V alloy. Mater. Sci. Eng. A 2018, 711, 293–302. [Google Scholar] [CrossRef]
  14. Jiang, Y.Q.; Lin, Y.C.; Jiang, X.Y.; He, D.G.; Zhang, X.Y.; Kotkunde, N. Hot tensile properties, microstructure evolution and fracture mechanisms of Ti-6Al-4V alloy with initial coarse equiaxed phases. Mater. Charact. 2020, 163, 110272–110279. [Google Scholar] [CrossRef]
  15. Huang, S.X.; Zhao, Q.Y.; Lin, C.; Wu, C.; Zhao, Y.Q.; Jia, W.J.; Mao, C.L. In-situ investigation of tensile behaviors of Ti-6Al alloy with extra low interstitial. Mater. Sci. Eng. A 2021, 809, 140958–140969. [Google Scholar] [CrossRef]
  16. Wang, J.; Zhao, Y.; Zhou, W.; Zhao, Q.; Huang, S.; Zeng, W. In-situ investigation on tensile deformation and fracture behaviors of a new metastable β titanium alloy. Mater. Sci. Eng. A 2021, 799, 140187–140198. [Google Scholar] [CrossRef]
  17. Jin, H.X.; Wei, K.X.; Li, J.M.; Zhou, J.Y.; Peng, W.J. Advances in titanium alloys for aerospace applications. Trans. Nonferrous Metals Soc. China 2015, 25, 280–292. [Google Scholar]
  18. Wang, Q.J.; Liu, J.R.; Yang, R. Present situation and prospect of high temperature titanium alloy. J. Aeronaut. Mater. 2014, 34, 1–26. [Google Scholar]
  19. Beausir, B.; Fundenberger, J.J. Analysis Tools For Electron And X-ray Diffraction, ATEX-Software. Université de Lorraine-Metz. 2017. Available online: www.atex-software.eu (accessed on 1 January 2022).
  20. Qin, L.; Wang, J.; Wu, Q.; Guo, X.Z.; Tao, J. In-situ observation of crack initiation and propagation in Ti/Al composite laminates during tensile test. J. Alloys Compd. 2017, 712, 69–75. [Google Scholar] [CrossRef]
  21. Wang, H.; Xin, S.W.; Zhao, Y.Q.; Zhou, W.; Zeng, W.D. Plane strain fracture behavior of a new high strength Ti-5Al-3Mo-3V-2Zr-2Cr-1Nb-1Fe alloy during heat treatment. Mater. Sci. Eng. A 2020, 797, 140080–140091. [Google Scholar] [CrossRef]
  22. Tan, C.S.; Sun, Q.Y.; Xiao, L.; Zhao, Y.Q.; Sun, J. Cyclic deformation and microcrack initiation during stress controlled high cycle fatigue of a titanium alloy. Mater. Sci. Eng. A 2018, 711, 212–222. [Google Scholar] [CrossRef]
  23. Pan, S.P.; Fu, M.Z.; Liu, H.Q.; Chen, Y.Q.; Yi, D.Q. In Situ Observation of the Tensile Deformation and Fracture Behavior of Ti-5Al-5Mo-5V-1Cr-1Fe Alloy with Different Microstructures. Materials 2021, 14, 5794. [Google Scholar] [CrossRef]
  24. Lecomte, J.S.; Philippe, M.J.; Klimanek, P. Plastic deformation of a Ti-6%Al-4%V alloy with a strong transverse-type crystallographic α-texture at elevated temperatures. Mater. Sci. Eng. A 1997, 234–236, 869–872. [Google Scholar] [CrossRef]
  25. Turner, G.I.; White, J.S. Mechanical hysteresis in beryllium single crystals oriented for (10 1 ¯ 0) <11 2 ¯ 0> slip. J. Phys. F Met. Phys. 1973, 3, 926–932. [Google Scholar] [CrossRef]
  26. Semiatin, S.L.; Bieler, T.R. Effect of texture and slip mode on the anisotropy of plastic flow and flow softening during hot working of Ti 6Al 4V. Metall. Mater. Trans. A 2001, 32, 1787–1799. [Google Scholar] [CrossRef]
  27. Banerjee, D.; Williams, J.C. Microstructure and slip character in titanium alloys. Def. Sci. J. 2014, 36, 191–206. [Google Scholar] [CrossRef]
  28. Demulsant, X.; Mendez, J. Microstructural effects on small fatigue crack initiation and growth in Ti6A14V alloys. Fatigue Fract. Eng. Mater. Struct. 1995, 18, 1483–1497. [Google Scholar] [CrossRef]
  29. Kacher, J.; Eftink, B.P.; Cui, B.; Robertson, I.M. Dislocation interactions with grain boundaries. Curr. Opin. Solid State Mater. Sci. 2014, 18, 227–243. [Google Scholar] [CrossRef]
  30. Bridier, F.; Villechaise, P.; Mendez, J. Analysis of the different slip systems activated by tension in a α/β titanium alloy in relation with local crystallographic orientation. Acta Mater. 2005, 53, 555–567. [Google Scholar] [CrossRef]
  31. Tan, C.S.; Sun, Q.Y.; Zhang, G.J.; Zhao, Y.Q. High-cycle fatigue of a titanium alloy: The role of microstructure in slip irreversibility and crack initiation. J. Mater. Sci. 2020, 55, 12476–12487. [Google Scholar] [CrossRef]
  32. Rabeeh, B.M.; Rokhlin, S.I.; Soboyejo, W.O. Microplasticity and fracture in a Ti-15V-3Cr-3Al-3Sn alloy. Scr. Mater. 1996, 35, 1429–1434. [Google Scholar] [CrossRef]
  33. Ning, Y.Q.; Yao, Z.K.; Li, H.; Cuo, H.Z.; Tao, Y.; Zhang, Y.W. High temperature deformation behavior of hot isostatically pressed P/M FGH4096 superalloy. Mater. Sci. Eng. A 2010, 527, 961–966. [Google Scholar] [CrossRef]
Figure 1. Heat treatment routes for bimodal and lamellar samples.
Crystals 12 00934 g001
Figure 2. Microstructures after heat treatment (a) bimodal microstructure; (b) lamellar microstructure.
Crystals 12 00934 g002
Figure 3. (a) Mechanical test bench and heating device; (b) Geometry and dimensions of in situ tensile test sample at 350 °C (units: mm).
Crystals 12 00934 g003
Figure 4. The stress–displacement curve of sample stretching in situ with bimodal and lamellar microstructure at 350 °C.
Crystals 12 00934 g004
Figure 5. (a) In situ SEM images of bimodal microstructure at A (the displacement of 467 μm); (b) microcracks nucleated at α phase; (c) microcracks and SBs formed within the αP phase; (d) magnified image showing SBs passing through the interface between the αP and β phases.
Crystals 12 00934 g005
Figure 6. (a) In situ SEM images of bimodal microstructure at B (the displacement of 726 μm); (b) microcracks become deepened and widened; (c) magnified image showing macrocracks nucleated at the edge of the sample; (d) distortion in SB regions and microcracks at αP/β interface.
Crystals 12 00934 g006
Figure 7. (a) In situ SEM images of bimodal microstructure sample at F (the displacement of 1012 μm); (b) a crack propagated along the SBs in the αP phase; (c) SBs in each αP phase tended to interconnect; (d) magnified image showing microcracks formed on the edge of the sample; (e) SEM images showing the rough fracture surface of the sample; (f) magnified image showing many microcracks existed near the fracture area.
Crystals 12 00934 g007
Figure 8. (a) In situ SEM images of lamellar microstructure at A’ (the displacement of 661 μm); (b,d) magnified image showing SBs develop in the αL phase near GB; (c) magnified image showing microcracking in a long, coarse αL phase at a trigeminal GB.
Crystals 12 00934 g008
Figure 9. (a) In situ SEM images of lamellar microstructure at F’ (the displacement of 788 μm); (b,c) microcracks and distortion occurred near the fracture area; (d) magnified image showing crack initiation occurred at GB; (e,f) SEM images showing the fracture surface of the sample.
Crystals 12 00934 g009
Figure 10. EBSD images of bimodal microstructure after stretching in situ; (a) SEM image showing many parallel SBs in the αP phase; (b) SF map of basal slip for α; (c) SF map of prismatic slip for α; (d) SF map of pyramidal slip for α; (e) the inverse pole figure map; (f) SF map of β for {1 1 ¯ 0}<111> slip; (g) SF map of β for {11 2 ¯ }<111> slip; (h) SF map of β for {12 3 ¯ }<111> slip.
Crystals 12 00934 g010
Figure 11. (a) SF histogram of α phase with basal <α>, prismatic <α>, and pyramidal <α> slip systems for bimodal microstructure after stretching in situ; (b,c) Multislip activation of Grain 1 in the αP phase; (d,e) Basal slip activation of grain 2 in the αP phase; (f,g) Pyramidal slip activation of Grain 3 in the αP phase; (h) The (001)[1 2 ¯ 0] basal slip system activation for Grain 1; (i) The (0 1 ¯ 0)[2 1 ¯ 0] prismatic slip system activation for Grain 1; (j) The (001)[1 2 ¯ 0] basal slip system activation for Grain 2; (k) The (011)[ 2 ¯ 10] slip system activation for Grain 3.
Crystals 12 00934 g011
Figure 12. EBSD images of lamellar microstructure after stretching in situ; (a) the inverse pole figure map; (b) SF map of basal slip for α; (c) SF map of prismatic slip for α; (d) SF map of pyramidal slip for α.
Crystals 12 00934 g012
Figure 13. (a) SF histogram of α phase with basal <α>, prismatic <α>, and pyramidal <α> slip systems for specimens with a lamellar microstructure after stretching in situ; (b,c) Prismatic slip activation of grain 4 in the αL phase; (d,e) Pyramidal slip activation of grain 5 in the αL phase; (f) The (100)[ 1 ¯ 20] of prismatic slip system activation for grain 4; (g) The (011)[ 2 ¯ 10] of pyramidal slip system activation for grain 5.
Crystals 12 00934 g013
Figure 14. Schematic diagram showing the microstructure evolution of Ti-55511 alloy during stretching in situ; (ac) bimodal microstructure evolution; (df) lamellar microstructure evolution.
Crystals 12 00934 g014
Table 1. The chemical composition of Ti-55511 alloy (all in wt %).
ElementTiAlMoVFeCr
Wt. %83.375.074.814.741.060.95
Table 2. The in situ tensile mechanical properties of bimodal and lamellar microstructure at 350 °C.
Samplesσ0.2 (MPa)σb (MPa)Lmax (μm)
Bimodal93010051012
Lamellar12771291788
Publisher’s Note: MDPI stays neutral with regard to jurisdictional claims in published maps and institutional affiliations.

