Article

Anisotropy of the Electric Field Gradient in Two-Dimensional α-MoO3 Investigated by 57Mn(57Fe) Emission Mössbauer Spectroscopy

by
Juliana Schell
1,2,*,
Dmitry Zyabkin
3,
Krish Bharuth-Ram
4,
João N. Gonçalves
5,
Carlos Díaz-Guerra
6,
Haraldur P. Gunnlaugsson
7,
Aitana Tarazaga Martín-Luengo
8,
Peter Schaaf
3,
Alberta Bonanni
8,
Hilary Masenda
9,10,
Thien Thanh Dang
2,
Torben E. Mølholt
1,
Sveinn Ólafsson
7,
Iraultza Unzueta
11,
Roberto Mantovan
12,
Karl Johnston
1,
Hafliði P. Gíslason
7,
Petko B. Krastev
13,
Deena Naidoo
9 and
Bingcui Qi
7
1
European Organization for Nuclear Research (CERN), 1211 Geneva, Switzerland
2
Institute for Materials Science and Center for Nanointegration Duisburg-Essen (CENIDE), University of Duisburg-Essen, 45141 Essen, Germany
3
Chair Materials for Electrical Engineering and Electronics, Institute of Materials Science and Engineering, Institute of Micro and Nanotechnologies MacroNano®, TU Ilmenau, Gustav-Kirchhoff-Strasse 5, 98693 Ilmenau, Germany
4
School of Chemistry and Physics, University of KwaZulu-Natal, Durban 4001, South Africa
5
CICECO—Aveiro Institute of Materials and Departamento de Física, Universidade de Aveiro, 3810-193 Aveiro, Portugal
6
Departmento Física de Materiales, Facultad de Ciencias Físicas, Universidad Complutense de Madrid, 28040 Madrid, Spain
7
Science Institute, University of Iceland, Dunhaga 3, 107 Reykjavík, Iceland
8
Quantum Materials Group, Institute for Semiconductor and Solid State Physics, Johannes Kepler University, Altenbergerstr. 69, 4040 Linz, Austria
9
School of Physics, University of the Witwatersrand, Johannesburg 2050, South Africa
10
Faculty of Physics and Materials Sciences Center, Philipps-Universität Marburg, 35032 Marburg, Germany
11
Department of Applied Mathematics, University of the Basque Country (UPV/EHU), Torres Quevedo Ingeniaria Plaza 1, 48013 Bilbao, Spain
12
CNR-IMM, Unit of Agrate Brianza, Via Olivetti 2, 20864 Agrate Brianza (MB), Italy
13
Institute for Nuclear Research and Nuclear Energy, Bulgarian Academy of Sciences, 72 Tsarigradsko Chaussee Boulevard, 1784 Sofia, Bulgaria
*
Author to whom correspondence should be addressed.
Crystals 2022, 12(7), 942; https://doi.org/10.3390/cryst12070942
Submission received: 1 June 2022 / Revised: 27 June 2022 / Accepted: 29 June 2022 / Published: 4 July 2022
(This article belongs to the Section Crystal Engineering)

Abstract

:
Van der Waals α-MoO3 samples offer a wide range of attractive catalytic, electronic, and optical properties. We present herein an emission Mössbauer spectroscopy (eMS) study of the electric-field gradient (EFG) anisotropy in crystalline free-standing α-MoO3 samples. Although α-MoO3 is a two-dimensional (2D) material, scanning electron microscopy shows that the crystals are 0.5–5-µm thick. The combination of X-ray diffraction and micro-Raman spectroscopy, performed after sample preparation, provided evidence of the phase purity and crystal quality of the samples. The eMS measurements were conducted following the implantation of 57Mn (t1/2 = 1.5 min), which decays to the 57Fe, 14.4 keV Mössbauer state. The eMS spectra of the samples are dominated by a paramagnetic doublet (D1) with an angular dependence, pointing to the Fe2+ probe ions being in a crystalline environment. It is attributed to an asymmetric EFG at the eMS probe site originating from strong in-plane covalent bonds and weak out-of-plane van der Waals interactions in the 2D material. Moreover, a second broad component, D2, can be assigned to Fe3+ defects that are dynamically generated during the online measurements. The results are compared to ab initio simulations and are discussed in terms of the in-plane and out-of-plane interactions in the system.

1. Introduction

Two-dimensional (2D) inorganic materials, such as α-MoO3, have attracted significant attention lately by virtue of their distinct properties and highly specific surface areas [1]. The room-temperature (RT)-stable orthorhombic α-MoO3 phase is a wide-bandgap (2.8–3.2 eV) semiconductor of great practical interest mainly due to its anisotropic layered structure with weak interaction between (010) planes. Due to these structural characteristics, α-MoO3 performs well in applications such as solar cells [1], catalysis [2], gas sensing [3], field emission [4], lithium-ion batteries [5], and photochromic devices [6]. In particular, α-MoO3 films are used as an electrochromic layer in optical switches, electrochromic devices, and smart windows [7].
Oxygen vacancies play a key role in the physical properties of Mo oxides and their electrical conductivity by introducing gap states and influencing the optical bandgap. The oxygen-defect concentration is controlled by the oxygen partial pressure and preparation temperatures during synthesis, which in turn influences the crystal morphology. In this regard, thermal treatment under a low oxygen partial pressure, ion implantation, or ultraviolet (UV) irradiation of MoO3 induces oxygen defects, leading to MoO3−x [8]. Moreover, an appropriate combination of several Mo oxides or an adequate distribution of Mo ions with different oxidation states may lead to materials with emergent electronic and optical properties. For instance, MoO3 is a transparent semiconductor, whereas MoO2 is a metallic conductor. To gain deeper insight into these phenomena, a systematic investigation into the relationship between the stoichiometry and electronic structure over the range of oxidation states of MoO3 and MoO3−x is urgently required.
To tune the characteristics of α-MoO3, doping with several cations (e.g., In cations) has been proposed [9]. Moreover, doped and undoped samples have been studied via conventional characterization methods. Strong and stable RT photoluminescence has been achieved in MoO3 crystals doped with Er and Eu by ion implantation [10]. These results motivated our present study to further investigate the structural properties of samples via ion implantation. For instance, Pereira et al. implanted oxygen ions at RT to modify the electrical and structural properties of α-MoO3 crystals [11]. The samples were also characterized after exposure to UV and proton-beam irradiation [12]. The creation of electron-hole pairs and the adsorption and desorption of oxygen molecules at the surface of the samples have been associated with variations in conductivity. The authors (Pereira et al.) further suggest that tuning the electrical properties by ion implantation offers possibilities for novel device designs.
The physics behind the multiple above-mentioned applications is linked to the material phenomenology, which includes defects such as oxygen vacancies, point defects, and impurity doping, all of which can be studied by Mössbauer spectroscopy (MS), as shown in earlier studies [13,14,15].
In an early 57Fe MS study by Zhetbaev et al. on the formation kinetics of Mo oxides [13], a 99.5% Mo foil coated with a 57Co isotope was subjected to different annealing atmospheres, both in hydrogen and in air. All measurements were performed at RT. The MoO3 spectrum obtained after annealing at 700 °C presents two doublets. The authors present hyperfine parameters relative to the emission scale and relative to 57Fe/Co in Cr metal. After adjusting for the reference scale [16] for α-Fe and changing the sign to represent a conventional isomer-shift scale, the one doublet has an isomer shift δRT1 = 1.19 mm/s with a quadrupole splitting ΔE1 = 1.20 mm/s while the second has δRT2 = 0.21 mm/s with ΔE2 = 0.75 mm/s, corresponding to the Fe2+ and Fe3+ states in a ratio of approximately 3:1. The authors also report that oxidation in air produces molybdenum with valences of 4+ and 6+, with other valence states making no significant contribution [13].

Effects of Fe Doping in MoOx

Ab initio simulations of the effects of Fe doping of MoOx indicate that Fe on substitutional Mo sites exhibits a compensating behavior, since Fe can act as a donor under p-type conditions and as an acceptor under n-type conditions [17,18].
Conventional characterization of Fe-doped MoO2 films reveals resistivity minima and negative magnetoresistance below the resistive minima temperature [19]. This phenomenon is attributed to either weak localization or Kondo scattering of the conduction electrons from Fe impurities [19].
An appropriate amount of Fe doping can improve the gas-sensing properties of the system, notably at low operating temperatures [18]. The great advantage of presenting a stratified structure is that different dopants can be incorporated into the gaps between the layers in the crystal lattice, a mechanism that is essential for the electrochromic and catalytic applications of α-MoO3 [10].
Motivated by the interesting properties arising from stoichiometry dependencies, we used 57Fe emission Mössbauer spectroscopy (eMS) to study highly crystalline molybdenum trioxide lamellar samples with implanted 57Mn. Particular attention was given to the influence of the incorporated Fe probe in different configurations in the α-MoO3 system, with the results supported by ab initio simulations.

2. Materials and Methods

α-MoO3 lamella single crystals were grown by sublimation with the growth conditions optimized following the methods described in a previous work [10]. Pure Mo powder was compacted under a compressive load to form disks, which were inserted into a quartz tube and annealed in air at 750 °C for 10 h in a horizontal tube furnace. Under these conditions, numerous high-quality α-MoO3 lamella crystals were deposited on the cooler part of the internal wall of the quartz tube. Scanning electron microscopy (SEM) (Madrid, Spain), energy-dispersive X-ray spectroscopy (EDX-SEM), X-ray diffraction (XRD), and micro-Raman characterizations of the samples were performed at RT before implantation of the 57Mn ions. The XRD measurements were carried out on a Philips X’Pert PRO diffractometer (Madrid, Spain) using Cu Kα radiation. The micro-Raman measurements were carried out in a Horiba Jobin-Yvon LabRAM HR800 system (Madrid, Spain), in which the samples were excited by a 633 nm He-Ne laser on an Olympus BX41 confocal microscope with a 100× objective. The spectral resolution of the system used was approximately 1 cm−1.
57Fe eMS measurements [20,21] were performed at the ISOLDE-CERN facility [22,23], where the parent radioactive isotope was produced with 1.4 GeV proton-induced fission in a heated UC2 target. Mass-separated 57Mn ions were then implanted with an energy of 50 keV into the samples at RT. Emission Mössbauer spectra were recorded using a resonance detector equipped with a 57Fe-enriched stainless-steel electrode mounted on a conventional drive system outside the implantation chamber at 60° relative to the sample normal. The implantation fluence was less than 2 × 10¹¹ 57Mn ions/cm2, which is a dilute concentration [14,24]. SRIM simulations give an average implantation depth of the order of 30 nm [25]. Estimates of the sample volume that turns amorphous upon implantation were determined from angular-dependent studies in which the sample holder was rotated to acquire data at emission angles of 0°, 30°, and 60° (no rotation) relative to the sample normal (normal to the lamellar plane). Figure 1a illustrates the orientation of flakes mounted relative to the incident Mn beam, and Figure 1b provides a sketch of the top view of the implantation set-up used to identify the incident and emission angles involved.
The ab initio simulations used the Vienna ab initio simulation package [26], with the projector augmented-wave method [27]. The electron configurations considered were 4p, 4d, and 5s for Mo; 3p, 3d, and 4s for Fe; and 2s and 2p for O. The Perdew–Burke–Ernzerhof generalized gradient approximation exchange-correlation approximation was used [28], with an additional U term of 4.38 eV at Mo d orbitals and 3 eV at Fe d orbitals to better describe these highly correlated states [29]. The plane waves were expanded with an energy cut-off of 520 eV, and a Γ-centered Monkhorst–Pack k-point grid of 1 × 9 × 9 k points was used for the unit cell, with similar densities for supercells. The forces were minimized to less than 0.01 eV/Å.

3. Results

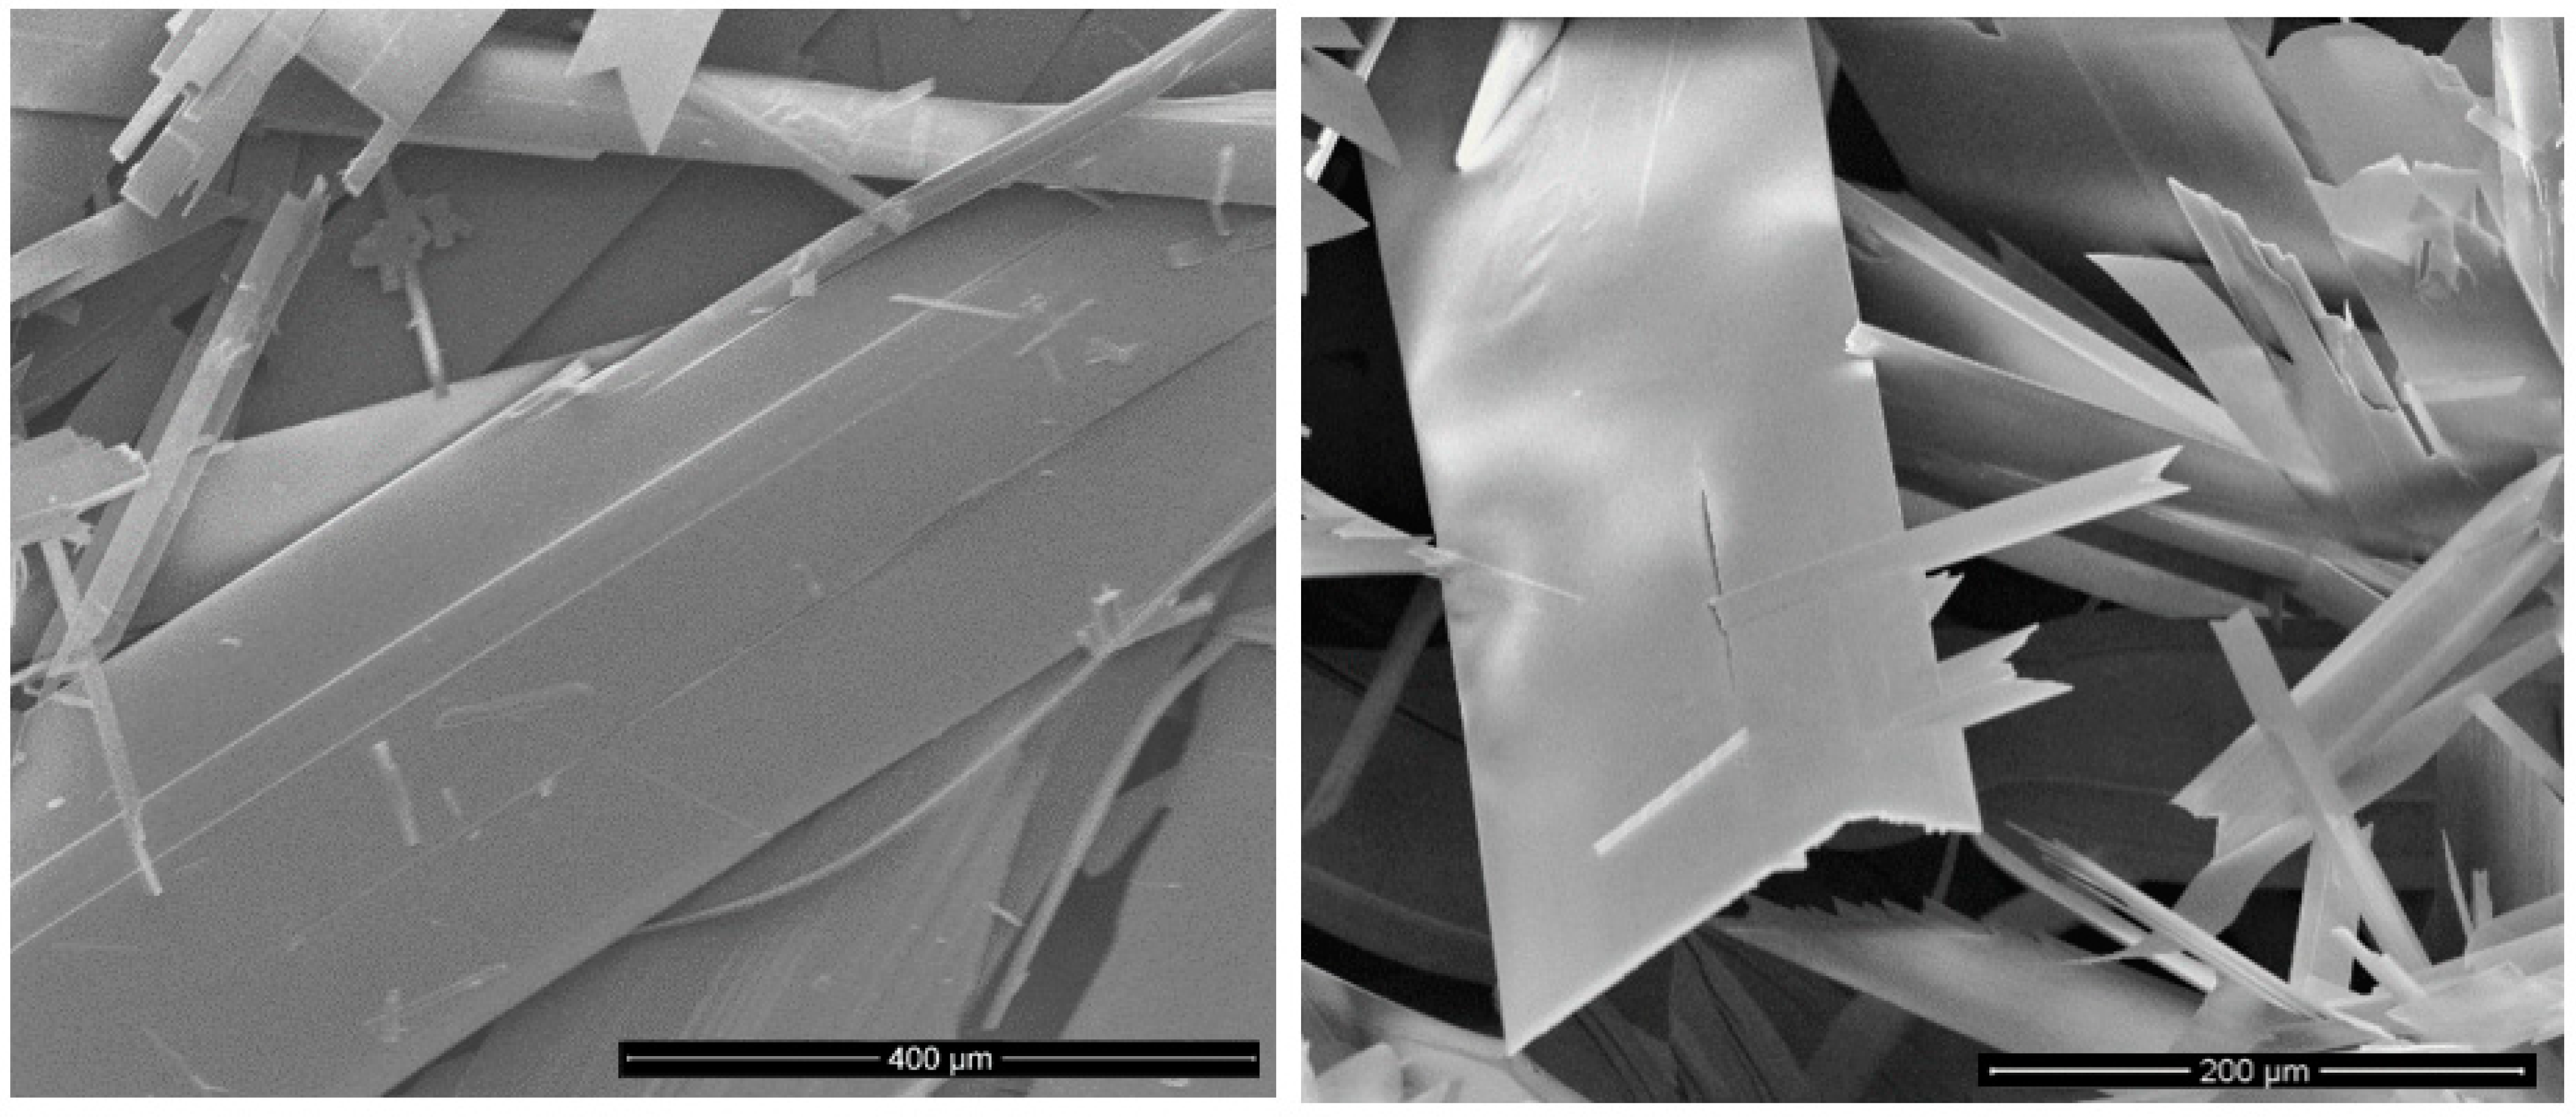
Figure 2 shows the SEM results for a sample (lamellar crystals), with 400 and 200 μm scale bars. Although α-MoO3 is a 2D material, the crystals investigated herein were 0.5–5-µm thick. Widths typically exceed 300 µm, and lengths can reach 1 cm.
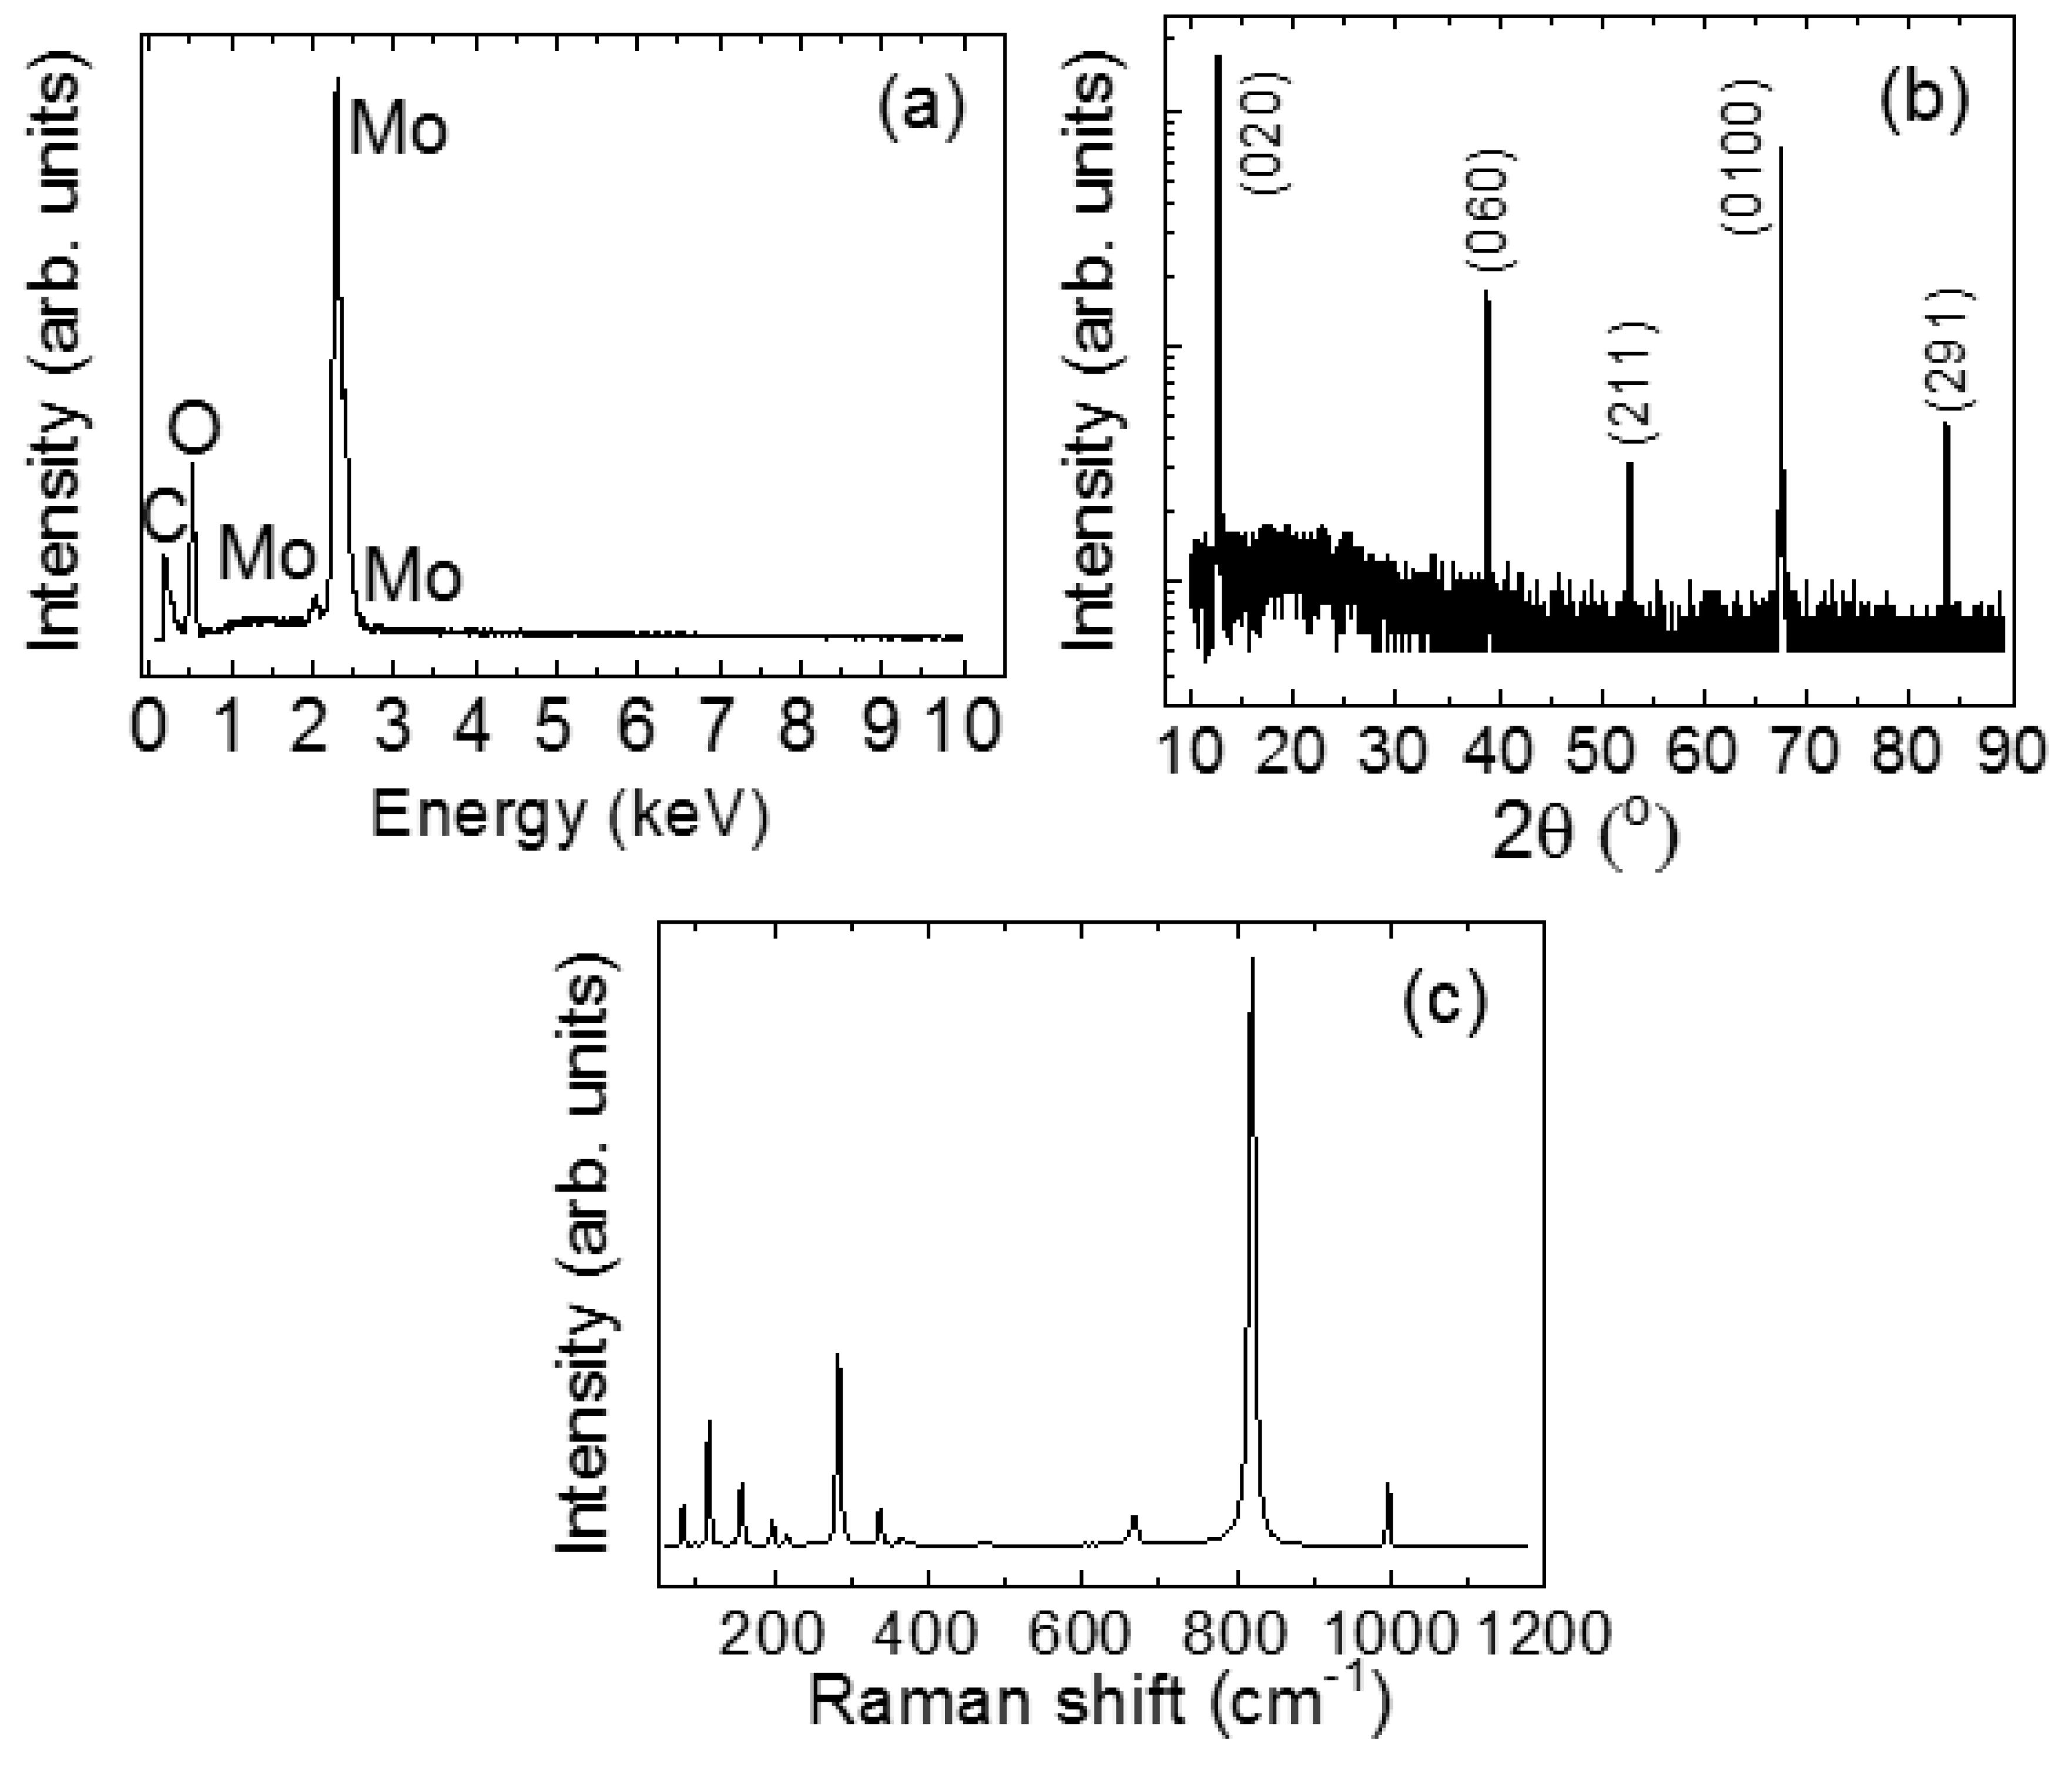
The long-range and short-range structural information of the as-grown crystals was characterized by XRD and micro-Raman spectroscopy, respectively. Figure 3a shows the chemical composition of the samples obtained via SEM-EDX microanalysis, which revealed no other elements but Mo and O, besides a weak C signal from the graphite tape used to stick the sample to the SEM sample holder. The as-grown α-MoO3 crystals showed a characteristic layered structure. Based on the crystal morphology, a two-dimensional layer-by-layer mechanism has been proposed to account for the nucleation and growth of this kind of oxide crystals. In fact, from an energy perspective, planar growth rates along the axes of the crystal follow the sequence {001} > {100} > {010}. Hence, it is highly favorable for α-MoO3 crystals to grow along the [1] direction with the largest exposed surface of {010} facets [30], in agreement with our XRD patterns.
Figure 3b shows an XRD pattern of the samples. The spectrum was plotted on a logarithmic scale to show the low-intensity diffraction maxima. All strong and sharp diffraction maxima can be indexed to orthorhombic α-MoO3 (JCPDS 05-0508). A clear preferential (0k0) orientation is apparent, consistent with the 2D structure and growth habits of this oxide [31,32]. No other phases are evident in our XRD measurements. The lattice parameters determined were a = 13.878 Å, b = 3.696 Å, and c = 3.961, in very good agreement with file JCPDS 05-0508.
Figure 3c presents a representative Raman spectrum of the as-grown crystals. All observed bands are unambiguously attributed to the orthorhombic α-MoO3 phase [32,33]. Peaks appear to be centered at 996 (Ag, υas M=O stretch), 819 (Ag, υs M=O stretch), 667 (B2g, B3g, υas O–M–O stretch), 472 (Ag, υas O–M–O stretch and bend), 380 (B1g, δ O–M–O scissor), 365 (A1g, δ O–M–O scissor), 338 (Ag, B1g, δ O–M–O bend), 283 (B2g, δ O=M=O wagging), 217 (Ag, rotational rigid MoO4 chain mode, Rc), 198 (B2g, τ O=Mo=O twist), 158 (Ag/B1g, translational rigid MoO4 chain mode, Tb), 129 (B3g, translational rigid MoO4 chain mode, Tc), 116 (B2g, translational rigid MoO4 chain mode, Tc), 99 (B2g, translational rigid MoO4 chain mode, Ta), and 83 cm−1 (Ag, translational rigid MoO4 chain mode, Ta).
The combination of XRD and Raman spectroscopy provides definitive evidence of the phase purity and crystal quality of the investigated material prior to the eMS measurements. Moreover, Raman measurements were carried out in a system equipped with a confocal microscope, which provided spatial resolution and allowed us to check that no differences were found, either in terms of the peak shifts or widths, between spectra measured for different crystals or at different spots of the same sample.
Figure 4 presents the eMS spectra obtained at 0°, 30°, and 60°. Overall, the spectra can be fit with a quadrupole-splitting distribution (D1) with parameters (Table 1) typical of ionic Fe2+ [13]. Complete fits to the data require a second component (D2) due to Fe3+ ions in unresolved local environments. D2 seems to have a peak intensity of approximately v~−0.3 mm/s and gives rise to intensities in the wings of the spectra, which is most likely due to Fe3+ showing slow paramagnetic relaxations, as reported for earlier eMS measurements on metal oxides [34,35]. The intensities of the two peaks of D1 clearly display angular dependence.
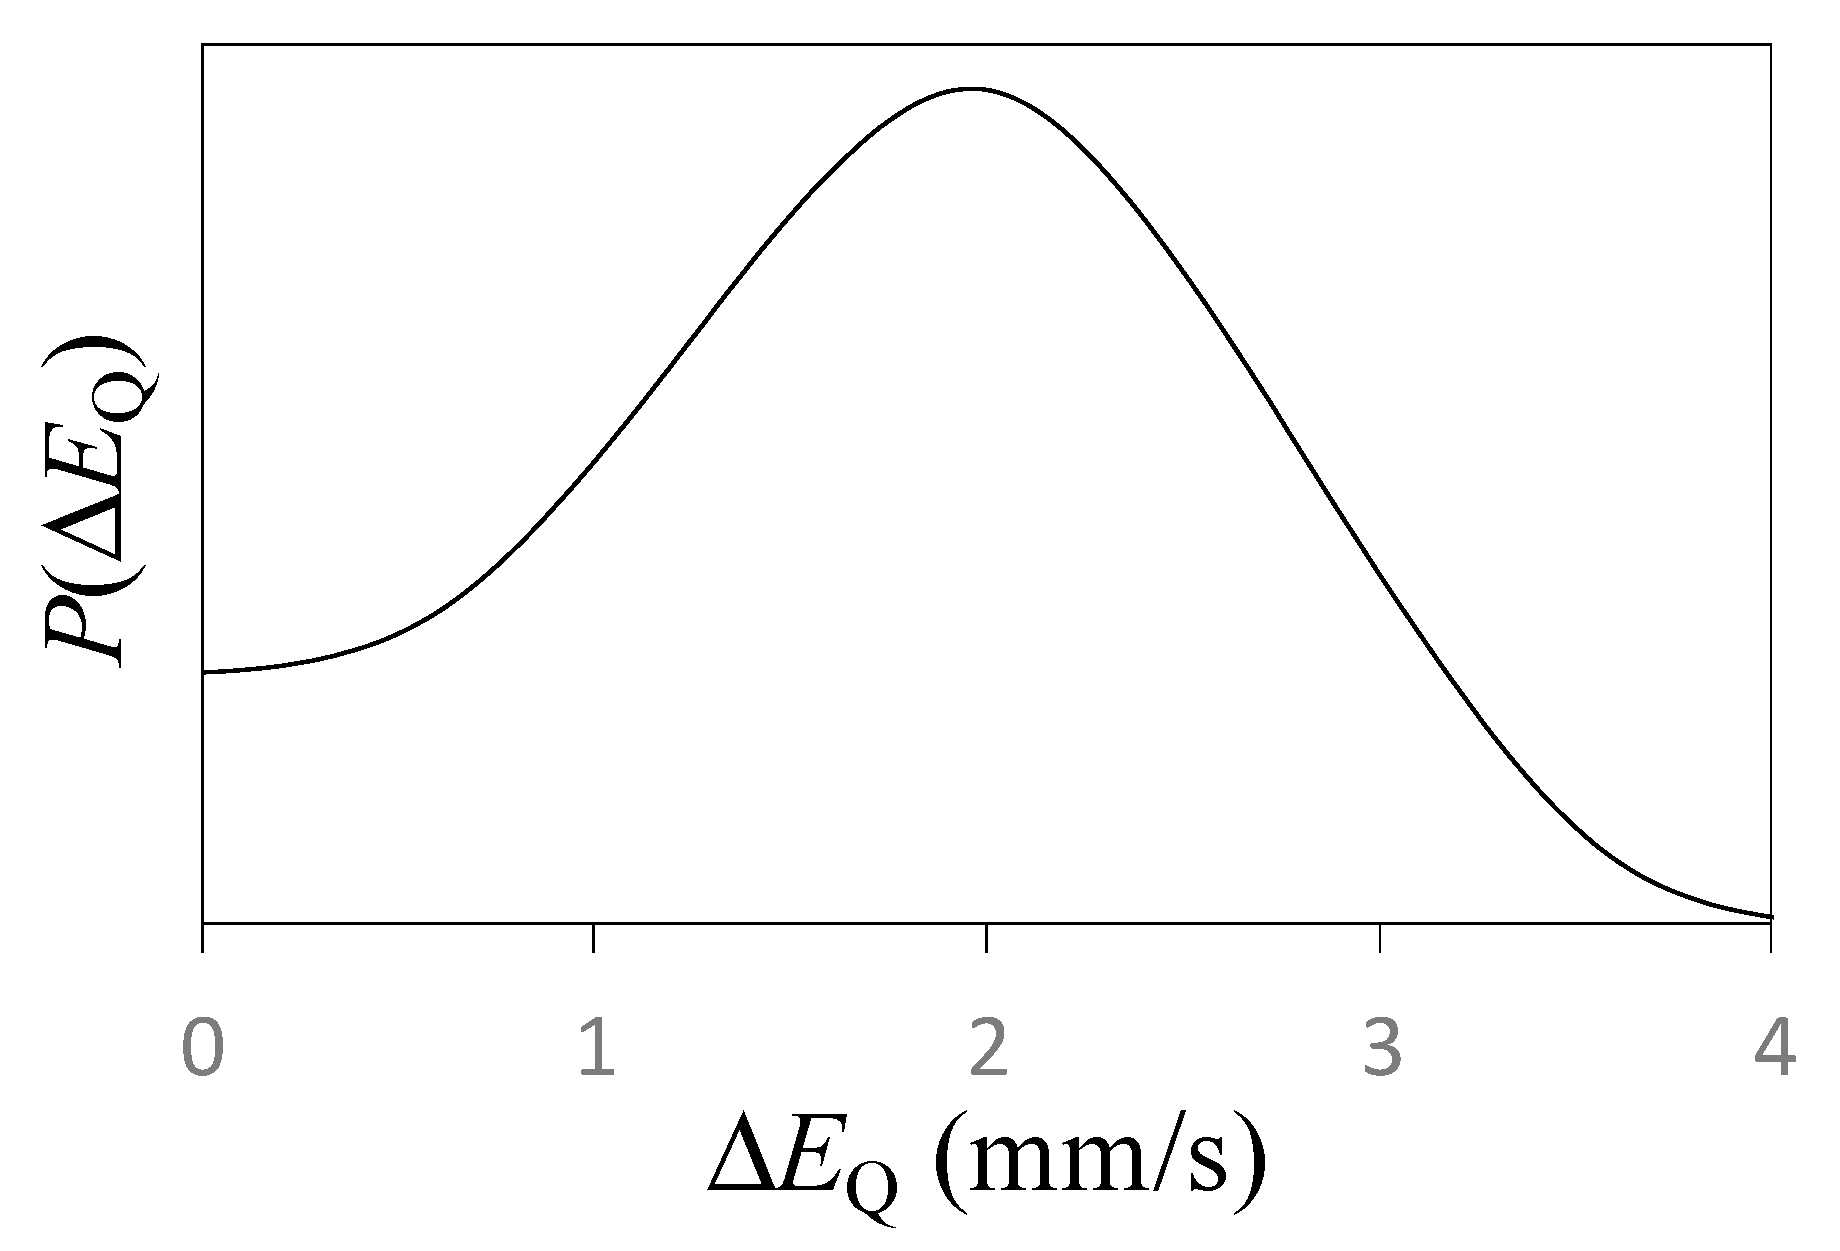
The Fe2+ component was assumed to have the same distribution in all spectra and was simulated using a probability function PEQ), as shown in Figure 5, with three linear segments [36] in the Vinda analysis package [37]. The Fe2+ component has an isomer shift RT> = 0.81(3) mm/s and an average quadrupole splitting <ΔEQ> = 1.81(6) mm/s with a standard deviation of σ(PEQ)) = 0.78(6) mm/s, meaning that the relative distribution [35] of the quadrupole splitting was σ(PEQ))/<ΔEQ> = 43(4)%. Such a high value would, under normal circumstances, be attributed to amorphous local surroundings, but the angular dependence suggests that the probe atoms sensed the crystalline structure of the host. In the final analysis, the area fraction of the Fe2+ component was set to be the same in all spectra: 69(6)%.
Due to the underlying Fe3+ component (D2), it was not possible to determine the area ratio of the legs of the two emission peaks of the doublets in a free fitting, so restrictions had to be introduced. For D1, the ratio of the spectral area of the left emission peak (Al) to that of the right emission peak (Ar) is expressed as [38]:
A l A r = Q ( f ( θ ) 1 ) + 1 ,
with:
f ( θ ) = 3 + 3 cos 2 θ 5 3 cos 2 θ ,
where Q is a ‘quality’ factor for the angular dependence (Q = 1 represents full angular dependence for the VZZ || sample normal, and Q = 0 represents the polycrystalline case). The Q = 0.08(2) value obtained from the fit for D1 is a small but significant departure from the polycrystalline case. The hyperfine parameters of D1 determined from our analysis are listed in Table 1. The parameters do not show a significant difference with the emission angle.
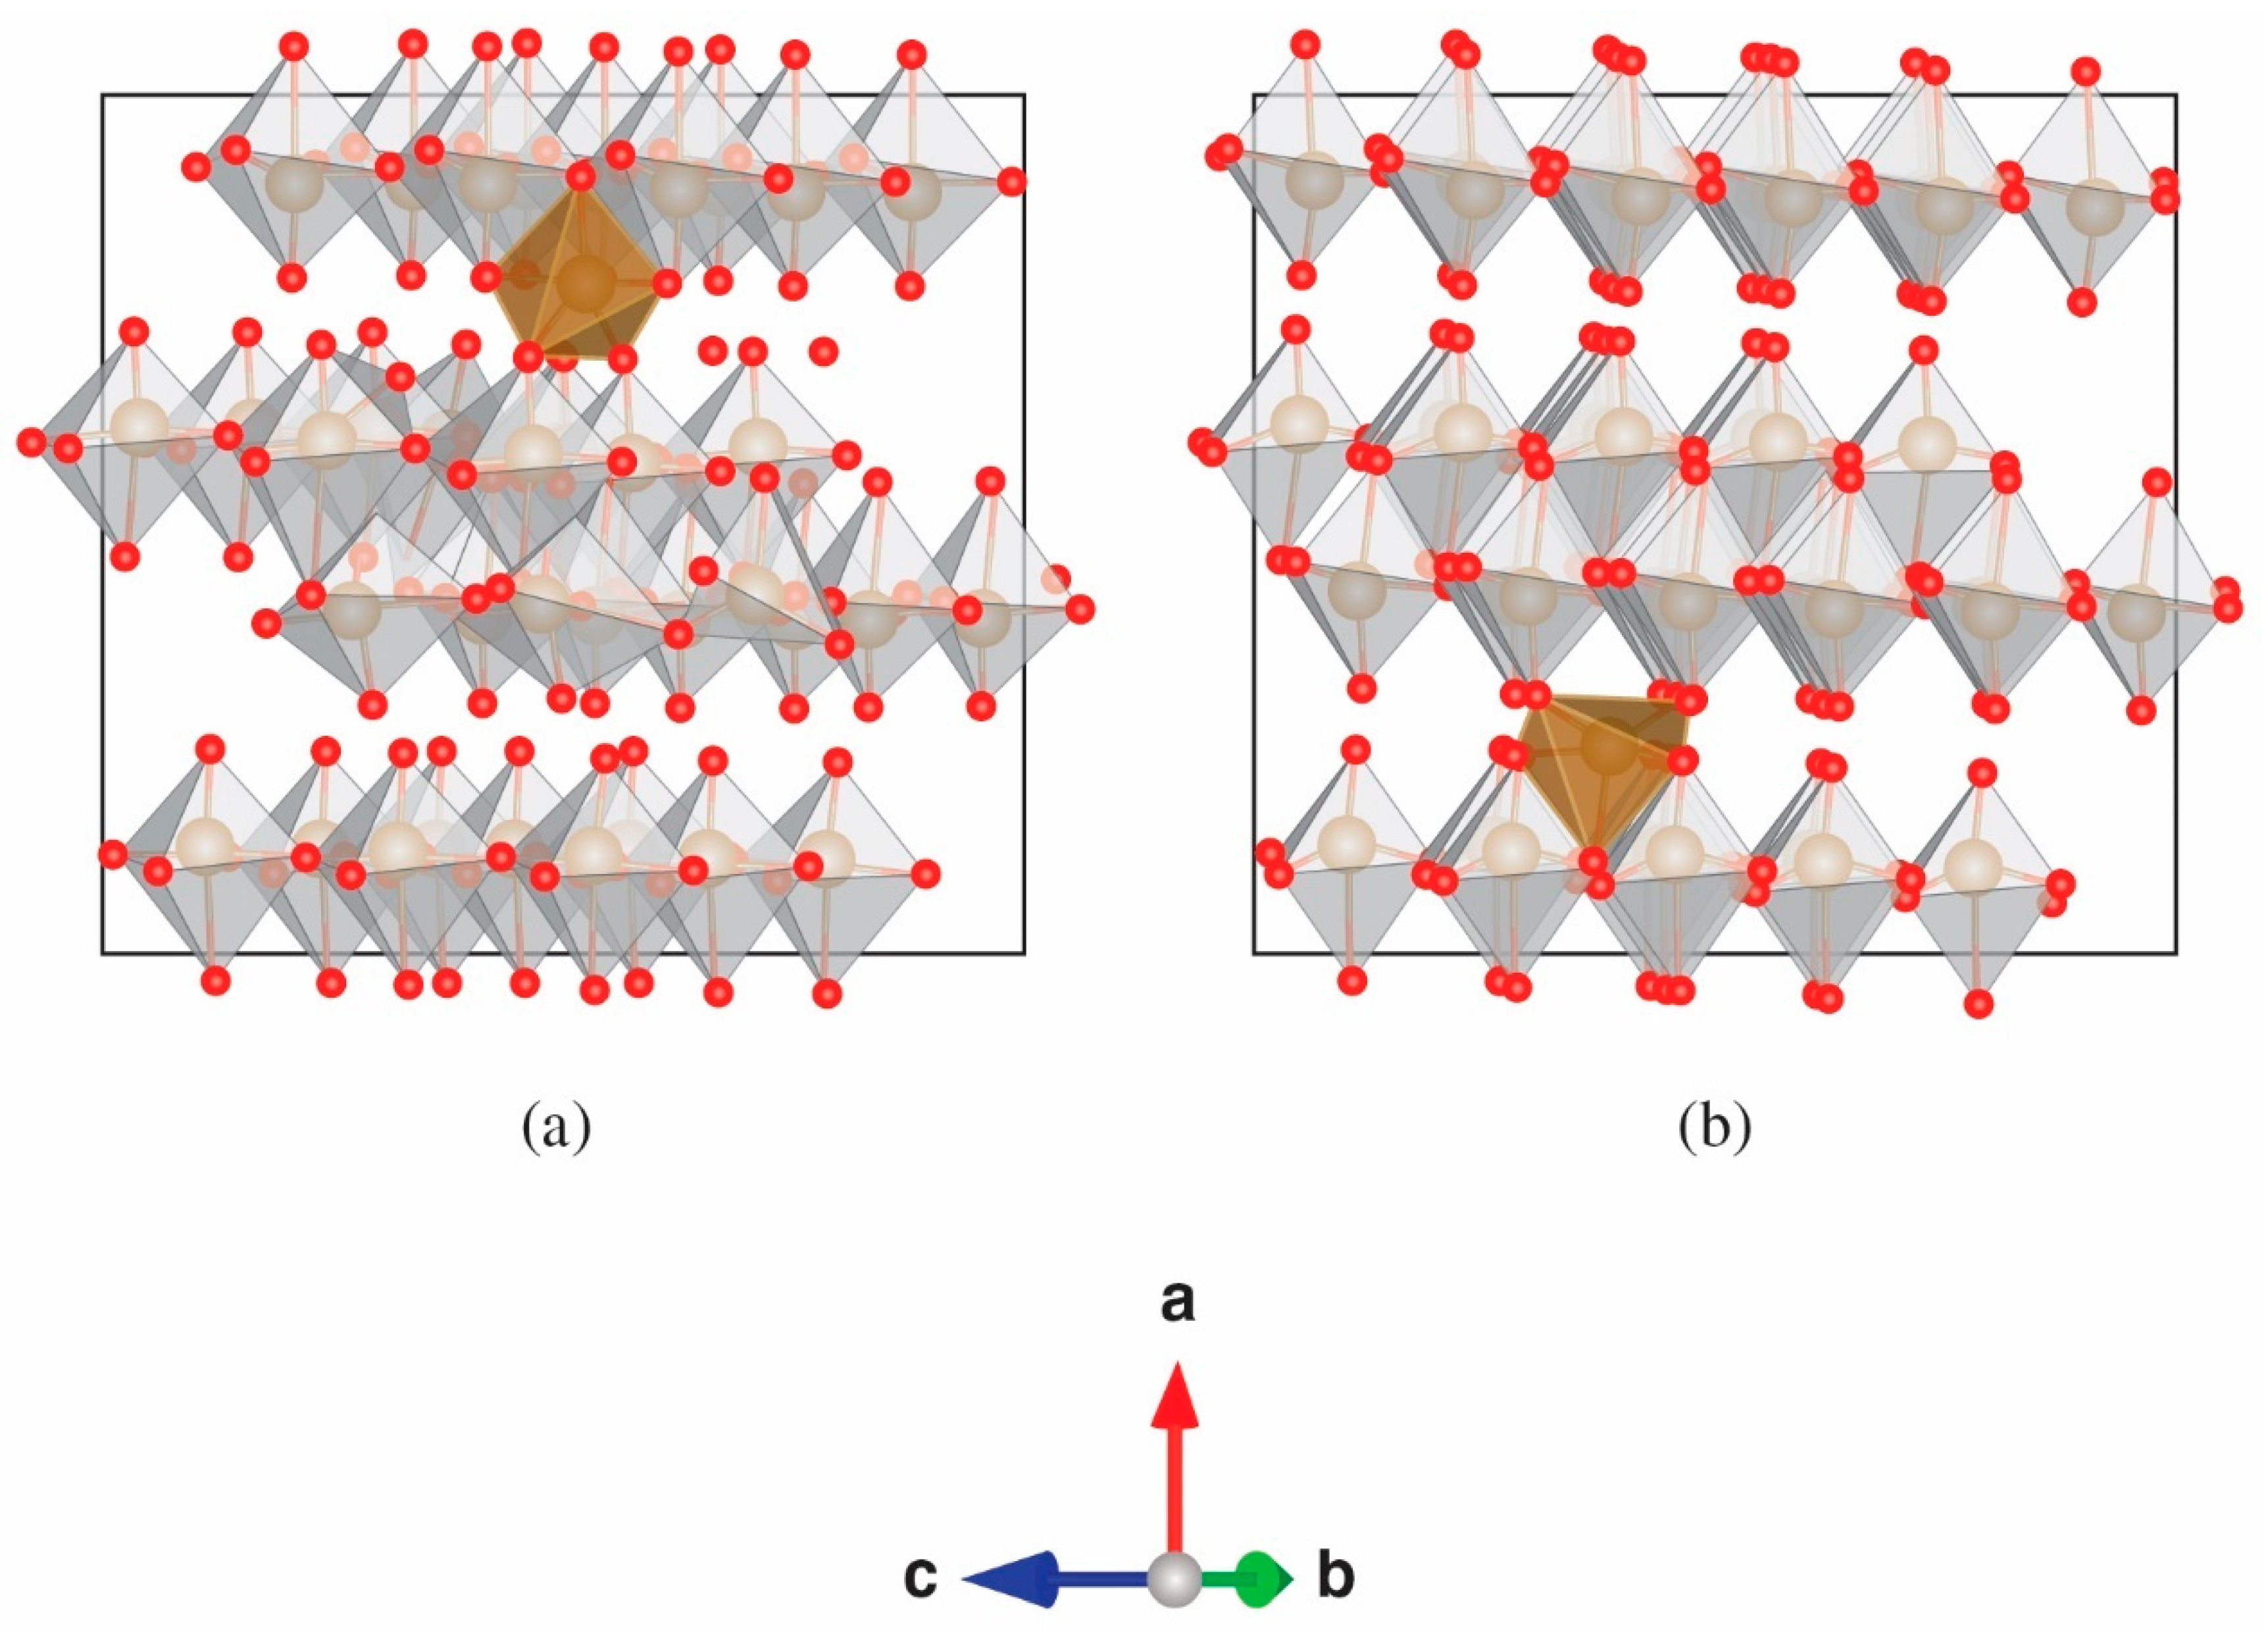
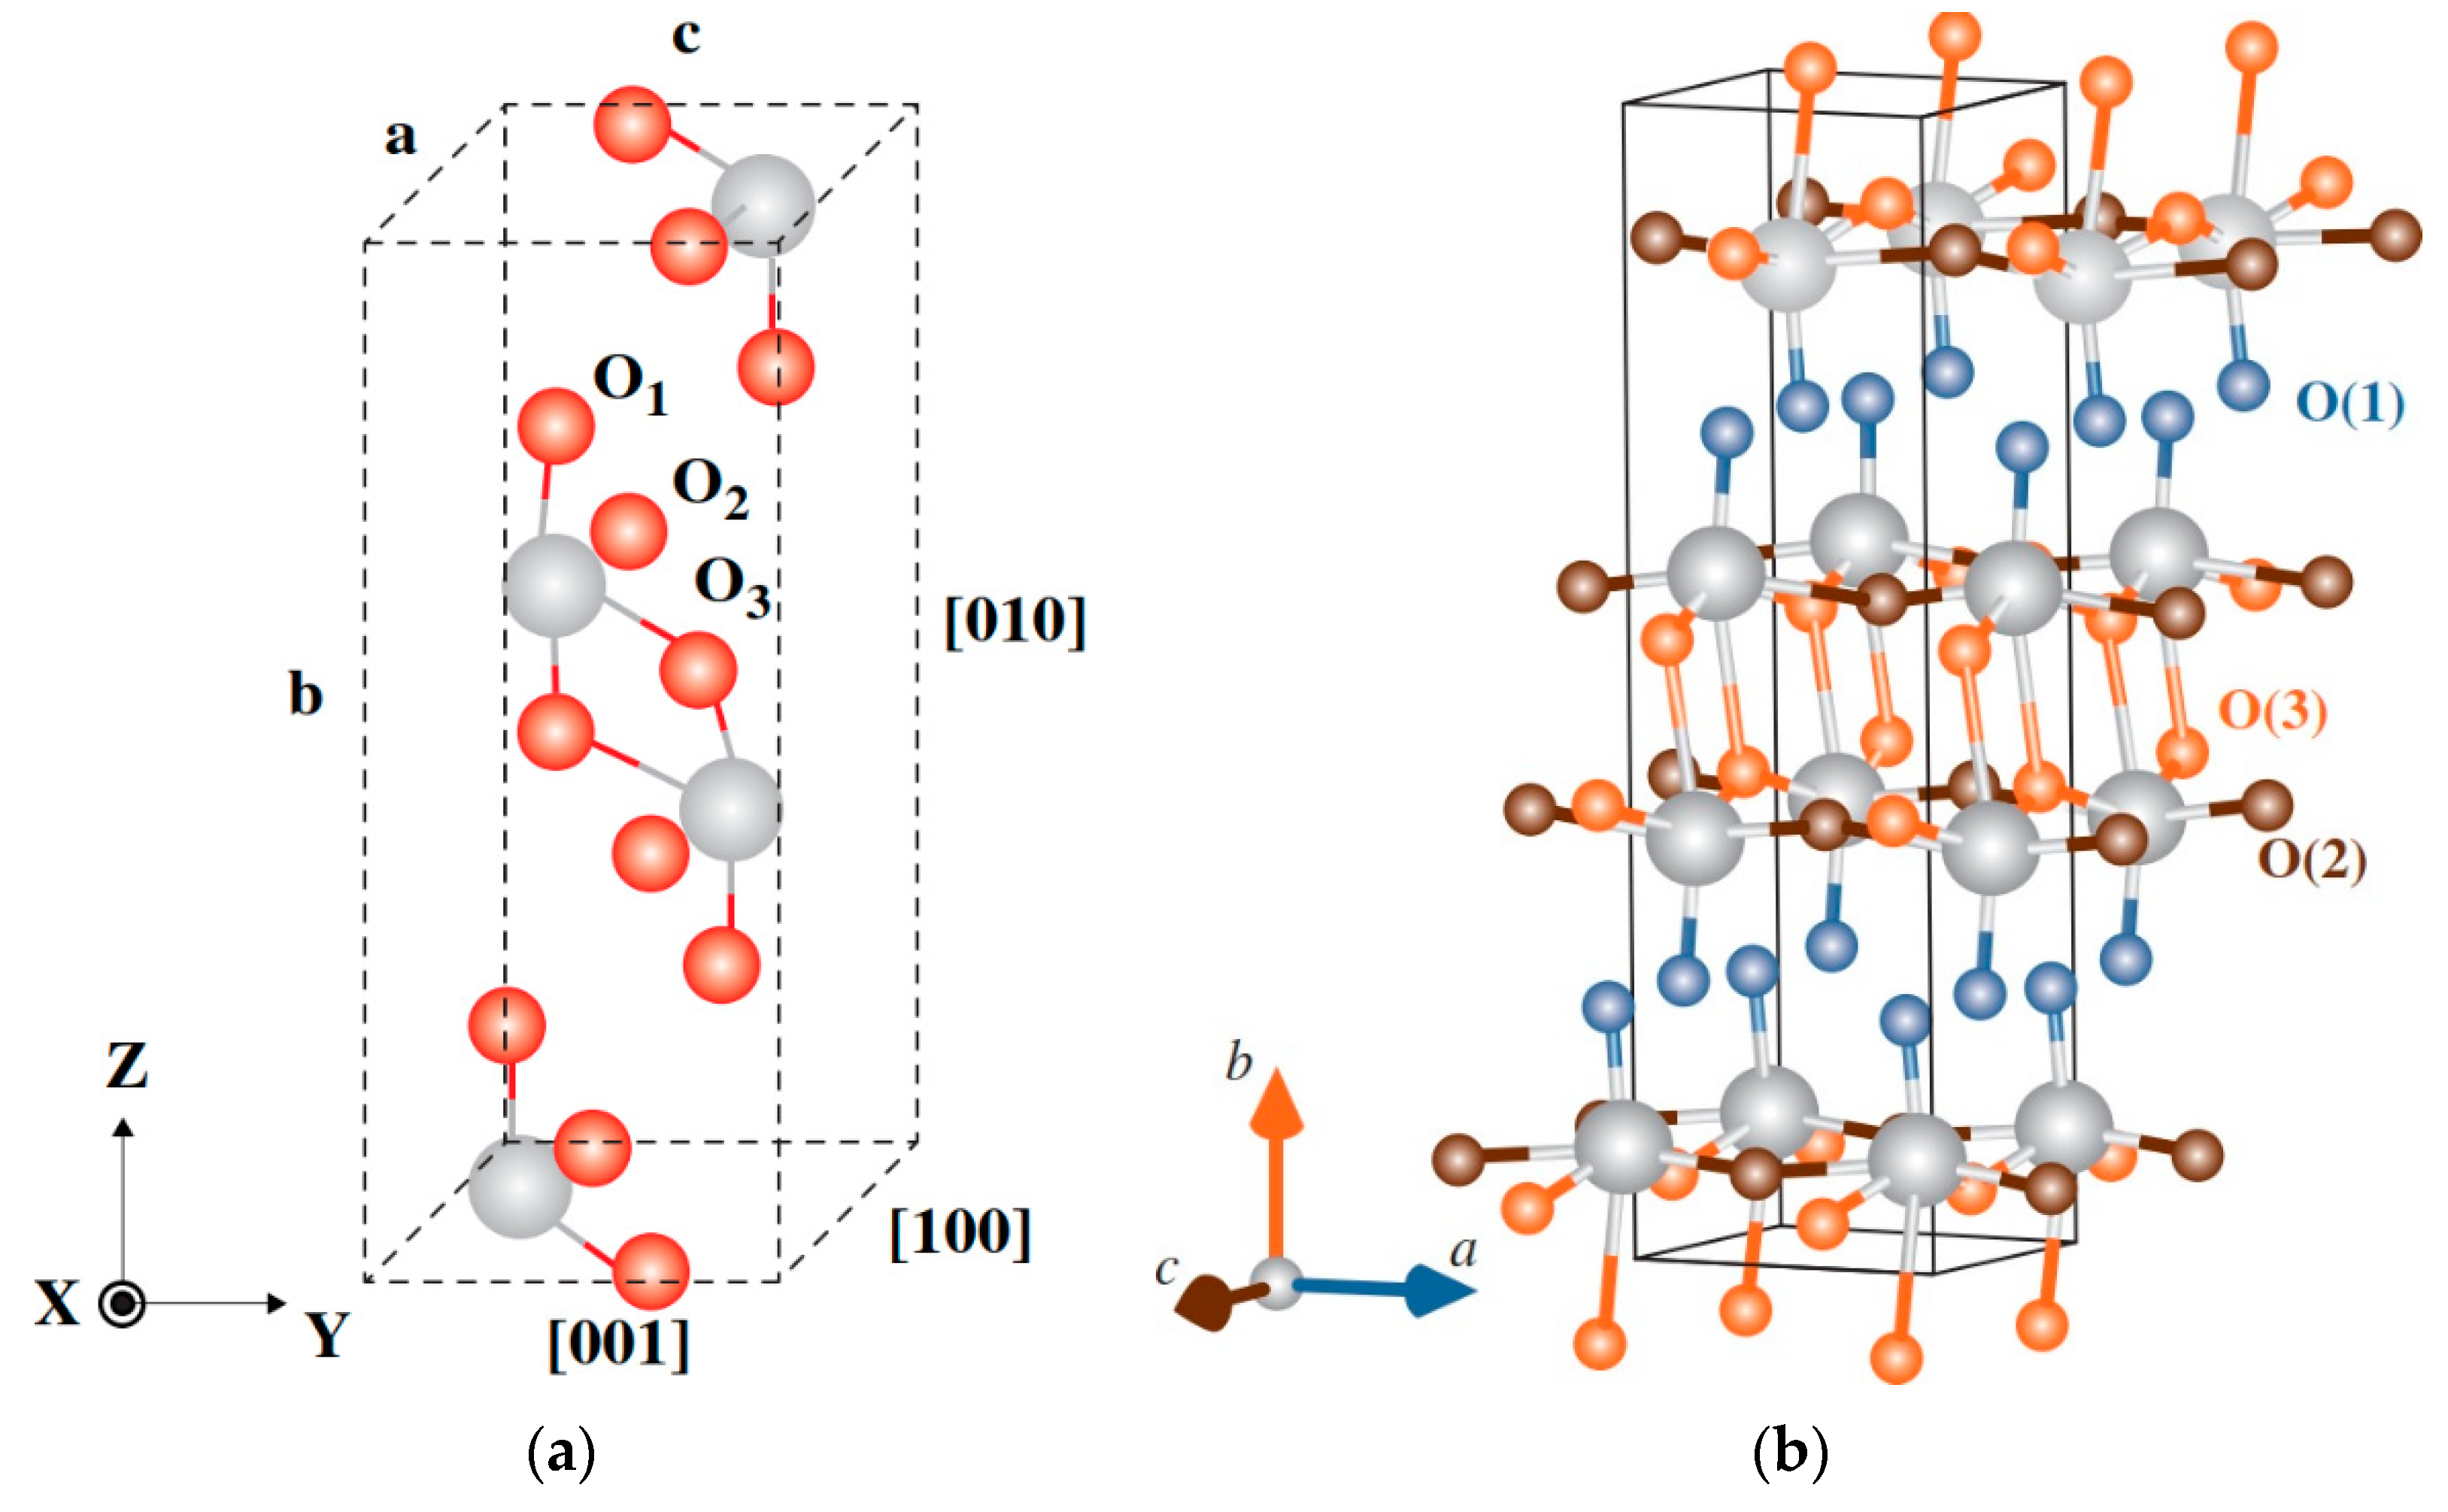
A first simulation step was to optimize the structural parameters for a pure α-MoO3 unit cell, obtaining the lattice parameters a = 14.43 Å, b = 3.76 Å, and c = 3.97 Å, which are close to the values reported from the XRD measurements performed at room temperature: a = 13.85 Å, b = 3.69 Å, and c = 3.96 Å [39]. The lattice parameters determined from our XRD data were a = 13.878 Å, b = 3.696 Å, and c = 3.961 Å and allow a more reasonable comparison with our experiments, which were performed at RT. We then constructed supercells from the optimized cell, 1 × 3 × 3, with the substitution of one Fe for one of the equivalent Mo sites. The final structure was calculated by fully optimizing the atomic parameters while keeping the lattice parameters fixed to the values of the optimized state without Fe. We also considered the case where oxygen vacancies were close to the implanted Fe probe, and the case of having the Fe probe in the van der Waals gap (see Figure 6 and Figure 7).
After relaxation, for the Fe probe located in the van der Waals gap, we obtained two positions between layers (see Figure 6), with one of slightly greater stability. We, therefore, calculated three additional configurations considering the subtraction of one, two, and three electrons. Note that reducing the number of electrons in the calculation produced large changes in the electric-field gradient (EFG) in this case.
For oxygen vacancies close to the implanted Fe probe, all possible combinations of nearest-neighbor O vacancies were evaluated, where O(1), O(2), and O(3) denote singly, 2-fold, and 3-fold coordinated oxygen sites, respectively (see Figure 7). The results are shown in Table 2. The EFG can be converted to the quadrupole splitting using Equations (3) and (4) [42,43] and using Q(57Fe) = 0.17b [43], Ie = 3/2, E0 = 14.4 keV for the 57Fe resonant transition:
Δ E Q = 6 | A Q | 1 + η 2 / 3 ,
A Q = e c Q V z z / [ 4 I e ( 2 I e 1 ) E 0 ] .
The total energies obtained were compared with the cases with the same numbers of atoms so that only the atomic positions changed, making for a direct comparison. Energies for cases with one vacancy were compared with each other to find the most stable case. O(1) was the most stable vacancy.
The case with the O(1) vacancy is not only the most stable of those with one oxygen vacancy but also the case with the calculated quadrupole splitting closest to the average experimental value (experimental <ΔEQ> = 1.81(6) mm/s and calculated Δ = 1.81 mm/s), further suggesting that this was the most likely arrangement in the experiments. In general, ab initio simulations are performed for 0 K, and our measurements were carried out at RT. It is rare to find ab initio simulations of EFGs for higher temperatures, since the commonly used density functional theory is valid strictly only for 0 K. Consideration of the temperature would require, for example, ab initio molecular dynamics for accurate interpretation of the experimental results. As mentioned before, optimized RT α-MoO3 lattice parameters were used here in all configurations, and then the internal parameters were relaxed by force optimization to a force limit below 1 mRy/Å. This procedure is considerably fast [44] and is different from molecular dynamics approaches [45].

4. Discussion

4.1. Local Environment 1 (D1)

For D1, the isomer shift RT> = 0.81(3) mm/s and the average quadrupole splitting <ΔEQ> = 1.81 mm/s. According to our simulations, the observed hyperfine interaction would correspond to Fe at substitutional Mo sites with one neighboring O(1) vacancy. Given the nature of metal oxides, the Mo–O bonding energy can be easily overcome by direct implantation damage, producing nearby vacancies [46]. It is important to emphasize that the density functional theory employed in this work is valid strictly for 0 K. Therefore, it is not possible to directly compare our experimental value with the simulated one. Consideration of the temperature would require, for example, ab initio molecular dynamics, which will be part of our future work. To the best of our knowledge, there is no temperature-dependence study in the literature that can provide the EFG trend close to RT for this complex system.
In the results presented here, D1 has an angular dependency, as can be seen by the dependence of the intensity of the two emission peaks on the emission angle. The angular dependence for the quadrupole splitting distribution of our measurements is due to Fe2+ and not to Fe3+.

4.2. Local Environment 2 (D2)

The more likely interpretation of this component is an unresolved Fe3+ component, showing slow paramagnetic relaxations [34,35,47]. During ion implantation, the formation of various defect types, such as numerous interstitials and vacancies, should be considered, especially in the case of the broad distribution arising from the doublet, which is characteristic of high-spin Fe3+. The present results confirm that the angular dependence shows that the probe atoms are in a crystalline environment for component D1. However, it is difficult to state anything quantitative for D2. The data from [13] suggested the presence of a fast-relaxing Fe3+ component (doublet), which implies that the Fe3+ was not dilute in their sample. Since, in our case, we have a very diluted implantation regime [14,24], it is not possible to compare our data with those reported in [13].

5. Conclusions

The structural properties of high-crystalline-quality α-MoO3 lamellar samples were studied via ion implantation at RT through eMS experiments at ISOLDE-CERN, following implantation of 57Mn (t1/2 = 1.5 min), which decays to the 14.4 keV Mössbauer state. The spectra were fit to two broadened doublets. The results with Fe2+ show evidence of the single crystallinity of the local environment through the angular dependence of the quadrupole interaction for D1. The obtained hyperfine parameters indicate that the asymmetric doublet has a typical isomer shift of high-spin Fe2+, which is <δRT> = 0.8(3) mm/s, and the average quadrupole splitting <ΔEQ> = 1.81(6) mm/s. The second component is characterized by high-spin Fe3+. The large quadrupole splitting of Fe2+ is likely due to a relatively highly distorted configuration near the implanted probe ion. Different configurations for the Fe probe were considered for the ab initio simulations, including Fe at the substitutional Mo site with and without O vacancies. Additionally, simulations considering the Fe probe between layers were performed with different electronic arrangements. The case of Fe at the substitutional Mo site with one vacancy (O1) is not only the most stable configuration among those with one oxygen vacancy but is also the configuration with the calculated quadrupole splitting closest to the average experimental value. However, it is not possible to assign this configuration to the case detected in our experiments with perfect confidence.
The combination of SEM, XRD, and Raman spectroscopy provided evidence of the phase purity, morphology, and crystal quality of the investigated material prior to the eMS measurements.
Ion implantation is a widely used industrial process because it is very easy to reproduce, and the defects introduced in the system can be of technological advantage. In particular, the physical properties of an impurity in the α-MoO3 system depend predominantly on its lattice location. The site of implanted dopants can be determined via the performed eMS measurements combined with ab initio simulations. Therefore, the current study provides a better understanding of the physical properties of Mn/Fe impurities in the α-MoO3 system. The next step is to study the interplay between the thermal effects of post-implantation annealing and the lattice location of Fe and possible defects [48].

Author Contributions

J.S. wrote the manuscript and performed the online measurements; D.Z., K.B.-R., I.U., and T.T.D. assisted with the manuscript writing; J.N.G. performed the simulations; C.D.-G. was responsible for sample preparation and conventional characterization; D.Z., H.P.G. (Haraldur P. Gunnlaugsson), A.T.M.-L., and P.S. were responsible for data analysis; A.T.M.-L. and A.B. contributed to data interpretation; D.Z., I.U., H.P.G. (Haraldur P. Gunnlaugsson), A.T.M.-L., H.M., K.B.-R., T.E.M., S.Ó., R.M., K.J., H.P.G. (Hafliði P. Gíslason), P.B.K., D.N., and B.Q. were also responsible for the online measurements. All authors have read and agreed to the published version of the manuscript.

Funding

We acknowledge the financial support received from the Federal Ministry of Education and Research (BMBF) through grants 05K16PGA, 05K16SI1, and 05K19SI1 ‘eMIL’ and ‘eMMA’. We acknowledge the support of the European Union’s Horizon 2020 Framework research and innovation program under grant agreement no. 654002 (ENSAR2) given to the ISOLDE experiment IS611 ‘Study of molybdenum oxide by means of Perturbed Angular Correlations and Mössbauer spectroscopy’. We further acknowledge Koichi Momma and Fujio Izumi, the creators of VESTA Version 3, for providing the license under Copyright (C) 2006–2021, Koichi Momma, and Fujio Izumi. We thank the Ministry of Economy and Competitiveness Consolider—Ingenio Project CSD2009 0013 ‘IMAGINE’ Spain, and Banco Santander-UCM, project PR87/19-22613. We also acknowledge Österreichische Forschungsförderungsgesellschaft funded projects Competence Headquarters Program E2-Spattertech, Austria, Project: FFGP13222004 and the Austrian Science Fund (FWF), Project: P31423. We are grateful for the support from the Icelandic University Research Fund. K. Bharuth-Ram, H. Masenda, and D. Naidoo acknowledge support from the South African National Research Foundation and the Department of Science and Innovation within the SA-CERN programme. H. Masenda also acknowledges support from the Alexander von Humboldt (AvH) Foundation. I. Unzueta acknowledges the support of Ministry of Economy and Competitiveness (MINECO/FEDER) for grant Nº RTI2018-094683-B-C55. J. N. Gonçalves acknowledges support from by CICECO-Aveiro Institute of Materials (POCI-01-0145-FEDER-007679)—FCT reference (UID/CTM/50011/2013).

Institutional Review Board Statement

Not applicable.

Informed Consent Statement

Not applicable.

Data Availability Statement

Data are available upon reasonable request.

Acknowledgments

We also acknowledge the support of all the technical teams at ISOLDE for their excellent work in delivering high-quality beams for emission Mössbauer measurements.

Conflicts of Interest

The authors declare no conflict of interest.

References

  1. Girotto, C.; Voroshazi, E.; Cheyns, D.; Heremans, P.; Rand, B.P. Solution-processed MoO3 thin films as a hole-injection layer for organic solar cells. ACS Appl. Mater. Interfaces 2011, 3, 3244–3247. [Google Scholar] [CrossRef] [PubMed]
  2. Labanowska, M. EPR monitoring of redox processes in transition metal oxide catalysts. Chem. Phys. Chem. 2001, 2, 712–731. [Google Scholar] [CrossRef]
  3. Comini, E.; Yubao, L.; Brando, Y.; Sberveglieri, G. Gas sensing properties of MoO3 nanorods to CO and CH3OH. Chem. Phys. Lett. 2005, 407, 368–371. [Google Scholar]
  4. Zhou, J.; Xu, N.-S.; Deng, S.-Z.; Chen, J.; She, J.-C.; Wang, Z.L. Large-area nanowire arrays of molybdenum and molybdenum oxides: Synthesis and field emission properties. Adv. Mater. 2003, 15, 1835–1840. [Google Scholar] [CrossRef]
  5. Hu, X.; Zhang, W.; Liu, X.; Mei, Y.; Huang, Y. Nanostructured Mo-based electrode materials for electrochemical energy storage. Chem. Soc. Rev. 2015, 44, 2376–2404. [Google Scholar] [CrossRef]
  6. Yao, J.N.; Hashimoto, K.; Fujishima, A. Photochromism induced in an electrolytically pretreated MoO3 thin film by visible light. Nature 1992, 355, 624–626. [Google Scholar] [CrossRef]
  7. Madhuri, K.V.; Dixit, D. Study on structural and optical properties of thermally evaporated MoO3 thin films. Bull. Mater. Sci. 2022, 45, 83. [Google Scholar] [CrossRef]
  8. Huang, P.-R.; He, Y.; Cao, C.; Lu, Z.-H. Impact of lattice distortion and electron doping on α-MoO3 electronic structure. Sci. Rep. 2014, 4, 7131. [Google Scholar] [CrossRef] [Green Version]
  9. Chen, H.Y.; Su, H.-C.; Chen, C.-H.; Liu, K.-L.; Tsai, C.-M.; Yen, S.-J.; Yew, T.-R. Indium-doped molybdenum oxide as a new p-type transparent conductive oxide. Mater. Chem. 2011, 21, 5745–5752. [Google Scholar] [CrossRef]
  10. Vila, M.; Díaz-Guerra, C.; Jerez, D.; Lorenz, K.; Piqueras, J.; Alves, E. Intense luminescence emission from rare-earth doped MoO3 nanoplates and lamellar crystals for optoelectronic applications. J. Phys. D Appl. Phys. 2014, 47, 355105. [Google Scholar] [CrossRef]
  11. Pereira, D.R.; Díaz-Guerra, C.; Peres, M.; Magalhaes, S.; Correia, J.G.; Marques, J.G.; Silva, A.G.; Alves, E.; Lorenz, K. Engineering strain and conductivity of MoO3 by ion implantation. Acta Mater. 2019, 169, 15–27, Erratum in 2020, 199, 425–428. [Google Scholar] [CrossRef]
  12. Pereira, D.R.; Peresa, M.; Alves, L.C.; Correia, J.G.; Díaz-Guerra, C.; Silva, A.G.; Alves, E.; Lorenz, K. Electrical characterization of molybdenum oxide lamellar crystals irradiated with UV light and proton beams. Surf. Coat. Technol. 2018, 355, 50–54. [Google Scholar] [CrossRef]
  13. Zhetbaev, A.; Ibragimov, S.S.; Shokanov, A. Mössbauer study of molybdenum oxidation kinetics. J. Phys. Colloq. 1980, 41, C1-387–C1-388. [Google Scholar] [CrossRef]
  14. Qi, B.; Gunnlaugsson, H.P.; Ólafsson, S.; Gislason, H.P.; Thorsteinsson, E.B.; Arnalds, U.B.; Mantovan, R.; Unzueta, I.; Zyabkin, D.V.; Bharuth-Ram, K.; et al. Metal-insulator transition in crystalline V2O3 thin films probed at atomic scale using emission Mössbauer spectroscopy. Thin Solid Films 2020, 714, 138389. [Google Scholar] [CrossRef]
  15. Zyabkin, D.V.; Gunnlaugsson, H.P.; Gonçalves, J.N.; Bharuth-Ram, K.; Qi, B.; Unzueta, I.; Naidoo, D.; Mantovan, R.; Masenda, H.; Ólafsson, S.; et al. Experimental and theoretical study of electronic and hyperfine properties of hydrogenated anatase (TiO2): Defect interplay and thermal stability. J. Phys. Chem. C. 2020, 124, 7511–7522. [Google Scholar] [CrossRef] [Green Version]
  16. Stevens, J.G. Isomer shift reference scales. Hyperfine Interact. 1983, 13, 221–236. [Google Scholar] [CrossRef]
  17. Peelaers, H.; Chabinyc, M.L.; Van de Walle, C.G. Controlling n-type doping in MoO3. Chem. Mater. 2017, 29, 2563–2567. [Google Scholar] [CrossRef]
  18. Ouyang, Q.-Y.; Li, L.; Wang, Q.-S.; Zhang, Y.; Wang, T.-S.; Meng, F.-N.; Chen, Y.-J.; Gao, P. Facile synthesis and enhanced H2S sensing performances of Fe-doped α-MoO3 micro-structures. Sens. Actuators B Chem. 2012, 169, 17–25. [Google Scholar] [CrossRef]
  19. Tiwari, S.; Master, R.; Choudhary, R.J.; Phase, D.M.; Ahuja, B.L. Effect of oxygen partial pressure and Fe doping on growth and properties of metallic and insulating molybdenum oxide thin films. J. Appl. Phys. 2012, 111, 083905. [Google Scholar] [CrossRef]
  20. Weyer, G.; The ISOLDE Collaboration. Mössbauer spectroscopy at ISOLDE. Hyperfine Interact. 2000, 129, 371–390. [Google Scholar] [CrossRef]
  21. Weyer, G. Defects in semiconductors—results from Mössbauer spectroscopy. Hyperfine Interact. 2007, 177, 1–13. [Google Scholar] [CrossRef]
  22. Johnston, K.; Schell, J.; Correia, J.G.; Deicher, M.; Gunnlaugsson, H.P.; Fenta, A.S.; David-Bosne, E.; Costa, A.R.G.; Lupascu, D.C. The solid state physics programme at ISOLDE: Recent developments and perspectives. J. Phys. G Nucl. Part. Phys. 2017, 44, 104001. [Google Scholar] [CrossRef]
  23. Catherall, R.; Andreazza, W.; Breitenfeldt, M.; Dorsival, A.; Focker, G.J.; Gharsa, T.P.; Giles, T.; Grenard, J.-L.; Locci, F.; Martins, P.; et al. The ISOLDE facility. J. Phys. G Nucl. Part. Phys. 2017, 44, 094002. [Google Scholar] [CrossRef] [Green Version]
  24. Mantovan, R.; Fallica, R.; Gerami, A.M.; Mølholt, T.E.; Wiemer, C.; Longo, M.; Gunnlaugsson, H.P.; Johnston, K.; Masenda, H.; Naidoo, D.; et al. Atomic-scale study of the amorphous-to-crystalline phase transition mechanism in GeTe thin films. Sci. Rep. 2017, 7, 8234. [Google Scholar] [CrossRef] [PubMed] [Green Version]
  25. Ziegler, J.F.; Ziegler, M.D.; Biersack, J.P. SRIM—The Stopping and Range of Ions in Matter. Nucl. Instr. Meth. 2010, B268, 1818–1823. [Google Scholar] [CrossRef] [Green Version]
  26. Kresse, G.; Furthmüller, J. Efficient iterative schemes for ab initio total-energy calculations using a plane-wave basis set. Phys. Rev. B 1996, 54, 11169–11186. [Google Scholar] [CrossRef]
  27. Blöchl, P.E. Projector augmented-wave method. Phys. Rev. B 1994, 50, 17953–17979. [Google Scholar] [CrossRef] [Green Version]
  28. Perdew, J.P.; Burke, K.; Ernzerhof, M. Generalized gradient approximation made simple. Phys. Rev. Lett. 1996, 77, 3865–3868. [Google Scholar] [CrossRef] [Green Version]
  29. Dudarev, S.L.; Botton, G.A.; Savrasov, S.Y.; Humphreys, C.J.; Sutton, A.P. Electron-energy-loss spectra and the structural stability of nickel oxide: An LSDA + U study. Phys. Rev. B 1998, 57, 1505–1509. [Google Scholar] [CrossRef]
  30. Zheng, H.C. Vapour phase growth of orthorhombic molybdenum trioxide crystals at normal pressure of purified air. J. Cryst. Growth 1998, 186, 393–402. [Google Scholar] [CrossRef]
  31. Py, M.A.; Maschke, K. Intra- and interlayer contributions to the lattice vibrations in MoO3. Physica B+C 1981, 105, 370–374. [Google Scholar] [CrossRef]
  32. Dieterle, M.; Weinberg, G.; Mestl, G. Raman spectroscopy of molybdenum oxides: Part I. Structural characterization of oxygen defects in MoO3−x by DR UV/VIS, Raman spectroscopy and x-ray diffraction. Phys. Chem. Chem. Phys. 2002, 4, 812–821. [Google Scholar] [CrossRef]
  33. Vila, M.; Díaz-Guerra, C.; Lorenz, K.; Piqueras, J.; Píš, I.; Magnano, E.; Munuera, C.; Alves, E.; García-Hernández, M. Effects of thermal annealing on the structural and electronic properties of rare earth-implanted MoO3 nanoplates. CrystEngComm 2017, 19, 2339–2348. [Google Scholar] [CrossRef]
  34. Mølholt, T.E.; Gunnlaugsson, H.P.; Johnston, K.; Mantovan, R.; Masenda, H.; Ólafsson, S.; Bharuth-Ram, K.; Gislason, H.P.; Langouche, G.; Weyer, G. ISOLDE Collaboration. Spin-lattice relaxations of paramagnetic Fe3+ in ZnO. Phys. Scr. 2012, 2012, 014006. [Google Scholar] [CrossRef]
  35. Mølholt, T.E.; Mantovan, R.; Gunnlaugsson, H.P.; Naidoo, D.; Ólafsson, S.; Bharuth-Ram, K.; Fanciulli, M.; Johnston, K.; Kobayashi, Y.; Langouche, G.; et al. Observation of spin-lattice relaxations of dilute Fe3+ in MgO by Mössbauer spectroscopy. Hyperfine Interact. 2010, 197, 89–94. [Google Scholar] [CrossRef]
  36. Gunnlaugsson, H.P. A simple model to extract hyperfine interaction distributions from Mössbauer spectra. Hyperfine Interact. 2006, 167, 851–854. [Google Scholar] [CrossRef]
  37. Gunnlaugsson, H.P. Spreadsheet based analysis of Mössbauer spectra. Hyperfine Interact. 2016, 237, 79. [Google Scholar] [CrossRef]
  38. Gütlich, P.; Bill, E.; Trautwein, A.X. Mössbauer Spectroscopy and Transition Metal Chemistry: Fundamentals and Applications; Springer: Berlin/Heidelberg, Germany, 2011. [Google Scholar]
  39. Sitepu, H.; O’Connor, B.H.; Li, D. Comparative evaluation of the march and generalized spherical harmonic preferred orientation models using X-ray diffraction data for molybdite and calcite powders. J. Appl. Crystallogr. 2005, 38, 158–167. [Google Scholar] [CrossRef]
  40. Momma, K.; Izumi, F. VESTA 3 for three-dimensional visualization of crystal, volumetric and morphology data. J. Appl. Crystallogr. 2011, 44, 1272–1276. [Google Scholar] [CrossRef]
  41. Ma, W.; Alonso-González, P.; Li, S.; Nikitin, A.Y.; Yuan, J.; Martín-Sánchez, J.; Taboada-Gutiérrez, J.; Amenabar, I.; Li, P.; Vélez, S.; et al. In-plane anisotropic and ultra-low-loss polaritons in a natural van der Waals crystal. Nature 2018, 562, 557–563. [Google Scholar] [CrossRef] [Green Version]
  42. Greenwood, N.N.; Gibb, T.C. Mössbauer Spectroscopy; Chapman and Hall: London, UK, 1971. [Google Scholar]
  43. Wdowik, U.D.; Ruebenbauer, K. Calibration of the isomer shift for the 14.4-keV transition in 57Fe using the full-potential linearized augmented plane-wave method. Phys. Rev. B 2007, 76, 155118-1–155118-6. [Google Scholar] [CrossRef]
  44. Blaha, P.; Schwarz, K.; Tran, F.; Laskowski, R.; Madsen, G.K.H.; Marks, L.D. WIEN2k: An APW+lo program for calculating the properties of solids. J. Chem. Phys. 2020, 152, 074101. [Google Scholar] [CrossRef] [PubMed]
  45. Car, R.; Parrinello, M. Unified approach for molecular dynamics and density-functional theory. Phys. Rev. Lett. 1985, 55, 2471–2474. [Google Scholar] [CrossRef] [PubMed] [Green Version]
  46. Gunnlaugsson, H.P.; Mantovan, R.; Masenda, H.; Mølholt, T.E.; Johnston, K.; Bharuth-Ram, K.; Gislason, H.; Langouche, G.; Naidoo, D.; Ólafsson, S.; et al. ISOLDE Collaboration. Defect annealing in Mn/Fe-implanted TiO2 (rutile). J. Phys. D Appl. Phys. 2014, 47, 065501-1–065501-7. [Google Scholar] [CrossRef]
  47. Gunnlaugsson, H.P.; Johnston, K.; Mølholt, T.E.; Weyer, G.; Mantovan, R.; Masenda, H.; Naidoo, D.; Ólafsson, S.; Bharuth-Ram, K.; Gíslason, H.P.; et al. ISOLDE Collaboration. Lattice locations and properties of Fe in Co/Fe co-implanted ZnO. Appl. Phys. Lett. 2012, 100, 042109-1–042109-4. [Google Scholar] [CrossRef]
  48. Schell, J.; Correia, J.G.M.; Lorenz, K.; Peres, M.; Díaz-Guerra, C.; Gunnlaugsson, H.P.; Tarazaga, A.; Deicher, M. Study of Molybdenum Oxide by Means of Perturbed Angular Correlations and Mössbauer Spectroscopy. Proposal to the ISOLDE and Neutron Time-of-Flight Committee. 2016, CERN-INTC-2016-004/INTC-P-454. Available online: https://cds.cern.ch/record/2119980/files/INTC-P-454.pdf (accessed on 31 May 2022).
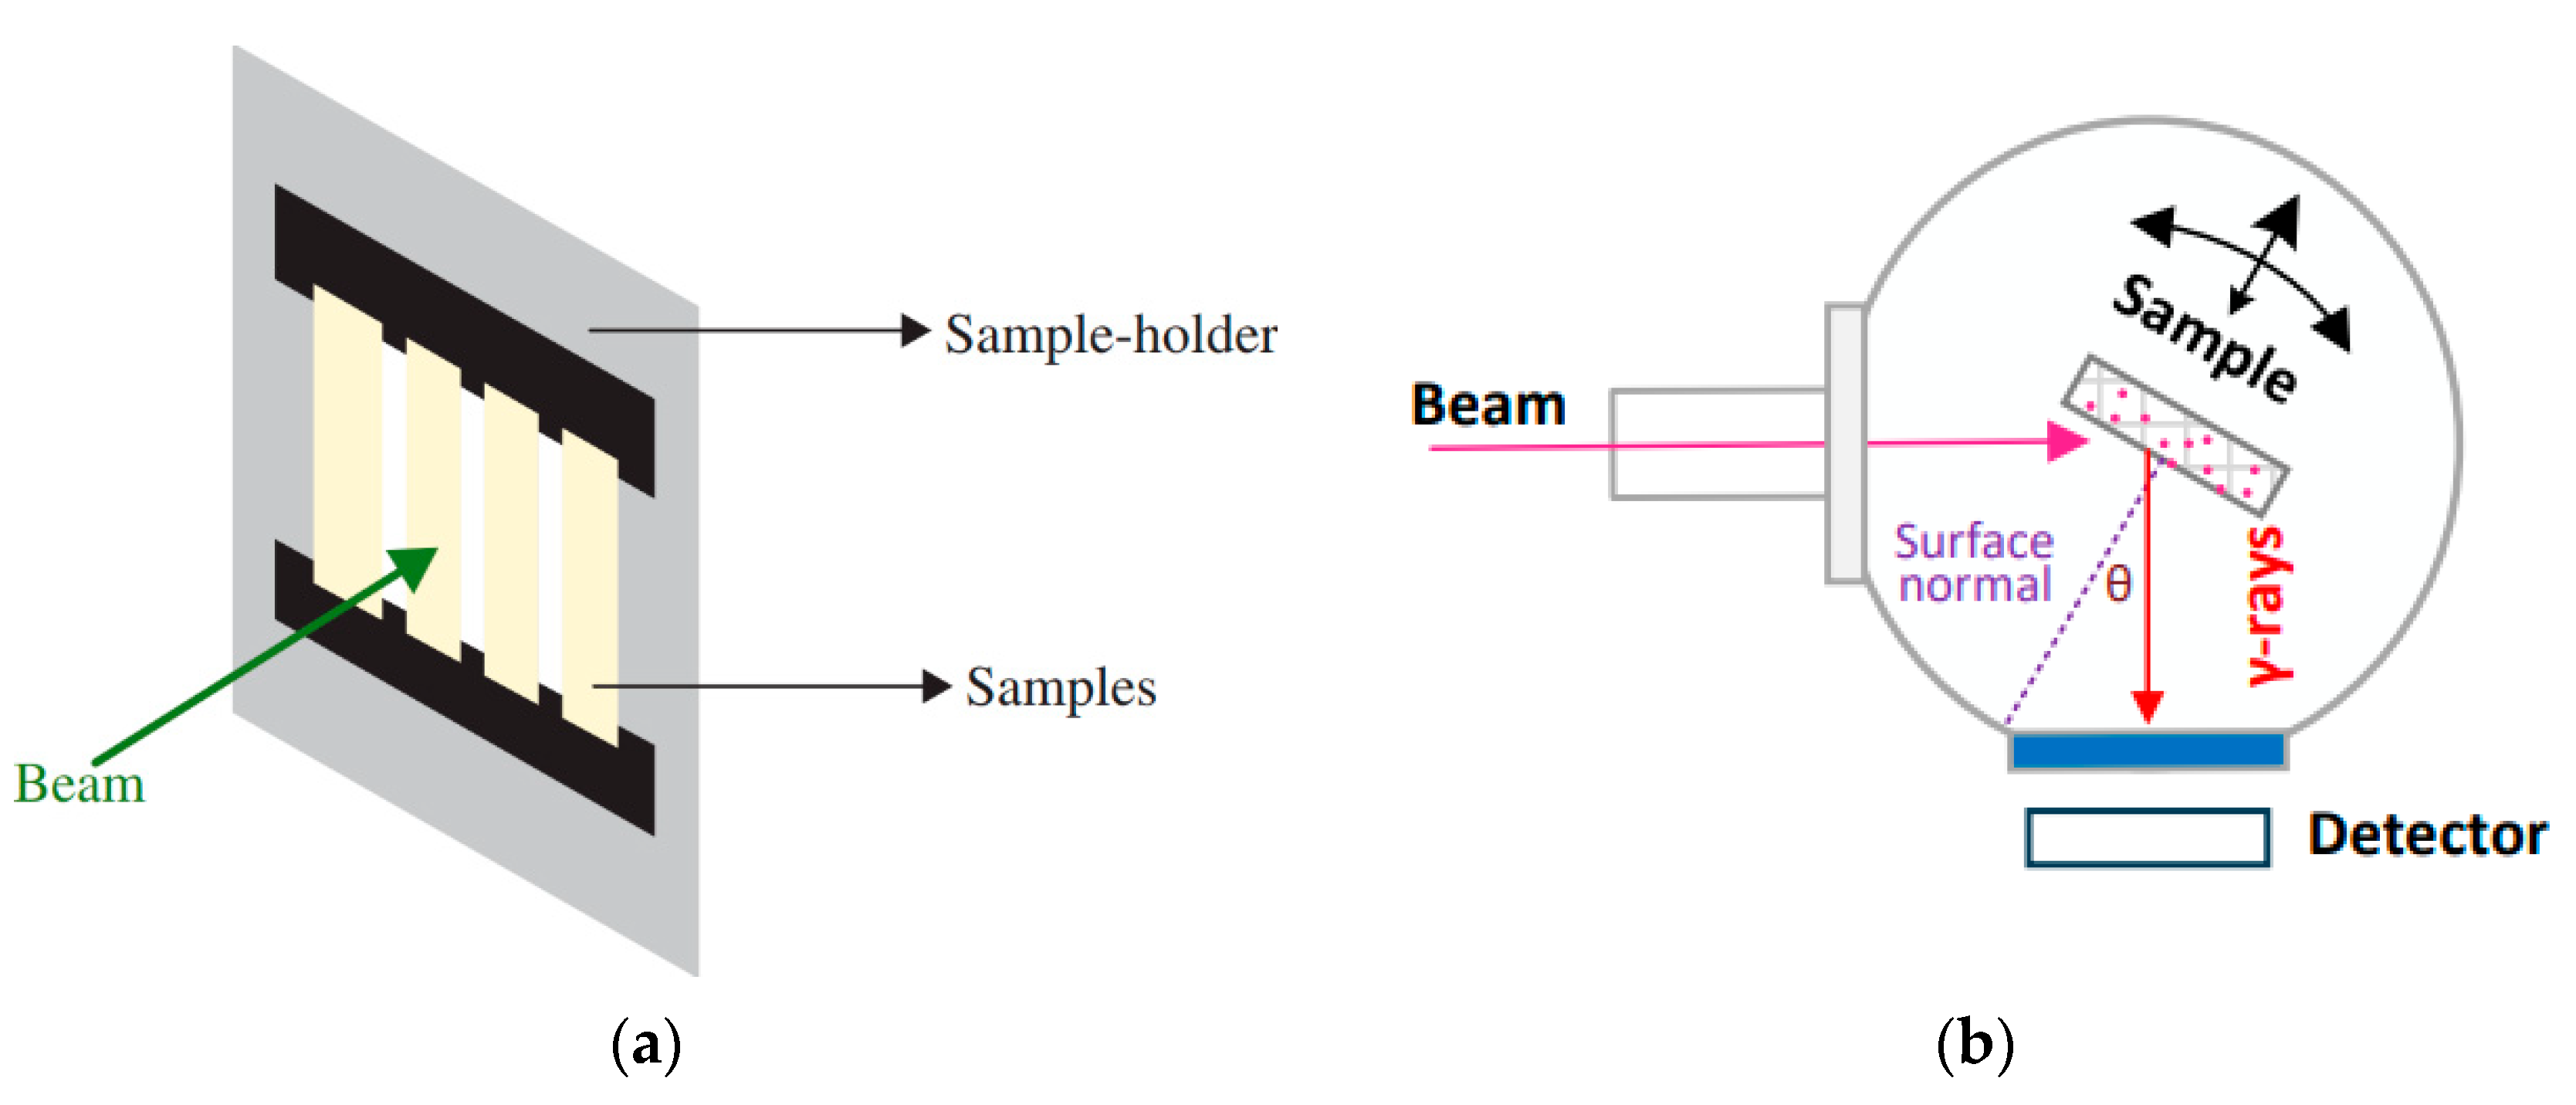
Figure 1. (a) Schematic view showing the orientation of the samples relative to the direction of the 57Mn beam. (b) Top view of the experimental set-up indicating the γ-emission angle θ.
Crystals 12 00942 g001
Figure 2. Room-temperature SEM images of samples taken before the implantation process.
Crystals 12 00942 g002
Figure 3. (a) SEM−EDX spectrum, (b) XRD pattern, and (c) Raman spectrum of the as-grown crystals.
Crystals 12 00942 g003
Figure 4. 57Fe emission Mössbauer spectra of α-MoO3 lamella crystals obtained at room temperature after implantation of 57Mn at (a) 0°, (b) 30°, and (c) 60°.
Crystals 12 00942 g004
Figure 5. Quadrupole splitting distribution used to analyze the spectra in Figure 3 for spectral component D1. The linear segment distribution has been folded with the experimental line broadening.
Crystals 12 00942 g005
Figure 6. α-MoO3 supercells with the Fe probe located in the van der Waals gap at (a) position 1 and (b) position 2. Drawings were produced by VESTA [40].
Crystals 12 00942 g006
Figure 7. (a) Example of the local complexity of the α-MoO3 unit cell (image produced by [41]). (b) Schematic of three non-equivalent O positions labeled with different colors (image produced by [17]). Large spheres represent Mo atoms while smaller spheres represent O atoms.
Crystals 12 00942 g007
Table 1. Experimental hyperfine parameters obtained at RT for D1.
Emission Angle
D1δ (mm/s)0.81(3)
<ΔEQ> (mm/s)1.81(6)
Area (%)69(6)
Table 2. Results for the calculation in 1 × 3 × 3 supercells for the Fe probe in different configurations. Calculated Vzz, asymmetry parameter η, electric quadrupole splitting ΔEQ, and total energy per formula unit (Fe/Mo atoms, there are 36 formula units) relative to the most stable state.
Fe ConfigurationVzz (1021 V/m2)ηΔEQ (mm/s)Energy (meV/f.u.)
Substitutional to Mo2.830.300.51--
Substitutional to Mo with O(1) vacancy10.180.001.810
Substitutional to Mo with O(2) vacancies−7.940.151.4139
Substitutional to Mo with O(3) vacancy−3.900.400.7196
Publisher’s Note: MDPI stays neutral with regard to jurisdictional claims in published maps and institutional affiliations.