Article

Parametrical Study on the Capillary Flowing Characteristics of the Parallel Microchannel Array

1
School of Mechanical, Electrical & Information Engineering, Shandong University, Weihai 264209, China
2
Suzhou Research Institute, Shandong University, Suzhou 215123, China
3
Weihai Institute of Industrial Technology, Shandong University, Weihai 264209, China
4
Fluid and Process Dynamics Group, School of Engineering, Swinburne University of Technology, Hawthorn, VIC 3122, Australia
*
Author to whom correspondence should be addressed.
Crystals 2022, 12(7), 950; https://doi.org/10.3390/cryst12070950
Submission received: 1 June 2022 / Revised: 2 July 2022 / Accepted: 5 July 2022 / Published: 7 July 2022
(This article belongs to the Section Crystalline Metals and Alloys)

Abstract

:
The flow mechanism within a silicon-based micro heat sink plays a crucial role in two-phase thermal dissipation technology. In this study, the effect of geometrical properties on the flow behavior within a silicon-based array parallel microchannel as the evaporator of a silicon-based micro loop heat pipe (s-mLHP) is experimentally and numerically investigated. Here, three arrayed microchannels with different aspect ratio (AR) parameters (depth of 180 μm and AR of 6, 9, and 15) are specially fabricated. A visual experiment platform is established to observe and measure capillary properties of microchannels characterized by the suction distance. In addition, a validated numerical model (the maximum deviation less than 38.3%) is applied to simulate the flow characteristics of microchannels with different ARs. Numerical solutions show that the microchannel with ARs taken between 3 and 4 achieves the best capillary pumping performance within the studied range (suction distance up to 0.8 mm), which provides a theoretical basis for further exploration of silicon-based microchannel array with the optimal flow and thermal performance.

1. Introduction

Given the continuous integration of internal chip transistors for 5G electronic components, the overheating caused by the ultra-high heat flux density generated during operation has become a bottleneck for micro-miniature and ultra-thin components. The “10 °C rule” states that the efficiency of semiconductor electronic components reduces by half when the temperature of its chip rises by 10 °C [1]. Therefore, improvements in heat dissipation technology (miniaturization and high heat dissipation performance) for electronic products are required. Heat sink cooling solutions of microchannels on the microscale have attracted extensive attention [2,3,4]. The silicon-based microchannel heat dissipation unit has become an up-and-coming chip cooling solution for microelectronic devices, characterized by a flexible layout, a good heat transfer behavior, and mass production [5,6,7], which can be directly integrated and packaged with the chip.
The influence of the internal flow of the heat exchanger on the heat transfer has been reported by numerous studies. Qu et al. [8] experimentally investigated fluid flow in trapezoidal silicon microchannels. A roughness–viscosity model was proposed to interpret the experimental data, which showed that viscous force is an essential factor affecting the flow properties of silicon-based microchannels. The energy dissipation due to the viscous force had a great influence on the surface convection heat transfer coefficient of the microchannel [9]. The dynamic viscosity characteristic can make the working fluid perform periodic disturbances to enhance convective boiling heat transfer. A study showed that modulating the wettability of microchannels is an effective method to improve flow boiling [10]. Soleimani et al. [11] used computational fluid dynamics (CFD) to simulate the subcooled flow boiling inside the microchannel. They found that the movement of bubbles during the heat transfer process of two-phase flow caused thermal boundary layer disturbance and enhanced the heat transfer capacity, indicating the crucial role of flow performance of the working fluid inside the microchannel on its heat transfer. The above studies showed that high-speed liquid transport was a prerequisite for high heat transfer performance. However, they did not delve into the mechanism of the effect of flow characteristics.
In order to obtain an evaporator structure with high transport fluid properties, the capillary properties of the fluid should be investigated. Inspired by some natural materials in nature, the transport speed of working fluid inside the microfluidic channel was ultra-fast because of its unique surface microstructure and approximately parallel hierarchical microchannels [12]. Driven by the capillary suction formed by the gas–liquid interface inside the microchannel, the working fluid continuously transported the heat generated by chips to the surface of the cooling unit [13]. Khezerloo et al. [14] confirmed that improving pumping performance effectively enhanced the heat exchange through a two-dimensional numerical simulation. Thus, the efficient liquid transport ensures the operation of heat sinks and microfluidic electronic chips. The continuous liquid transport and functional wetting mechanism ensure the convective heat transfer is efficiently performed on the capillary inner wall, stabilizing the heat sinks and microfluidic electronic chips.
High aspect ratio (AR) array microchannels have attracted special interest recently due to their strong pumping performance and large heat exchange area. Emphasis has been put on the effect of AR, i.e., the ratio of channel depth to its width (AR = D/W, D and W represent the depth and width of the single microchannel), on the thermal performance of microchannels. Cheng and Wu [15] argued that a high AR increased the flow rate of the working fluid and promoted the timely overflow of the internal steam due to the large heat exchange surface area per unit volume of the microchannels, resulting in a fast thermal response and a low heat load. Besides, microchannels with a high AR could also generate confined bubbles to disturb the free flow, enhancing the convective heat exchange at the wall [16]. Hung et al. [17] simulated the flow and heat dissipation performance of double-layer silicon-based microchannels with various ARs (2 to 13) and confirmed the beneficial effect of high ARs. Fu et al. [18] experimentally investigated the boiling heat transfer mechanism in the copper-based microchannels heat sink with different ARs (0.83, 0.99, 1.65, 2.47, 4.23, and 6.06) and similar hydraulic diameters. The study showed that the critical heat flux density increased within a specific scope. Pan et al. [19] found differences in the AR parameters corresponding to the optimal heat transfer performance for different working fluids and solid materials. Al-Zaidi et al. [20] investigated the flow boiling characteristics of microchannels with three ARs (AR = 0.5, 1, and 2) with a hydraulic diameter of 0.4 mm. The result showed that the heat transfer coefficient was raised and the flow boiling pressure drop declined with an increasing channel AR. Another piece of research has also presented that the thickness of the liquid film inside the microchannel would be significantly reduced by the high AR, which led to adverse consequences such as drying out [21]. Yan. et al. [22] simulated the flow characteristics of incompressible fluids in microchannels using irregular concave–convex structures. Their simulations demonstrated that the flow velocity increased with the microchannel area ratio, and the micro convex structure is one of the key factors affecting the flow characteristics. Di et al. [23] experimentally studied the varying liquid surface curvature between the liquid columns and found that the surface tension direction would change with the liquid surface curvature, which in turn plays an important role in the liquid surface movement. The larger the surface tension component in the direction normal to the liquid surface, the more likely it is that the liquid surface would advance or recede. However, the effect of high ARs on the suction performance under normal conditions is seldom reported in existing studies, which is required to be comprehensively investigated [24]. None of the above studies mentioned the factors affecting the fluid flow mechanism in the high AR rectangular channel in the micrometer range and did not mention the variation law of the flow process with time.
In this paper, capillary pumping in rectangular array microchannels with different ARs was studied to explore the influence of microchannel parameters on capillary performance. The research framework of this paper is shown in Figure 1. The microchannels with high AR arrays, i.e., a depth of 180 μm and a width of 12, 20, and 30 μm, were selected and fabricated. Physical properties of silicon including its density (2330 kg/m3), specific heat capacity (700 J·kg−1·K−1), and thermal conductivity (191 W·m−1·K−1). Figure 1a shows the appearance of the microchannels, and Figure 1b shows the devices used in the experiment. The capillary suction phenomenon and suction distance of the working fluid inside the microchannels under the action of surface tension were investigated experimentally. Figure 1c shows the closed-loop two-phase flow suction 3D models established with the same size as in the experiments. The working fluid used in this paper is deionized water with a boiling point of 373.15 K under atmospheric pressure. The density, dynamic viscosity coefficient, and surface tension coefficient are taken as 1 × 10³ kg/m3, 1.01 × 10⁻³ Pa·s, and 0.073 N/m, respectively. The capillary suction phenomenon and suction distance of the working fluid inside the microchannels were studied under the simulation conditions. The simulation and experimental results were compared and verified, and the consistent trend indicated the reliability of the simulation results. Finally, the model sizes were optimized for the suction process of two-phase models to explore the AR of the microchannels with the best suction performance.

2. Experimental Description and Numerical Method

2.1. Experimental Description

2.1.1. Model and Fabrication of Microchannels

The force that urges the working fluid to move forward within the channel is called the capillary driving force. In fact, in the vicinity of the three-phase interface with gas, liquid, and solid, a contact angle is generated in the contact area between the microchannels and the liquid due to the internal interaction, resulting in liquid wetting. The meniscus surface is squeezed by the molecules on both sides of the gas and liquid and the liquid pressure is greater than the gas pressure, so it can drive the working fluid into the microchannel area and perform high-speed transmission. We thought the capillary flow process inside the microchannel was analogous to a pipe, which was believed to follow the Lucas–Washburn (L-W) law [25], i.e., the flow velocity gradually slowed down with time and finally stopped. To study the effect of array microchannels with various characteristic parameters on capillary suction under normal conditions, three microchannel array samples with high AR were fabricated. The depth of the array microchannels was 180μm, while the width of 12, 20, and 30 μm were selected, respectively. The whole array microchannels area was 4 × 4 mm, with a total of 333, 200, and 133 microchannels that were evenly etched in parallel using deep reactive ion etching (DRIE (see Figure S2 of the Supplementary Materials)) corresponding to the width of three channels, i.e., AR taken as 15, 9, and 6 (see Figure S3 of the Supplementary Materials). PEEK material fixtures were designed to fix the array microchannels to protect the specimens. The theory of capillary suction and pressure drop inside microchannels are presented in Parts 1 and 2 of the Supplementary Materials.
The array microchannels were etched using DRIE on a 600 μm thick silicon wafer. The final product was thinned to 400 μm (the details are shown in Part 3 of the Supplementary Materials). Given that the silicon-based material was opaque, modifications of the device were required for the visualized investigation of the capillary flow phenomenon in the microchannels. Therefore, the Pyrex glass material used for the upper cover plate was encapsulated with the silicon substrate by electrostatic bonding technology to ensure tightness (As shown in Figure 1a).

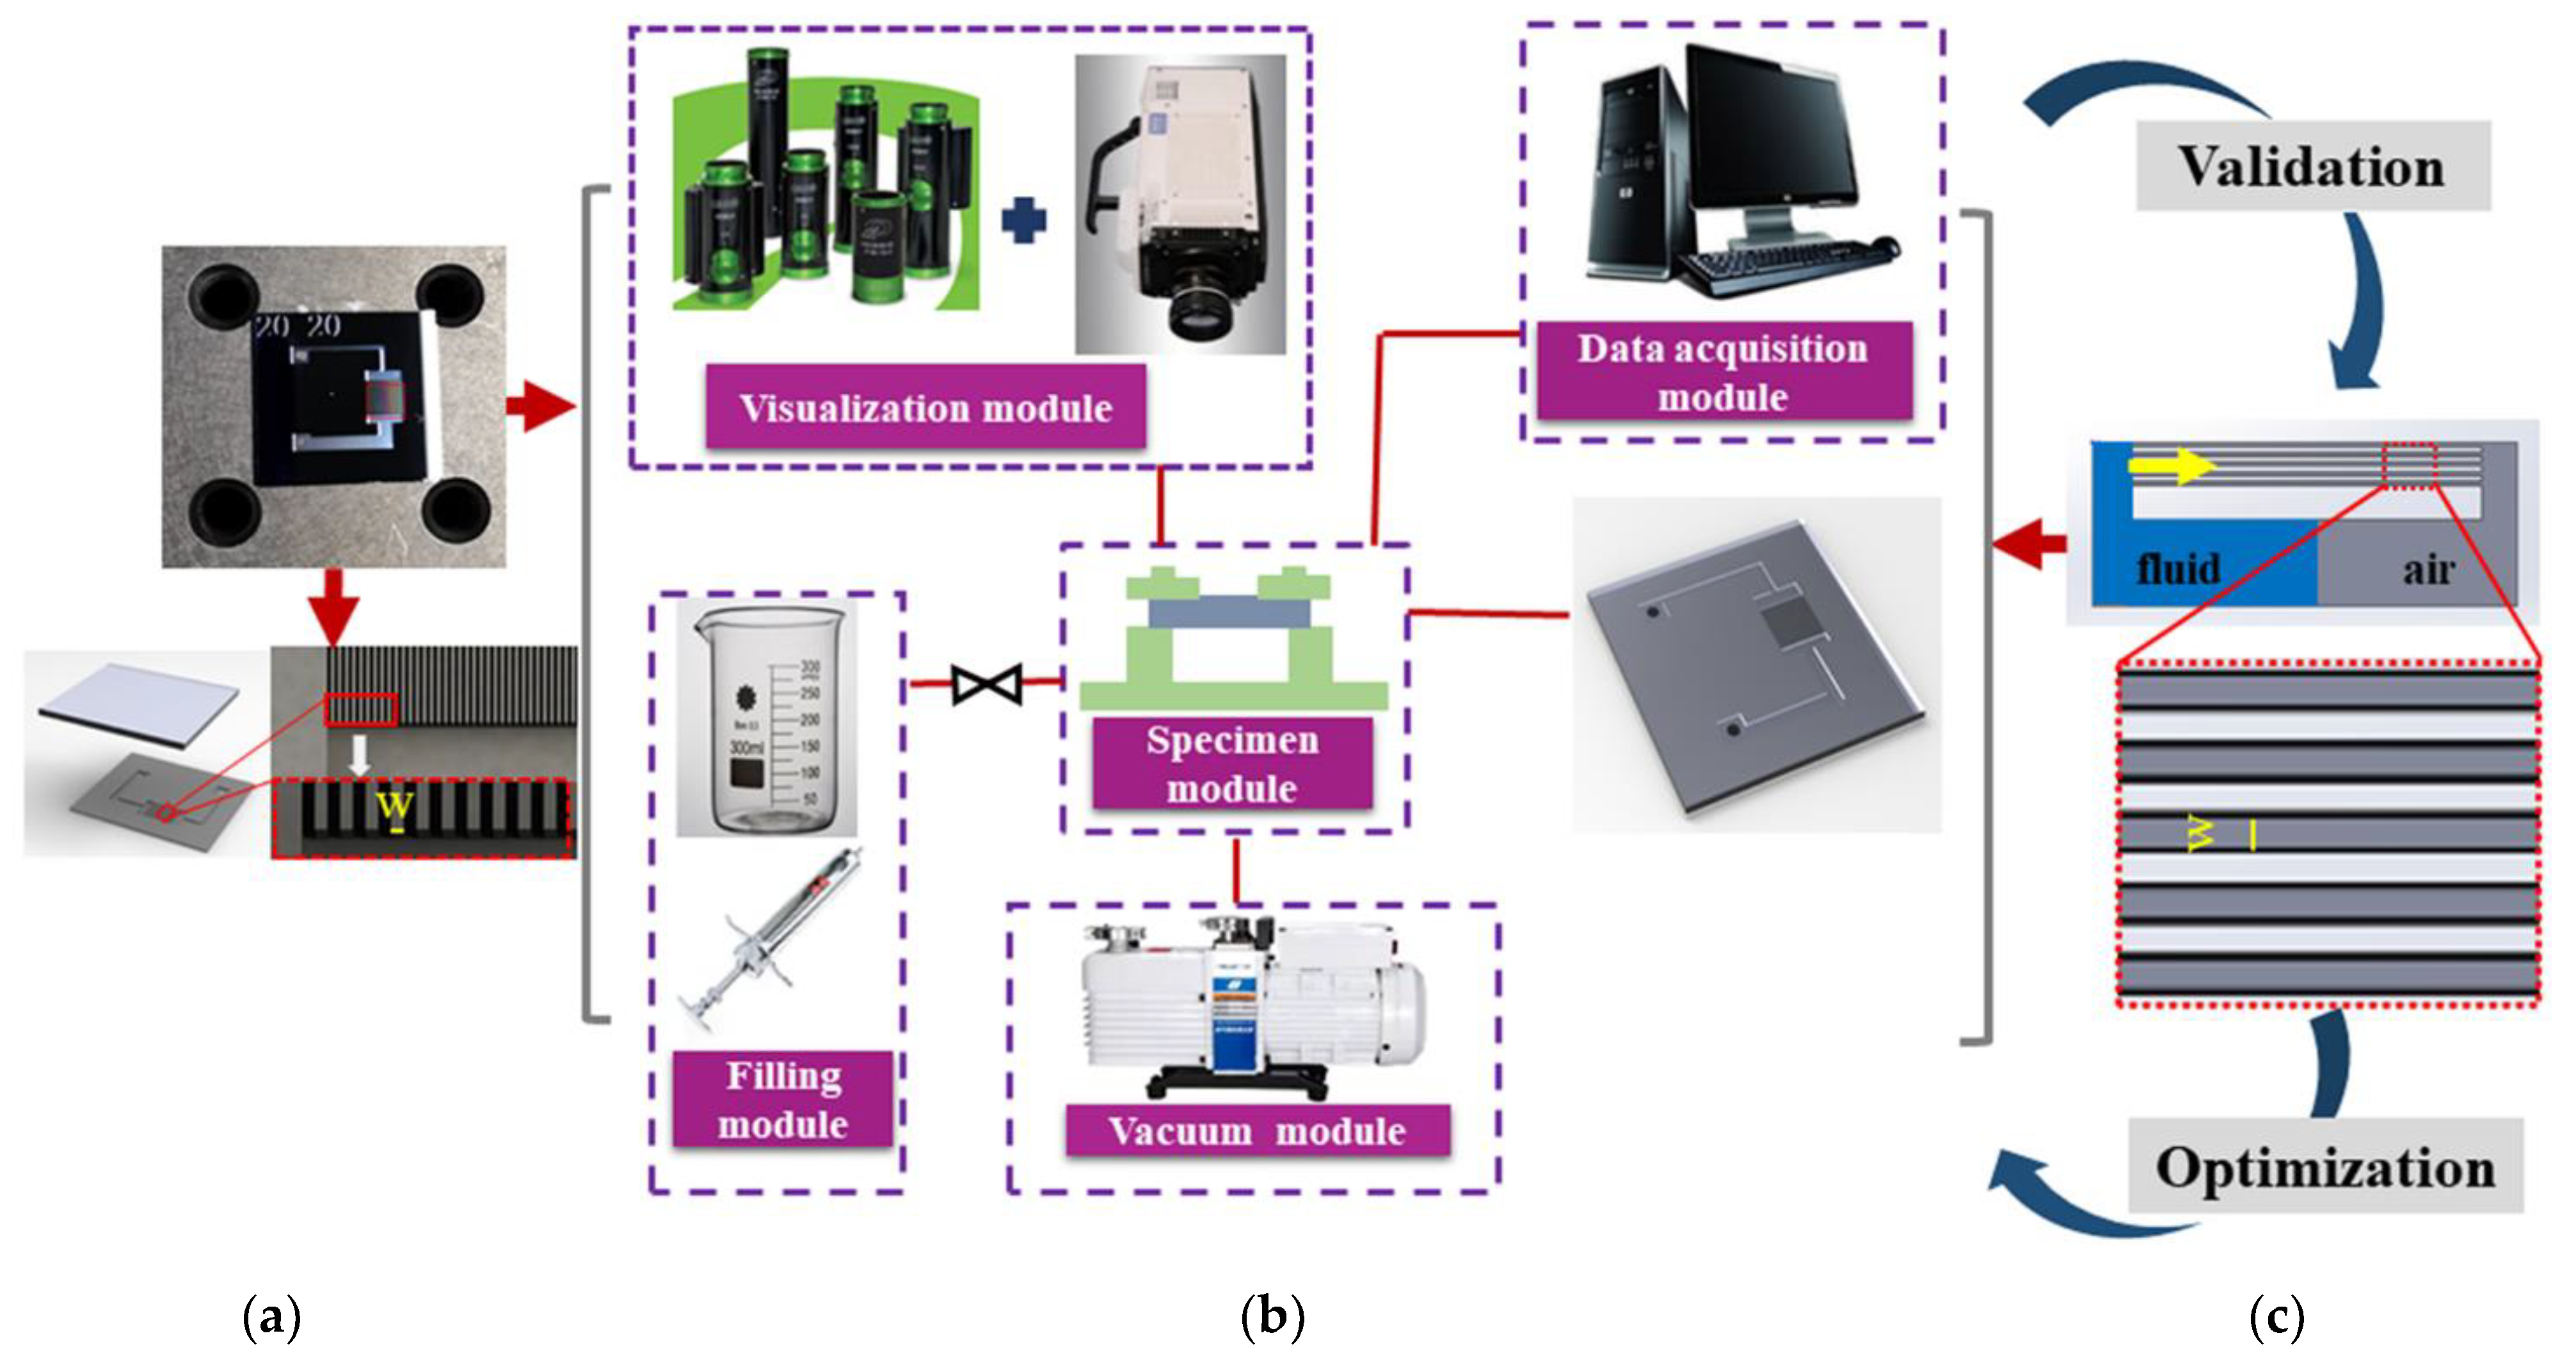
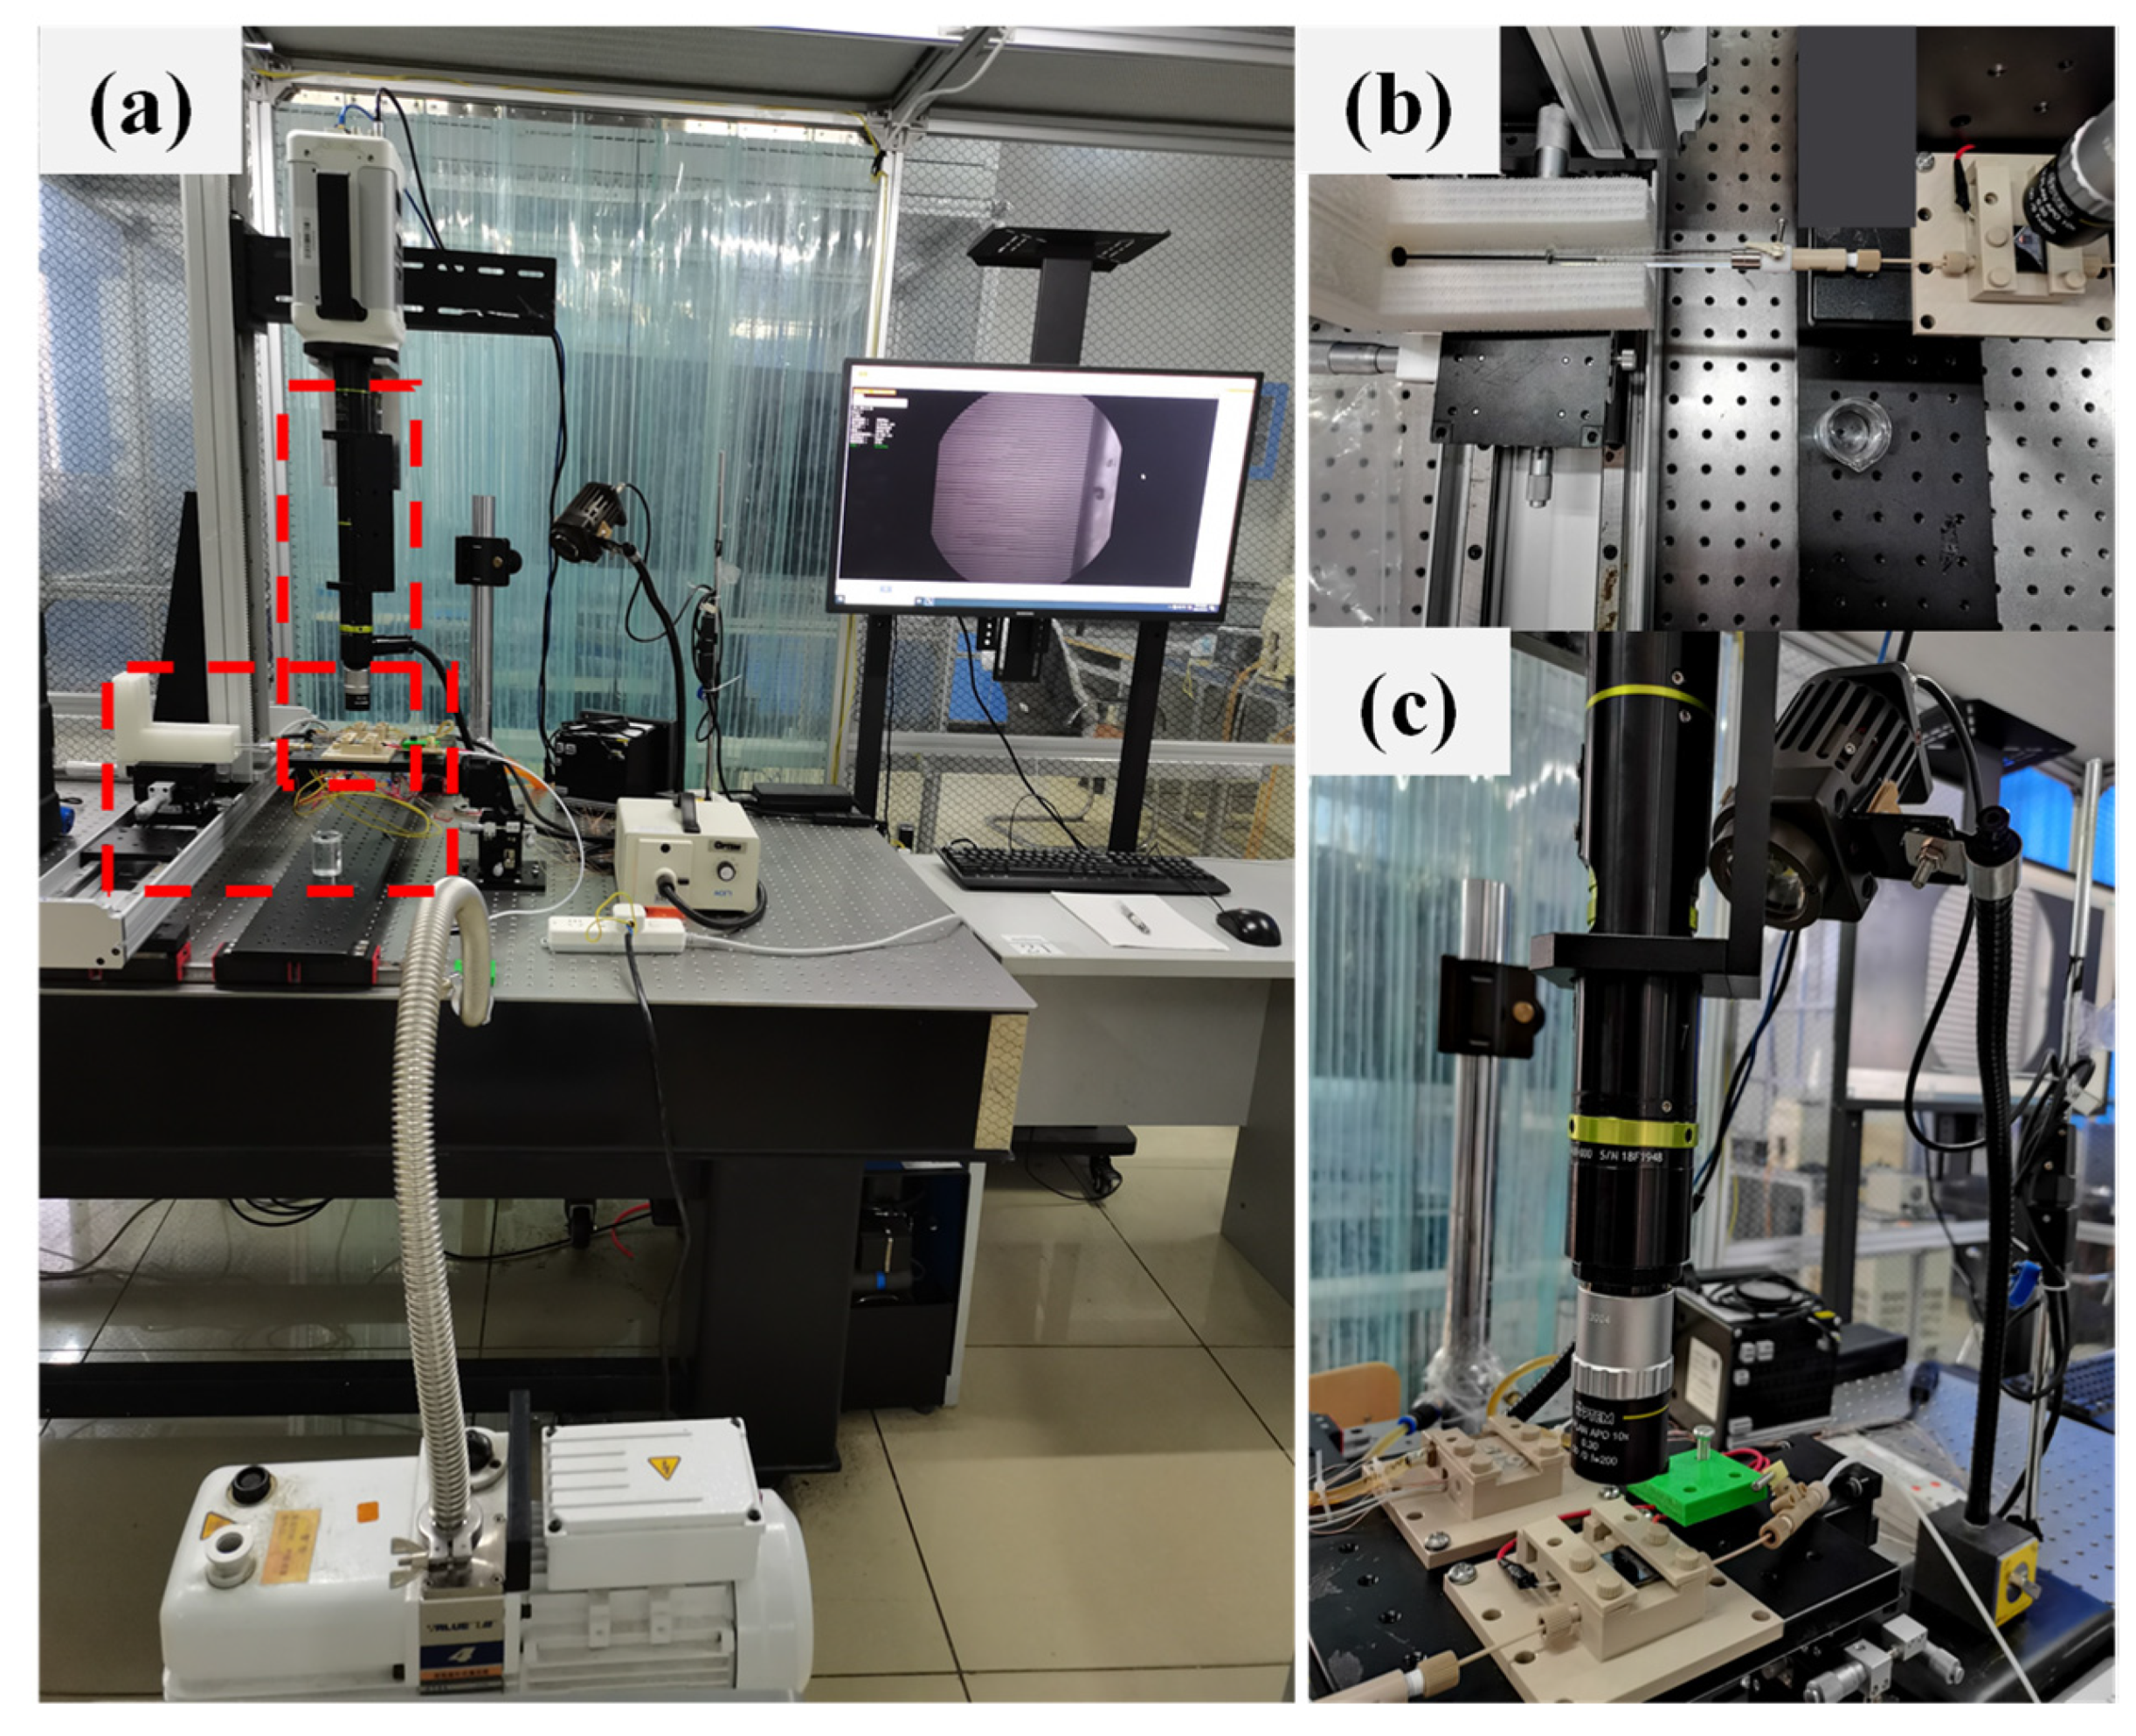
2.1.2. Experimental Device

The experimental platform comprises a total of 5 subunits, namely, vacuuming module, filling module, specimen module, visualization module, and data acquisition module as illustrated in Figure 1b. The vacuuming module was used to eliminate the impurities remaining in the microchannels, which could contaminate the channels and adversely affect the capillary pumping process. The interior of the microchannels was evacuated to about 1 Pa with a VRD-16 vacuum pump (pumping rate of 16 m3/h, ultimate vacuum of 4 × 10⁻² Pa) before each test. Afterwards, a microsyringe was employed for priming to prevent a large influx of working fluid (deionized water) into a broken device, considering the extremely narrow space within the device. Microchannels were made of silicon, which were brittle and easily broken. Thereby, a peek fixture was designed to protect the equipment during the pumping, filling, and operating processes. The tiny microchannel challenges the observation and data measuring during the operation. Therefore, a Photron Fastcam NOVA S12 high-speed camera coupled to a high-magnification microscope head with an optical magnification of 8.4–104 times was adopted to visualize microchannel flow through the glass cover bonded to the upper part of the equipment. Capillary flow pictures inside the microchannels could be captured, and this part was the visualization device. Under the optical magnification, the internal structure of the microchannels could be clearly captured and real-time monitored by the computer screen and the suction process of the working fluid was recorded simultaneously.
We established a capillary suction testing platform to experimentally measure the suction distance of the array microchannels with different ARs. Figure 2a shows the experimental system diagram, Figure 2b,c show the filling module and the visualization module, respectively. Considering the extremely narrow space within the microchannel, a micro-syringe was used for the injection of the working fluid (deionized water) to prevent equipment damage from violent filling. The data were observed and displayed on the computer screen, and the moving distance of the working fluid in channels was recorded. The deionized water was slowly pumped to the entrance of the array microchannels using a microsyringe as the beginning of the capillary suction, after which the liquid was only subjected to surface tension during the whole process. A partially enlarged view of the entrance area of the microchannels was shown on the screen (Figure 2a). The entrance of the microchannels and part of the area before the entrance can be observed. Furthermore, to investigate whether the surface roughness of silicon-based microchannels has an important effect on capillary flow, the surface roughness of the three types of silicon-based microchannels was measured three times with a VK-1000 series shape analysis laser microscope, and the average value was finally taken.
The investigation of the capillary flow mechanism inside the high AR microchannel necessitates the inlet of the microchannels filled with deionized water, indicating that the pumping process was only performed under the action of surface tension. The experiment process can be explained as follows. Firstly, after removing the impurities inside the microchannels, a micro-syringe was applied to charge the working fluid through the pipeline slowly. However, this process should be stopped immediately when the deionized water enters the microchannels monitored by the computer. Then, the PFV4 software was operated to record the capillary suction process at 1000 frames per second. The mean capillary suction result of five microchannels in the middle area of each microchannel array was considered to mitigate the inevitable artificial errors caused during the filling process. Finally, the recorded pumping phenomena with different microchannel structures were analyzed to validate the simulation results.

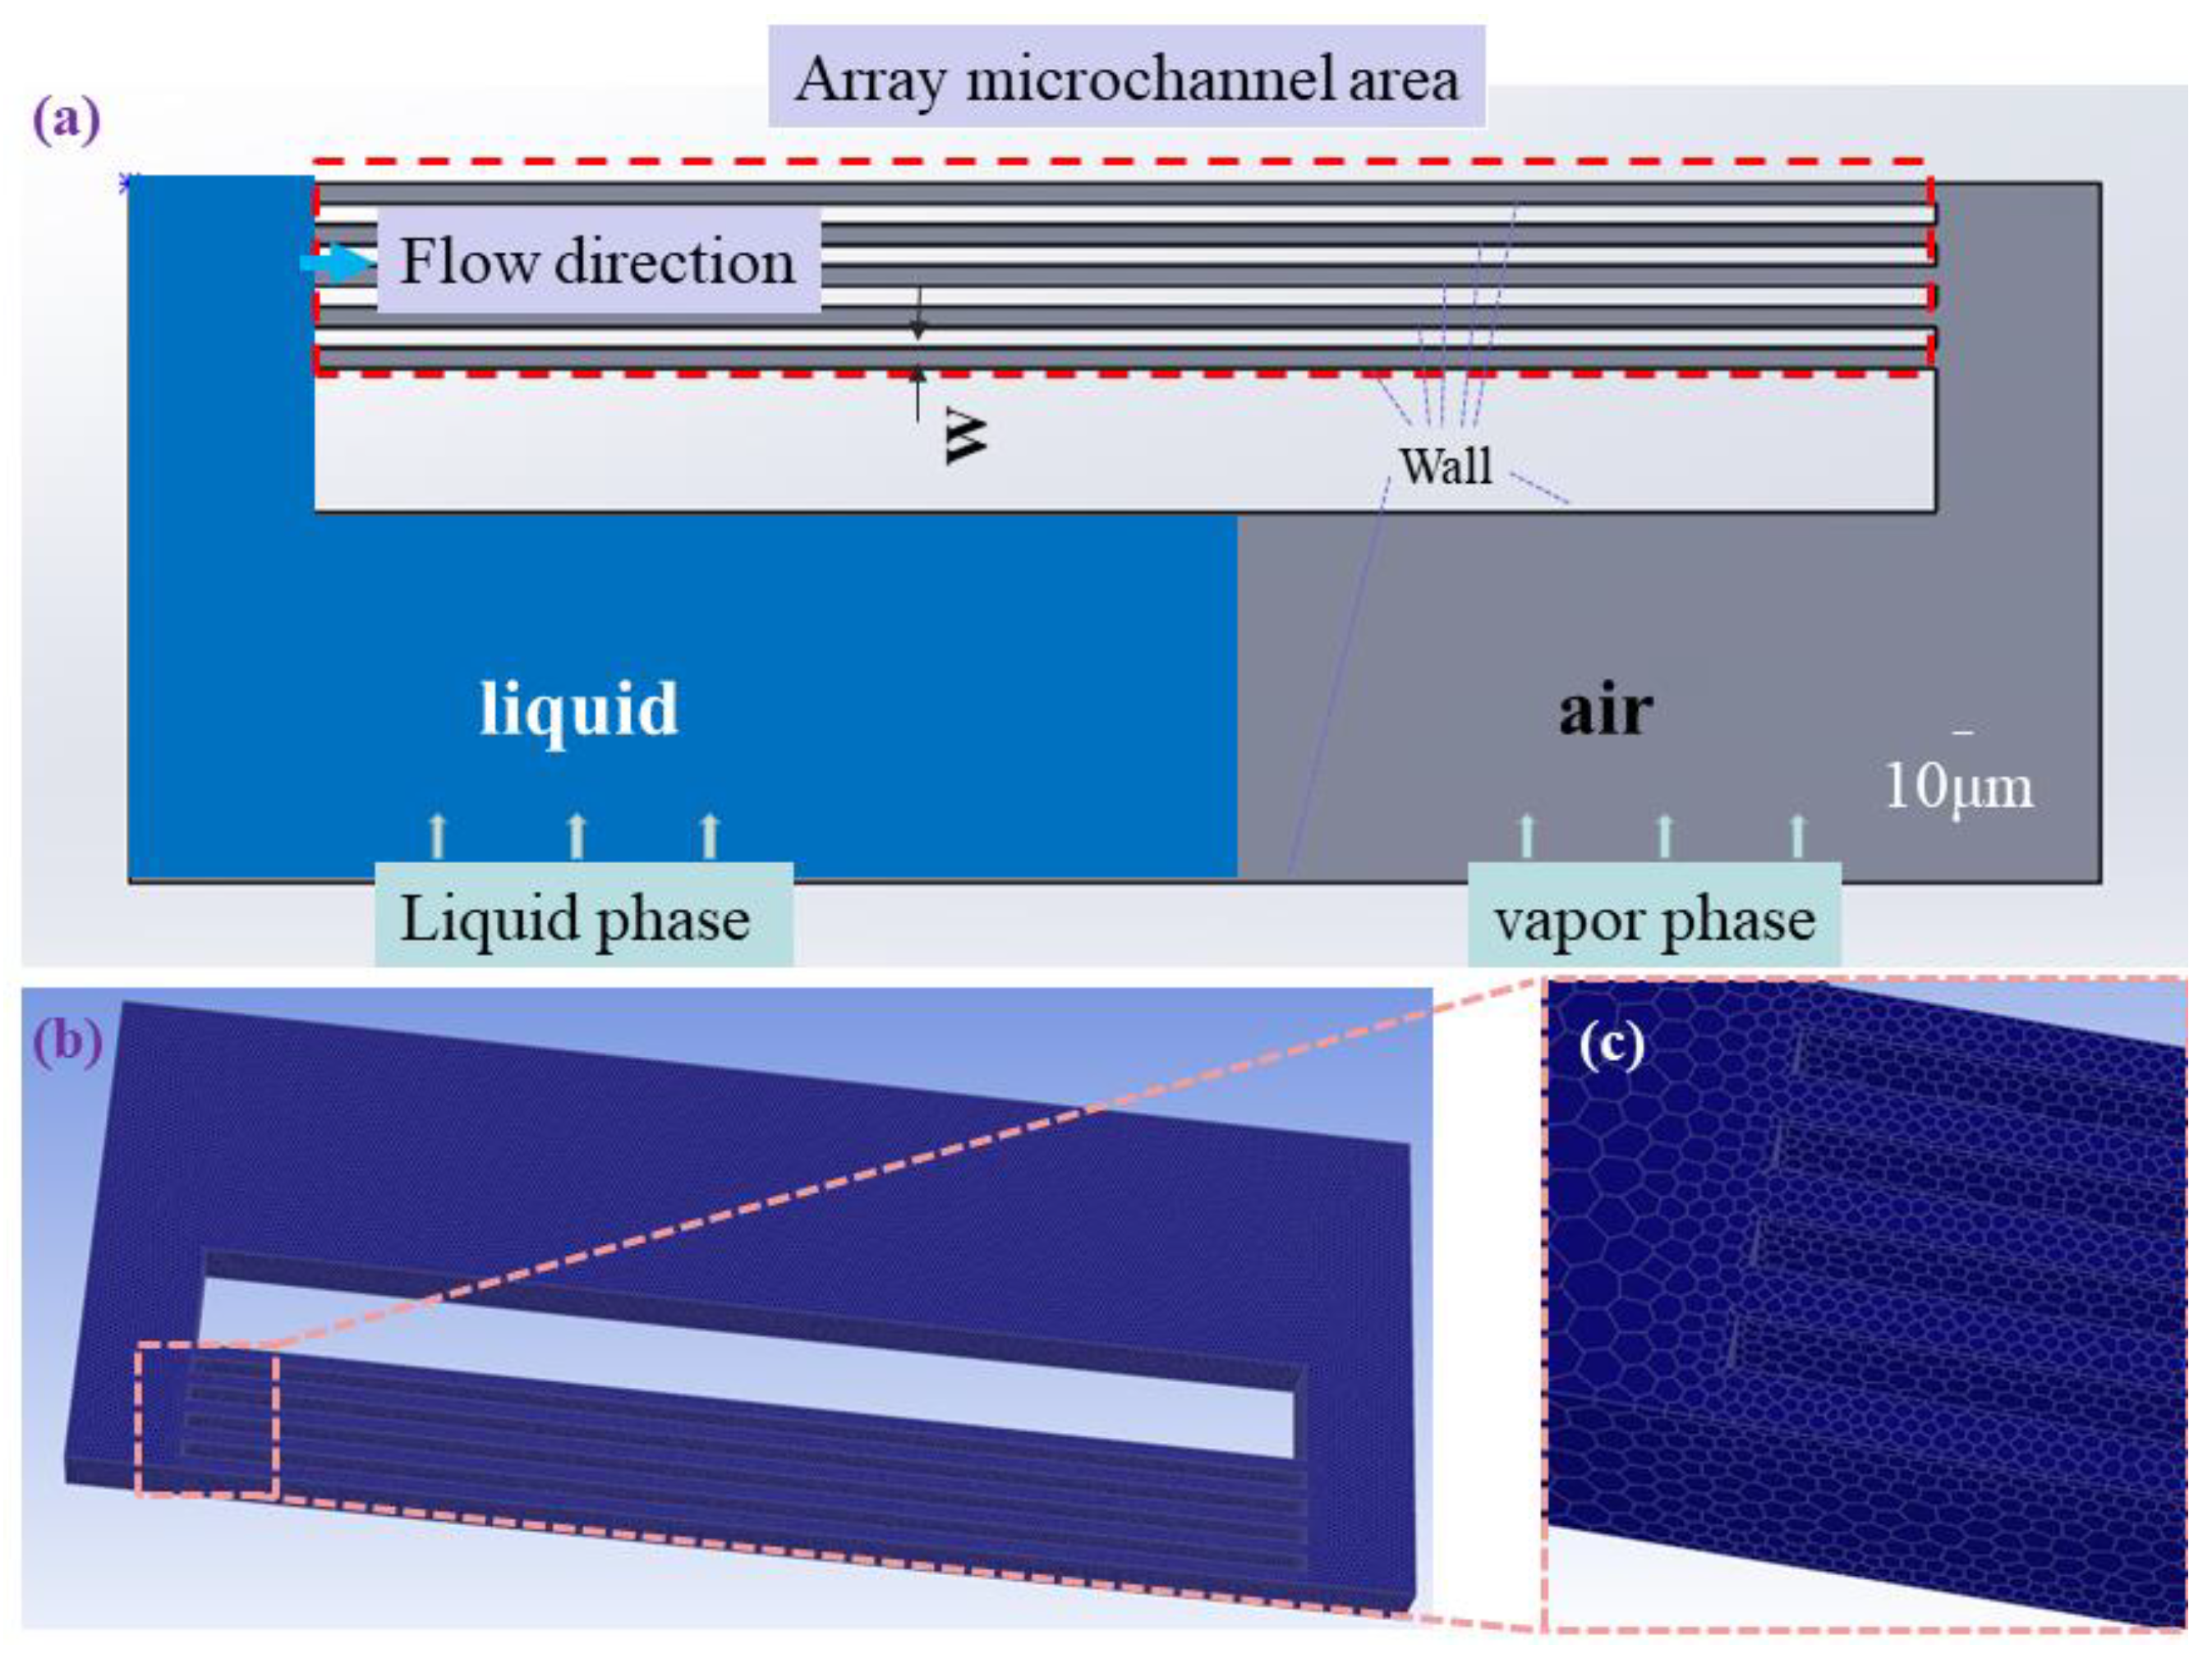
2.2. Numerical Method

We developed a two-phase transient microchannel 3D-model by the CFD-FVM software, ANSYS Fluent [26], to explore the microchannel geometric structure for optimal capillary pumping performance. Our model considered the microchannels with the same feature as in the experiments to perform numerical simulations of capillary flow. Figure 3a shows the geometric closed-loop model of the two-phases flow microchannel array, which illustrates the gas–liquid distribution in the initial state, i.e., liquid water and air denote as blue and grey areas. Since this paper only simulates the suction process of the working fluid inside the microchannel at normal temperature and pressure, the boundary conditions of the inlet and outlet are not considered, and only the wall boundary conditions shown in the figure are used. Figure 3b,c show the discretization of our numerical model and the meshes of the suction inlet of the array microchannel, where the grids are densified for good computational accuracy. The independence of grids was tested to strike a delicate balance between computational accuracy and time cost [27]. We performed a sensitivity analysis on the farthest pumping distance of the microchannel using five structured grids, and the conclusions are in Table 1. It is found that the grid system of approximately 2.9 million is adequate for the simulation.
The SIMPLEC algorithm is used here to ensure the coupling between velocity and pressure. The convergence criterion for a particular variable is that the corresponding maximum residual of the cells divided by the maximum residual of the first ten iterations is less than 10−5 [27]. The computational domain includes solid and fluid domains. A single momentum equation is solved throughout the domain, and the resulting velocity field is shared among the phases. The momentum equation, shown below, is dependent on the volume fractions of all phases through the properties ρ and μ [26].
t ( ρ v ) + · ( ρ · v v ) = p + · [ μ ( v + v T ) ] + ρ g + F
where, the density ρ and the viscosity coefficient μ of the dynamic working fluid are the fundamental properties of the fluid, v is the fluid velocity vector, p is the tensor of stress acting on the surface per unit volume, and F is the mass force per unit volume.
Due to the capillary force generated at the gas–liquid interface because of surface tension, the working fluid inside the microchannels was driven to move forward. We used the volume of fluid (VOF) multiphase model to track the gas–liquid interface during the working fluid flow. For silicon-based micro-loop heat pipes, the working fluid in the condenser returns to the evaporator for heat exchange when the capillary force is greater than the internal volume pressure drop of the entire radiator. Thereby, the capillary limit of the capillary wick determines the heat transfer limit of the loop heat pipe.
Volume fraction equation of VOF model [26]:
If the volume fraction of the k phase fluid is set to α k , then the relationship between the VOF equation of the k phase and each volume fraction α k is:
α k t + α k · V = S α k
k = 1 n α k = 1
The S α k represents the mass exchange between phases. In this paper, mass exchange does not consider interphase, so the source term S α k on the right-hand side of the equation is zero.
Continuity equation for VOF model [26]:
ρ t + ρ · V = 0
Here, a two-phase flow closed-loop model with the solid material of silicon base and the working fluid of water was applied to explore the suction characteristics of the array microchannels. The simulation process was simplified without affecting the reliability of its results, (i) a stable laminar flow mode without turbulent disturbance; (ii) the fluid was an incompressible fluid; (iii) the fluid viscosity remained unchanged; and (iv) the properties of the silicon-based solid were constant. For a horizontally placed microtube, scholars generally ignored the influence of inertial force and gravity when studying the capillary phenomenon caused by the gas–liquid interface during the two-phase flow of the internal working fluid, which, therefore, would not be considered in this model.
The continuum surface force (CSF) model was used during the research, where a source term representing the surface tension of the liquid surface to the governing equations was applied [26]. The initial velocity of the working fluid was set to 0, and the wall conditions were all default settings. Since this simulation work only explored the flow and pumping process of the working liquid, phase change and heat transfer of fluid were ignored here. To study the variation of the suction distance with time, data were recorded every 0.01 s until the suction was terminated. The flow law of the working fluid inside the microchannels with different characteristic sizes before reaching the end of the suction distance was summarized, and the characteristic parameter of the optimal capillary performance was discussed in the following section.

3. Results and Discussion

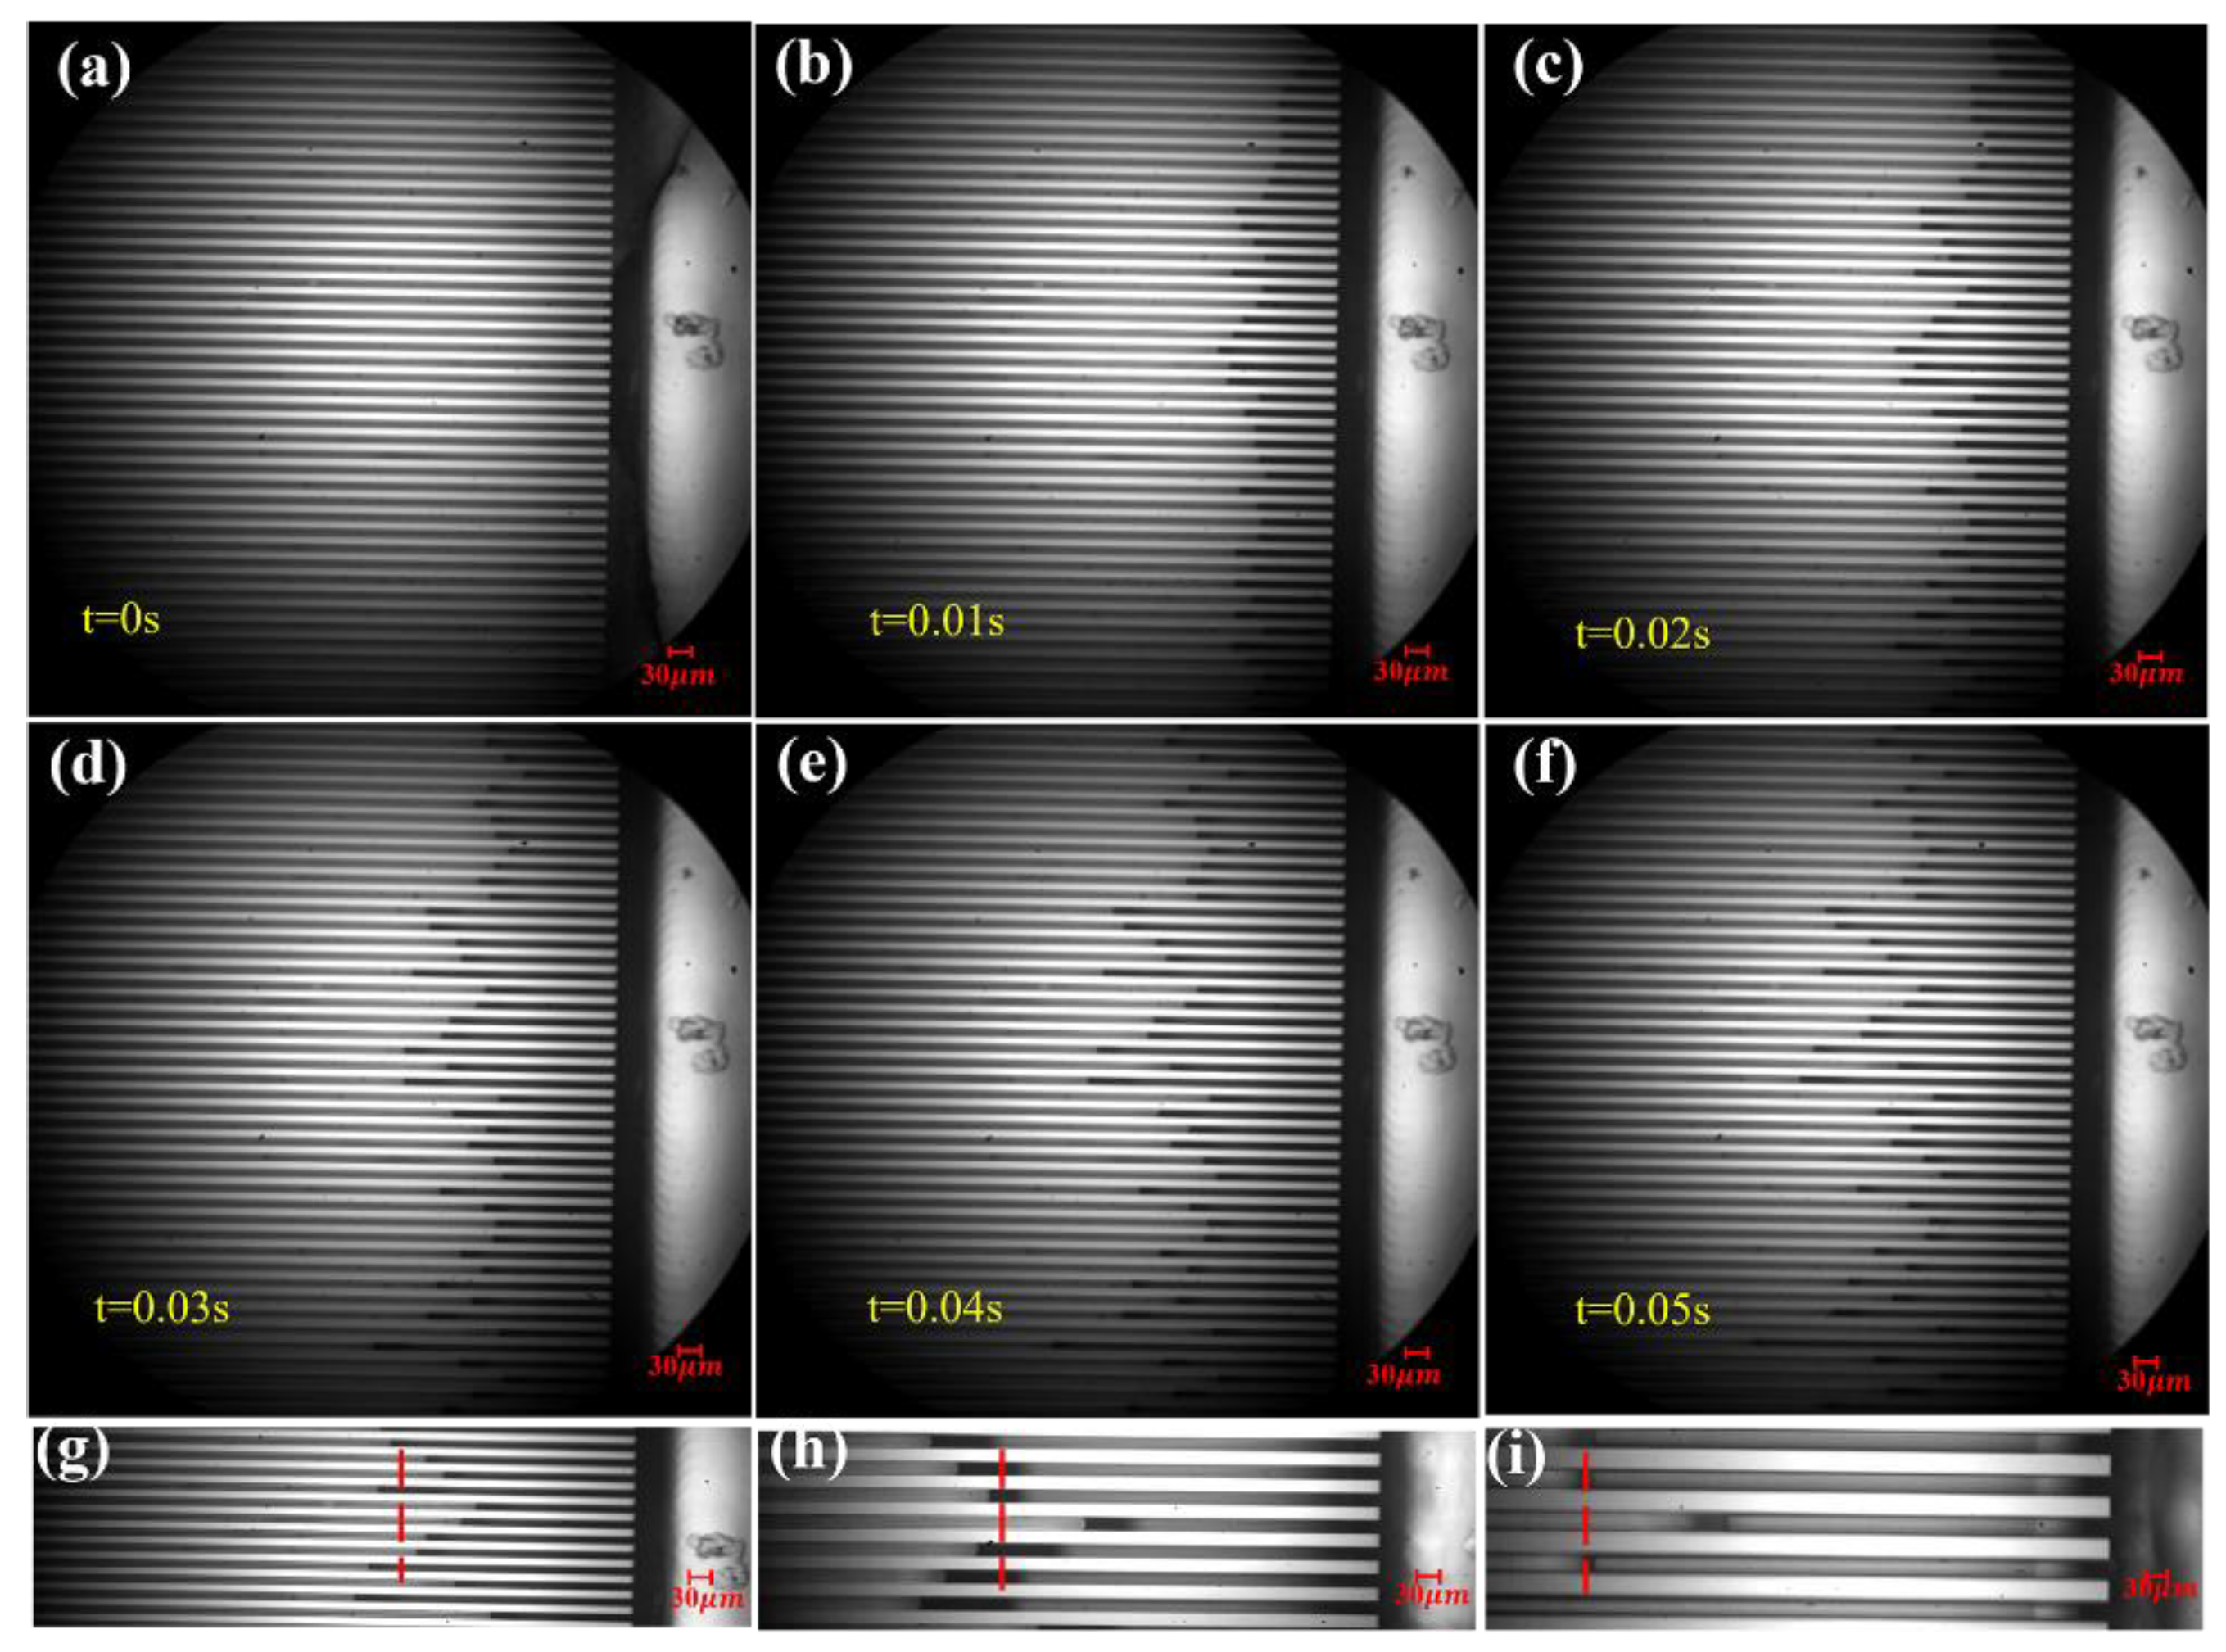
3.1. Experimental Capillary Suction Results

The visualization testing result for the pumping process of the 12 μm microchannel was taken as an example. The working fluid was artificially filled to reach the entrance of the array microchannels at t = 0 s. The filling process was stopped once the fluid contacted the channel inlets, and then the fluid was only subjected to surface tension. Afterwards, suction images of liquid moving within the microchannels were recorded for every 0.01 s of the whole process (see Figure 4). A speedy flow of working fluid was observed through the area of the array microchannels driven by surface tension when t = 0.01 s (the dark region in Figure 4b shows the volume occupied by the liquid). The liquid continued to be pumped in the following time with a significant slowdown until its termination at 0.05 s. The photographs illustrate an uneven suction distance of different microchannels, which proves the instability of the capillary process. A reasonable explanation is that the human-controlled liquid filling (to reach the entrance synchronously) for each microchannel is challenging. Therefore, distinct initial conditions result in an uneven pumping process inside the microchannels arranged in the array. Besides, it can be attributed to the differences in structure and surface roughness of each microchannel during the manufacturing process. Considering this process occurs on minimal time and space scales, any nuance can cause considerable divergence in the final result. It could be seen from the image that the suction gradually slowed down as time went on, basically reaching the end of the suction within 0.05 s, indicating a fast-to-slow suction process as described by the L–W theoretical law.
For the microchannels with a width of 20 μm and 30 μm, the same method as the 12 μm microchannel was used to carry out the suction experiment. To visually compared the influence of characteristic parameters on suction, three microchannels of 12, 20, and 30 μm were compared under the same magnification of the microscope head. Figure 4g–i shows the end of the suction of each array microchannels device. The position indicated by the red line refers to the suction limit of the working fluid inside the array microchannel, that is, the maximum suction distance. It can be seen from Figure 4 that the liquid in five microchannels showed different suction effects due to the different widths of the microchannel array under the action of surface tension when the depth of the array microchannels was constant. The results demonstrated that suction capacity benefited from the wider microchannels, achieving a large suction distance within the scope of this study.

3.2. Simulation and Model Validation

Corresponding to the sizes of the array microchannels used in the above experiments, this section studied the suction results obtained by the simulation. During the calculation, it could be found that the liquid at the entrance of the microchannel array would move in the direction of the microchannels and gradually fill the microchannel area. This process was essentially the volume exchanged between liquid and gas under the action of surface tension. When the hydraulic radius of the channel was in the micron scale, the capillary force was the decisive initial driving force for fluid flowing into the microchannel, and the volume fraction of gas in the array microchannels area direction gradually changed from 1 to 0. In the numerical simulation, the change of the suction distance with time under different feature sizes was monitored.
Figure 5 shows the gas–liquid distribution and flow characteristics of the working fluid in the array microchannel model from the beginning of the suction at the channel inlet to the end of the suction. It can be observed from Figure 5b that the liquid-phase fluid quickly occupies the microchannel area at the beginning under the action of the suction force. As time goes by, the capillary process tends to slow until the suction is substantially terminated at 0.05 s. Furthermore, synchronously observing the velocity vector process diagram demonstrated that the suction speed gradually decreased in this period. It can be concluded from both two modeling results that an intense suction of the working fluid inside the array microchannel could be obtained at the beginning stage.
The numerical model proposed above was validated by comparison with testing results. It was found that the array microchannels of each size reached the suction termination within 0.05 s. In order to explore the suction law, five suction distances within 0–0.01 s, 0.01–0.02 s, 0.02–0.03 s, 0.03–0.04 s, and 0.04–0.05 s were monitored for the array microchannels of each size. Figure 6 shows the relationship between the suction distance of the working fluid and the variation of time during the simulation and experiment.
According to Figure 6a–c, it could be concluded that the flow of working fluid in array microchannels of different sizes will show a fast flow rate in the initial stage and then gradually slow down as time goes on. In addition, the second derivative of the flow distance with time, the suction acceleration, is also decreasing. The flow tends to be stable in the middle and late stages and finally reaches the end of the flow within 0.05 s. At this moment, a balance is reached between suction force and pressure drop resistance, also recognized as the capillary flow limit. Both the trend of suction distance obtained numerically and experimentally follow the L–W theory mentioned above, while the maximum deviation between the two results is 38.3%, and the average deviation of the suction distance is 24.3%. Two reasonable explanations for the deviation would be the inertial force and surface roughness of the microchannels. On the one hand, the liquid was ideally sucked only under the action of surface tension without any additional forces in the simulation. However, the deionized water was artificially pumped at the inlet of the array microchannels, resulting in the effect of inertial force at the beginning of the suction. On the other hand, the rough surface of the microchannel exerts an impact on its capillary performance. Table 2 lists the surface roughness of the three silicon-based microchannels measured by a VK-1000 series shape analysis laser microscope. It can be seen that the average values of 0.350 μm, 0.453 μm, and 0.538 μm were obtained for the microchannel array with the ARs taken as 6, 9, and 15. Specifically, the surface roughness increases the contact area between the liquid and the gas by generating irregular and tiny grooves, which facilitates the suction characteristics. Therefore, this is also why the experimental results are higher than the simulation ones. Besides, the surface roughness decreases with the AR, while only a slight difference was observed for microchannels with varying structures. Therefore, the effect of roughness on suction is negligible compared to the AR. Based on the fact that the modeled suction results tended to be consistent with the experimental results and still followed the L–W theory with varying sizes of the array microchannels, simulations of the array microchannels suction process were reasonable.
Furthermore, both experimental and simulation results showed that a better suction performance could be achieved with a wide microchannel, that is, the lower AR of the system. The simulations demonstrate that the maximal pumping distance of the array with a width of 20 μm was 0.21 mm larger than that with a width of 12 μm. The farthest suction distance of the array microchannels with a width of 30 μm was 0.2 mm larger than the farthest suction distance of the array microchannels with a width of 20 μm. For the experimental results, the maximal suction distance of the array microchannels with a width of 20 μm was 0.2 mm larger than that the array microchannels of the 12 μm. The farthest suction distance of the array microchannels with a width of 30 μm was 0.21 mm larger than that of the array microchannels with a width of 20 μm.
It can be concluded that within the selected size range, with the combined effect of capillary force and resistance, both the simulation and experiment results showed that as the width of the array microchannels increased, the pumping could reach a longer distance. The similarities between the two results were due to the variation relationship of the suction distance with time obtained under the simulation and the experiment was consistent. The suction speeds kept slowing down and finally reached the limit of the suction distance. On the other hand, the difference between them was that no matter which microchannel size was used, the pumping distance obtained by the experiment was always more significant than that obtained by the simulation at the same time. Figure 6 shows that the microchannel suction distances obtained by modeling were all underestimated compared to the measured data in the same conditions. Specifically, for the 12 μm microchannel, the experimental farthest suction distance was 0.19 mm larger than the simulated farthest suction distance. As for the 20 μm microchannel, the experimental farthest suction distance was 0.17 mm larger than the simulated farthest suction distance. For the 30 μm microchannel, the experimental farthest suction distance was 0.16 mm larger than the simulated farthest suction distance. It could be seen that as the microchannel width increased, the gap between the experimental and simulation results narrowed.

3.3. Optimization of Microchannel Structure

The presented model was then applied to determine the microchannel geometric parameters for optimal suction performance. Based on the previous discussion, the closed-loop microchannel models with depths of 150 μm, 180 μm, and 200 μm and widths of 5 μm, 12 μm, 20 μm, 30 μm, 50 μm, 60 μm, 80 μm, and 100 μm were modeled. Figure 7 illustrates the variation of the suction distance with time for all modeling cases. It can be found that the microchannels with a width of 50 μm could achieve the maximal capillary distance for each depth within the selected range, with the most prolonged period to reach the equilibrium. In other words, the array microchannels with AR between 3 and 4 could achieve optimal capillary suction performance compared with other ARs. The suction distance of the array microchannels was up to 0.8 mm when a suitable AR was achieved.
Moreover, the flow performance of the microchannels tended to be slightly enhanced by the deep channel under the same width condition. According to the suction force (Part 1 of the Supplementary Materials) and the pressure drop theory (Part 2 of the Supplementary Materials), pressure drop resistance and the suction force jointly affect the comprehensive suction performance. Specifically, the suction force acts as the suction power, and the pressure drop resistance acts as a factor impeding the flow. The simulation of flow resistance shows that the pressure drop was kept at a low level (below 200 Pa) when a depth of between 150 and 200 μm and an AR less than five were taken. However, the overall pressure drop increases exponentially with AR increases when the AR is more than five (see Figure S1 of the Supplementary Materials).
In general, for high AR cases, the resistance generated by the narrow channel space negatively influences the suction of the working fluid even with a good suction capacity. On the other hand, a good suction performance can hardly be achieved for low AR scenarios due to insufficient capillary power. Neither of the above provides satisfactory suction performance. Therefore, the optimal flow performance of the microchannel can be achieved with the AR between 3 and 4 (depth taken as 150~200 μm).

4. Conclusions

This paper systematically studied the capillary suction of the microchannel array with various high ARs. Firstly, the reliability of numerical models was verified by the experimental results from a visualized testing platform. After that, the proposed model was to optimize the geometrical characteristics of the array microchannels numerically. The main conclusions can be drawn as follows:
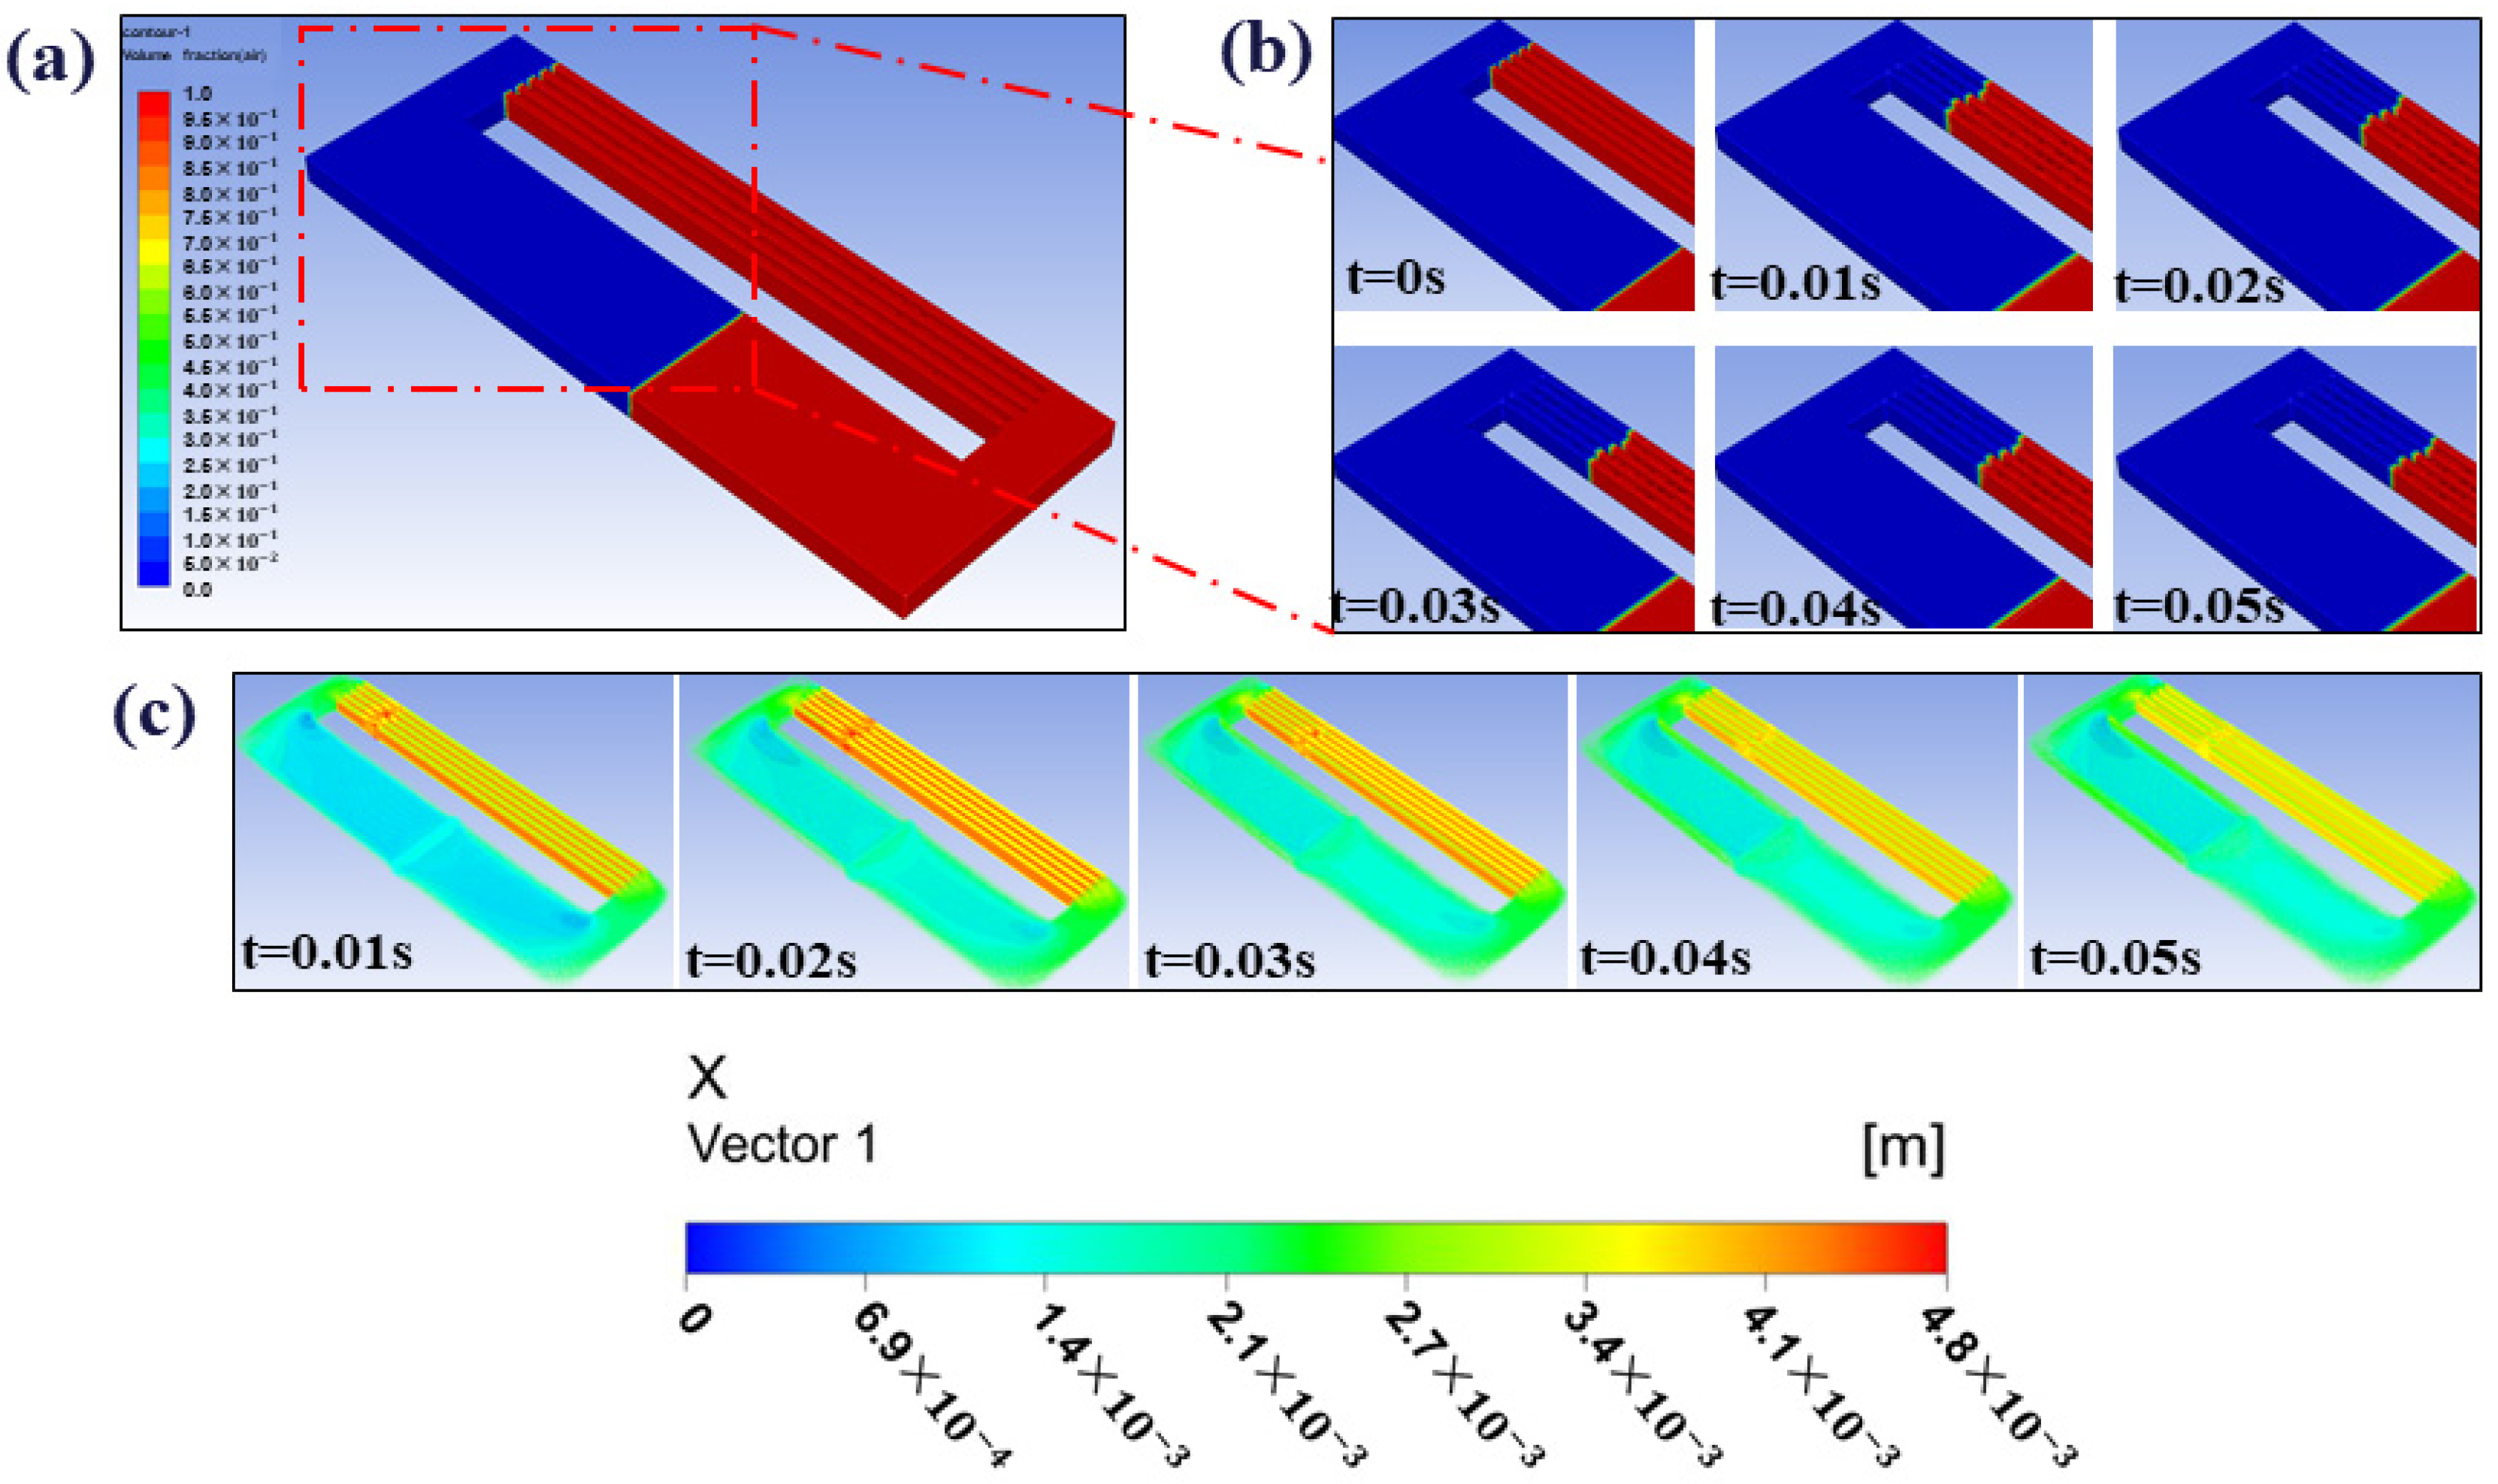
  • A visual research experimental platform was built to visualize the capillary flow inside the silicon-based microchannels of three sizes. The general law of the flow process changing with time was found, and with the change of the microchannel width, the flow distance was prolonged, and the capillary performance was enhanced.
  • Three microchannel models were established, and the variation law of the flow distance inside each microchannel model with time was simulated based on the CFD-FVM technique. The maximum deviation between the experimental and numerical suction distance is 38.3% and the average value is 24.3%, while the deviation can be attributed to the inertial force and surface roughness of the microchannels.
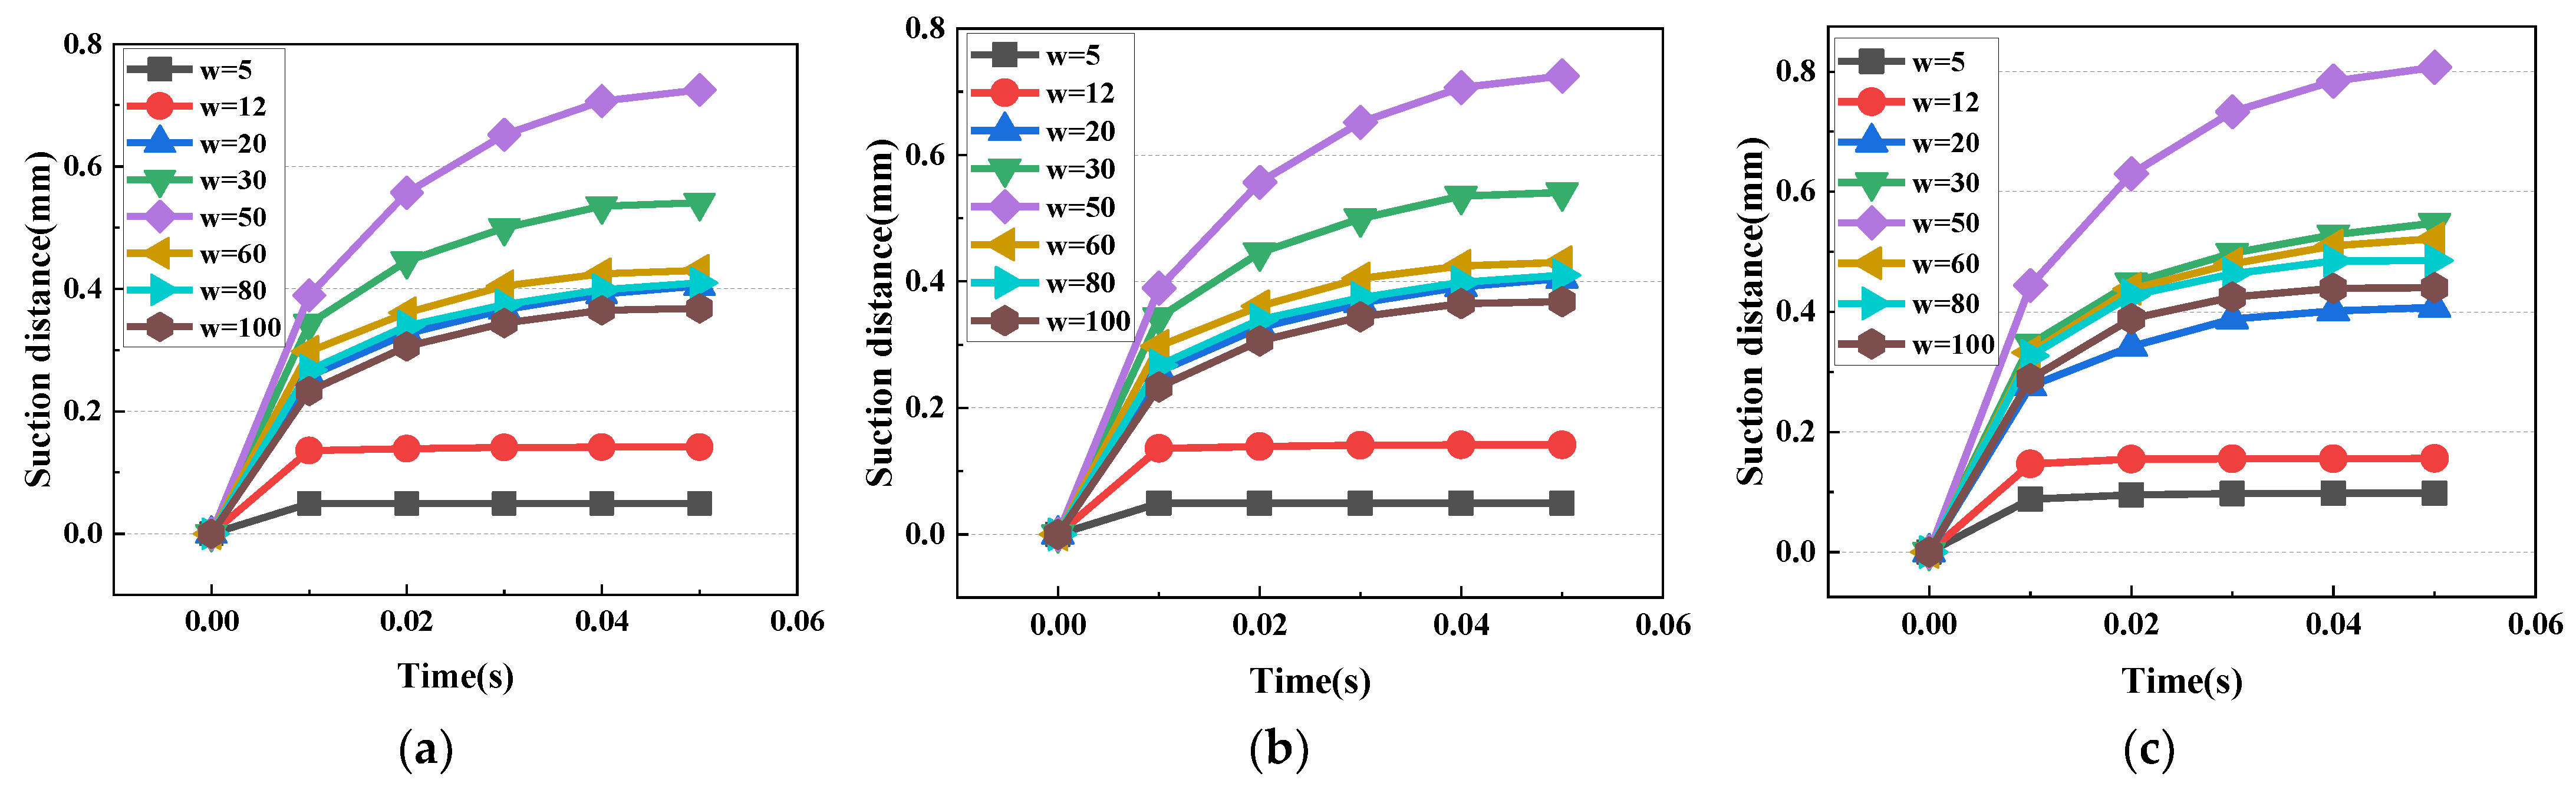
  • To find the microchannel AR for optimal suction performance, a parametric analysis of the geometrical characteristics of the microchannels was conducted. It was found that an AR between 3 and 4 had the best pumping performance in the investigated microchannel depth range (depth between 150 μm and 200 μm), enabling a suction distance of 0.8 mm.
  • Based on the conclusions of this manuscript, the effect of heat transfer and the phase transition process on the capillary mechanism is required to be further explored.

Supplementary Materials

The following supporting information can be downloaded at: https://www.mdpi.com/article/10.3390/cryst12070950/s1, Figure S1: Comparison of simulated and theoretical pressure drop in array microchannels of different depth; Figure S2: Deep reactive ion etching process; Figure S3: Microchannel rendering and physical map. References [28,29,30,31,32] are cited in Supplementary Materials.

Author Contributions

Conceptualization, L.X. and C.G.; methodology, L.X. and C.G.; software, L.X.; validation, L.X., Y.X. and B.L.; formal analysis, L.X., Y.X. and B.L.; investigation, L.X. and C.G.; resources, C.G.; data curation, L.X., Y.X. and B.L.; writing—original draft preparation, L.X.; writing—review and editing, C.G. and Y.Z.; visualization, L.X.; supervision, C.G. and Y.Z.; project administration, C.G.; funding acquisition, C.G. All authors have read and agreed to the published version of the manuscript.

Funding

This research was funded by the Suzhou Science and Technology Plan, grant number SYG202118 and the Natural Science Foundation of Shandong Province, grant number ZR2021ME162.

Data Availability Statement

Not applicable.

Acknowledgments

The authors appreciate the support from the Suzhou Science and Technology Plan (Grant No. SYG202118) and the Natural Science Foundation of Shandong Province (Grant No. ZR2021ME162). Besides, a very special acknowledgment is made to the editors and referees whose constructive criticism has improved this paper.

Conflicts of Interest

The authors declare no conflict of interest.

References

  1. Chakraborty, S.; Kapoorm, H. Towards Controlling Chip Temperature by Dynamic Cache Reconfiguration in Multiprocessors. In Proceedings of the 30th International Conference on VLSI Design and 16th International Conference on Embedded Systems (VLSID), Hyderabad, India, 7–11 January 2017; IEEE: Piscataway, NJ, USA, 2017; pp. 75–80. [Google Scholar]
  2. Ghasemi, S.; Ranjbar, A.; Hosseini, M. Experimental evaluation of cooling performance of circular heat sinks for heat dissipation from electronic chips using nanofluid. Mech. Res. Commun. 2017, 84, 85–89. [Google Scholar] [CrossRef]
  3. Zhao, J.; Du, M.; Zhang, Z.; Ling, X. Thermal management strategy for electronic chips based on combination of a flat-plate heat pipe and spray cooling. Int. J. Heat Mass Transf. 2021, 181, 121894. [Google Scholar] [CrossRef]
  4. Zheng, R.; Wu, Y.; Li, Y.; Wang, G.; Ding, G.; Sun, Y. Development of a hierarchical microchannel heat sink with flow field reconstruction and low thermal resistance for high heat flux dissipation. Int. J. Heat Mass Transf. 2022, 182, 121925. [Google Scholar] [CrossRef]
  5. Qu, J.; Wu, H.Y. Flow visualization of silicon-based micro pulsating heat pipes. Sci. China Technol. Sci. 2010, 53, 984–990. [Google Scholar] [CrossRef]
  6. Dixit, P.; Lin, N.; Miao, J.; Wong, W.K.; Choon, T.K. Silicon nanopillars based 3D stacked microchannel heat sinks concept for enhanced heat dissipation applications in MEMS packaging. Sens. Actuators A Phys. 2008, 141, 685–694. [Google Scholar] [CrossRef]
  7. Kuddusi, L. First and second law analysis of fully developed gaseous slip flow in trapezoidal silicon microchannels considering viscous dissipation effect. Int. J. Heat Mass Transf. 2011, 54, 52–64. [Google Scholar] [CrossRef]
  8. Qu, W.; Mala, G.M.; Li, D. Pressure-driven water flows in trapezoidal silicon microchannels. Int. J. Heat Mass Transf. 2000, 43, 353–364. [Google Scholar] [CrossRef]
  9. Fb, M.; Chen, G.M.; Tso, C.P. Viscous dissipation effect on CuO-Water nanofluid-cooled microchannel heat sinks. Case Stud. Therm. Eng. 2021, 26, 101159. [Google Scholar] [CrossRef]
  10. Zhao, Q.; Qiu, J.; Zhou, J.; Lu, M.; Li, Q.; Chen, X. Visualization study of flow boiling characteristics in open microchannels with different wettability. Int. J. Heat Mass Transf. 2021, 180, 121808. [Google Scholar] [CrossRef]
  11. Soleimani, A.; Sattari, A.; Hanafizadeh, P. Thermal analysis of a microchannel heat sink cooled by two-phase flow boiling of Al2O3 HFE-7100 nanofluid. Therm. Sci. Eng. Prog. 2020, 20, 100693. [Google Scholar] [CrossRef]
  12. Chen, H.; Tong, R.; Yang, G.; Zhou, J.; Yi, Z.; Zhang, L.; Lei, J. Ultrafast water harvesting and transport in hierarchical microchannels. Nat. Mater. 2021, 17, 935–942. [Google Scholar] [CrossRef] [PubMed]
  13. Estelle, P.; Cabaleiro, D.; Zyla, G.; Lugo, L.; Murshed, S. Current trends in surface tension and wetting behavior of nanofluids. Renew. Sustain. Energy Rev. 2018, 94, 931–944. [Google Scholar] [CrossRef]
  14. Khezerloo, M.; Djenidi, L.; Tardu, S. Combined effect of roughness and suction on heat transfer in a laminar channel flow. Int. Commun. Heat Mass Transf. 2021, 126, 105377. [Google Scholar] [CrossRef]
  15. Cheng, X.; Wu, H. Improved flow boiling performance in high-aspect-ratio interconnected microchannels. Int. J. Heat Mass Transf. 2021, 165, 120627. [Google Scholar] [CrossRef]
  16. Zeng, J.; Zhang, S.; Chen, G.; Lin, L.; Sun, Y.; Chuai, L.; Yuan, W. Experimental investigation on thermal performance of aluminum vapor chamber using micro-grooved wick with reentrant cavity array. Appl. Therm. Eng. 2017, 130, 185–194. [Google Scholar] [CrossRef]
  17. Hung, T.C.; Yan, W.M.; Li, W.P. Analysis of heat transfer characteristics of double-layered microchannel heat sink—ScienceDirect. Int. J. Heat Mass Transf. 2012, 55, 3090–3099. [Google Scholar] [CrossRef]
  18. Fu, B.R.; Lee, C.Y.; Pan, C. The effect of aspect ratio on flow boiling heat transfer of HFE-7100 in a microchannel heat sink. Int. J. Heat Mass Transf. 2013, 58, 53–61. [Google Scholar] [CrossRef]
  19. Pan, Y.H.; Zhao, R.; Fan, X.H.; Nian, Y.L.; Cheng, W.L. Study on the effect of varying channel aspect ratio on heat transfer performance of manifold microchannel heat sink. Int. J. Heat Mass Transf. 2020, 163, 120461. [Google Scholar] [CrossRef]
  20. Al-Zaidi, A.H.; Mahmoud, M.M.; Karayiannis, T.G. Effect of aspect ratio on flow boiling characteristics in microchannels. Int. J. Heat Mass Transf. 2021, 164, 120587. [Google Scholar] [CrossRef]
  21. Cheng, X.; Wu, H. Enhanced flow boiling performance in high-aspect-ratio groove-wall microchannels. Int. J. Heat Mass Transf. 2021, 164, 120468. [Google Scholar] [CrossRef]
  22. Yan, Z.; Liu, J.; Zhu, K. Research of Fluid Flow Characteristics for Surface Morphology of Solid. J. Phys. Conf. Ser. 2021, 1846, 012032. [Google Scholar] [CrossRef]
  23. Di, Y.; Qiu, J.; Wang, G.; Wang, H.; Zheng, B. Exploring Contact Angle Hysteresis Behavior of Droplets on the Surface Microstructure. Langmuir 2021, 37, 7078–7086. [Google Scholar] [CrossRef] [PubMed]
  24. Ronshin, F.; Chinnov, E. Experimental characterization of two-phase flow patterns in a slit microchannel. Exp. Therm. Fluid Sci. 2019, 103, 262–273. [Google Scholar] [CrossRef]
  25. Jong, W.R.; Kuo, T.H.; Ho, S.W.; Chiu, H.H.; Peng, S.H. Flows in rectangular microchannels driven by capillary force and gravity. Int. Commun. Heat Mass Transf. 2007, 34, 186–196. [Google Scholar] [CrossRef]
  26. Xue, Y.; Guo, C.; Gu, X.; Xu, Y.; Xue, L.; Lin, H. Study on Flow Characteristics of Working Medium in Microchannel Simulated by Porous Media Model. Micromachines 2020, 12, 18. [Google Scholar] [CrossRef]
  27. Cheng, Z.D.; He, Y.L.; Cui, F.Q. Numerical investigations on coupled heat transfer and synthetical performance of a pressurized volumetric receiver with MCRT–FVM method. Appl. Therm. Eng. 2013, 50, 1044–1054. [Google Scholar] [CrossRef]
  28. Lee, P.S.; Garimella, S.V. Saturated flow boiling heat transfer and pressure drop in silicon microchannel arrays. Int. J. Heat Mass Transf. 2008, 51, 789–806. [Google Scholar] [CrossRef] [Green Version]
  29. Jiang, T.S.; Soo-Gun, O.H.; Slattery, J.C. Correlation for dynamic contact angle. J. Colloid Interface Sci. 1979, 69, 74–77. [Google Scholar] [CrossRef]
  30. Gai, D.; Liu, Z.; Liu, W.; Yang, J. Characteristics of temperature oscillation in miniature loop heat pipe with flat evaporator. J. Chem. Ind. Eng. Soc. China 2009, 60, 1390–1397. Available online: http://en.cnki.com.cn/Article_en/CJFDTOTAL-HGSZ200906010.htm. (accessed on 20 May 2022).
  31. Lucas, R. Ueber das Zeitgesetz des kapillaren Aufstiegs von Flüssigkeiten. Kolloid-Z. 1918, 23, 15–22. [Google Scholar] [CrossRef]
  32. Washburn, E.W. The dynamics of capillary flow. Phys. Rev. 1921, 17, 273–283. [Google Scholar] [CrossRef]
Figure 1. Framework of this research. (a) The physical map of the array microchannels; (b) The schematic diagram of the array microchannels capillary pumping experiment; and (c) The structure of the array microchannels simulation model.
Crystals 12 00950 g001
Figure 2. Diagram of experimental setup. (a) Capillary suction experimental platform; (b) Partial magnified view of filling module; and (c) Partial magnified view of visualization module.
Crystals 12 00950 g002
Figure 3. Physical model schematic. (a) Numerical model sketch; (b) Grid graphics; and (c) Microchannel local magnification grid pattern.
Crystals 12 00950 g003
Figure 4. Microchannel suction phenomenon diagram. (af) The capillary suction process in the 12 μm microchannel; (g) The 12 μm microchannel suction termination diagram; (h) The 20 μm microchannel suction termination diagram; and (i) The 30 μm microchannel suction termination diagram.
Crystals 12 00950 g004
Figure 5. Analysis of simulation results. (a) Initial gas–liquid distribution; (b) Contours of transitive suction process; and (c) Velocity vector process diagram.
Crystals 12 00950 g005
Figure 6. Comparison of simulated and experimental suction distances in microchannels of different widths. (a) 12 μm; (b) 20 μm; and (c) 30 μm.
Crystals 12 00950 g006
Figure 7. Capillary suction process in array microchannels of different depth. (a) 150 μm; (b) 180 μm; and (c) 200 μm.
Crystals 12 00950 g007
Table 1. Grid independence checking results.
Grid Cells (Million)Maximum Suction Distance
0.51.152
1.20.958
2.10.817
2.90.802
3.70.790
Table 2. Roughness of three silicon-based microchannels.
Sample12 μm20 μm30 μm
10.5450.4520.352
20.5320.4570.340
30.5370.4510.357
Average0.5380.4530.350
Publisher’s Note: MDPI stays neutral with regard to jurisdictional claims in published maps and institutional affiliations.

