Article

Selenourea for Experimental Phasing of Membrane Protein Crystals Grown in Lipid Cubic Phase

1
Institute of Molecular Enzymology, School of Biology and Basic Medical Sciences, Soochow University, Suzhou 215123, China
2
CAS Center for Excellence in Molecular Cell Science, Shanghai Institute of Biochemistry and Cell Biology, Chinese Academy of Sciences, 320 Yueyang Road, Shanghai 200031, China
*
Author to whom correspondence should be addressed.
Crystals 2022, 12(7), 976; https://doi.org/10.3390/cryst12070976
Submission received: 31 May 2022 / Revised: 23 June 2022 / Accepted: 23 June 2022 / Published: 13 July 2022
(This article belongs to the Special Issue Membrane Protein Crystallography)

Abstract

:
Heavy-atom soaking has been a major method for experimental phasing, but it has been difficult for membrane proteins, partly owing to the lack of available sites in the scarce soluble domain for non-invasive heavy-metal binding. The lipid cubic phase (LCP) has proven to be a successful method for membrane protein crystallization, but experimental phasing with LCP-grown crystals remains difficult, and so far, only 68 such structures were phased experimentally. Here, the selenourea was tested as a soaking reagent for the single-wavelength anomalous dispersion (SAD) phasing of crystals grown in LCP. Using a single crystal, the structure of the glycerol 3-phosphate acyltransferase (PlsY, ~21 kDa), a very hydrophobic enzyme with 80% membrane-embedded residues, was solved. Remarkably, a total of 15 Se sites were found in the two monomers of PlsY, translating to one selenourea-binding site per every six residues in the accessible extramembrane protein. Structure analysis reveals that surface-exposed selenourea sites are mostly contributed by mainchain amides and carbonyls. This low-specificity binding pattern may explain its high loading ratio. Importantly, both the crystal diffraction quality and the LCP integrity were unaffected by selenourea soaking. Taken together, selenourea presents a promising and generally useful reagent for heavy-atom soaking of membrane protein crystals grown in LCP.

1. Introduction

In X-ray crystallography, experimental phasing has been a major method for the structural determination of macromolecules with novel folds. The recent advances in artificial intelligence-based structural predictions, represented by AlphaFold [1] and RosettaFold [2], make it possible to bypass experimental phasing even for unknown folds because of the ability to generate prediction models with enough accuracy for molecular replacement (MR) [3]. Because the quality of the predicted models depends on available training datasets, experimental phasing may still be required for the crystal structure determination of proteins that lack suitable learning models for structure prediction. Membrane proteins may represent such a class because of the relatively low number of unique structures. Thus, according to the Membrane Protein with Known 3D Structure database (https://blanco.biomol.uci.edu/mpstruc), there are only 1458 unique structures of membrane proteins as of 31 May 2022. Among these, some are homologs from different species, and nearly 10% belong to bacteriorhodopsins or structurally related rhodopsins/G-protein coupled receptors (GPCRs) [4]. Furthermore, some membrane proteins undergo conformational changes to a drastic degree such that molecular replacement with its alternative conformation could even fail [5]. Therefore, experimental phasing, although not as in demand as before, may still be needed in the structural biology of membrane proteins.
Experimental phasing, whether by more traditional isomorphs replacement or more recent anomalous scattering techniques such as single-wavelength anomalous diffraction (SAD), makes use of signals from electron-rich heavy atoms [6]. For instance, the sulfur atom in the protein residues methionine and cysteine can be replaced by the heavier, more metallic element selenium [7] from the same group of the periodic table by metabolic manipulation of expression hosts [8,9] or by cell-free expression systems [10,11]. Se could also be incorporated into proteins by selenobiotinylation [12], or covalently added to nucleotides [13] for phasing purposes. More recently, the implementation and optimization of long-wavelength X-ray beams in synchrotron sources [14,15,16,17,18,19], the development of new data-collection strategies [20,21,22], high signal-noise detectors [23,24], in-vacuum crystallography beamlines [25], and improved in situ data-collection toolsets [26], have enabled experimental phasing using weak anomalous signals directly from intrinsic sulfur atoms.
The S- or Se-SAD approach has the advantage of high occupancy because the atom is covalently attached to the proteins. However, the S-SAD technique requires reliable X-ray sources that perform well at long wavelengths, as well as relative high-resolution data (generally better than 3.5 Å) [23] which may not be routine for membrane proteins. The Se-SAD is more forgiving in this regard but the biological incorporation of Se can be challenging if (i) the expression level of the Se-labeled protein drops significantly to an impracticable level; (ii) the inclusion of Se-Met aggravates the toxicity issues to the host cells [27] which may have already suffered from membrane protein overexpression [28,29,30,31]; and (iii) the Se-labeled protein does not crystalize or the crystals do not diffract to sufficiently high resolution. In such cases, soaking crystals with heavy atoms is often required.
Heavy-atom soaking for membrane protein crystals can present great challenges associated with the hydrophobic nature [32]. In some cases, crystal contacts are mediated by a few polar residues in the scarce soluble domains. Soaking with heavy atoms, especially heavy metals that interact with side chains by charge-charge interaction or coordination [33,34,35], may disrupt such interfaces, affecting diffraction quality or causing the dissolution of crystals [36]. As alternative approaches, crystallization of iodinated protein [37] and co-crystallization of membrane proteins with iodine-derivatized detergents [38] have been used for experimental phasing.
Recently, a selenium derivative of urea (selenourea, Se-urea) has been developed for phasing water-soluble proteins [39]. It is less toxic than most heavy metals. It is highly water-soluble and can serve as both a donor and receptor for H-bonding. Apart from being able to interact with various sidechain functional groups such as hydroxyl, amine, amide, imidazole, and carboxyl groups, its small size enables it to attach accessible backbone amide and carbonyl groups to enrich the binding sites on proteins.
We were curious to test Se-urea as a soaking reagent for crystals grown in the lipid cubic phase (LCP). The LCP method [40] has flourished over 1200 membrane protein structures in the worldwide Protein Data Bank (www.wwpdb.org) (accessed on 31 May 2022). Partly reflecting the difficulty of experimental phasing in LCP, only 68 records (6.7%) were solved using experimental phasing (Figure 1).
Previously, we have solved the structure of PlsY, a ubiquitous bacterial glycerol 3-phosphate acyltransferase that catalyzes the committed step in phospholipid synthesis, using LCP-grown crystals with Se-Met labeling [41]. PlsY is a highly hydrophobic protein. It has a size of ~21 kDa and crosses the membrane seven times. As a result, approximately 80% of PlsY residues are buried in the membrane [41], making it an attractive example to test Se-urea soaking for hydrophobic proteins.
Figure 1. Statistics of LCP structures regarding phasing techniques. (A) Structures solved by experimental phasing only account for 6.7% of all structures. The majority of the structures are solved by molecular replacement (MR). The methods for the two ‘others’ are Ab initio [42,43,44] using the ARCIMBOLDO_LITE algorithm [45] and molecular replacement with models constructed by evolutionary coupling [46,47], as shown in (B). Brackets indicate the number of structures in each category. (B) Statistics of structures solved by non-MR methods. In the case of experimental phasing, the heavy atoms are listed. The total number (72) exceeds 68 as in (A) by four because four structures used two heavy atoms each for experimental phasing.
Crystals 12 00976 g001
Here, we demonstrate that Se-urea is a compatible and effective heavy-atom compound for the experimental phasing of crystals grown in LCP. With a single crystal, the structure of PlsY was successfully determined by Se-SAD. The results should encourage the use of the Se-urea for experimental phasing with LCP-grown membrane protein crystals.

2. Materials & Methods

2.1. Materials

Monoolein (Cat. M239, Nu-chek prep, Elysian, MN, USA), 7.9 MAG, (Cat. 850534, Avanti Polar Lipids, Birmingham, AL, USA), dodecyl maltoside (Cat. C24H46011, Exceed Bio Inc., Shanghai, China), lysozyme (Cat. L6876, Sigma, St. Louis, MO, USA), Se-urea (Cat. 230499, Sigma, St. Louis, MO, USA), triethylene glycol (Cat. 95126, Sigma, St. Louis, MO, USA), Ni-NTA beads (Cat. 30410, Qiagen, Hilden, Germany) were purchased from commercial sources. Se-urea was stored in a vacuum chamber with desiccators as small aliquots.

2.2. Purification of PlsY

PlsY from Aquifex aeolicus (Uniprot O66905) was overexpressed in Escherichia coli BL21 (DE3) cells with a C-terminal green fluorescent protein (GFP) fusion for easier monitoring of the expression and purification process [48], as described [41]. The expression was induced with 0.05 mM isopropyl β-D-1-thiogalactopyranoside using cells growing in M9 minimum medium at 20 °C for 16 h. Cells were lysed by passing through a cell disrupter at 20 kpsi three times at 4 °C. The cell lysate was clarified by centrifugation at 20,000× g for 30 min. The supernatant was further centrifuged at 150,000× g for 1.5 h to isolate the membrane fraction. The pellets were then solubilized by 1% (w/v) dodecyl maltoside at 4 °C for 1 h with mild agitation. The mixture was heated at 65 °C for 30 min, cooled to room temperature (22–25 °C) under tap water, and clarified by centrifugation at 20,000× g for 30 min at 4 °C. The supernatant containing solubilized PlsY was mixed with Ni-NTA beads for 1 h in the presence of 10 mM imidazole in the Buffer A (150 mM NaCl, 10% (v/v) glycerol, 0.1 mM EDTA, 50 mM Tris-HCl pH 8.0). The beads were packed into a gravity column and washed successively with 10 and 45 mM imidazole in Buffer A. The fusion protein was eluted with 250 mM imidazole in Buffer A, desalted, and digested with 3C protease overnight at room temperature. The mixture was loaded onto a second Ni-NTA column to remove His-tagged GFP and His-tagged 3C protease. The flowthrough containing tag-free PlsY was concentrated to ~10 mg mL−1 and loaded onto a Superdex 200 10/300 GL column connected to a Bio-Rad FPLC system for size exclusion chromatography. Peak fractions were pooled, concentrated to 20 mg mL−1, flash-frozen in liquid nitrogen, and stored at −80 °C until use.

2.3. Crystallization of Lysozyme in Lipid Cubic Phase

Crystallization of lysozyme was performed manually as described [49]. Briefly, lysozyme was dissolved at 50 mg mL−1 in MillQ H2O. LCP was made by mixing the lysozyme solution with a 1.5-fold volume of monoolein in two coupled syringes [50]. Optically clear LCP was transferred to a 10-μL microsyringe (Cat. 80330, Hamilton, Reno, NV, USA) and pre-loaded into a repeat dispenser [51] with an engineered bushing [52]. On a microscope slide with wells created by double-sticky tapes [53], 200 nL of LCP was carefully deposited onto the surface of each well. The LCP bolus was immediately laid by 1 μL of precipitant solution containing 35% (v/v) PEG 400, 0.8 M NaCl, and 100 mM sodium citrate/citric acid pH 4.5. The wells were sealed using a cover slide 18 mm × 18 mm in dimension and 0.1 mm in thickness. Crystals generally grew to ~20 μm in length after 16 h.

2.4. Crystallization of PlsY in Lipid Cubic Phase

PlsY solution was homogenized with 7.9 MAG [54] at a volume ratio of 2:3 using two coupled microsyringes [50]. Crystallization trials were carried out using a robot (Gryphon LCP, Art Robbins Instruments, Sunnyvale, CA, USA) as described [55]. Each well contains 50 nL of LCP and 800 nL of a precipitant solution consisting of 25–35% (v/v) triethylene glycol, 0.1 M ammonium sulfate, and 0.1 M glycine (not buffered; pH measured to be ~5.0). Crystallization plates were incubated in an imager (RockImager R1000, Formulatrix, Bedford, MA, USA) at 20 °C.

2.5. Soaking Lipid Cubic Phase Crystals with Se-Urea

To soak the crystals, a small window (Figure 2) was created for the desired wells using a pointy glass-cutter following a previously published procedure [36]. A tiny speckle of Se-urea was added to the drop through the small window under a microscope. The dimension of the speckles, as measured under a microscope, were typically 0.4 mm × 0.2 mm. Because the thickness of the spacer between the cover and the base plate was 0.12 mm, the volume of the speckles was typically 0.008 mm3. Thus, the speckles had an estimated mass of ~10 μg assuming that Se-urea has a similar density to urea (1.32 g/cm3). This translates to ~0.1 M final concentration in the precipitant solution (800 nL). The well was resealed using Scotch tape. After soaking for the lysozyme for six minutes and PlsY for 22 min, the wells were cut open using a glass cutter. Crystals were harvested with a loop (Cat. M2-L18SP-50, MiTeGen, Ithaca, NY, USA) loop and cryo-cooled directly in liquid nitrogen as described [56].

2.6. X-ray Diffraction Data Collection

X-ray diffraction data were collected on the BL17U1 beamline [57] for lysozyme crystal with an Eiger 16M detector (Dectris, Baden, Switzerland) at the wavelength of 0.97918 Å and BL19U1 beamlines [58] for PlsY crystal with a Pilatus 6M detector (Dectris, Baden, Switzerland) using 0.97907 Å X-rays at the Shanghai Synchrotron Radiation Facility (SSRF) with a 0.5° oscillation and total rotation range of 360° and a beam size of 50 μm × 50 μm.

2.7. Data Processing and Structure Determination

Crystallographic data were processed by HKL2000 [59] using “auto-correction” during scaling (Table 1). The scaled data with separated Friedel pairs were subjected to SHELXC [60] to calculate the anomalous difference signal (<d”/sig>) and generate the input files for SHELXD [60]. Selenium atoms were located by SHELXD with 1000 trials with the resolution cut-off at 2.5 Å and 3.0 Å for lysozyme and PlsY, respectively. The substructure refinement, density modification, and the initial chain tracing were carried out by SHELXE [60]. Model building was carried out by BUCCANEER [61] in the CCP4 package [62]. The Se-urea molecules were placed according to the anomalous difference map and the lipids bound to PlsY were modeled according to the Fo-Fc and 2Fo-Fc maps in COOT [63]. The models were refined by REFMAC5 and manually adjusted in COOT iteratively. The structures were illustrated by PyMOL [64].

3. Results & Discussions

3.1. Both Lipid Cubic Phase and PlsY Tolerated Se-Urea Soaking

Heavy-atom derivatives are only useful if the crystals survive soaking. Thus, the stability of crystals upon soaking should first be visually checked under a microscope. For LCP crystals, there is another complication. Various chemicals, when at high concentrations, can cause phase transition from the cubic mesophase to the lamellar phase [65,66,67,68]. The bulk lamellar phase has a characteristic strong birefringence [53] under polarized light. It may impose stress on crystals, and it certainly interferes with crystal observing and harvesting [56]. Furthermore, the lamellar phase can at least compromise crystal diffraction because it shows strong diffraction rings under X-ray [68]. Therefore, it is important to test the stability of both LCP and crystals and gauge conditions such as soaking concentration and time before soaking crystals with the best qualities, especially when such crystals are difficult to obtain.
The tolerance of LCP and PlsY crystals to Se-urea soaking was carried out using crystals that were relatively small in three-dimension (thin plates) (Figure 2). A well containing PlsY crystals was cut open. Se-urea speckles were added to the precipitant solution that contained 32% (v/v) triethylene glycol (Figure 2A). Se-urea was completely dissolved after 22 min. Crystals were visually intact during this period (Figure 2B,C), suggesting that PlsY crystals were tolerant to osmaticity changes caused by the dissolution of Se-urea. Finally, like urea, Se-urea may have chaotropic characteristics. However, the concentration (estimated to be 0.1 M, see Methods) was probably not high enough to denature PlsY.
LCP is known to tolerate saturating concentrations of ‘normal’ urea [69]. By extension, it is expected to be compatible with high concentrations of Se-urea. Consistently, no bulk lamellar phase (which shows characteristic birefringence under polarized light) [53] was observed during the soaking (Figure 2D,E). Nevertheless, the insensitivity of LCP to Se-urea observed here should not be generalized. Crystallization conditions vary in type and concentration of precipitants, detergents, lipids, and membrane proteins, and the phase stability may depend on these conditions. Therefore, we recommend running the compatibility test for new projects.

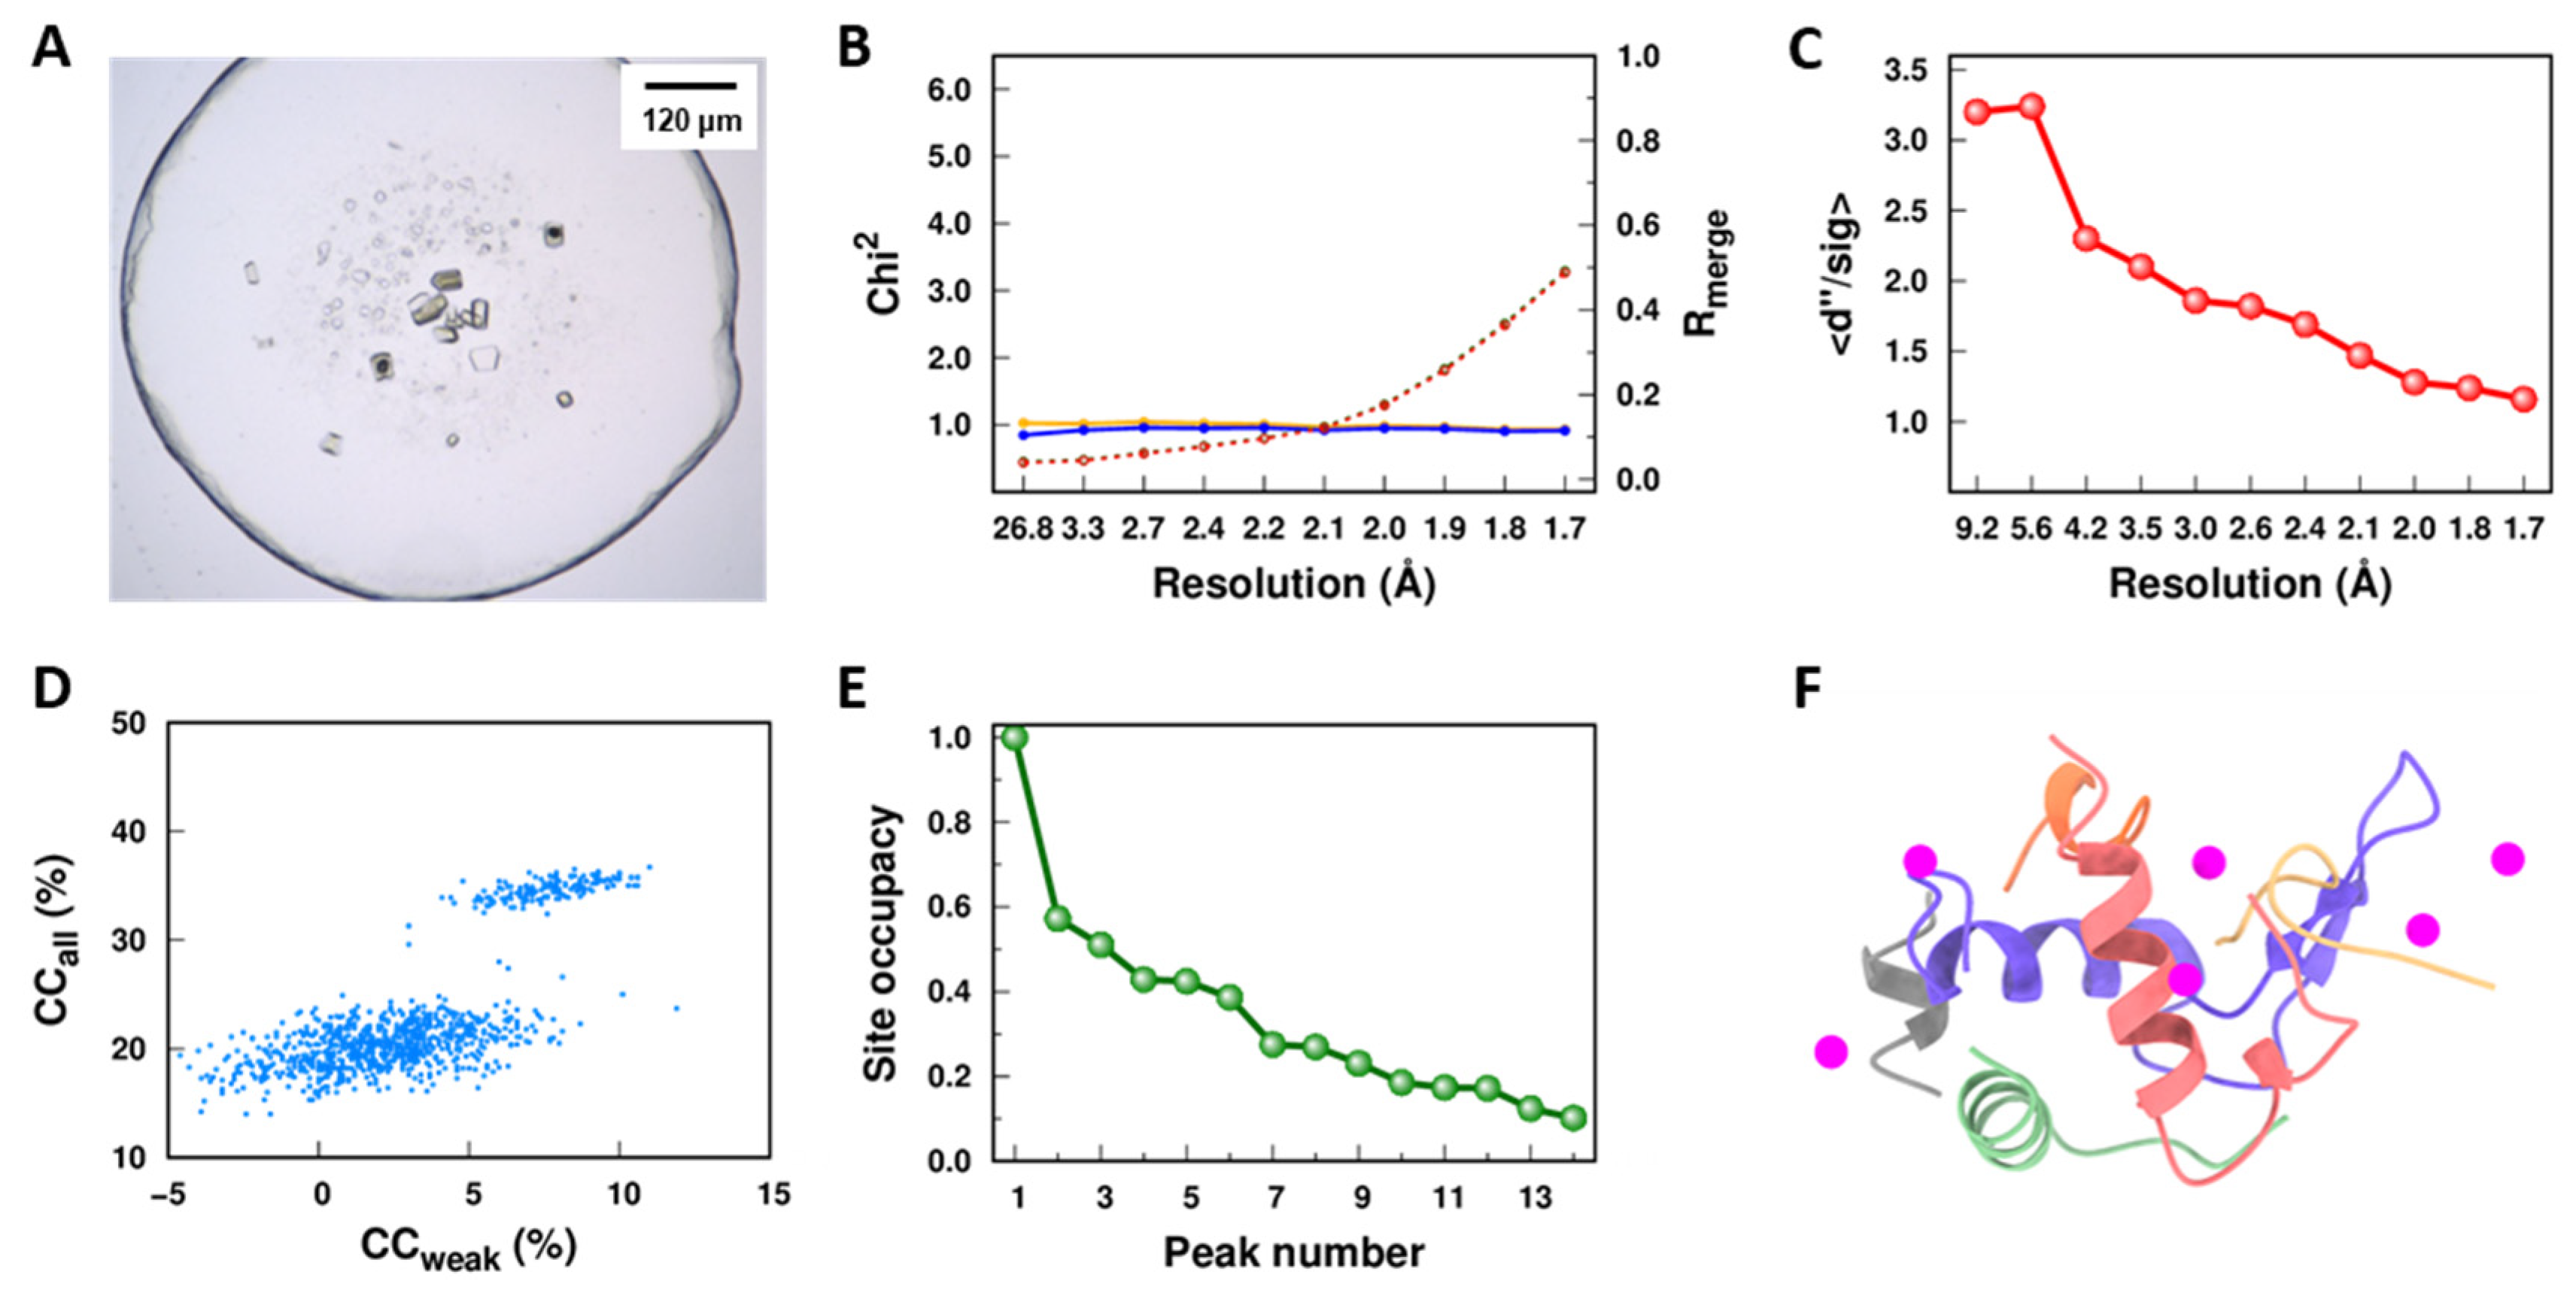
3.2. Prove-of-Principle Experiment with Lysozyme

The idea of using Se-urea for LCP-grown crystals emerged in discussions between the authors during the ICCBM17 workshop and conference in Shanghai. As part of the workshop demonstration, lysozyme crystals were grown in LCP; and heavy-atom derivatives of lysozyme crystals were needed for the integrated phasing workshop. Driven by common interests, the authors performed a quick soaking of lysozyme crystals (Figure 3A) using Se-urea. The crystals diffracted beyond 1.71 Å at the synchrotron without further optimizing the distance during the workshop training section (Table 1). Although only weak anomalous signals were indicated by the Chi2 versus resolution plot from HKL2000 data scaling (Figure 3B), the anomalous signal <d”/sig> estimated by SHELXC was very strong within 3.0 Å (Figure 3C). The sub-structures of Se atoms were determined using SHELXD, and six sites with occupancy higher than 0.3 were revealed (Figure 3D,E). After density modification and poly-Ala tracing using SHELXE, 99 residues were built in six chains (Figure 3F).
The initial model was subjected to BUCCANEER for rebuilding. The final structure of the lysozyme and Se-urea complex was presented with the Se-urea close to the asymmetric unit of lysozyme (Figure 4A). The occupancy of the six sites ranged from 0.33 to 0.5, suggesting some level of disorder. In addition, although the positions of the Se atoms were supported by the anomalous map, the position for the amine groups and the connecting carbon atoms were less certain based on the 2FoFc density maps (Figure 4B–F), suggesting high degrees of flexibility. Nevertheless, we built the Se-urea molecules with 2FoFc density maps at 0.6–0.7 σ levels and we’ll discuss the interactions between lysozyme and Se-urea based on the built model.
None of the sites were found in the stacked helices. Instead, they were concentrated at the surface and the active site cleft. Three sites (SA, SB, SC) were contained in the crystallographic monomer and three were involved in crystal contact (SD, SE, SF, Figure 4A–F). The binding mode exhibited great diversity. It could bind to all secondary structures (loop, sheet, and helix). The binding mode of SC was particularly interesting. Instead of forming a pocket that contains surrounding residues, three residues along the same face of the helix form a ‘hook’-like structure to host Se-urea (Figure 4D). Two mainchain carbonyl groups interacted with Se-urea indirectly via two water molecules, and Lys97 at one turn away provided a further hydrogen bond. This is very encouraging—such a configuration may be easily satisfied because α-helices are very abundant, and mainchain interactions are relatively insensitive to sequence variations.
The previous lysozyme structure (PDB 5T3F) soaked with Se-urea contains 9 Se sites [39]. When overlaid, four of the sites identified in this study overlapped with those previously observed and one symmetrically identical Se site with the CO(NH2)2 group pointing in the opposite direction (Figure 4G), leaving one unique site to the LCP structure and four unique sites to the water-soluble structure. The differences are unlikely caused by crystal packing because the two protein structures are almost identical with the same packing pattern. Different diffusion rates were not likely the cause of the differences because unique sites for both structures were observed. The diffraction of Se-urea from the small crystal grown in LCP (~20 μm × 20 μm) was weaker compared to that from the large crystals used for 5T3F (~300 μm × 100 μm). In addition, the lower resolution of the LCP data set at 1.71 Å provided fewer details of the NH2 group compared to the electron density maps of 5T3F at 1.45 Å.

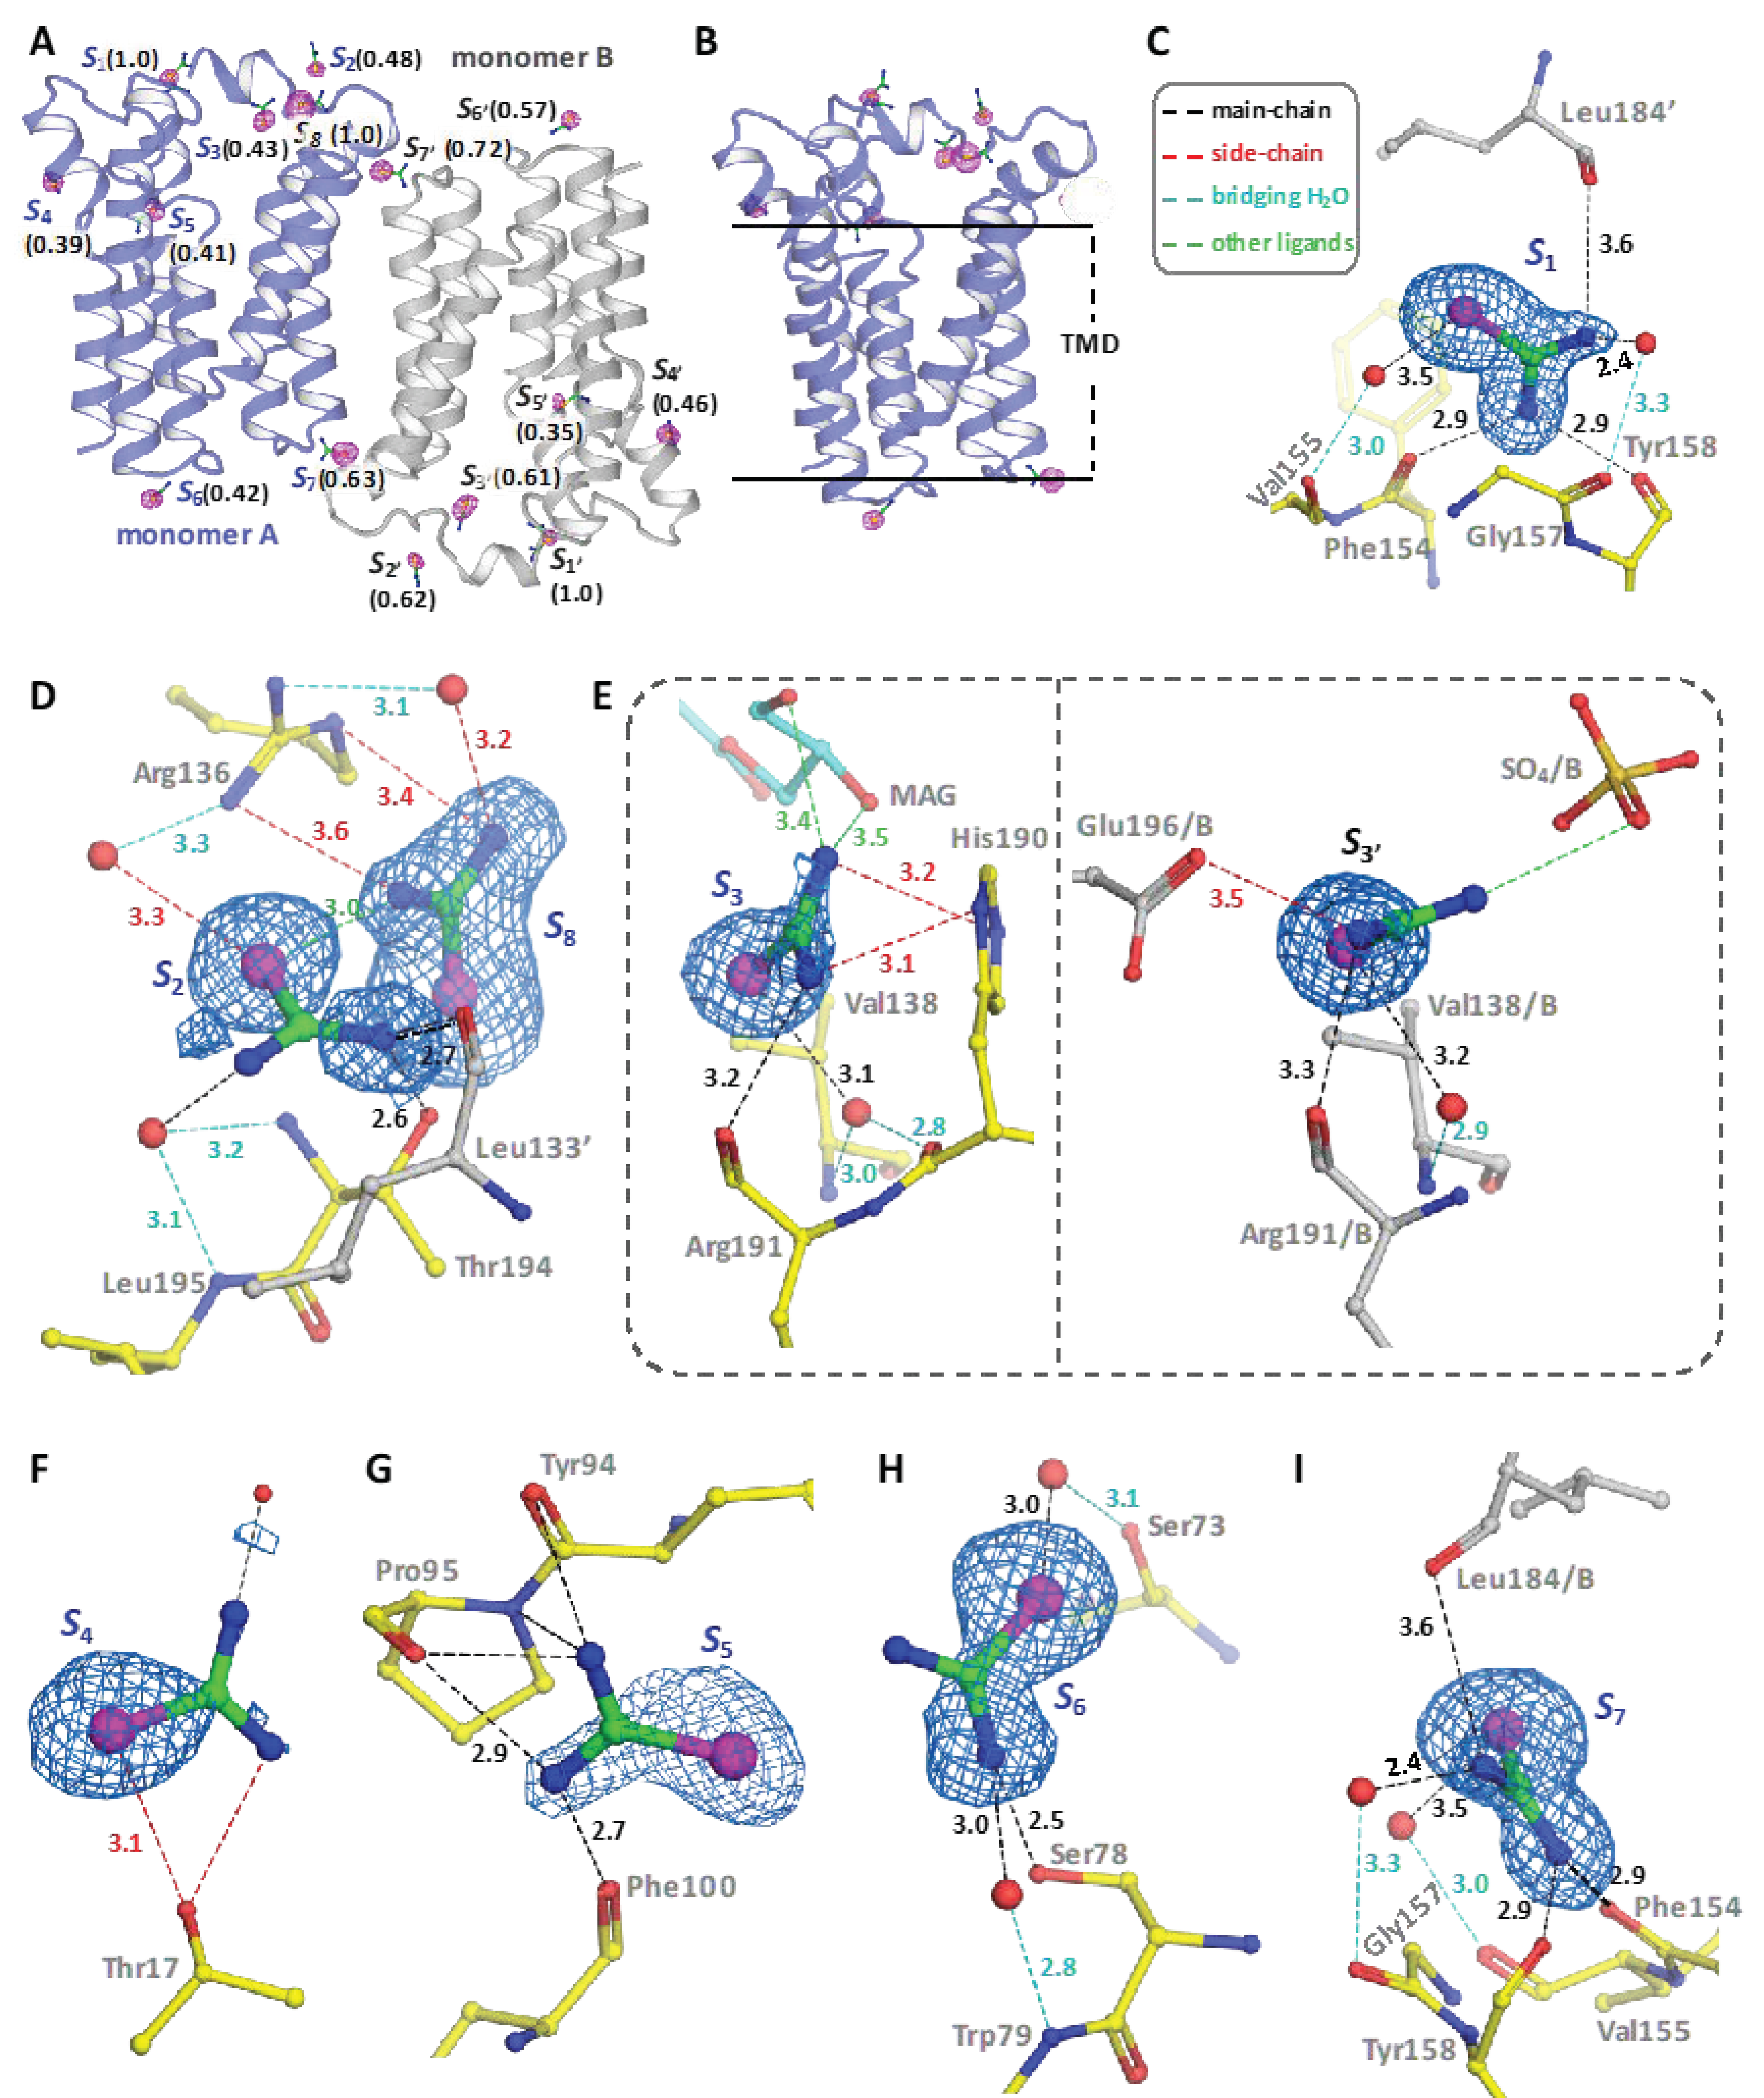
3.3. Experimental Phasing of PlsY

Next, we wanted to test how Se-urea behaves for membrane protein crystals growing in LCP. One of the major differences between membrane proteins and soluble proteins is the exposed region for binding with water-soluble chemicals such as Se-urea used in this study. To expand the application of Se-urea for membrane proteins, it would be ideal to use proteins with very few exposed regions. PlsY fits this purpose because 80% of its residues are embedded in the membrane [41].
Using the soaking procedure, the PlsY structure was solved with 360 degrees of data collected from a single crystal (Figure 5A). The crystal diffracted to 1.8 Å (Table 1). Similar to the lysozyme case, the anomalous signal from HKL2000 scaling was weak (Figure 5B) but could be extended to 3.5 Å calculated from SHELXC (Figure 5C). The sub-structures of Se atoms were determined using SHELXD, and 11 sites with occupancy higher than 0.3 were revealed (Figure 5E). After density modification and poly-Ala chain tracing by SHELXE, 373 residues were built in nine chains (Figure 5F).
The final structure was built by BUCCANEER with 15 Se-urea molecules scattered in two non-crystallographic symmetry (NCS) monomers (Figure 6A). The sites were all located in the extra-membrane domain (Figure 6B), as expected. Among the 15 sites, six were involved in crystal packing (S1, S2, S7, and their NCS pairs, Figure 6C–I). The binding sites were almost identical between the two NCS monomers with two exceptions as follows. Site 8 (S8) was only in monomer A (Figure 6A), and Site 3 (S3 and S3′) displayed slight differences between the two monomers (Figure 6E).
Among the 15 sites, eight had occupancies greater than 0.50 (S1, S7, S8, S1′, S2′, S3′, S6′, and S7′) and three had full occupancies (S1/S1′/S8) (Figure 6A). Compared with the lysozyme structure (Figure 4), the densities for the amine groups of Se-urea in the PlsY structure were more defined, suggesting that they are more ordered. Similar to the case of the lysozyme, the mainchain amide and carbonyl groups contributed significantly to the binding of Se-urea in PlsY (Figure 6C–I). The interaction pattern involving mainchain atoms for Se-urea has been observed before for the urea transporter [70] and the targets used in the previous Se-urea phasing report [39]. These results suggest that Se-urea can relatively easily bind to shallow grooves on the surface owing to its small size.
Given the little exposed region in PlsY, the loading ratio of Se-urea sites is very high. One PlsY monomer contains approximately 40 exposed residues, meaning the PlsY crystal bound ~18.8 Se-urea per 100 residues in the accessible extramembrane region. The lysozyme (129 residues) crystal bound 6 Se-urea sites, corresponding to a 4.7% coverage. Therefore, the density of the Se-urea binding site in the non-membrane embedded region of PlsY was fourfold of that for the lysozyme.
One of the objectives of this project was to check if Se-urea soaking can give enough signal for experimental phasing for membrane proteins which generally contain limited available hydrophilic surfaces for heavy-atom labeling. Traditionally, for Se-Met labeling, it is considered a ‘rule-of-thumb’ if a protein had 1 Se-Met per every 50–75 residues (1.3–2%). Technological advances over the years have improved with better detectors and data collection strategies, pushing the limit to one Se site per every 150–200 residues (0.5–0.7%) [71]. Taking the full-length protein into consideration, the coverage for PlsY was 3.8%. This is much higher than the abovementioned minimum coverage required by Se-Met labeling. Given that PlsY is very hydrophobic with 80% membrane-embedded residues, and that membrane proteins generally contain a more hydrophilic proportion than this, coverage is unlikely to be an issue for Se-urea phasing of most membrane protein crystals.
Because the success of experimental phasing depends on data resolution, a good soaking reagent should not compromise the diffraction quality of crystals. The two examples here showed that Se-urea was not invasive under the present conditions. They both survived long soaking at an estimated concentration of 0.1 M, and both diffracted to similar quality as their native counterparts [26,41,54]. The generality of this will have to be tested with other membrane protein crystals in the future.
Initial LCP crystals for membrane proteins are generally small (5–30 μm) [72,73,74]. The optimization for bigger crystals and routine synchrotron diffraction experiments may involve the fine-tuning of constructs, precipitant conditions, temperature, host lipids, and native lipid additives [72,73,74,75,76,77,78], a process that can be time- and resource-consuming. Recent advances in micro-beam synchrotron radiation and detectors [15,79], serial crystallography [80], and X-ray free-electron lasers [80,81] make it possible to obtain high-resolution diffraction data from multiple microcrystals or sub-micron crystals. Furthermore, microcrystals may be more tolerant to soaking compared with large crystals [82]. Therefore, the application of the Se-urea soaking to the LCP microcrystal for rapid phasing warrants future investigation.
Twinned crystals could be problematic for phasing [83]. Initially, the diffraction data of PlsY were processed in the C2221 space group with an overall Rmerge of 0.101, which was slightly higher than that in the P21 space group (0.094). Still, at first, the C2221 dataset appeared to be justified. The anomalous signal <d”/sig> obtained from SHELXC (Figure 7A) was much higher compared to the data processed in the P21 space group (Figure 5B), probably owing to the higher redundancy with C2221. In addition, the Se atoms were successfully located by SHELXD (Figure 7B) and the poly-Ala model was also successfully traced by SHELXE and auto-built by BUCCANEER using the C2221 dataset. However, symmetry-related clashes were observed during structure refinement (Figure 7C) for Val197 at the C-terminal of PlsY. Therefore, the data were reprocessed to the P21 space group which has lower symmetry. Although a latter L-test for twinning showed that the crystal was more close to un-twinned (Figure 7D), an H-test reported a twinning fraction of 0.40 (Figure 7E); such a phenomenon is abnormal. To resolve the clashed model, we chose to refine the data using the P21 space group with a twin fraction of 0.436 estimated by REFMAC5. Indeed, when refined using the P21 dataset, the structure showed well-resolved densities in the otherwise problematic region. The clearer densities under the P21 space group showed no clashes at the C-terminal, and the two NCS monomers assumed different conformations in this region; more specifically, at residue Val197 (Figure 7F), justifying the existence of twining. Taken together, the twined PlsY crystal did not affect phasing.
In summary, we described the methods and results of soaking LCP crystals with Se-urea for experimental phasing. The results showed that Se-urea was indeed versatile with regard to binding motifs and interaction mode. The successful application of Se-urea for the membrane enzyme PlsY should encourage its wide usage in experimental phasing.

Author Contributions

Z.L., Y.W. and D.L. performed experiments. Z.L. and D.L. wrote the manuscript with inputs from Y.T. and W.G. All authors have read and agreed to the published version of the manuscript.

Funding

This research was funded by the Key Program of CAS Frontier Science (QYZDB-SSW-SMC037), the Strategic Priority Research Program of the Chinese Academy of Sciences (XDB37020204), the CAS Facility-based Open Research Program, and the National Natural Science Foundation of China (31870726). The APC was funded by the National Natural Science Foundation of China (31870726).

Institutional Review Board Statement

Not applicable.

Informed Consent Statement

Not applicable.

Data Availability Statement

The structure factors and coordinates are available through the protein data bank (PDB) under accession codes 7CQO (lysozyme) and 7CQM (PlsY).

Acknowledgments

We thank the staff members of the Large-scale Protein Preparation System for equipment maintenance and management, and staff scientists at the SSRF-BL17U1 and BL19U1 beamlines at Shanghai Synchrotron Radiation Facility and National Center for Protein Sciences for technical support and assistance.

Conflicts of Interest

The authors declare no conflict of interest. The funders had no role in the design of the study; in the collection, analyses, or interpretation of data; in the writing of the manuscript, or in the decision to publish the results.

References

  1. Jumper, J.; Evans, R.; Pritzel, A.; Green, T.; Figurnov, M.; Ronneberger, O.; Tunyasuvunakool, K.; Bates, R.; Žídek, A.; Potapenko, A.; et al. Highly accurate protein structure prediction with AlphaFold. Nature 2021, 596, 583–589. [Google Scholar] [CrossRef] [PubMed]
  2. Baek, M.; DiMaio, F.; Anishchenko, I.; Dauparas, J.; Ovchinnikov, S.; Lee, G.R.; Wang, J.; Cong, Q.; Kinch, L.N.; Baker, D.; et al. Accurate prediction of protein structures and interactions using a three-track neural network. Science 2021, 373, 871–876. [Google Scholar] [CrossRef] [PubMed]
  3. McCoy, A.J.; Sammito, M.D.; Read, R.J. Implications of AlphaFold2 for crystallographic phasing by molecular replacement. Acta Crystallogr. Sect. D Struct. Biol. 2022, 78, 1–13. [Google Scholar] [CrossRef]
  4. Pándy-Szekeres, G.; Munk, C.; Tsonkov, T.M.; Mordalski, S.; Harpsøe, K.; Hauser, A.S.; Bojarski, A.J.; Gloriam, D.E. GPCRdb in 2018: Adding GPCR structure models and ligands. Nucleic Acids Res. 2017, 46, D440–D446. [Google Scholar] [CrossRef] [Green Version]
  5. Chang, Y.; Bruni, R.; Kloss, B.; Assur, Z.; Kloppmann, E.; Rost, B.; Hendrikson, W.A.; Liu, Q. Structural basis for a pH-sensitive calcium leak across membranes. Science 2014, 344, 1131–1135. [Google Scholar] [CrossRef] [Green Version]
  6. Taylor, G.L. Introduction to phasing. Acta Crystallogr. D 2010, 66, 325–338. [Google Scholar] [CrossRef] [PubMed]
  7. Hendrickson, W.A.; Horton, J.R.; LeMaster, D.M. Selenomethionyl proteins produced for analysis by multiwavelength anomalous diffraction (MAD): A vehicle for direct determination of three-dimensional structure. EMBO J. 1990, 9, 1665–1672. [Google Scholar] [CrossRef]
  8. Larsson, A.M.; Jones, T.A. Selenomethionine labeling of recombinant proteins. Methods Mol. Biol. 2007, 389, 165–174. [Google Scholar]
  9. Bellizzi, J.J., III; Widom, J.; Kemp, C.W.; Clardy, J. Producing selenomethionine-labeled proteins with a baculovirus expression vector system. Structure 1999, 7, R263–R267. [Google Scholar] [CrossRef] [Green Version]
  10. Kigawa, T.; Yamaguchi-Nunokawa, E.; Kodama, K.; Matsuda, T.; Yabuki, T.; Matsuda, N.; Ishitani, R.; Nureki, O.; Yokoyama, S. Selenomethionine incorpora-tion into a protein by cell-free synthesis. J. Struct. Funct. Genom. 2002, 2, 29–35. [Google Scholar] [CrossRef]
  11. Vogeley, L.; El Arnaout, T.; Bailey, J.; Stansfeld, P.J.; Boland, C.; Caffrey, M. Structural basis of lipoprotein signal peptidase II action and inhibition by the antibiotic globomycin. Science 2016, 351, 876–880. [Google Scholar] [CrossRef] [PubMed] [Green Version]
  12. Hendrickson, W.A.; Pähler, A.; Smith, J.L.; Satow, Y.; Merritt, E.A.; Phizackerley, R.P. Crystal structure of core streptavidin determined from multiwavelength anomalous diffraction of synchrotron radiation. Proc. Natl. Acad. Sci. USA 1989, 86, 2190–2194. [Google Scholar] [CrossRef] [PubMed] [Green Version]
  13. Du, Q.; Carrasco, N.; Teplova, M.; Wilds, C.J.; Egli, M.; Huang, Z. Internal Derivatization of Oligonucleotides with Selenium for X-ray Crystallography Using MAD. J. Am. Chem. Soc. 2001, 124, 24–25. [Google Scholar] [CrossRef] [PubMed]
  14. Liu, Q.; A Hendrickson, W. Crystallographic phasing from weak anomalous signals. Curr. Opin. Struct. Biol. 2015, 34, 99–107. [Google Scholar] [CrossRef] [Green Version]
  15. Guo, G.; Zhu, P.; Fuchs, M.R.; Shi, W.; Andi, B.; Gao, Y.; Hendrickson, W.A.; McSweeney, S.; Liu, Q. Synchrotron microcrystal native-SAD phasing at a low energy. IUCrJ 2019, 6, 532–542. [Google Scholar] [CrossRef]
  16. Cianci, M.; Groves, M.; Barford, D.; Schneider, T.R. Data collection with a tailored X-ray beam size at 2.69 Å wavelength (4.6 keV): Sulfur SAD phasing of Cdc23(Nterm). Acta Crystallogr. Sect. D Struct. Biol. 2016, 72, 403–412. [Google Scholar] [CrossRef] [Green Version]
  17. Aurelius, O.; Duman, R.; El Omari, K.; Mykhaylyk, V.; Wagner, A. Long-wavelength macromolecular crystallography—First successful native SAD experiment close to the sulfur edge. Nucl. Instrum. Methods Phys. Res. Sect. B 2016, 411, 12–16. [Google Scholar] [CrossRef]
  18. Wang, W.; Yang, X.; Chang, G.; An, P.; Cha, K.; Dong, Y.; Liu, P. A method to stabilize the incident X-ray energy for anomalous diffraction measurements. J. Synchrotron Radiat. 2017, 24, 781–786. [Google Scholar] [CrossRef]
  19. Su, X.-D.; Zhang, H.; Terwilliger, T.C.; Liljas, A.; Xiao, J.; Dong, Y. Protein Crystallography from the Perspective of Technology Developments. Crystallogr. Rev. 2015, 21, 122–153. [Google Scholar] [CrossRef]
  20. Basu, S.; Olieric, V.; Leonarski, F.; Matsugaki, N.; Kawano, Y.; Takashi, T.; Huang, C.-Y.; Yamada, Y.; Vera, L.; Olieric, N.; et al. Long-wavelength native-SAD phasing: Op-portunities and challenges. IUCrJ 2019, 6, 373–386. [Google Scholar] [CrossRef] [Green Version]
  21. Olieric, V.; Weinert, T.; Finke, A.D.; Anders, C.; Li, D.; Olieric, N.; Borca, C.N.; Steinmetz, M.O.; Caffrey, M.; Jinek, M.; et al. Data-collection strategy for challenging native SAD phasing. Acta Crystallogr. D 2016, 72, 421–429. [Google Scholar] [CrossRef] [PubMed]
  22. Cianci, M.; Nanao, M.; Schneider, T.R. Long-wavelength Mesh&Collect native SAD phasing from microcrystals. Acta Crystallogr. Sect. D Struct. Biol. 2019, 75, 192–199. [Google Scholar] [CrossRef] [Green Version]
  23. Rose, J.P.; Wang, B.-C.; Weiss, M.S. Native SAD is maturing. IUCrJ 2015, 2, 431–440. [Google Scholar] [CrossRef] [PubMed]
  24. Marchal, J.; Wägner, A. Performance of PILATUS detector technology for long-wavelength macromolecular crystallography. Nucl. Instruments Methods Phys. Res. Sect. A 2011, 633, S121–S124. [Google Scholar] [CrossRef]
  25. Wagner, A.; Duman, R.; Henderson, K.; Mykhaylyk, V. In-vacuum long-wavelength macromolecular crystallography. Acta Crystallogr. Sect. D 2016, 72, 430–439. [Google Scholar] [CrossRef] [PubMed] [Green Version]
  26. Huang, C.-Y.; Olieric, V.; Ma, P.; Panepucci, E.; Diederichs, K.; Wang, M.; Caffrey, M. In meso in situ serial X-ray crystallography of soluble and membrane proteins. Acta Crystallogr. Sect. D Biol. Crystallogr. 2015, 71, 1238–1256. [Google Scholar] [CrossRef] [Green Version]
  27. Walden, H. Selenium incorporation using recombinant techniques. Acta Crystallogr. Sect. D 2010, 66, 352–357. [Google Scholar] [CrossRef] [PubMed] [Green Version]
  28. Gubellini, F.; Verdon, G.; Karpowich, N.K.; Luff, J.D.; Boel, G.; Gauthier, N.; Handelman, S.; Ades, S.E.; Hunt, J.F. Physiological Response to Membrane Protein Overexpression in E. coli. Mol. Cell. Proteom. 2011, 10, 1–17. [Google Scholar] [CrossRef] [PubMed] [Green Version]
  29. Gialama, D.; Kostelidou, K.; Michou, M.; Delivoria, D.C.; Kolisis, F.N.; Skretas, G. Development of Escherichia coli Strains That Withstand Membrane Protein-Induced Toxicity and Achieve High-Level Recombinant Membrane Protein Production. ACS Synth. Biol. 2016, 6, 284–300. [Google Scholar] [CrossRef]
  30. Wagner, S.; Klepsch, M.M.; Schlegel, S.; Appel, A.; Draheim, R.; Tarry, M.; Högbom, M.; van Wijk, K.J.; Slotboom, D.J.; Persson, J.O.; et al. Tuning Escherichia coli for mem-brane protein overexpression. Proc. Natl. Acad. Sci. USA 2008, 105, 14371–14376. [Google Scholar] [CrossRef] [Green Version]
  31. Wagner, S.; Bader, M.L.; Drew, D.; de Gier, J.-W. Rationalizing membrane protein overexpression. Trends Biotechnol. 2006, 24, 364–371. [Google Scholar] [CrossRef] [PubMed]
  32. Pike, A.C.; Garman, E.F.; Krojer, T.; Von Delft, F.; Carpenter, E.P. An overview of heavy-atom derivatization of protein crystals. Acta Crystallogr. Sect. D Struct. Biol. 2016, 72, 303–318. [Google Scholar] [CrossRef] [Green Version]
  33. Garman, E.; Murray, J.W. Heavy-atom derivatization. Acta Crystallogr. Sect. D 2003, 59, 1903–1913. [Google Scholar] [CrossRef] [PubMed] [Green Version]
  34. Boggon, T.J.; Shapiro, L. Screening for phasing atoms in protein crystallography. Structure 2000, 8, R143–R149. [Google Scholar] [CrossRef] [Green Version]
  35. Lu, J.; Sun, P.D. A rapid and rational approach to generating isomorphous heavy-atom phasing derivatives. FEBS J. 2014, 281, 4021–4028. [Google Scholar] [CrossRef] [PubMed] [Green Version]
  36. Li, D.; Pye, V.E.; Caffrey, M. Experimental phasing for structure determination using membrane-protein crystals grown by the lipid cubic phase method. Acta Crystallogr. D 2015, 71, 104–122. [Google Scholar] [CrossRef] [PubMed] [Green Version]
  37. Guo, Y.; Kalathur, R.C.; Liu, Q.; Kloss, B.; Bruni, R.; Ginter, C.; Kloppmann, E.; Rost, B.; Hendrickson, W.A. Structure and activity of tryptophan-rich TSPO proteins. Science 2015, 347, 551–555. [Google Scholar] [CrossRef] [Green Version]
  38. Nakane, T.; Hanashima, S.; Suzuki, M.; Saiki, H.; Hayashi, T.; Kakinouchi, K.; Sugiyama, S.; Kawatake, S.; Matsuoka, S.; Matsumori, N.; et al. Membrane protein structure determination by SAD, SIR, or SIRAS phasing in serial femtosecond crystallography using an iododetergent. Proc. Natl. Acad. Sci. USA 2016, 113, 13039–13044. [Google Scholar] [CrossRef] [Green Version]
  39. Luo, Z. Selenourea: A convenient phasing vehicle for macromolecular X-ray crystal structures. Sci. Rep. 2016, 6, 37123. [Google Scholar] [CrossRef] [Green Version]
  40. Caffrey, M. A comprehensive review of the lipid cubic phase or in meso method for crystallizing membrane and soluble proteins and complexes. Acta Crystallogr. F 2015, 71, 3–18. [Google Scholar] [CrossRef] [Green Version]
  41. Li, Z.; Tang, Y.; Wu, Y.; Zhao, S.; Bao, J.; Luo, Y.; Li, D. Structural insights into the committed step of bacterial phospholipid biosynthesis. Nat. Commun. 2017, 8, 1691. [Google Scholar] [CrossRef] [PubMed] [Green Version]
  42. Ren, S.; Caforio, A.; Yang, Q.; Sun, B.; Yu, F.; Zhu, X.; Wang, J.; Dou, C.; Fu, Q.; Huang, N.; et al. Structural and mechanistic insights into the biosynthesis of CDP-archaeol in membranes. Cell Res. 2017, 27, 1378–1391. [Google Scholar] [CrossRef] [PubMed] [Green Version]
  43. Scott, A.J.; Niitsu, A.; Kratochvil, H.T.; Lang, E.J.M.; Sengel, J.T.; Dawson, W.M.; Mahendran, K.R.; Mravic, M.; Thomson, A.R.; Brady, R.L.; et al. Constructing ion channels from water-soluble α-helical barrels. Nat. Chem. 2021, 13, 643–650. [Google Scholar] [CrossRef] [PubMed]
  44. Yang, B.; Yao, H.; Li, D.; Liu, Z. The phosphatidylglycerol phosphate synthase PgsA utilizes a trifurcated amphipathic cavity for catalysis at the membrane-cytosol interface. Curr. Res. Struct. Biol. 2021, 3, 312–323. [Google Scholar] [CrossRef]
  45. Sammito, M.; Millán, C.; Frieske, D.; Rodríguez-Freire, E.; Borges, R.J.; Usón, I. ARCIMBOLDO_LITE: Single-workstation implementation and use. Acta Crystallogr. D Biol. Crystallogr. 2015, 71, 1921–1930. [Google Scholar] [CrossRef]
  46. Sjodt, M.; Brock, K.; Dobihal, G.; Rohs, P.; Green, A.; Hopf, T.A.; Meeske, A.; Srisuknimit, V.; Kahne, D.; Walker, S.; et al. Structure of the peptidoglycan polymerase RodA resolved by evolutionary coupling analysis. Nature 2018, 556, 118–121. [Google Scholar] [CrossRef]
  47. Xiao, Q.; Wang, L.; Supekar, S.; Shen, T.; Liu, H.; Ye, F.; Huang, J.; Fan, H.; Wei, Z.; Zhang, C. Structure of human steroid 5α-reductase 2 with the anti-androgen drug finasteride. Nat. Commun. 2020, 11, 5430. [Google Scholar] [CrossRef]
  48. Drew, D.; Lerch, M.; Kunji, E.; Slotboom, D.J.; de Gier, J.W. Optimization of membrane protein overexpression and purification using GFP fusions. Nat. Methods 2006, 3, 303–313. [Google Scholar] [CrossRef]
  49. Aherne, M.; Lyons, J.; Caffrey, M. A fast, simple and robust protocol for growing crystals in the lipidic cubic phase. J. Appl. Crystallogr. 2012, 45, 1330–1333. [Google Scholar] [CrossRef] [Green Version]
  50. Cheng, A.; Hummel, B.; Qiu, H.; Caffrey, M. A simple mechanical mixer for small viscous lipid-containing samples. Chem. Phys. Lipids 1998, 95, 11–21. [Google Scholar] [CrossRef]
  51. Caffrey, M.; Porter, C. Crystallizing Membrane Proteins for Structure Determination using Lipidic Mesophases. J. Vis. Exp. 2010, 45, e1712. [Google Scholar] [CrossRef] [Green Version]
  52. Caffrey, M.; Eifert, R.; Li, D.; Howe, N. The lipid cubic phase or in meso method for crystallizing proteins. Bushings for better manual dispensing. J. Appl. Crystallogr. 2014, 47, 1804–1806. [Google Scholar] [CrossRef] [PubMed]
  53. Caffrey, M.; Cherezov, V. Crystallizing membrane proteins using lipidic mesophases. Nat. Protoc. 2009, 4, 706–731. [Google Scholar] [CrossRef] [PubMed] [Green Version]
  54. Li, Z.; Tang, Y.; Li, D. In Meso Crystallization of the Integral Membrane Glycerol 3-Phosphate Acyltransferase with Substrates. Cryst. Growth Des. 2018, 18, 2243–2258. [Google Scholar] [CrossRef]
  55. Li, D.; Boland, C.; Walsh, K.; Caffrey, M. Use of a Robot for High-throughput Crystallization of Membrane Proteins in Lipidic Mesophases. J. Vis. Exp. 2012, 67, e4000. [Google Scholar] [CrossRef] [PubMed]
  56. Li, D.; Boland, C.; Aragao, D.; Walsh, K.; Caffrey, M. Harvesting and Cryo-cooling Crystals of Membrane Proteins Grown in Lipidic Mesophases for Structure Determination by Macromolecular Crystallography. J. Vis. Exp. 2012, 67, e4001. [Google Scholar] [CrossRef] [PubMed]
  57. Wang, Z.; Pan, Q.; Yang, L.; Zhou, H.; Xu, C.; Yu, F.; Wang, Q.; Huang, S.; He, J. Automatic crystal centring procedure at the SSRF macromolecular crystallography beamline. J. Synchrotron Radiat. 2016, 23, 1323–1332. [Google Scholar] [CrossRef]
  58. Zhang, W.-Z.; Tang, J.-C.; Wang, S.-S.; Wang, Z.-J.; Qin, W.-M.; He, J.-H. The protein complex crystallography beamline (BL19U1) at the Shanghai Synchrotron Radiation Facility. Nucl. Sci. Technol. 2019, 30, 170. [Google Scholar] [CrossRef]
  59. Otwinowski, Z.; Minor, W. Processing of X-ray Diffraction Data Collected in Oscillation Mode. In Methods Enzymol; Academic Press: Cambridge, MA, USA, 1997; Volume 276, pp. 307–326. [Google Scholar]
  60. Sheldrick, G.M. Experimental phasing with SHELXC/D/E: Combining chain tracing with density modification. Acta Crystallogr. D 2010, 66, 479–485. [Google Scholar] [CrossRef] [Green Version]
  61. Cowtan, K. The Buccaneer software for automated model building. 1. Tracing protein chains. Acta Crystallogr. D 2006, 62, 1002–1011. [Google Scholar] [CrossRef] [Green Version]
  62. Potterton, L.; Agirre, J.; Ballard, C.; Cowtan, K.; Dodson, E.; Evans, P.R.; Jenkins, H.T.; Keegan, R.; Krissinel, E.; Stevenson, K.; et al. CCP4i2: The new graphical user interface to the CCP4 program suite. Acta Crystallogr. D 2018, 74, 68–84. [Google Scholar] [CrossRef] [Green Version]
  63. Emsley, P.; Lohkamp, B.; Scott, W.G.; Cowtan, K. Features and development of Coot. Acta Crystallogr. Sect. D Biol. Crystallogr. 2010, 66, 486–501. [Google Scholar] [CrossRef] [PubMed] [Green Version]
  64. PyMOL. The PyMOL Molecular Graphics System; DeLano Scientific: San Carlos, CA, USA, 2009. [Google Scholar]
  65. Cherezov, V.; Fersi, H.; Caffrey, M. Crystallization Screens: Compatibility with the Lipidic Cubic Phase for in Meso Crystal-lization of Membrane Proteins. Biophys. J. 2001, 81, 225–242. [Google Scholar] [CrossRef] [Green Version]
  66. Misquitta, Y.; Caffrey, M. Detergents destabilize the cubic phase of monoolein: Implications for membrane protein crystalli-zation. Biophys. J. 2003, 85, 3084–3096. [Google Scholar] [CrossRef] [Green Version]
  67. Ai, X.; Caffrey, M. Membrane Protein Crystallization in Lipidic Mesophases: Detergent Effects. Biophys. J. 2000, 79, 394–405. [Google Scholar] [CrossRef] [Green Version]
  68. Cherezov, V.; Clogston, J.; Misquitta, Y.; Abdel-Gawad, W.; Caffrey, M. Membrane Protein Crystallization in Meso: Lipid Type-Tailoring of the Cubic Phase. Biophys. J. 2002, 83, 3393–3407. [Google Scholar] [CrossRef] [Green Version]
  69. Cherezov, V.; Clogston, J.; Papiz, M.Z.; Caffrey, M. Room to Move: Crystallizing Membrane Proteins in Swollen Lipidic Mesophases. J. Mol. Biol. 2006, 357, 1605–1618. [Google Scholar] [CrossRef]
  70. Levin, E.J.; Cao, Y.; Enkavi, G.; Quick, M.; Pan, Y.; Tajkhorshid, E.; Zhou, M. Structure and permeation mechanism of a mammalian urea transporter. Proc. Natl. Acad. Sci. USA 2012, 109, 11194–11199. [Google Scholar] [CrossRef] [Green Version]
  71. Strub, M.-P.; Hoh, F.; Sanchez, J.-F.; Strub, J.-M.; Böck, A.; Aumelas, A.; Dumas, C. Selenomethionine and Selenocysteine Double Labeling Strategy for Crystallographic Phasing. Structure 2003, 11, 1359–1367. [Google Scholar] [CrossRef] [Green Version]
  72. Li, D.; Lee, J.; Caffrey, M. Crystallizing Membrane Proteins in Lipidic Mesophases. A Host Lipid Screen. Cryst. Growth Des. 2011, 11, 530–537. [Google Scholar] [CrossRef] [Green Version]
  73. Li, D.; Howe, N.; Dukkipati, A.; Shah, S.T.; Bax, B.D.; Edge, C.; Bridges, A.; Hardwicke, P.; Singh, O.M.; Giblin, G.; et al. Crystallizing Membrane Proteins in the Lipidic Mesophase. Experience with Human Prostaglandin E2 Synthase 1 and an Evolving Strategy. Cryst. Growth Des. 2014, 14, 2034–2047. [Google Scholar] [CrossRef] [PubMed]
  74. Li, D.; Shah, S.T.; Caffrey, M. Host Lipid and Temperature as Important Screening Variables for Crystallizing Integral Membrane Proteins in Lipidic Mesophases. Trials with Diacylglycerol Kinase. Cryst. Growth Des. 2013, 13, 2846–2857. [Google Scholar] [CrossRef] [PubMed] [Green Version]
  75. Liu, W.; Hanson, M.A.; Stevens, R.C.; Cherezov, V. LCP-Tm: An assay to measure and understand stability of membrane proteins in a membrane environment. Biophys. J. 2010, 98, 1539–1548. [Google Scholar] [CrossRef] [PubMed] [Green Version]
  76. Cherezov, V.; Liu, J.; Griffith, M.; Hanson, M.A.; Stevens, R.C. LCP-FRAP Assay for Pre-Screening Membrane Proteins for in Meso Crystallization. Cryst. Growth Des. 2008, 8, 4307–4315. [Google Scholar] [CrossRef] [Green Version]
  77. Cherezov, V.; Abola, E.; Stevens, R.C. Recent progress in the structure determination of GPCRs, a membrane protein family with high potential as pharmaceutical targets. Methods Mol. Biol. 2010, 654, 141–168. [Google Scholar] [CrossRef] [Green Version]
  78. Magnani, F.; Serrano-Vega, M.J.; Shibata, Y.; Abdul-Hussein, S.; Lebon, G.; Miller-Gallacher, J.; Singhal, A.; Strege, A.; Thomas, J.A.; Tate, C.G. A mutagenesis and screening strategy to generate optimally thermostabilized membrane proteins for structural studies. Nat. Protoc. 2016, 11, 1554–1571. [Google Scholar] [CrossRef] [Green Version]
  79. Yamamoto, M.; Hirata, K.; Yamashita, K.; Hasegawa, K.; Ueno, G.; Ago, H.; Kumasaka, T. Protein microcrystallography using synchrotron radiation. IUCrJ 2017, 4, 529–539. [Google Scholar] [CrossRef]
  80. Mehrabi, P.; Bücker, R.; Bourenkov, G.; Ginn, H.M.; von Stetten, D.; Müller-Werkmeister, H.M.; Kuo, A.; Morizumi, T.; Eger, B.T.; Ou, W.L.; et al. Oghbaey S, Sarracini A, Besaw JE, Pare-Labrosse O, Meier S, Schikora H, Tellkamp F, Marx A. Serial femtosecond and serial synchrotron crystallography can yield data of equivalent quality: A systematic comparison. Sci. Adv. 2021, 7, eabf1380. [Google Scholar] [CrossRef]
  81. Li, D.; Stansfeld, P.J.; Sansom, M.S.P.; Keogh, A.; Vogeley, L.; Howe, N.; Lyons, J.A.; Aragao, D.; Fromme, P.; Fromme, R.; et al. Ternary structure reveals mechanism of a membrane diacylglycerol kinase. Nat. Commun. 2015, 6, 10140. [Google Scholar] [CrossRef] [Green Version]
  82. Zhu, P.; Yu, X.; Wang, C.; Zhang, Q.; Liu, W.; McSweeney, S.; Shanklin, J.; Lam, E.; Liu, Q. Structural basis for Ca2+-dependent activation of a plant metacaspase. Nat. Commun. 2020, 11, 2249. [Google Scholar] [CrossRef]
  83. McCoy, A.J.; Read, R.J. Experimental phasing: Best practice and pitfalls. Acta Crystallogr. D 2010, 66, 458–469. [Google Scholar] [CrossRef] [PubMed] [Green Version]
Figure 2. Both the Lipid cubic phase and PlsY crystals tolerated Se-urea soaking. (A) An LCP crystallization well containing 50 nL of LCP covered with 800 nL of precipitant solution. The well was cut open and Se-urea speckles were added. Various components are indicated by arrows. (B) The well after 5 min soaking. The red arrow indicates a typical crystal visible under partially polarized light. (C) The well after 22 min of soaking. The Se-urea was completely dissolved. The expanded view shows that the crystals were still intact. (D) The well after opening. (E) Crystals remained intact and showed birefringence under partially polarized light. By contrast, the bulk mesophase did not show birefringence, a ‘finger-print’ characteristic for the lamellar phase. The brightness and contrast of images in (B,E) were adjusted as a whole to help visualize the crystals.
Crystals 12 00976 g002
Figure 3. Selenourea-mediated Se-SAD phasing of lysozyme using crystals growing in the lipid cubic phase. (A) Lysozyme crystals grown in LCP. (B) Chi2 and Rmerge versus resolution range obtained from HKL2000. Blue, Chi2 anomalous; orange, Chi2 all; red, Rmerge anomalous; green, Rmerge all. (C) Anomalous signal <d”/sig> versus resolution estimated by SHELXC. (D) CCall and CCweak values obtained from SHELXD for Se atoms. (E) The occupancy of each site found by SHELXD. (F) The poly-Ala model of lysozyme traced by SHELXE. Se atoms are presented as magenta spheres.
Crystals 12 00976 g003
Figure 4. Lysozyme crystal contains six selenourea binding sites. (A) The distribution of Se-urea binding sites. The lysozyme structure is shown as cartoon representations and Se-urea molecules are shown as sticks with green carbon atoms. Magenta meshes represent the anomalous selenium density maps contoured at 4.0 σ level. Brackets indicate occupancies. (BF) Detailed interactions for SiteA–F (SASF). Blue meshes represent 2FoFc density maps for Se-urea at a contour level of 1.0 σ. Interacting residues are shown as sticks with yellow carbon atoms for residues within the monomer, or with grey carbon atoms for residues from crystallographic symmetry mates. Dashed lines indicate H-bonding with distances shown in Å. Distances are omitted for the amine groups that did not show clear densities. Dash coloring is explained in the box in (F): black, interactions involving mainchain groups; red, interactions involving sidechain groups; cyan, interactions between bridging waters and protein residues; green, interactions between Se-urea molecules. A prime symbol labels amino acids from symmetry mates. We would note that, although the position of the Se atom was supported by the anomalous map, the position of the two amine groups was less certain and they were built with 2FoFc density maps at a contour level of 0.6–0.7 σ. In (BF), occupancies of the sites are indicated in brackets. Water molecules are shown as red spheres. (G) Comparison of Se-urea binding sites in lysozyme crystals grown in LCP (white ribbon for protein and black sphere for Se) and those in solution (yellow ribbon for protein and orange sphere for Se) (PDB ID 5T3F) [39]. Blue, overlapping sites (SA/SB/SC/SF); green, symmetric equivalent sites (SE/Siii); black, the site unique to the LCP structure (SD); red, sites unique to the solution structure (Si/Sii/Siv/Sv).
Crystals 12 00976 g004
Figure 5. Selenourea-mediated Se-SAD phasing using lipid cubic phase crystals of the membrane enzyme PlsY. (A) The crystal used for Se-urea soaking and structure determination. (B) Chi2 and Rmerge verse resolution range obtained from HKL2000. (C) Anomalous signal <d”/sig> versus resolution estimated from SHELXC. (D) CCall and CCweak values obtained from SHELXD for Se atoms. (E) The occupancy of each site found by SHELXD. (F) The poly-Ala model of PlsY traced by SHELXE. Se atoms are presented as magenta spheres.
Crystals 12 00976 g005
Figure 6. Se-urea binding sites in the membrane enzyme PlsY. (A) Fifteen Se-urea molecules bound to two NCS monomers (blue and grey cartoon). Monomer A contains eight sites (S1S8) and monomer B contains seven (S1′S7′). Sticks with green carbon atoms indicate Se-urea molecules. Magenta meshes represent anomalous maps for selenium contoured at 4.0 σ. Brackets indicate occupancies. (B) Se-urea binds to PlsY at the extramembrane region. Only the NCS monomer A is shown because sites S1S7 are very similar to their NCS pairs S1′S7′. Two horizontal lines define the membrane boundary. No binding sites are present in the transmembrane domain (TMD). (CI) Detailed interaction for S1S8. Because S1′S7′ are very similar to their NCS pairs S1S7, they are omitted, except for S3′, which showed a different binding mode as for S3 (E). Blue meshes represent 2FoFc density maps for Se-urea at a contour level of 1.0 σ. Water molecules are shown as red spheres. Dash lines indicate H-bonds with distances shown in Å. Dash coloring is explained in the box in (C): black, interactions involving mainchain groups; red, interactions involving sidechain groups; cyan, interactions between bridging water molecules and protein residues; green, interactions between Se-urea and other ligands. Residues from monomer A are shown as sticks with yellow carbon and labeled with residue numbers. Residues from monomer B are shown as sticks with grey carbon and labeled with residue number plus the chain ID. Residues from adjacent crystal packing residues are shown as sticks with grey carbon atoms and labeled with a prime. We would note that, although the position of the Se atom was supported by the anomalous map, the position of one or both amine groups for S2, S3′, S4, S5, and S6 were less certain and they were built with 2FoFc density maps at a contour level of 0.6–0.7 σ.
Crystals 12 00976 g006
Figure 7. Twinning analysis and refinement of PlsY crystal structure. (A) Anomalous signal in C2221 space group. (B) Sub-structure location in C2221 space group. (C) Final structure in C2221 space group with one monomer in the asymmetric unit. The Val197 in green clashed with a symmetry-related Val197 in purple. (D) L-test in P21 space group. (E) H-test in P21 space group. (F) Final structure in P21 space group with two monomers in an asymmetric unit. The C-terminal of one monomer shown as green sticks had the same conformation in the C2221 space group, while the other asymmetric C-terminal shown as purple sticks had different conformations. Grey meshes represent the 2FoFc map at the 1.0 σ level.
Crystals 12 00976 g007
Table 1. Statistics for data collection and refinement of lysozyme and PlsY bound with Se-urea.
Lysozyme + Se-UreaPlsY + Se-Urea
Data collection
Space groupP43212P21
Cell dimensions
a, b, c (Å)78.73, 78.73, 37.2457.88, 89.99, 53.98
α, β, γ (°)90, 90, 9090, 95.19, 90
Wavelength (Å)0.979150.97907
Resolution (Å)50.00–1.71 (1.77–1.71)50.00–1.80 (1.86–1.80) a
Rmerge0.072 (0.487)0.094 (0.973)
Rpim0.014 (0.097)0.039 (0.400)
<I/σ(I)>51.3 (8.0)18.6 (1.7)
Completeness (%)99.5 (100.0)99.6 (100.0)
Multiplicity25.5 (25.7)6.7 (6.8)
CC1/20.999 (0.974)1.000 (0.687)
Refinement
Resolution (Å)33.66–1.7136.37–1.80
No. reflections12,45442,088
Rwork/Rfree0.1704/0.19880.1564/0.1902
No. atoms11563687
Protein10093070
Ligand/ion30497
Water117120
No. residues129400
B-factors (Å2)22.8326.93
Protein21.4122.98
Ligand/ion35.8950.39
Water31.6830.80
R.m.s deviations
Bond lengths (Å)0.0100.010
Bond angles (°)1.6161.452
Ramachandran
Favoured (%)98.4398.74
Allowed (%)1.571.26
Outlier (%)00
PDB ID7CQO7CQM
a Highest resolution shell is shown in parenthesis.
Publisher’s Note: MDPI stays neutral with regard to jurisdictional claims in published maps and institutional affiliations.

