Article

Stability and Rupture of Liquid Crystal Bridges under Microgravity

1
Institute of Physics, Otto von Guericke University Magdeburg, Universitätsplatz 2, D-39106 Magdeburg, Germany
2
MARS, Otto von Guericke University Magdeburg, Universitätsplatz 2, D-39106 Magdeburg, Germany
3
Department of Engineering, Brandenburg University of Applied Sciences, Magdeburger Straße 50, D-14770 Brandenburg an der Havel, Germany
*
Author to whom correspondence should be addressed.
Crystals 2022, 12(8), 1092; https://doi.org/10.3390/cryst12081092
Submission received: 30 June 2022 / Revised: 21 July 2022 / Accepted: 25 July 2022 / Published: 4 August 2022
(This article belongs to the Special Issue Smectic Liquid Crystals)

Abstract

:
Liquid-crystal columns were prepared and observed under microgravity aboard suborbital TEXUS rocket flights. The microgravity phase of each flight lasted for approximately six minutes. We tested structures in different liquid-crystalline mesophases. In the isotropic and nematic phases, the Rayleigh-Plateau instability led to the collapse of the columns. However, in the smectic A and C mesophases, it was found that the columns survived the extension to slenderness ratios (length/diameter) of over 4.5 (and in one case, more than 6). The liquid-crystalline material in the millimeter-sized columns was macroscopically disordered. Thus, regular shell-like internal layer structures that stabilized the columns can be excluded. Instead, the reason for their persistence was the yield stress of the material, which is quite different for the different mesophases. In the columnar mesophase, the cylindrical bridge even survived the strong deceleration when the rocket re-entered the atmosphere. During the breakup of the filaments, the neck thinning dynamics were determined.

1. Introduction

Bridges of a liquid are narrow channels that connect two solid supports or liquid reservoirs. They are surrounded by another fluid. In the absence of external forces, they usually have axially symmetrical shapes. A special case that has a particularly simple geometry is that of liquid cylinders that span between two lateral supports. These bridges are only stable when their slenderness ratio α = L / D (the axial extension L divided by the diameter D) is below a critical value α c . This was previously described by Joseph Plateau in the mid-19th century [1]. He pursued earlier ideas of Felix Savart [2]. He found in experiments a critical slenderness ratio very close to the value π , which he had derived from a theoretical analysis. Rayleigh described the decomposition of jets into droplets by this instability [3,4]. A liquid cylinder with a constant volume and length can reduce its surface area by a variation of its radius when the slenderness ratio is larger than α c (Rayleigh-Plateau limit, RP); thus, the surface tension drives the decomposition of elongated liquid bridges. This process is now called the Rayleigh-Plateau instability and the collapse of bridges above the stability limit has been studied in experiments (e.g., [5,6,7]) and numerical simulations (e.g., [8,9]).
When liquid bridges are prepared under normal gravity conditions, their stability is influenced not only by the surface tension but also by additional forces that are caused by the weight of the liquid [10,11,12,13]. They lead to a further destabilization of liquid bridges below the critical slenderness ratio. There are several ways to compensate for these gravitational forces. Firstly, a density-matched immersion fluid can be used around the bridge to compensate for these forces with buoyancy [14,15,16,17]. The second option is the exploitation of microgravity platforms, such as suborbital rockets, space shuttles or the ISS, which provide different experiment times and different levels of microgravity [18]. Langbein et al. [19,20] studied oscillations in liquid columns during the D-2 Spacelab mission. Martinez et al. [21,22] performed experiments on liquid columns onboard a TEXUS rocket (TEXUS 33), during which a controlled gravity offset was generated to test the stability of the bridges. DiLisi et al. [23] conducted experiments on parabolic flights under varying microgravity conditions and established a relationship between the bond number and the slenderness ratio α at the point of collapse of the liquid bridges. The third option is the application of magnetic field gradients to compensate for the weight of vertical liquid bridges [24].
Some complex liquids can form filaments with slenderness ratios that are well above α c = π . Liquid-crystalline order can support the stability of these structures. While nematic fibers experience a similar instability as those formed by isotropic liquids [25] with practically the same critical slenderness ratio, several experiments have proven the existence of thin stable filaments in higher-ordered liquid-crystalline phases, particularly in the smectic liquid-crystalline phases of so-called bent-core mesogens [26,27,28,29,30,31,32,33,34]. The fluid inside these mesogenic filaments is characterized by a molecular layer structure that stabilizes thin fibers with micrometer-sized diameters and lengths of up to the millimeter range [26]. Figure 1 shows this arrangement. The wrapped layer structure, in turn, is induced or stabilized by the surface alignment of the mesogens. These filaments are small enough to neglect their weight with respect to the forces that are related to the surface tension. The bond number B o = ρ g r 2 / σ (where r is the filament radius, ρ is the mass density, g is the gravitational acceleration and σ is the surface tension) is of the order of only 10 2 , even when such thin filaments are in air.
Long stable filaments can also be observed in columnar liquid-crystal phases [35,36]. Again, their stabilization requires the existence of a well-ordered internal structure. As a consequence, the diameter of such filaments is restricted to a few hundred smectic layers, but bundles of filaments may reach thicknesses of up to hundreds of micrometers. Thicker filaments usually contain multiple defects and a disordered layer arrangement, so the stabilizing effect of the molecular layers is lost.
A special type of stable filaments are smectic A structures that form in the isotropic melt of the same material [37,38,39,40]. Such filaments are observed in binary mixtures of certain smectogens with dodecyl alcohol.
Several studies have been devoted to investigating the stability of macroscopic liquid-crystal cylindrical bridges (i.e., those with thicknesses of millimeters). These bridges are completely different from microscopic filaments as they do not contain well-ordered internal layer arrangements. During the preparation of these structures, multi-domain bulk samples are formed. For macroscopic bridges that are in the millimeter range and above, gravitational forces can no longer be neglected with respect to the surface tension. Thus, experiments on these bridges need to be performed under particular conditions. Mahajan et al. [17] placed the columns in a nearly neutrally buoyant environment. The columns were drawn from the commercial smectic material octyl cyanobiphenyl (8CB) in water (H 2 O) and mixtures of H 2 O and deuterated water (D 2 O). The density mismatch between the liquid-crystal columns and the embedding liquid was controlled by the titration of heavy water into the pure H 2 O. Since the smectic material had a density that was slightly lower than that of H 2 O, a certain deformation of the cylinder structures was reported in all experiments. In the nematic phase, the critical slenderness ratio was found to be close to that of an isotropic fluid, but in the smectic A phase, a stable cylindrical bridge with a slenderness ratio α of approximately 3.88 was reported. The authors could exclude that this stabilization was related to a well-ordered internal structure and instead attributed it to a certain yield stress. The density mismatch at the point of collapse of the bridge was used to calculate the yield stress, which was found to be about 1.7 × 10 3 N/m.
The purpose of the present study was to investigate macroscopic liquid-crystalline columns in different mesophases under microgravity conditions. Four different materials were employed to prepare columns of variable lengths. We observed the stability of the bridges and recorded their collapse dynamics in order to demonstrate the role of mesogen structures in the macroscopic stability of the bridges. The microgravity platforms chosen for our experiments were two suborbital rocket flights.
One of the aspects of this study was a description of the rupture process of the liquid-crystal columns. For isotropic liquids, there is a broad range of literature that has described the breakup of liquid columns or jets. A review of this phenomenon has been provided by, e.g., Eggers and Villermaux [41]. In particular, the decomposition of long fluid filaments has been studied experimentally by Tjahjadi et al. [5]. Schulkes [8] investigated the decomposition of columns of finite length and an aspect ratio of 3. In that work, a vertical force was considered in the axial direction, corresponding to a non-zero bond number. A dimensional analysis was used to predict the scaling of the minimum bridge diameter D min with τ 0.66 , where τ is the time until breakup [42,43]. Chen [44] reported experiments and numerical results for droplet pinch-off under gravitational forces and compared the results to the predicted scaling law. Li and Sprittles [9] discussed the distinction between two separate regimes using the Ohnesorge number, which compares the viscous length scale to the dimensions of the system.
The breakup of liquid-crystalline bridges has been investigated in a few previous publications. Verhoeff and Lekkerkerker compared the behavior of lyotropic bridges of gibbsite suspensions [45]. They found that the neck thinning crucially depends on the internal structure of the nematic bridges, which is determined by the director anchoring at the nematic–isotropic interfaces and the splay elastic constant. These parameters played a role in that study because the structures were much thinner than the bridges described in our paper. Porter et al. [46] investigated bridges in the isotropic, nematic and smectic phases and found a single exponent power law τ γ in the isotropic and smectic phases, which was contrasted by two exponents in nematic bridges. These start to pinch-off with large exponents ( γ > 1 ) and undergo a transition to lower exponents ( γ 0.66 ) during a sub-millisecond interval before the breakup. Within this interval, the neck widths were in the range of a few micrometers, a length scale where one may expect flow alignment in the waist region. Savage et al. [47] compared lyotropic lamellar bridges and thermotropic smectic bridges. In the smectic material, γ was found to be approximately 0.6 when the samples did not receive special treatment before the pinch-off. However, pre-shearing (twisting) the bridges before the breakup changed this situation and the thinning showed considerable deviations from a power law scaling.
We note that in most of the experiments that focused on breakup dynamics, cameras with frame rates of more than 10,000 fps were employed. The details of the final period immediately before the breakup that were reported in those studies were not accessible with the recording technique that was available in the present study onboard suborbital rockets.
A geometry of general interest is that of the breakup of nematic and isotropic bridges in thin cells during the heating or cooling of mesogenic samples across the nematic–isotropic transition [48,49]. During the growth of droplets in the emerging phase (immediately before their mutual coalescence), bridges in the evanescent phase are formed between them. In these structures, breakup is not necessarily related to a flow of the material out of the bridge, but rather to the melting or crystallization of material at the interface. Therefore, these bridges are less relevant within the context of the present report.

2. Setup and Materials

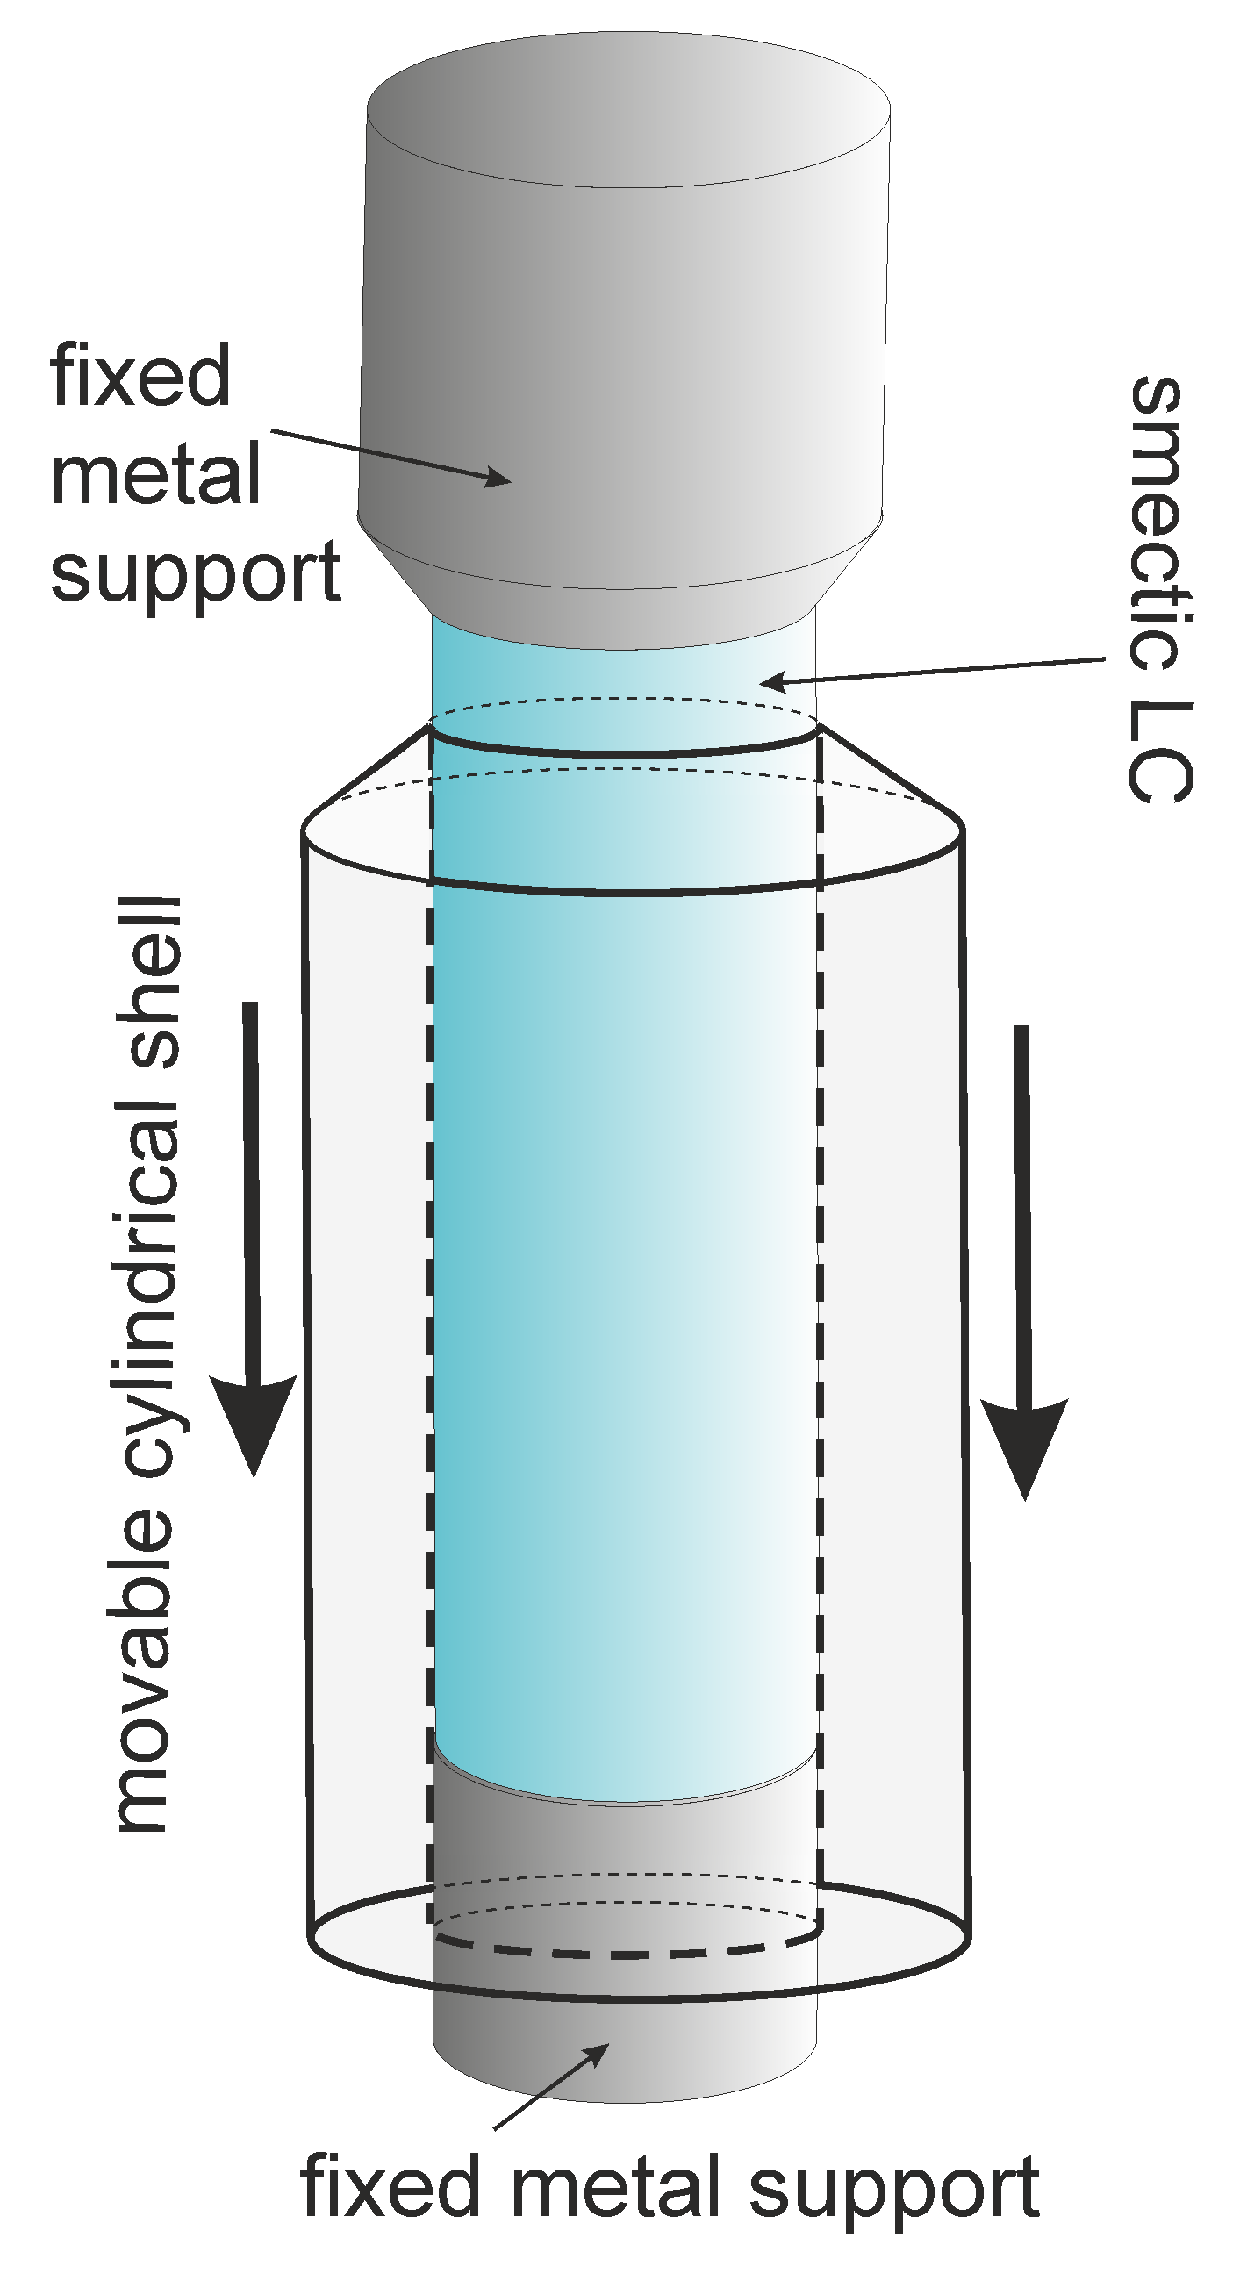
The experiments were performed using identical setups onboard two suborbital rocket flights: TEXUS 52, which was launched on 27 April 2015, and TEXUS 55, which was launched on 31 May 2018 from the Esrange Space Center near Kiruna, Sweden. Both rockets reached altitudes of approximately 260 km, which provided experiment times in microgravity of about 360 s in each flight. The experimental setup consisted of three chambers, which were thermostatted individually. Each chamber held two devices to draw the liquid or liquid-crystal columns, so six columns could be prepared during each flight. Figure 2 shows a sketch of one of those devices. Initially, before launch, the material was vacuum-filled into a movable cylindrical hull that had a fixed bottom, as sketched in the figure. The inner diameter of the hull was 3.0 mm. The top of this fluid cylinder was closed using a fixed metal cap, which served as the upper support for the emerging bridge. During the microgravity phase, the hull was slowly moved downward (with drawing speeds between 25 μ m/s and 120 μ m/s). Column pairs that shared the same chamber experienced the same temperature and drawing speed protocols. During the experiments, the columns were illuminated with uniform white light from a diffuse source. The images were captured at frame rates of 100 fps (TEXUS 52) and 50 fps (TEXUS 55) using one camera per chamber. The spatial resolution of the images was 25 μ m/pixel.
Table 1 lists the details of the 12 experiments, including the materials that were used, the temperatures in the chambers and the drawing protocols. The chemical compositions and phase sequences of the mesogens are presented in Table 2. All mesogenic materials were purchased from Synthon Chemicals.
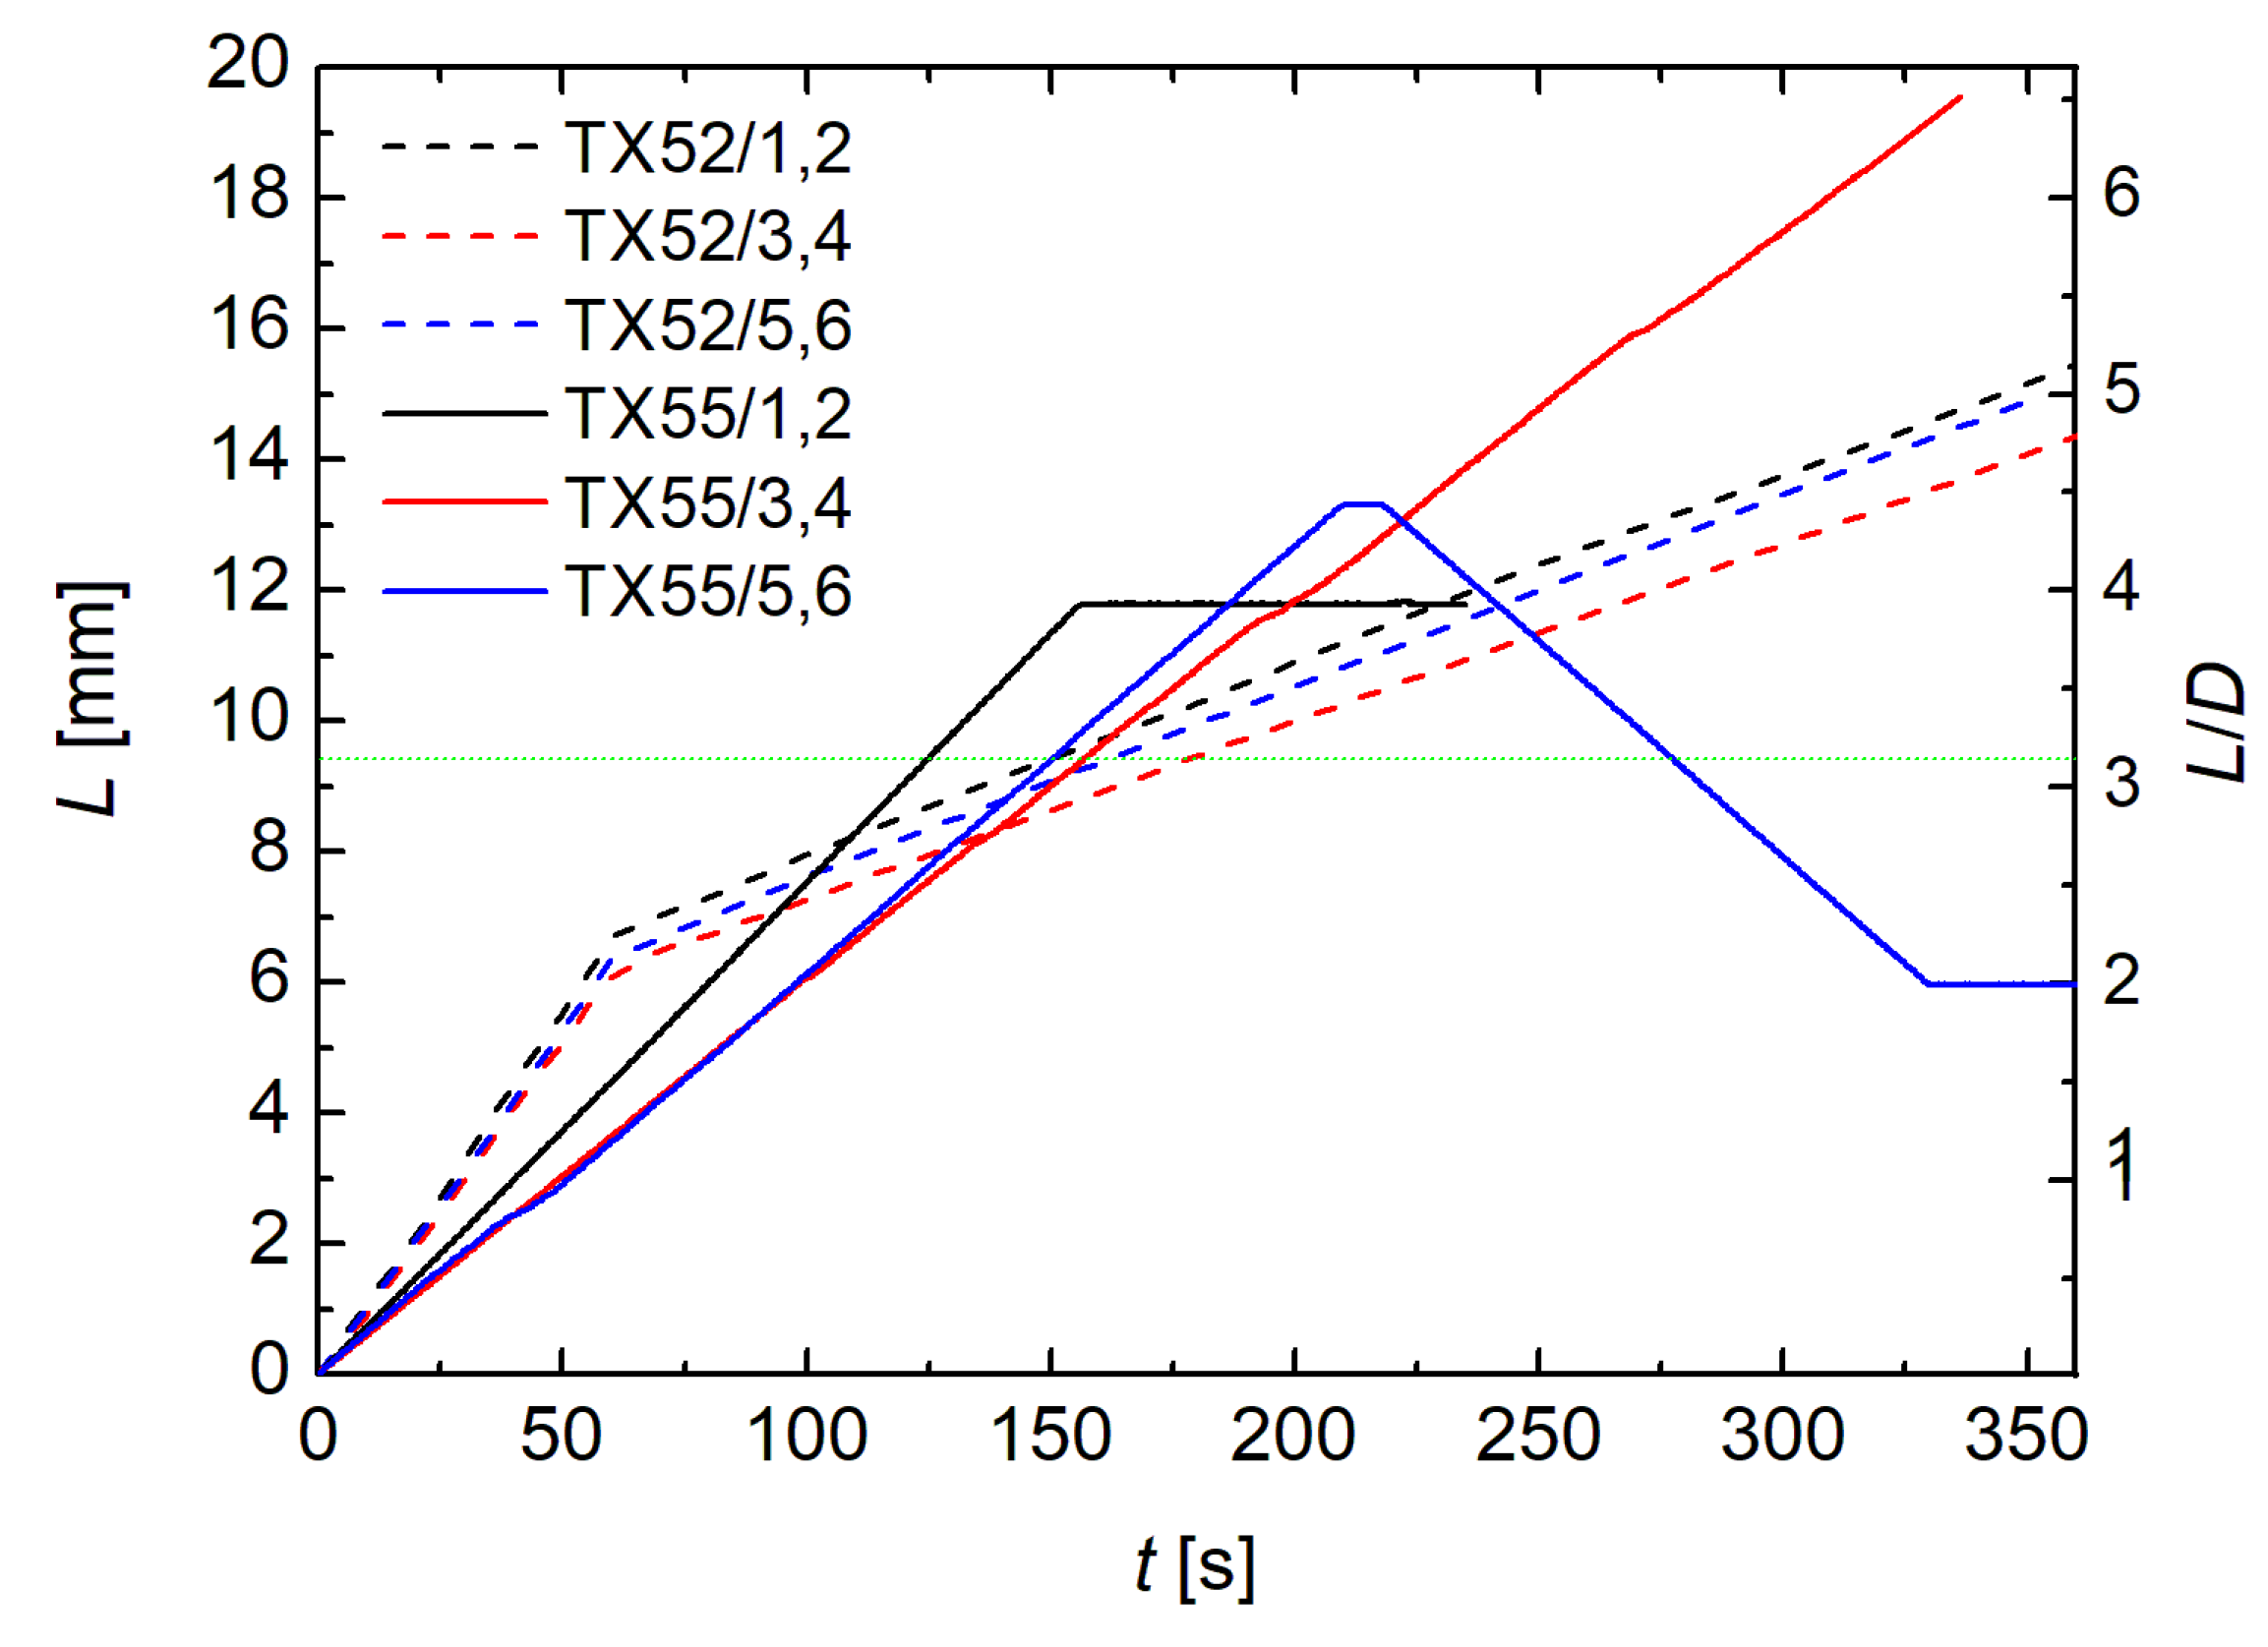
In one of the chambers onboard TEXUS 55 (TX55/1 and TX55/2), the temperature was initially kept constant at 46.5 °C for 150 s and then ramped up by +0.037 K/s to reach 53 °C by the end of the experiment. In all other experiments, the temperatures were kept fixed. The drawing protocols for the six chambers (three per flight) are shown in Figure 3. In the TX52 experiments, the columns were initially drawn quickly (100 μ m/s) until the aspect ratio reached about 0.7 α c . Thereafter, the drawing speed was lowered to 25 μ m/s. In the following TX55 experiments, uniform drawing speeds of between 50 μ m/s and 70 μ m/s were chosen.
The difference between our experiments and previous experiments (e.g., [17]) was that the complete columns were already present inside the hull at the start of the experiments in our study. There was no need to supply liquid-crystal material through an injection channel in one of the supports; thus, the material in the columns was free from flow when the columns were drawn.

3. Results

The 12 experiments were designed so that different liquid-crystalline phases of the same material could be compared, i.e. (TX52/1, TX52/3, TX52/5, TX55/4,6) in one set and (TX52/2, TX52/4, TX 55/1,2) in another set. Two additional materials were included for comparison. In three pairs of experiments, two materials in different mesophases were compared using the same temperature and drawing protocols: (TX52/3 and TX52/4), (TX55/3 and TX55/4), and (TX55/5 and TX55/6) In four of these 12 experiments, some unwanted complications affected the outcomes. In two experiments (TX52/3 and TX52/4), an annulus at the upper holder detached from the support and the columns were asymmetrically deformed from the beginning of the experiments. We use the terms “upper” and “lower” to refer to the fixed and moving supports of the columns for simplicity, even though in microgravity, there are strictly no upper or lower column ends. Of these two experiments, TX52/3 remained stable throughout the microgravity phase. In the experiment with the nematic material (TX52/5), the fluid wetted the hull and the column collapsed before reaching the critical length. In one experiment (TX55/2), an air bubble was present inside the smectic column, but this did not affect the stability.

3.1. Stability Limits

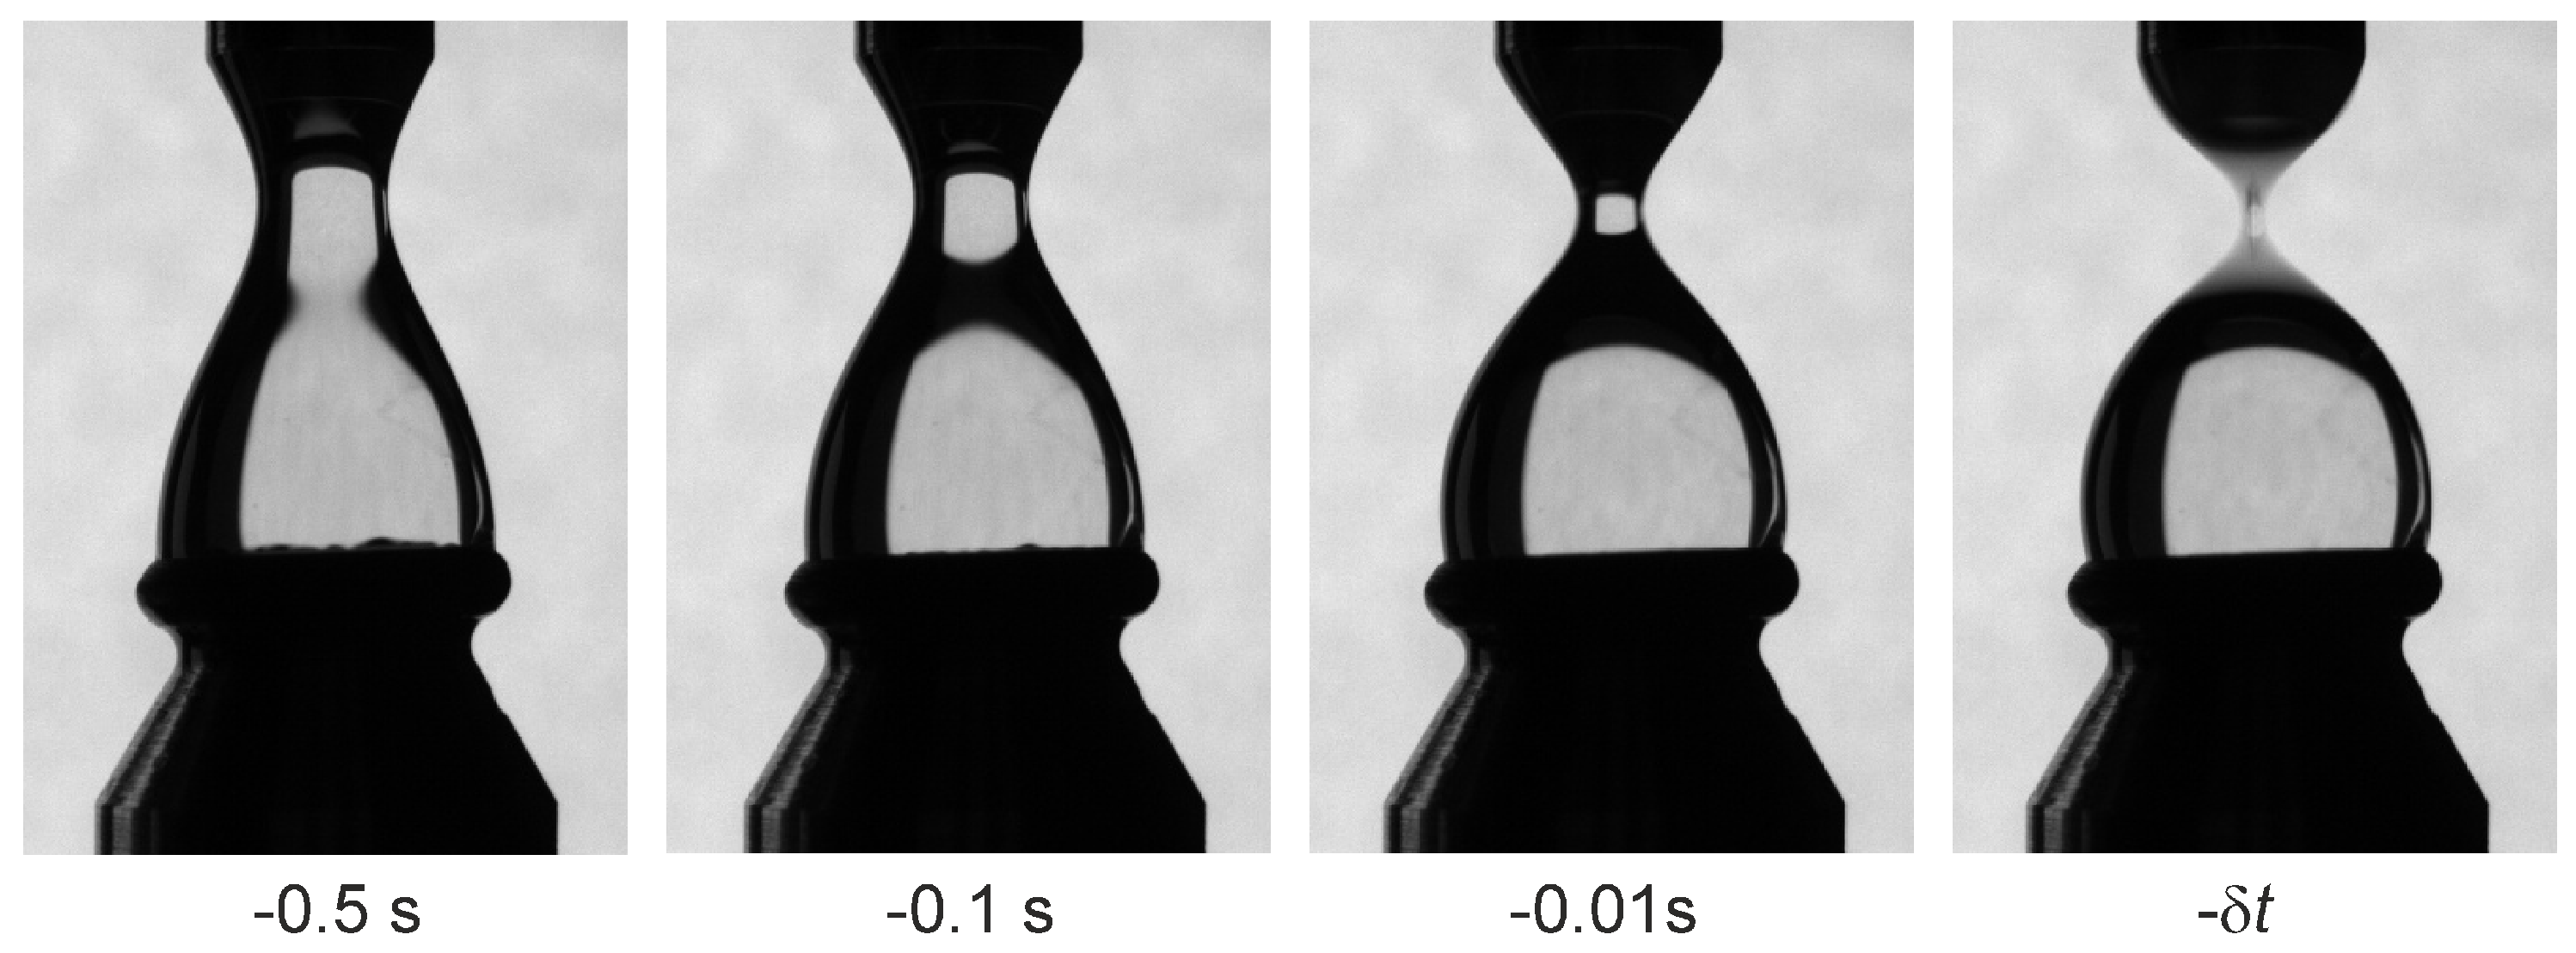
The column that was drawn in the isotropic phase (TX52/4) developed an axially symmetric deviation from the beginning of the experiment. The reason for this was a technical issue, which was related to the unintended detachment of a ring from the upper support. The column wetted this ring and consequently developed an instability [51] that led to the final pinch-off being at a length of 6.8 mm, which was long before the stability limit α c for a liquid cylinder was reached. Figure 4 shows snapshots that were taken 50.5 s, 0.5 s and less than 10 ms before the pinch-off. Bezdenejnykh and Meseguer provided the following stability limit for a bridge between two disks with a radius ratio of K and a bond number of zero:
α c = π 1 3 2 4 / 3 1 2 π 1 K 1 + K 2 / 3
For K = 1.5 , a value of α c = 2.6 is obtained. This value is 15% higher than the experimental value in TX52/4, which was in reasonable agreement with the predicted value.
The nematic column (TX52/5) was expected to have stability properties similar to the isotropic column, but because of the (unintended) wetting of the hull, the nematic column lost stability much faster than expected. It pinched off at a total length of about L 1.73 D. For the estimation of the stability threshold, this experiment was not useful; however, the observation of the pinch-off process itself was nevertheless instructive. Figure 5 shows the initially cylindrical nematic column at the start of the wetting process and the shape that was observed 0.25 s before the pinch-off. Here, a comparison to Equation (1) is not appropriate because the nematic material crept down the moving support. Note that the thin filament that formed before the breakup was nearly transparent. This was obviously caused by a flow-induced alignment of the nematic material near the neck. In a non-oriented column, the scattering at the inner domain boundaries causes the nematic column to appear dark in the transmitted light. When the material becomes uniformly aligned (with the director close to the axial orientation), the optical transmission noticeably increases.
The smectic A and C columns all survived their passage through the RP stability limit α c without noticeable changes in the radial shapes. The yield stress stabilized the cylindrical columns [17]. However, the 9CB column in SmA (TX52/2) developed an instability because the hull was slightly wetted by mesogenic material, so the base diameter of the column was about 10 % larger than the top diameter. The pinch-off finally took place at an extension of α 4.4 , which was reached 320 s after the start of the experiment.
The comparison with ground experiments under normal gravity with the same setup and materials clearly demonstrates the necessity of microgravity for the preparation of long, stable columns. The details of the ground experiments that were performed using the TX55 materials are presented in Appendix A. The bond number in these experiments was approximately 10. All of the bridges broke up at aspect ratios that were well below π .

3.2. Bending under Lateral Acceleration

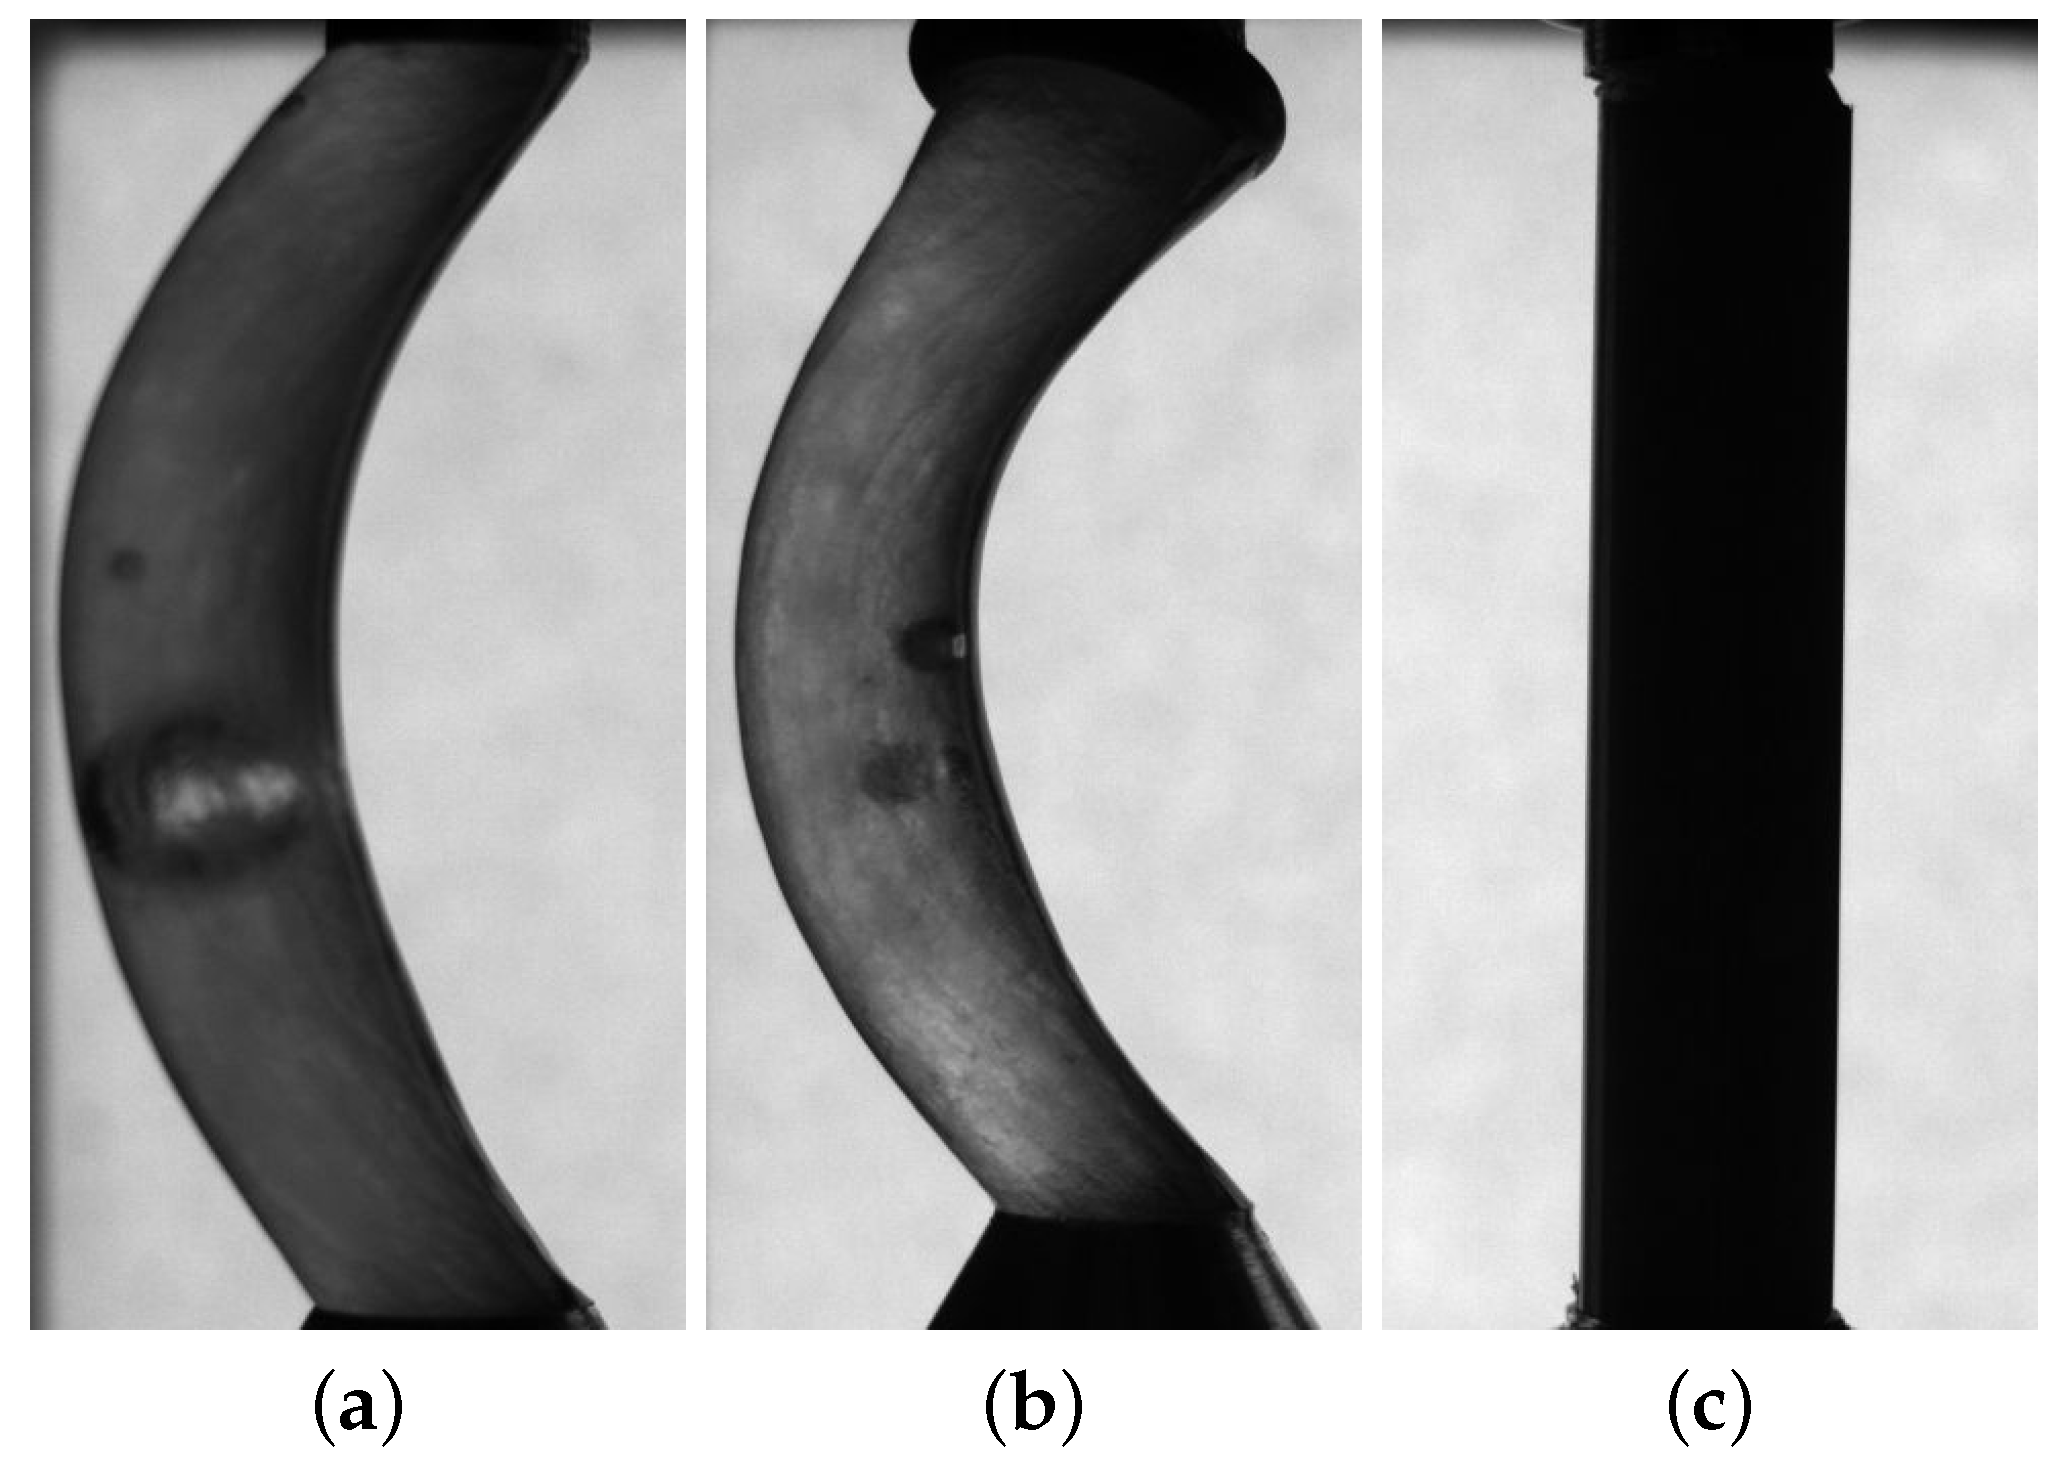
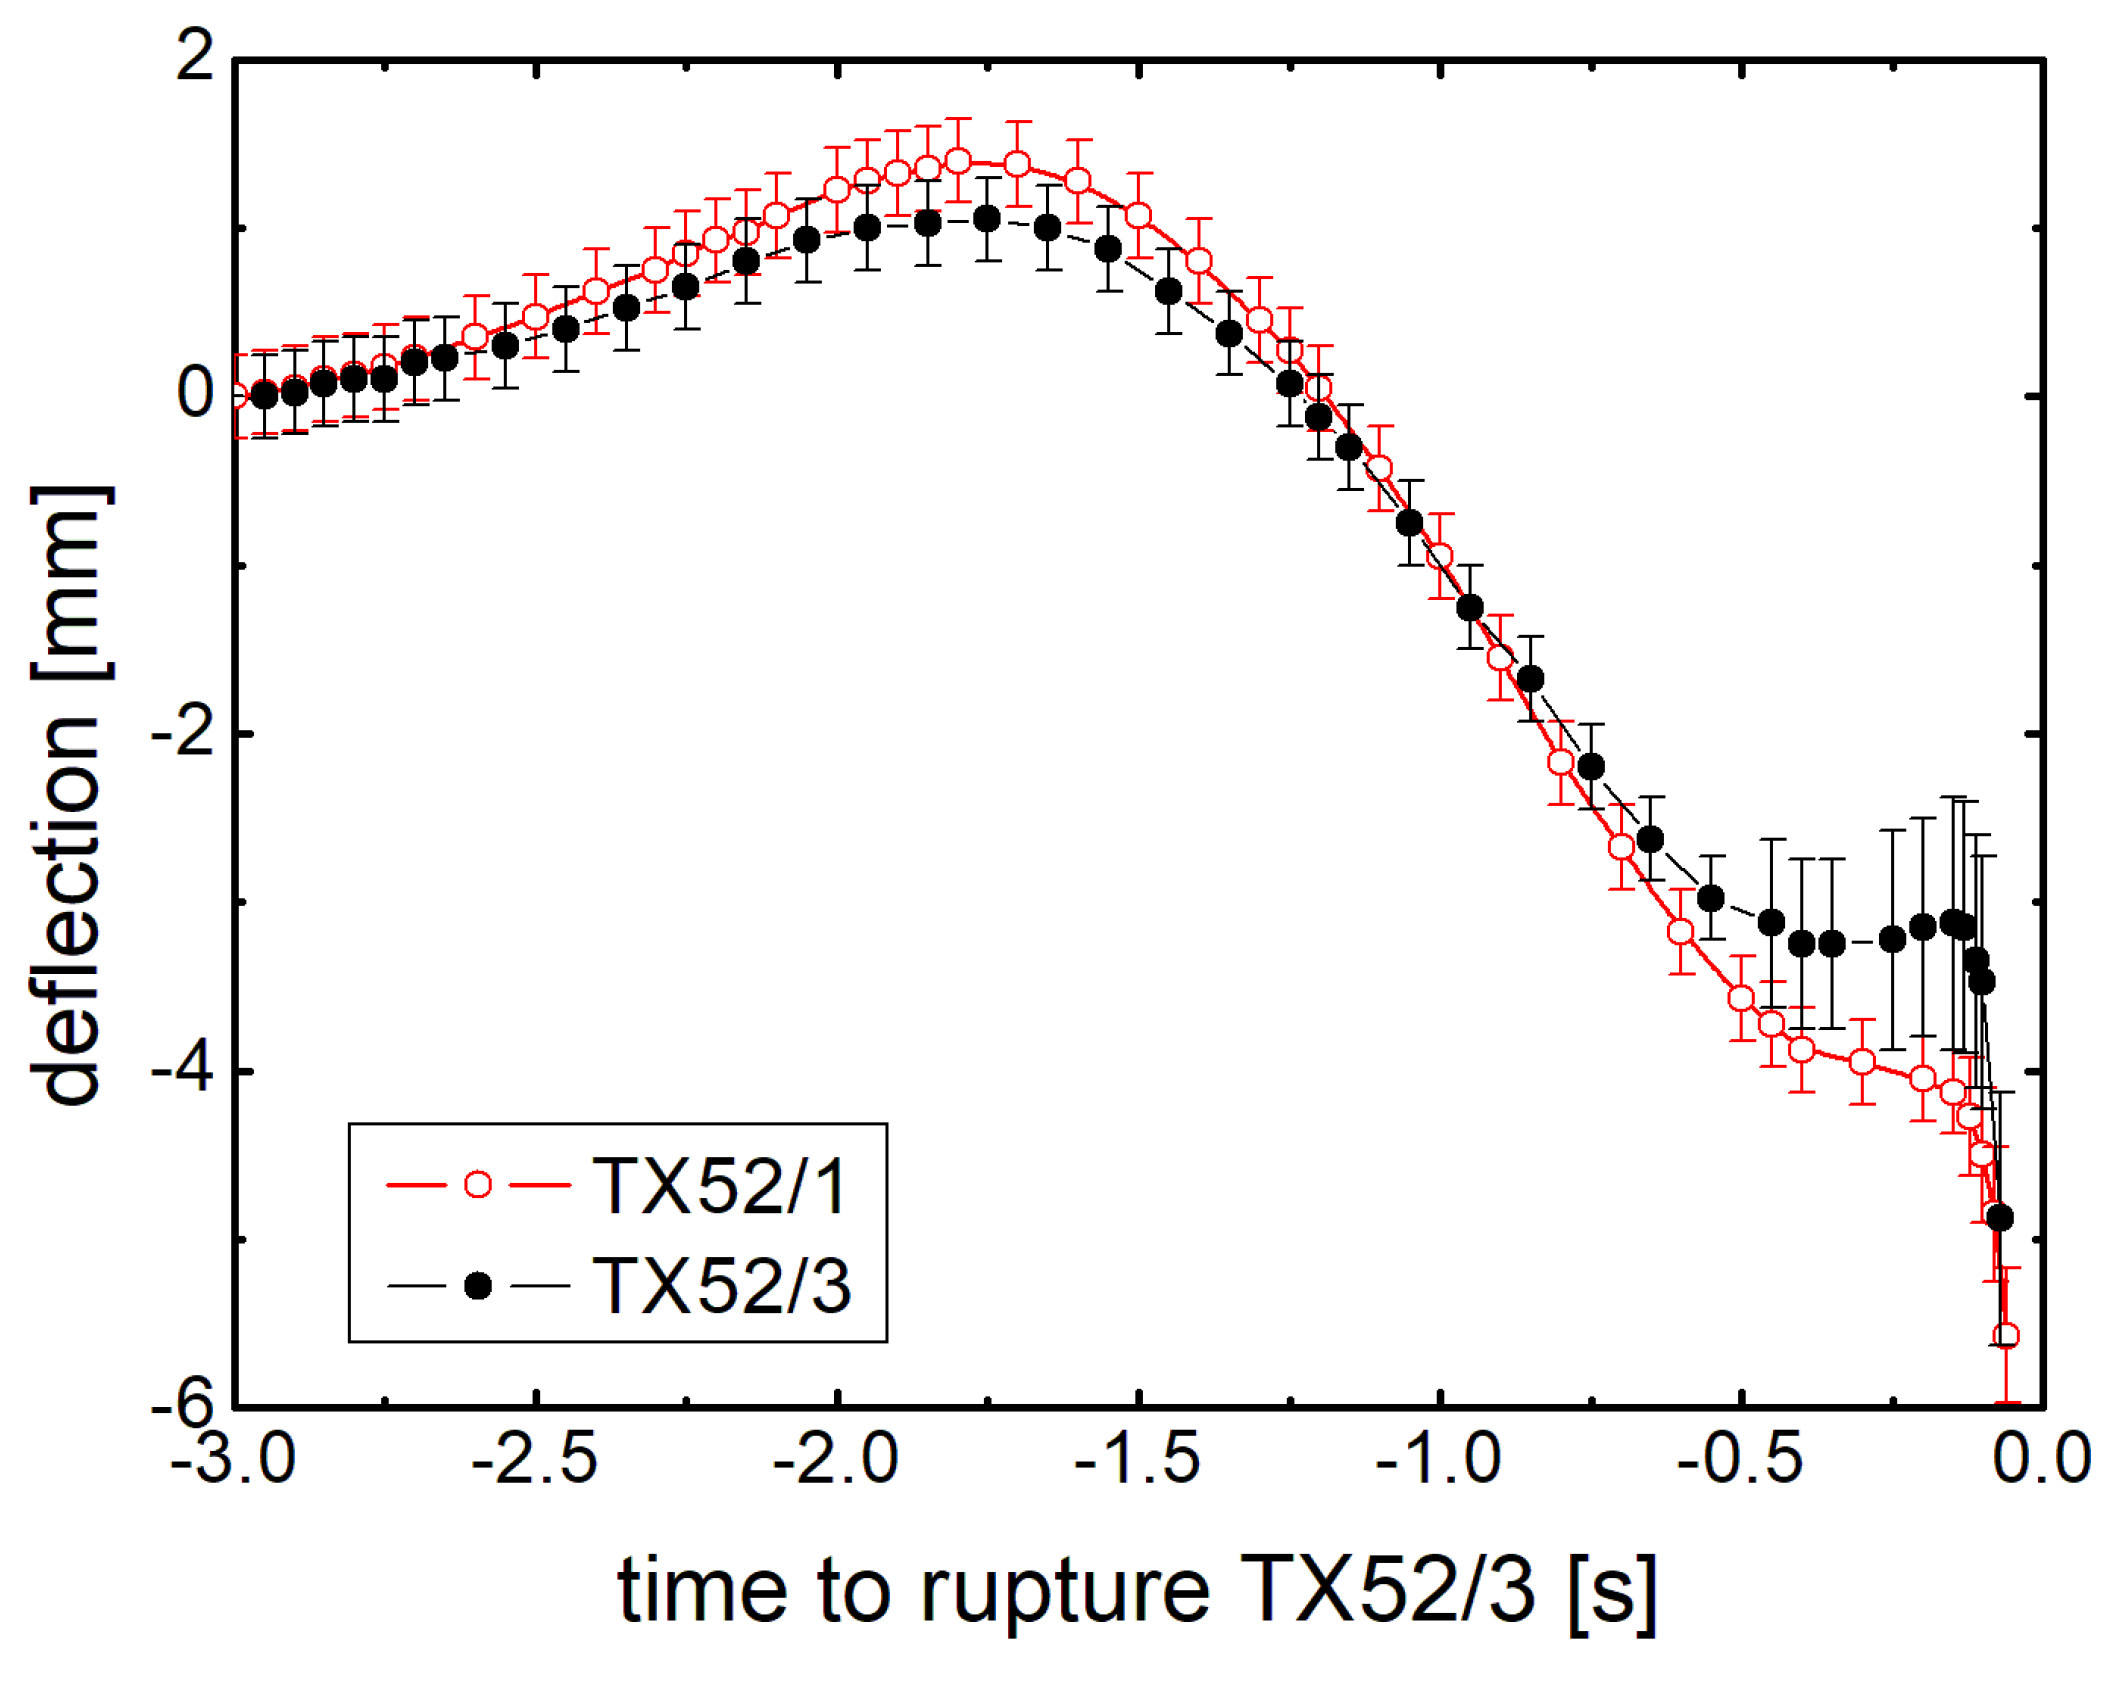
The free fall of the rocket capsule finally decelerated when the rocket re-entered the atmosphere. The setup experienced sideways forces that bent the surviving columns. These lateral inertial forces acted almost perpendicularly to the column axes (the capsule had turned to a nearly horizontal orientation). The velocity of the rocket at this point was about 1.8 km/s. These inertial forces finally led to the rupture of the bridges in the SmA and SmC phases. In the columnar phase (TX52/6), the cylinder even survived the strong deceleration when the rocket re-entered the atmosphere. Figure 6 shows three bridges at 0.5 s before the ST00552 columns ruptured. The deflections within the final 3 s before rupture are shown in Figure 7. The uncontrolled acceleration changed its sign approximately 1.2 s before the columns broke up.
The acceleration that led to the bending of the SmA and SmC columns can be estimated using a simple model that takes into account the inertial forces and surface tension of the materials. This surface tension is of the order of σ 0.025 N/m [52]. We neglect the influence of the yield stress on the lateral bending and assume an adiabatic bending, i.e., the columns are deformed to establish states of near-equilibrium at any instant when the inertial forces increase. Furthermore, we assume that the deformation can be described as a lateral displacement of slices with circular cross-sections, as shown in Figure 8. The lateral forces result from an acceleration a in the direction of the displacement s of the slices. We model this using a potential of E i = m a s . The total energy of the bridge is then calculated using:
E = / 2 / 2 π D σ 1 + s 2 + π 4 D 2 ρ a s d x
where x is along the vertical column axis, ρ 10 3 kg/m 3 is the mass density of the material and s is the derivative d s / d x . By solving the Euler–Lagrange equation, we find that the columns bend in the shape of circular arcs:
s 2 + x 2 = R 0 2 , R 0 = 4 σ a D ρ .
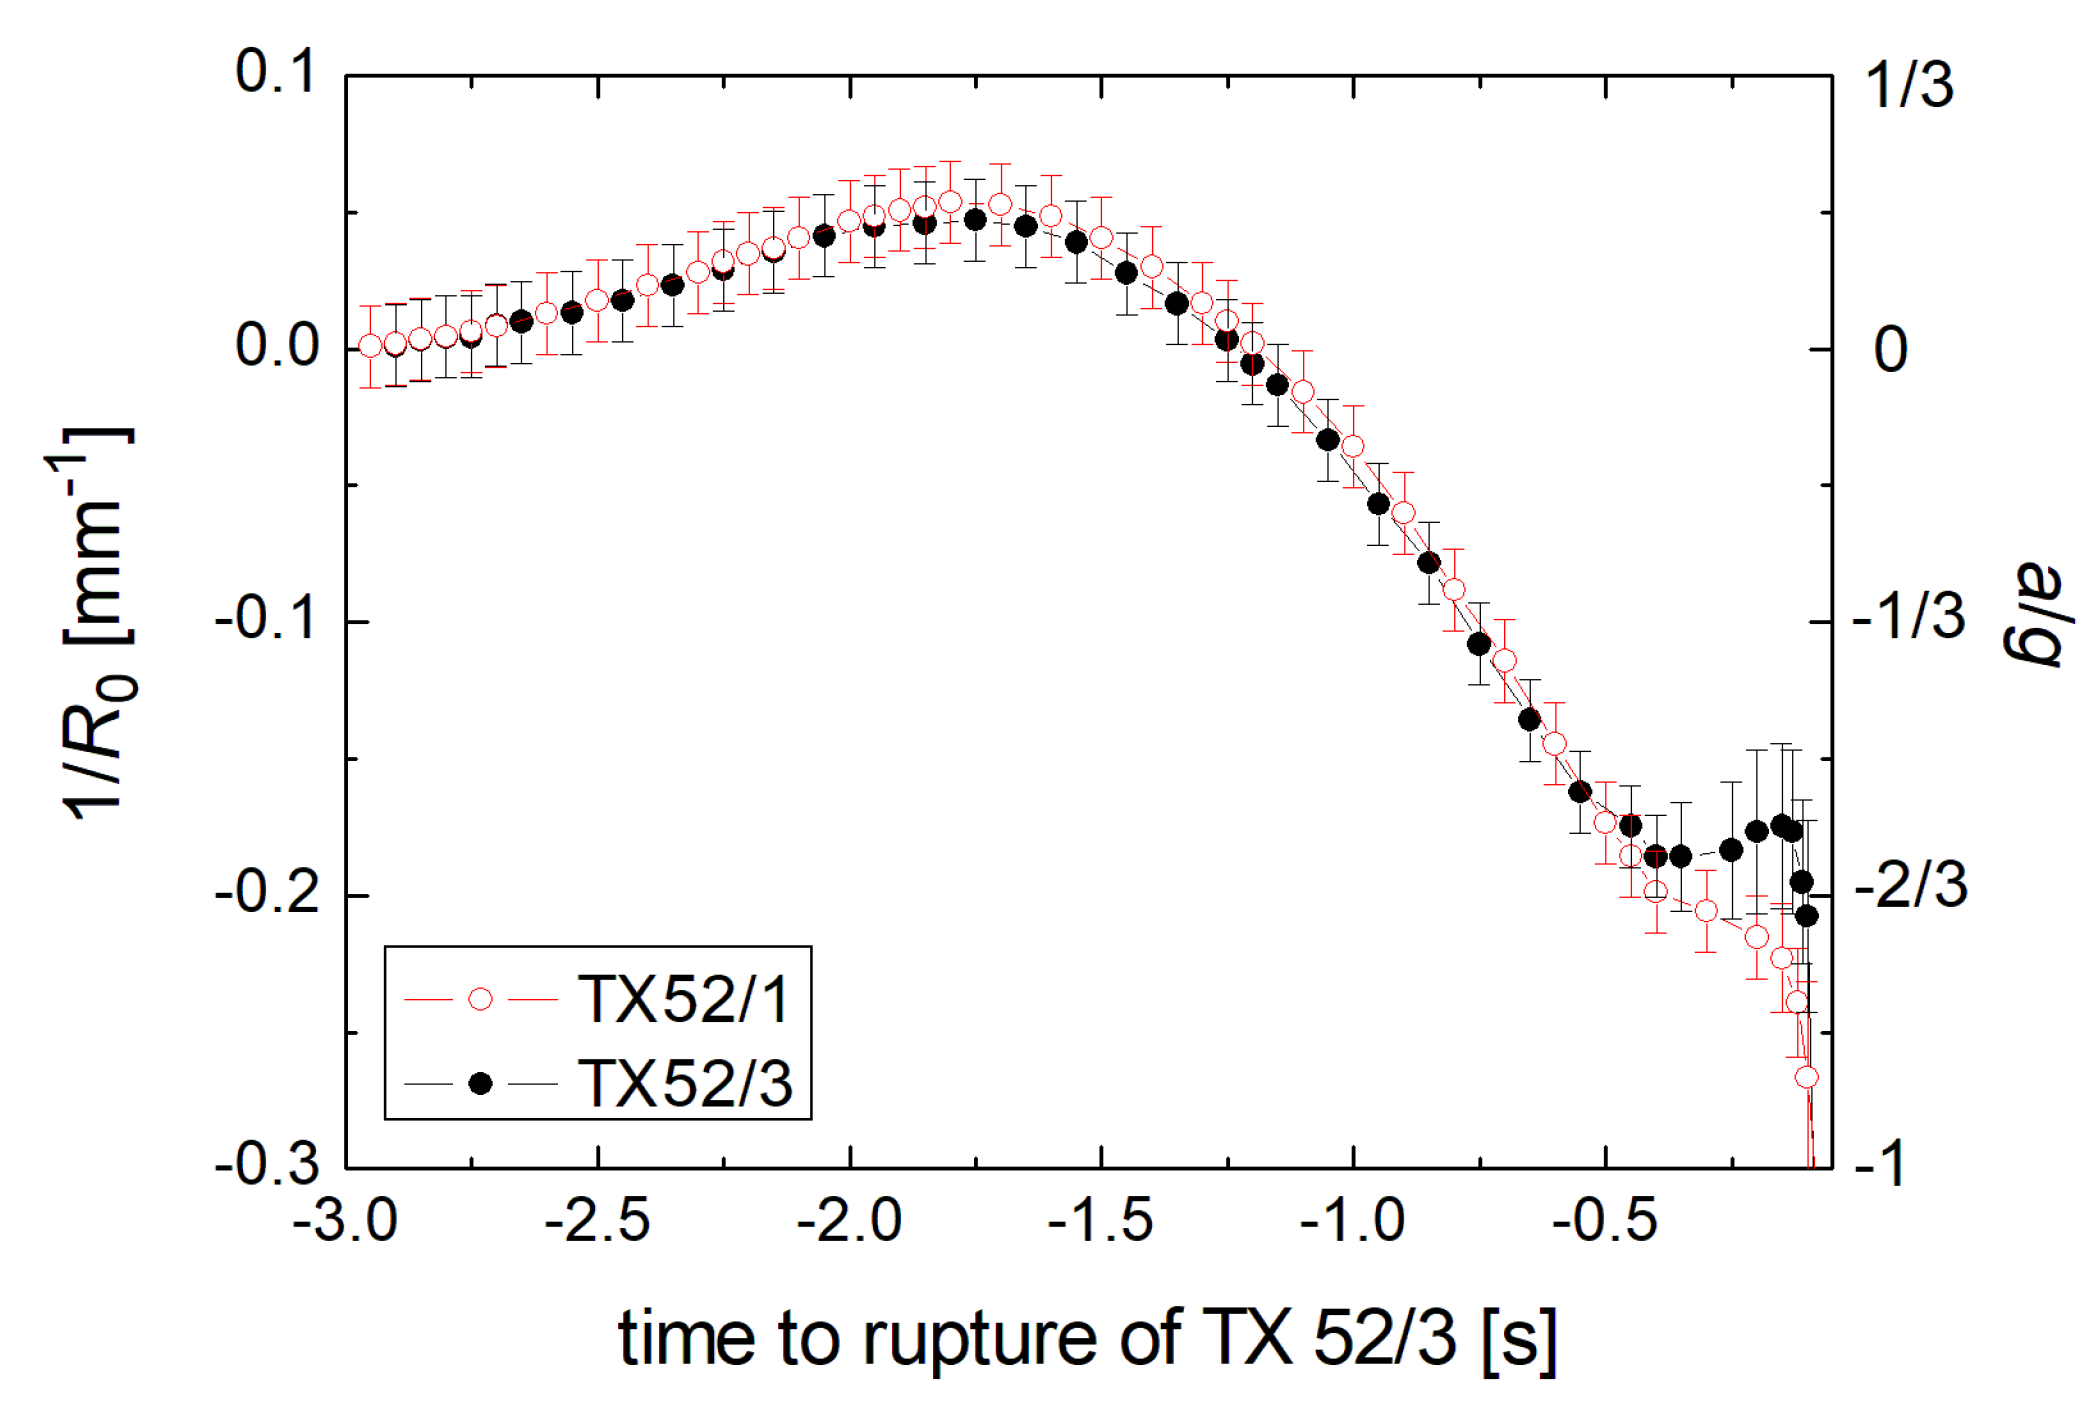
The deflection maximum d s = s s 0 is found by a proper choice of s 0 that satisfied the boundary conditions at the supports, i.e., d s ( ± / 2 ) = 0 . From the deflections shown in Figure 7 and the column lengths we determined the radii of curvature and the related accelerations shown in Figure 9. The ruptures occurred at a lateral acceleration a of the order of 2/3 g.
Note that the inertial forces were neglected because the actual acceleration of the column material was only of the order of mm/s 2 and less. Moreover, the yield stress is too small to have a measurable influence. Even though the assumptions in this model are rather crude (the cross-sections did not remain exactly constant), the above calculation provides a certain estimation of the column stability under sideways forces.

3.3. Rupture Dynamics

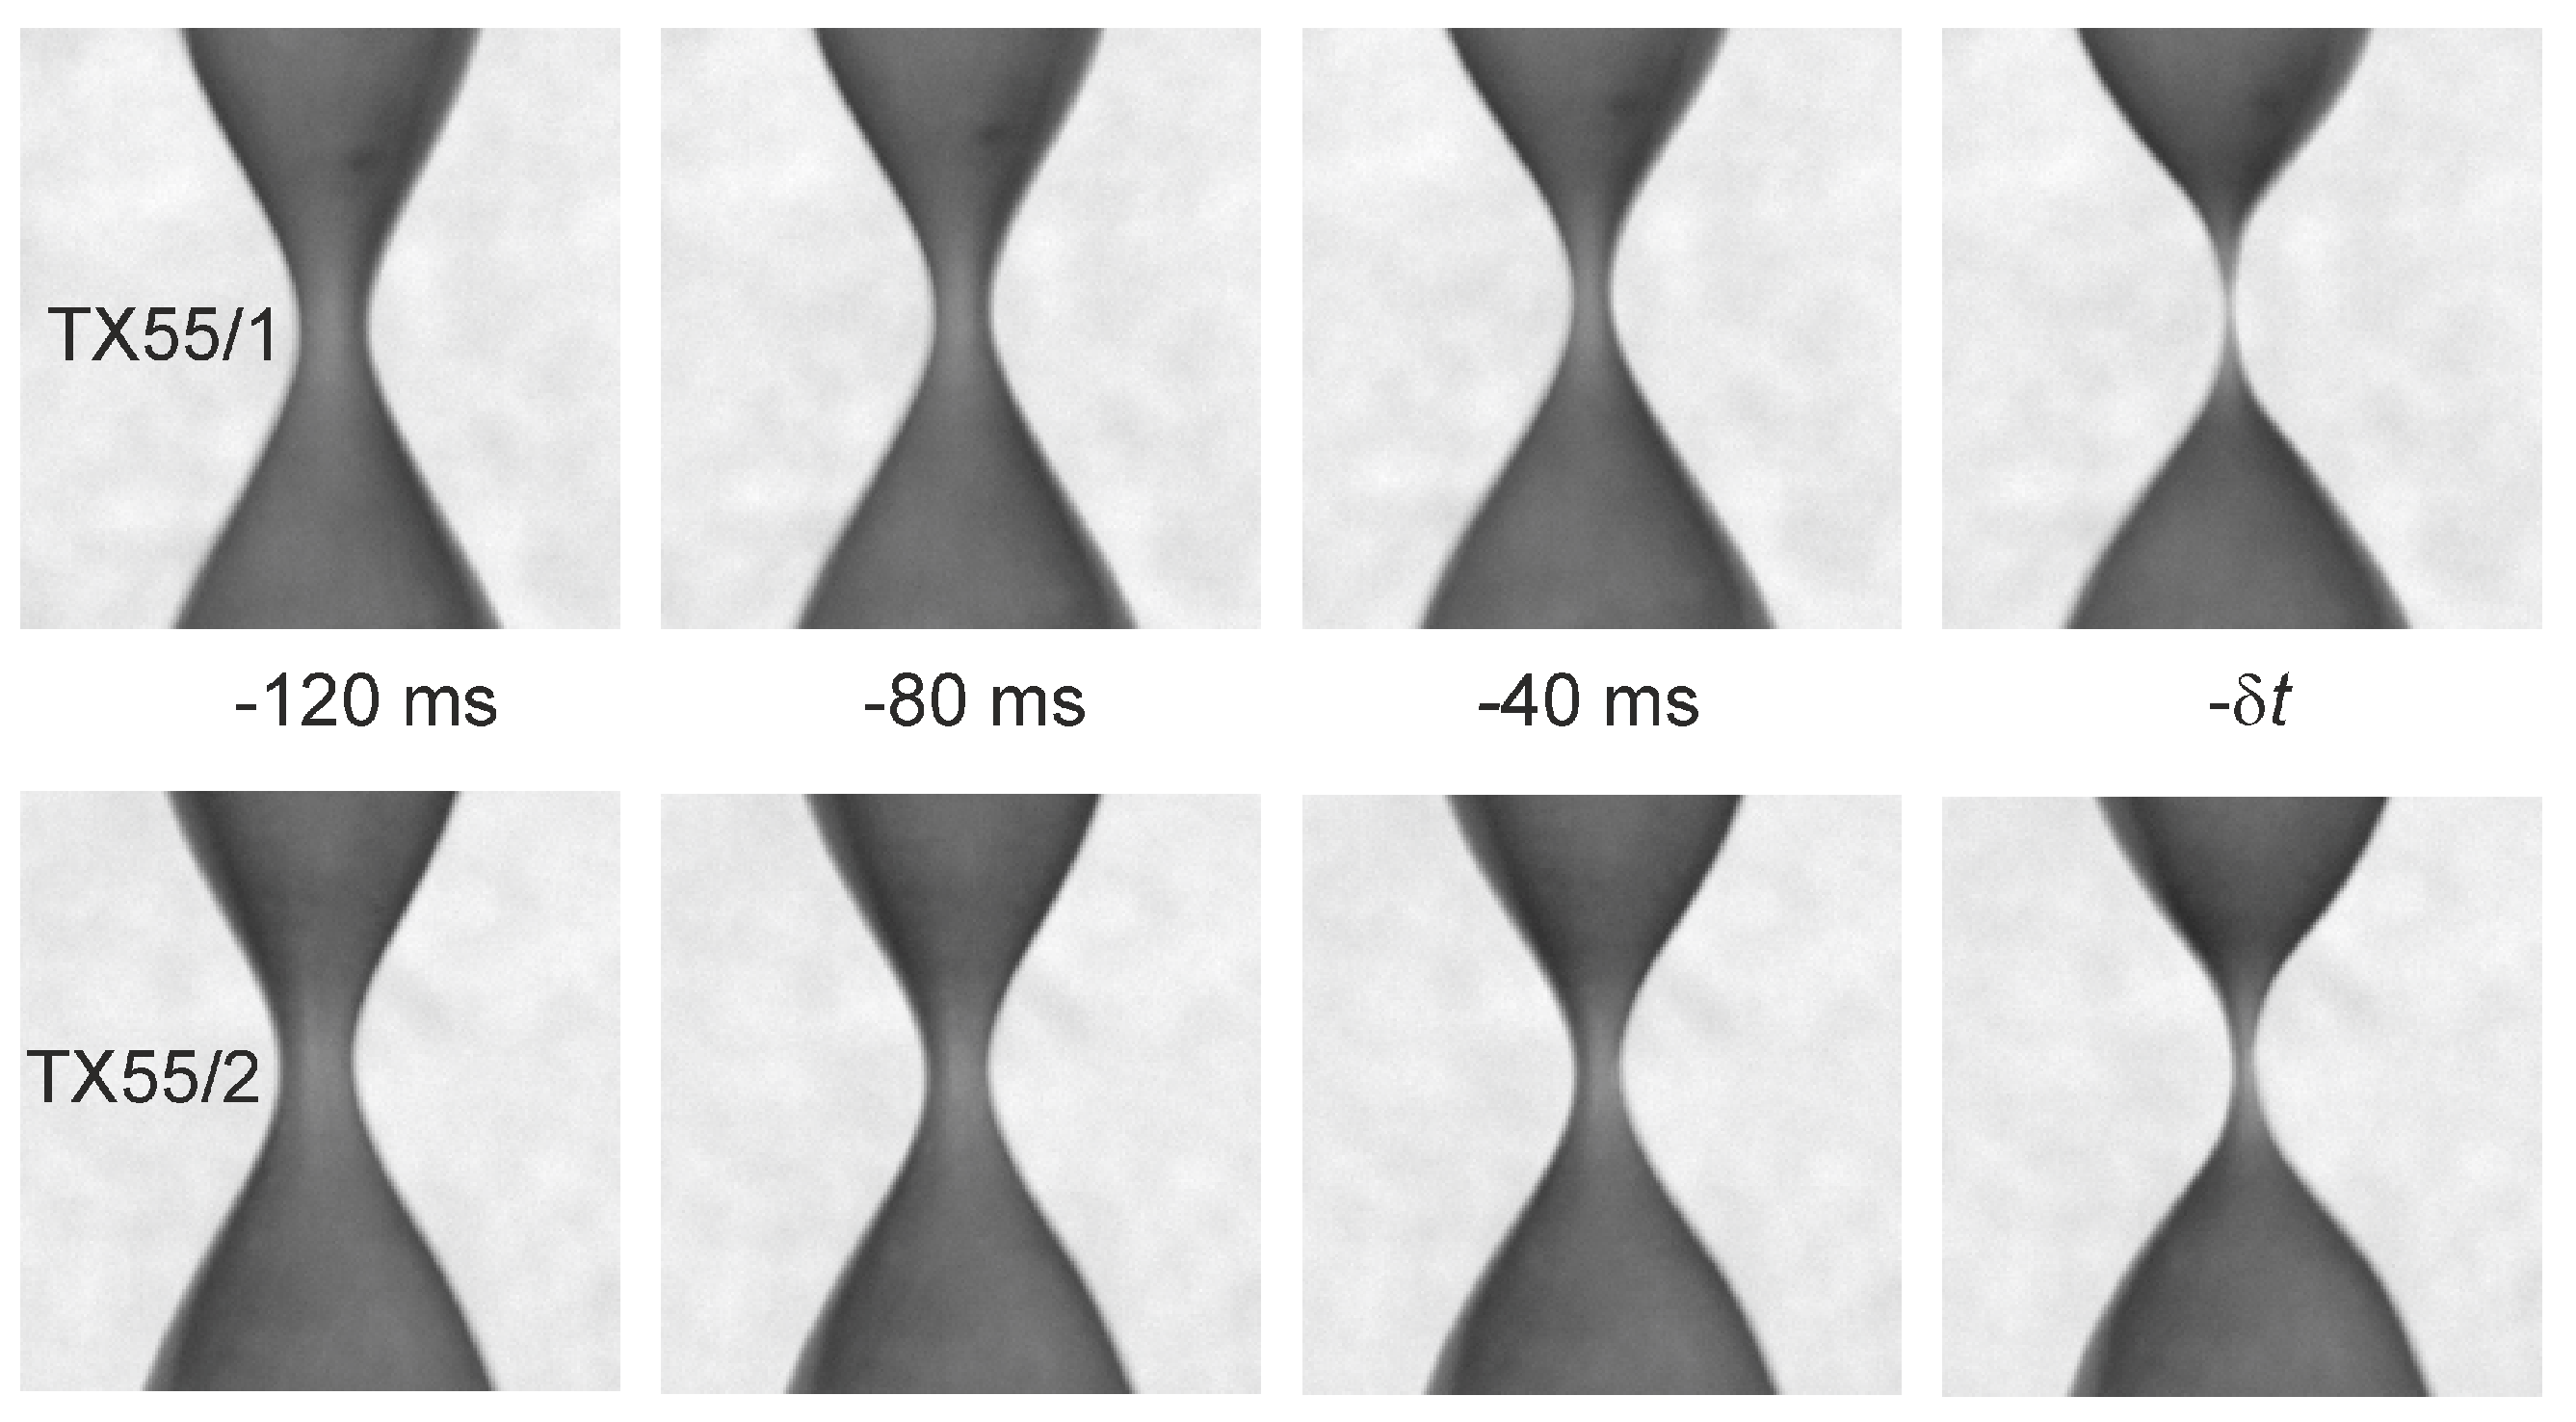
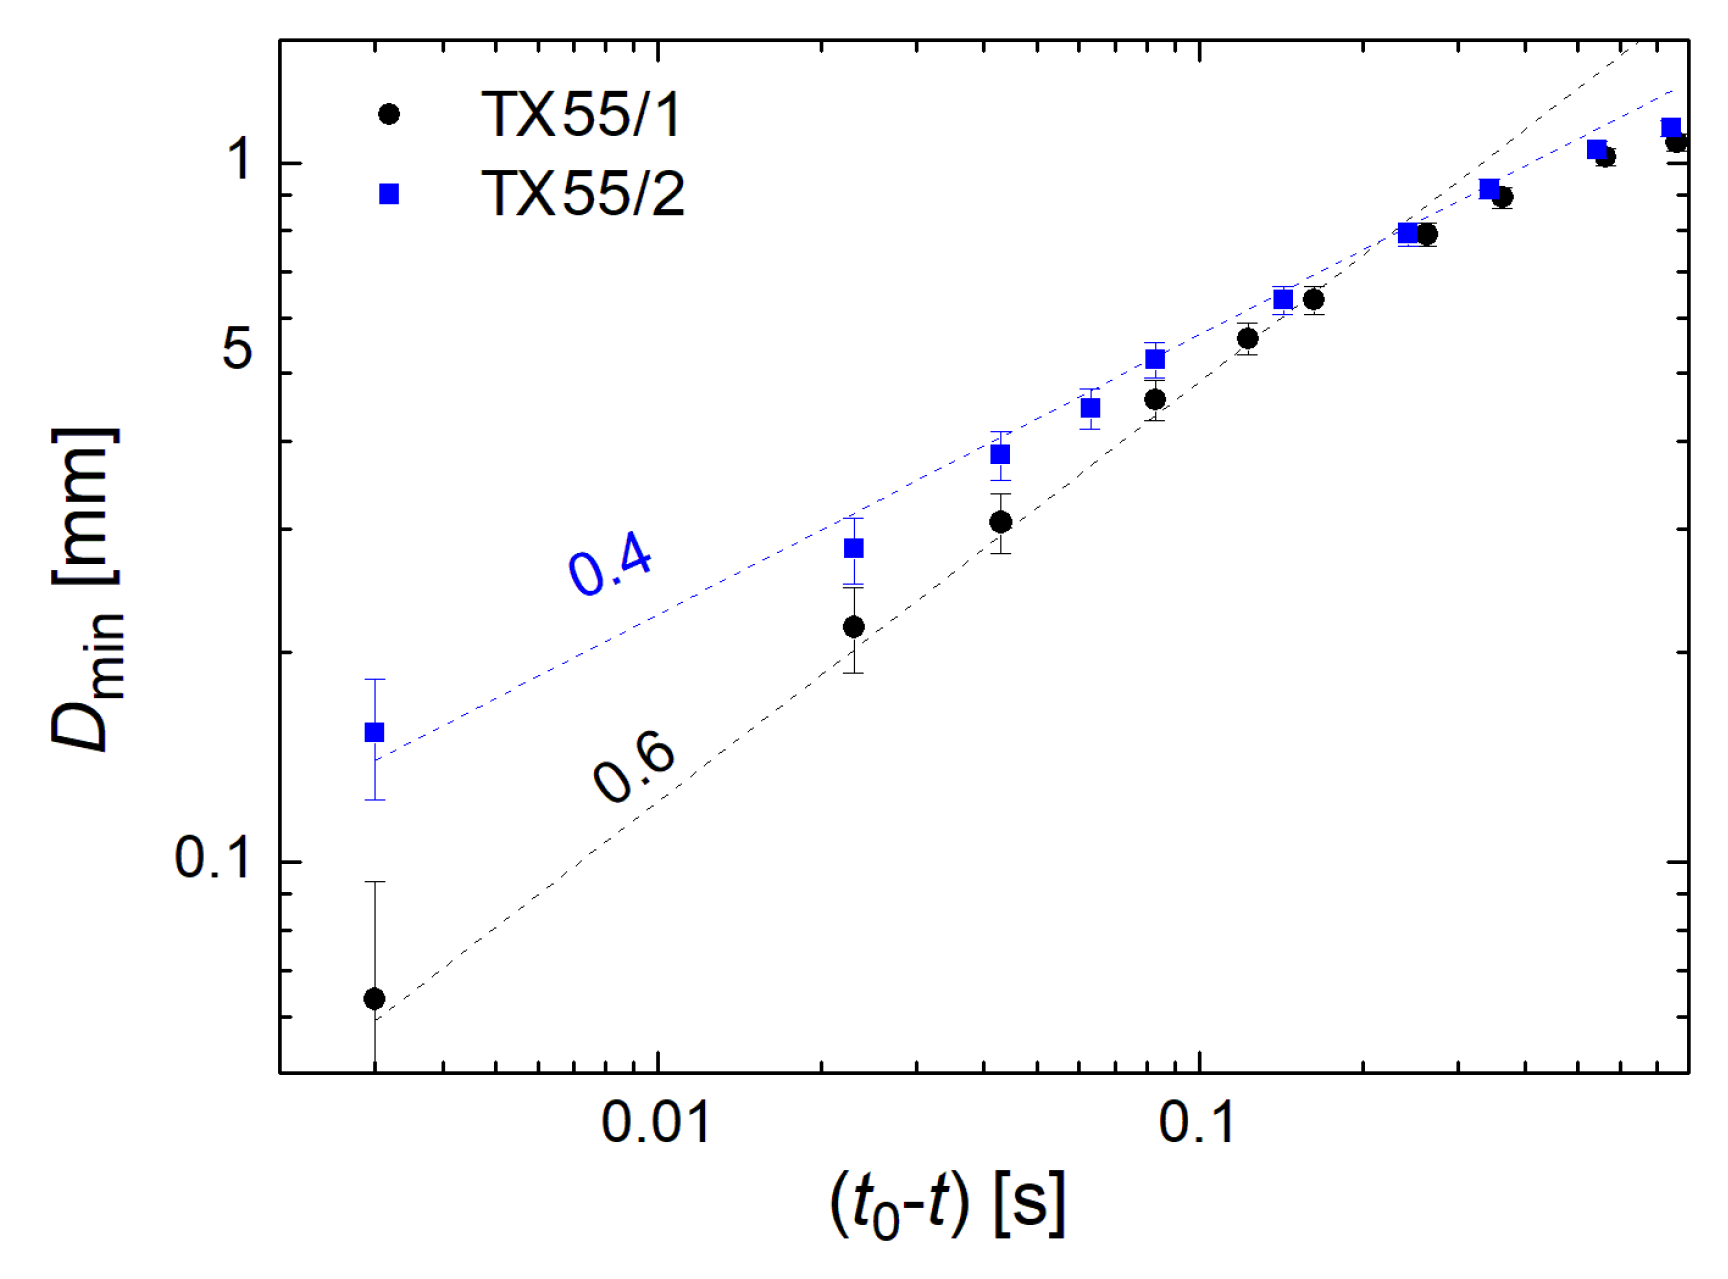
We can group the rupture events into three different scenarios. The first is the rupture of straight columns when they are melting into the nematic phase. This was explored in the TEXUS 55 experiments 1 and 2 with ST02890, which had identical materials (9CB) and temperature protocols. The details of the thinning are shown in Figure 10 and Figure 11. The total bridge length was fixed at α = 4 during the whole rupture process, i.e., the material simply redistributed axially as in the classical RP instability. This situation is comparable to the simulations performed by Schulkes [8]. When the width D min of the column neck is plotted as a function of the time until breakup, one finds that both rupture processes can be scaled satisfactorily using the power laws D min ( t 0 t ) γ . However, the exponents differ substantially. The reason for that is not clear because the experimental conditions were practically identical. Perhaps the melting conditions were not defined well enough or the thinning depended on too many parameters, which meant that an evaluation of the dynamics was not useful in these experiments. We also note that the pinch-off of TX55/2 occurred earlier than that of TX55/1, already 30 s after the temperature was ramped up, when the material entered the nematic phase. TX55/1 pinched off 55 s later, when the temperature was 2 K higher. Our main conclusion is that the melting of the smectic layer structure has an immediate effect on the bridge stability, but the measurement of a scaling exponent requires the improvement of the experiment.
However, the breakup of the columns in all of the other TX 55 experiments yielded the same exponents γ = 0.66 ± 0.02 , irrespective of the different breakup scenarios (see Figure 12). Note that the time scale for TX 55/4 (Figure 12d), which broke without any external acceleration, was nearly one order of magnitude slower. This led to a modification of the bridge neck. As in the nematic column, we observed that the material became transparent in the central filament. This was evidence that the smectic material had enough time to exhibit shear-induced alignment, as in the nematic column that is shown in Figure 5. For the isotropic material in TX52/4 (Figure 4), the exponent could not be determined because the final phase of the rupture was too fast for the frame rate of the available camera.
Note that in previous studies on 3D liquid-crystalline bridges [46,47], cameras with higher temporal resolutions were used. This was not possible within the spatial restrictions of our TEXUS rocket experiments. Therefore, no statements on details during the final milliseconds before breakup could be made here.

4. Summary and Outlook

Table 3 summarizes the outcomes of all 12 microgravity experiments. The microgravity experiments provided new insights into the characteristics of smectic columns and allowed for a comparison of the macroscopic mechanical behaviors of different liquid-crystalline phases. The time frame that was set by the suborbital rocket missions was enough to prepare the experimental structures and study both the static properties and breakup dynamics. The microgravity quality during the suborbital flights is perfect for these experiments and exceeds that during parabolic flights by far. The high acceleration during the launch poses no problems for the preparation of the experiments since the material is confined in a hull during that phase.
In absence of gravity, yield stress can stabilize cylindrical columns with diameters of a few millimeters and with lengths that exceeded 1.4 times the RP limit in smectic A and smectic C materials. In one experiment, a stable smectic A column with an aspect ratio of α > 6 was obtained. Melting the smectic material into the nematic phase led to the destabilization and breakup of the columns with α = 4 > π .
Fast optical imaging allowed us to obtain data on rupture dynamics under microgravity and bridge deflections at the onset of lateral acceleration of the order of 0.1 to 1 g. The neck thinning during the final phase of pinch-off could be described satisfactorily using a power law, i.e., D min ( t 0 t ) γ . The exponents for ruptures in the smectic A and C phases agreed satisfactorily with a value of 2 / 3 that was proposed in the literature for isotropic liquids, and with values that were previously reported for smectic bridges [47]. Ruptures during melting of stable smectic columns into the nematic phase could also be described using a potential law thinning, but the exponents differed even under identical experimental conditions. The most probable reason for this was that the local conditions at the neck were not defined well enough during the melting process.

Author Contributions

Conceptualization, R.S. and T.T.; funding acquisition, R.S. and T.T.; methodology, R.S., K.H. and T.T.; supervision, R.S.; investigation, C.K.; righting review, K.H.; conduction of experiments, all authors; data analysis, all authors; formal analysis, all authors; writing—original draft preparation, R.S.; writing—review and editing, all authors. All authors have read and agreed to the published version of the manuscript.

Funding

This study was supported by the German Aerospace Center (DLR) under project OASIS-Co (50WM1430, 50WM1744 and 50WM2054). The authors are particularly indebted to the DLR for making the rocket experiments possible and to AIRBUS DS for the construction of the equipment and the technical support during the TEXUS campaigns. R. S. and C. K. acknowledge support from the German Science Foundation (DFG) under project STA 425-40/3. We acknowledge support for the Book Processing Charge by the Open Access Publication Fund of Magdeburg University.

Data Availability Statement

Data are available upon request.

Conflicts of Interest

The authors declare no conflict of interest.

Appendix A

A test run was performed under normal gravity conditions before the actual rocket experiment, using identical setups and materials as in TX55. Figure A1 shows the bridges immediately before breakup. The bond number B o = ρ g r 2 / σ (where σ 0.025 N/m, r = 1.5 mm and ρ 10 3 kg/m 3 ) was approximately 10. All of the filaments in the smectic A and C phases became unstable well before the critical value α c = π for a zero bond number (no gravity) was reached. Under gravity conditions, the columns were top-down asymmetric from the beginning of the experiment and the pinch-off occurred in the upper section at a distance of nearly L / 3 from the upper support in all cases.
Figure A1. Smectic bridges under normal gravity conditions in the same setup and with the same materials as in the TX55 flight, in a test run before the rocket launch. Each image shows the respective bridge within the last 20 ms before pinch-off. The TX55/Gn labels refer to the chambers of TX55/n. The scale bars mark 1 mm.
Crystals 12 01092 g0a1
Table A1 summarizes the outcomes of all of the ground experiments. In TX55/G1 and G2, the smectic material wetted the bottom support, which led to an additional destabilization of the bridges. Since the columns were drawn with a continuous speed of 0.1 mm/s in this experiment, the critical threshold for destabilization was not accessible.
Table A1. Ruptures under normal gravity conditions with a bond number of approximately 10.
ExperimentMaterialPhase α at Breakup
TX55/G1ST02890SmA1.14
TX55/G2ST02890SmA1.51
TX55/G3ST00554SmC2.33
TX55/G4ST00552SmA2.35
TX55/G5ST00554SmC1.81
TX55/G6ST00552SmA1.845

References

  1. Plateau, J. Statique Expérimentale et Théorique des Liquides Soumis aux Seules Forces Moléculaires; Gauthier-Villars: Paris, France, 1873; Volume II, Chapter XI; p. 293. [Google Scholar]
  2. Savart, F. Mémoire sur la constitution des veines liquides lancés par des orifices circulaires en mince paroi. Ann. Chim. Phys. Paris 1833, LIII, 337. [Google Scholar]
  3. Lord Rayleigh, On the instability of jets. Proc. Lond. Math. Soc. 1878, 1, 4–13.
  4. Lord Rayleigh, On the Stability, or Instability, of certain Fluid Motions. Proc. Lond. Math. Soc. 1879, 1, 57–72.
  5. Tjahjadi, M.; Stone, H.A.; Ottino, J.M. Satellite and subsatellite formation in capillary breakup. J. Fluid Mech. 1992, 243, 297. [Google Scholar] [CrossRef]
  6. Gier, S.; Wagner, C. Visualization of the flow profile inside a thinning filament during capillary breakup of a polymer solution via particle image velocimetry and particle tracking velocimetry. Phys. Fluids 2012, 24, 53102. [Google Scholar] [CrossRef]
  7. Montanero, J.M.; Ponce-Torres, A. Review on the Dynamics of Isothermal Liquid Bridges. Appl. Mech. Rev. 2020, 72, 10803. [Google Scholar] [CrossRef]
  8. Schulkes, R.M.S.M. Nonlinear dynamics of liquid columns: A comparative study. Phys. Fluids A 1993, 5, 2121. [Google Scholar] [CrossRef]
  9. Li, Y.; Sprittles, J.E. Capillary breakup of a liquid bridge: Identifying regimes and transitions. J. Fluid Mech. 2016, 797, 22. [Google Scholar] [CrossRef] [Green Version]
  10. Meseguer, J. The influence of axial microgravity on the breakage of axisymmetric slender liquid bridges. J. Cryst. Growth 1983, 62, 557–586. [Google Scholar] [CrossRef] [Green Version]
  11. Meseguer, J. The breaking of axisymmetric slender liquid bridges. J. Fluid Mech. 1983, 130, 123–151. [Google Scholar] [CrossRef] [Green Version]
  12. Meseguer, J.; Bezdenejnykh, N.A.; Perales, J.M.; de Francisco, P.R. Theoretical and experimental analysis of stability limits of non-axisymmetrical liquid bridges under microgravity conditions. Microgravity Sci. Techn. 1995, 8, 2–9. [Google Scholar]
  13. Meseguer, J.; Slobozhanin, L.A.; Perales, J.M. A review on the stability of liquid bridges. Adv. Space Res. 1995, 16, 5. [Google Scholar] [CrossRef] [Green Version]
  14. Meseguer, J.; Mayo, L.A.; Llorente, J.C.; Fernandez, A. Experiments with liquid bridges in simulated microgravity. J. Cryst. Growth 1985, 73, 609–621. [Google Scholar] [CrossRef] [Green Version]
  15. Resnick, A.; Alexander, J. Plateau tank apparatus for the study of liquid bridges. Rev. Sci. Instrum. 1997, 68, 1495–1500. [Google Scholar] [CrossRef] [Green Version]
  16. Mahajan, M.P.; Tsige, M.; Taylor, P.L.; Rosenblatt, C. Liquid crystal bridges. Liq. Cryst. 1999, 26, 443–448. [Google Scholar] [CrossRef]
  17. Mahajan, M.P.; Tsige, M.; Taylor, P.L.; Rosenblatt, C. Stability of liquid crystalline bridges. Phys. Fluids 1999, 11, 491. [Google Scholar] [CrossRef]
  18. Meseguer, J.; Sanz-Andrés, A.; Pérez-Grande, I.; Pindado, S.; Franchini, S.; Alonso, G. Surface tension and microgravity. Eur. J. Phys. 2014, 34, 55010. [Google Scholar] [CrossRef] [Green Version]
  19. Langbein, D. Oscillations of finite liquid columns. Microgravity Sci. Techn. 1992, 5, 73–85. [Google Scholar] [CrossRef]
  20. Langbein, D.; Falk, F.; Großbach, R. Oscillations of liquid columns under microgravity. Adv. Space Res. 1995, 16, 23. [Google Scholar] [CrossRef]
  21. Martínez, I.; Perales, J.M.; Meseguer, J. Response of a liquid bridge to an acceleration varying sinusoidally with time. Lect. Notes Phys. 1996, 464, 271–282. [Google Scholar]
  22. Martínez, I. Deformaciones de una columna líquida frente a cargas cuasi-estáticas en un cohete de sondeo. Ing. Aeronaut. Astronaut. 1996, 344, 17–30. [Google Scholar]
  23. DiLisi, G.; Dempsey, R.; Rarick, R.; Rosenblatt, C. Using parabolic flights to examine quantitatively the stability of liquid bridges under varying total body force. Microgravity Sci. Tech. 2015, 27, 145–153. [Google Scholar] [CrossRef]
  24. Mahajan, M.P.; Tsige, M.; Zhang, S.; Alexander, J.I.D.; Taylor, P.L.; Rosenblatt, C. Collapse dynamics of liquid bridges investigated by time-varying magnetic levitation. Phys. Rev. Lett. 2000, 84, 338. [Google Scholar] [CrossRef]
  25. Cheong, A.G.; Rey, A.D.; Mather, P.T. Capillary instabilities in thin nematic liquid crystalline fibers. Phys. Rev. E 2001, 64, 41701. [Google Scholar] [CrossRef] [Green Version]
  26. Jákli, A.; Krüerke, D.; Nair, G.G. Liquid crystal fibers of bent-core molecules. Phys. Rev. E 2003, 67, 51702. [Google Scholar] [CrossRef] [Green Version]
  27. Stannarius, R.; Nemeş, A.; Eremin, A. Plucking a liquid chord: Mechanical response of a liquid filament. Phys. Rev. E 2005, 72, 20702. [Google Scholar] [CrossRef] [Green Version]
  28. Eremin, A.; Nemeş, A.; Stannarius, R.; Schulz, M.; Nadasi, H.; Weissflog, W. Structure and mechanical properties of liquid crystalline filaments. Phys. Rev. E 2005, 71, 31705. [Google Scholar] [CrossRef]
  29. Nemeş, A.; Eremin, A.; Stannarius, R.; Schulz, M.; Weissflog, W. Structure characterization of free standing filaments drawn in the liquid crystal state. Phys. Chem. Chem. Phys. 2006, 8, 469. [Google Scholar] [CrossRef]
  30. Bailey, C.; Gartland Jr., E.C.; Jákli, A. Structure and stability of bent core liquid crystal fibers. Phys. Rev. E 2007, 75, 31701. [Google Scholar] [CrossRef] [Green Version]
  31. Bailey, C.; Murphy, M.; Eremin, A.; Weissflog, W.; Jákli, A. Bundles of fluid fibers formed by bent-core molecules. Phys. Rev. E 2010, 81, 31708. [Google Scholar] [CrossRef] [Green Version]
  32. Baumann, P.; Phillips, D. Analysis and stability of bent-core liquid crystal fibers. Discret. Contin. Dyn. Syst. 2012, 17, 1707. [Google Scholar]
  33. Morys, M.; Trittel, T.; Eremin, A.; Murphy, P.; Stannarius, R. Tension of freely suspended fluid filaments. Phys. Rev. E 2012, 86, 040501(R). [Google Scholar] [CrossRef] [PubMed] [Green Version]
  34. Salili, S.M.; Ostapenko, T.; Kress, O.; Bailey, C.; Weissflog, W.; Harth, K.; Eremin, A.; Stannarius, R.; Jákli, A. Rupture and Recoil of Bent-Core Liquid Crystal Filaments. Soft Matter 2016, 12, 4725. [Google Scholar] [CrossRef] [PubMed] [Green Version]
  35. van Winkle, D.H.; Clark, N.A. Freely Suspended Strands of Tilted Columnar Liquid-Crystal Phases: One-Dimensional Nematics with Orientational Jumps. Phys. Rev. Lett. 1982, 48, 1407. [Google Scholar] [CrossRef]
  36. Ostapenko, T.; Weyland, M.; Eremin, A.; Lehmann, M.; Stannarius, R. Filaments formed in the hexagonal columnar liquid crystal phase of star-shaped oligobenzoates. Liq. Cryst. 2013, 40, 345. [Google Scholar] [CrossRef]
  37. Pratibha, R.; Madhusudana, N.V. Cylindrical growth of smectic A liquid crystals from the isotropic phase in some binary mixtures. J. Phys. II Fr. 1991, 2, 383–400. [Google Scholar] [CrossRef]
  38. Naito, H.; Okuda, M.; Zhong-can, O.Y. Pattern formation and instability of smectic-A filaments grown from an isotropic phase. Phys. Rev. E 1997, 55, 1655. [Google Scholar] [CrossRef]
  39. E, W.; Palffy-Muhoray, P. Dynamics of Filaments during the Isotropic-Smectic A Phase Transition. J. Nonlinear Sci. 1999, 9, 417–437. [Google Scholar] [CrossRef]
  40. Todorokihara, M.; Iwata, Y.; Naito, H. Periodic buckling of smectic-A tubular filaments in an isotropic phase. Phys. Rev. E 2004, 70, 21701. [Google Scholar] [CrossRef]
  41. Eggers, J.; Villermaux, E. Physics of liquid jets. Rep. Prog. Phys. 2008, 71, 36601. [Google Scholar] [CrossRef]
  42. Keller, J.B.; Miksis, M.J. Surface Tension Driven Flows. SIAM J. Appl. Math. 1983, 43, 268–277. [Google Scholar] [CrossRef]
  43. Brenner, M.P.; Eggers, J.; Joseph, K.; Nagel, S.R.; Shi, X.D. Breakdown of scaling in droplet fission at high Reynolds number. Phys. Fluids 1997, 9, 1573. [Google Scholar] [CrossRef]
  44. Chen, A.U.; Notz, P.K.; Basaran, O.A. Computational and Experimental Analysis of Pinch-Off and Scaling. Phys. Rev. Lett. 2002, 88, 174501. [Google Scholar] [CrossRef]
  45. Verhoeff, A.A.; Lekkerkerker, H.N.W. Droplet snap-off in fluids with nematic liquid crystalline ordering. New J. Phys. 2012, 14, 23010. [Google Scholar] [CrossRef]
  46. Porter, D.; Savage, J.R.; Cohen, I.; Spicer, P.; Caggioni, M. Temperature dependence of droplet breakup in 8CB and 5CB liquid crystals. Phys. Rev. E 2012, 85, 41701. [Google Scholar] [CrossRef] [Green Version]
  47. Savage, J.R.; Caggioni, M.; Spicer, P.T.; Cohen, I. Partial universality: Pinch-off dynamics in fluids with smectic liquid crystalline order. Soft Matter 2010, 6, 892. [Google Scholar] [CrossRef]
  48. Dolganov, P.V.; Zverev, A.S.; Baklanova, D.; Dolganov, V.K. Dynamics of capillary coalescence and breakup: Quasi-two-dimensional nematic and isotropic droplets. Phys. Rev. E 2021, 104, 014702. [Google Scholar] [CrossRef]
  49. Dolganov, P.V.; Zverev, A.S.; Baklanova, D.; Dolganov, V.K. Quasi-two-dimensional coalescence of nematic and isotropic droplets and Rayleigh-Plateau instability in flat optical cells. Soft Matter 2022, 18, 126. [Google Scholar] [CrossRef]
  50. Zhang, C.; Diorio, N.; Radhika, S.; Sadashiva, B.K.; Sprunt, S.N.; Jákli, A. Two distinct modulated layer structures of an asymmetric bent-shape smectic liquid crystal. Liq. Cryst. 2012, 39, 1149–1157. [Google Scholar] [CrossRef]
  51. Bezdenejnykh, N.A.; Meseguer, J. Stability limits of minimum volume and breaking of axisymmetric liquid bridges between unequal disks. Microgravity Sci. Techn. 1991, 4, 235. [Google Scholar]
  52. Schüring, H.; Thieme, C.; Stannarius, R. Surface tensions of smectic liquid crystals. Liq. Cryst. 2001, 28, 241. [Google Scholar] [CrossRef]
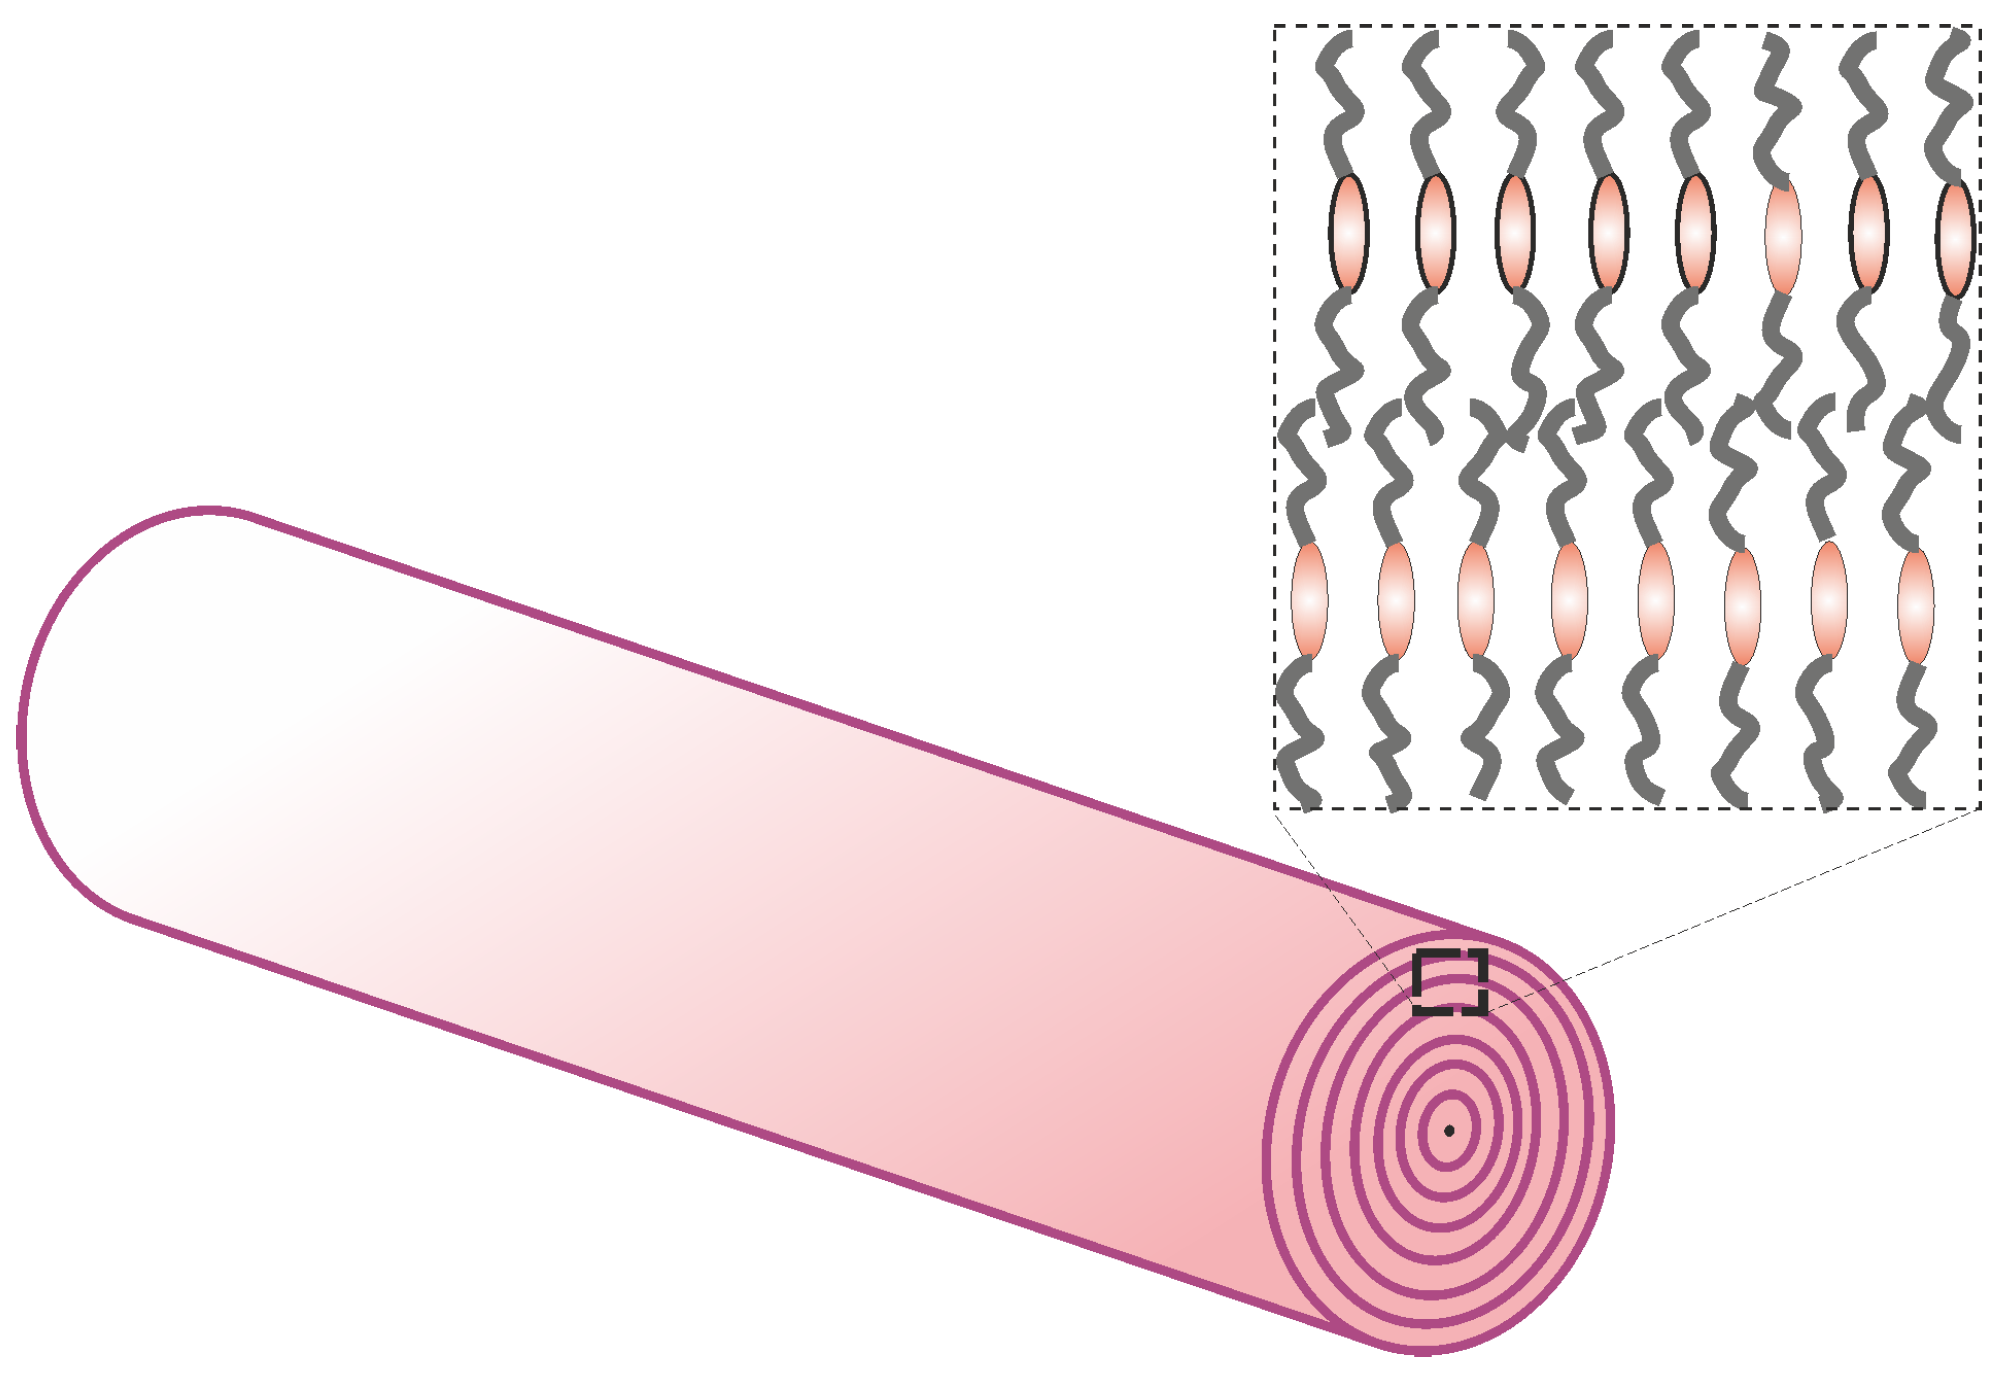
Figure 1. A smectic microfilament with the proposed stabilizing layer arrangement [26,29] for filament diameters that are between several nanometers and a few dozen micrometers. In our macroscopic columns, the layer structure was disordered and this stability mechanism was not present.
Crystals 12 01092 g001
Figure 2. Sketch of the TEXUS 52/TEXUS 55 liquid-crystal bridge experiment. The liquid or liquid-crystal (the bright bluish column) is initially encapsulated by a cylindrical metal hull with an inner diameter of 3 mm. This shell is pulled away from the opposing support of the bridge and a fast camera captures images of the free column at rates of 50 or 100 frames per second.
Crystals 12 01092 g002
Figure 3. The drawing protocols for the columns in the six experiment pairs. The time counted from the start of the hull motion, which was initiated after entry into the microgravity phase. The distance L was measured from the fixed top to the upper rim of the hull that enclosed the fluid cylinders. The horizontal green line indicates the critical aspect ratio α c .
Crystals 12 01092 g003
Figure 4. The isotropic bridge of ST02890 (TX52/4) at different times before pinch-off ( α = 2.26 ± 0.03 ), where δ t is less than 10 ms. Because of a technical issue, the bridge was asymmetric and had a base diameter that was 1.5 times larger than the top diameter. The image sizes are 8 mm × 11 mm.
Crystals 12 01092 g004
Figure 5. The nematic bridge of ST00552, 17 s before pinch-off (a), 0.25 s before pinch-off (b) and less than 10 ms before pinch-off (c), ( α = 1.73 ). The nematic material started to wet the hull approximately 40 s after the start of the experiment in μ g , which led to the instability of the cylinder radius and the premature pinch-off. The image sizes are 8 mm × 9 mm.
Crystals 12 01092 g005
Figure 6. Smectic bridges during the deceleration phase: ST00552 in SmC at 44 C (a) and in SmA at 53 C (b). The inertia pulls the middle of the columns in a direction perpendicular to their axes. (c) shows the columnar material in the M2 phase at the same instant and acceleration. The aspect ratios are α = 4.6 (b) and 4.75 (a,c). The image sizes are 8 mm × 16 mm.
Crystals 12 01092 g006
Figure 7. Deflection of two columns with aspect ratios of between 4.5 and 4.75 during the deceleration of the TX52 rocket (we measured the lateral displacements of the columns at their maximum deflections relative to the initial straight columns).
Crystals 12 01092 g007
Figure 8. The model of the column deformation under the action of inertial lateral forces. Each slice has a circular cross-section.
Crystals 12 01092 g008
Figure 9. Inverse radius of curvature ( 1 / R 0 ) and the corresponding lateral acceleration a, as calculated using Equation (3). During the final 300 ms before rupture, the deformation was already asymmetric and this model did no longer apply.
Crystals 12 01092 g009
Figure 10. The pinch-off of ST02890 during the transition from smectic A into the nematic phase at an elongation of α = 4 . When the material melted, the stability provided by the yield stress was lost: The column started thinning in the center and finally pinched off (image sizes were 5 mm × 5 mm).
Crystals 12 01092 g010
Figure 11. The pinch-off of ST02890 during the transition from smectic A into the nematic phase: Thinning of the neck diameter D min as a function of time to pinch-off at t 0 . The dashed lines mark ( t 0 t ) γ for the given exponents. Evidently, both graphs yielded qualitatively different γ values, even though the experimental conditions were the same.
Crystals 12 01092 g011
Figure 12. Some smectic bridges during breakup: (a) ST00554 column of L = 6.0 mm in SmC; (b) ST00552 column of 6.0 mm in SmA; (c) ST00554 column of 18 mm in SmC. These three columns were broken up by sideways acceleration during the re-entry of the rocket. (d) The pinch-off of an ST00552 column in SmA under zero gravity conditions without acceleration (two rows). The time scale of the rupture was much longer, yet the same power law was found. Image sizes were 5 mm × 5 mm. The time δ t of the last image in each series was within 20 ms before the pinch-off. (e) A summary of the thinning dynamics of the four experiments. The dashed lines indicate D min ( t 0 t ) 0.66 .
Crystals 12 01092 g012
Table 1. Materials, temperatures and drawing protocols: TX52/n (n = 1...6) represent the experiments that were performed onboard TEXUS 52, and TX55/n represent those performed onboard TEXUS 55. The label ↑ indicates that the columns were only expanded, whereas marks experiments in which the columns were expanded first and shortened later. Temperatures were kept constant, except during TX55/1,2 in which a phase transition was triggered within the bridges.
ExperimentMaterial  Temperature
(°C)
PhaseModus
TX52/1ST0055244SmC
TX52/2ST0289044SmA
TX52/3ST0055252SmA
TX52/4ST0289052Iso
TX52/5ST0055260Nem
TX52/6ST0452460M2
TX55/1ST0289046.5→ 53SmA→Iso
TX55/2ST0289046.5→ 53SmA→Iso
TX55/3ST0055453SmC
TX55/4ST0055253SmA
TX55/5ST0055453SmC
TX55/6ST0055253SmA
Table 2. Chemical compositions and phase sequences of the materials that were used in the microgravity experiments. The transition temperatures are given in ° C. The mesophases are labeled as SmC (smectic C), SmA (smectic A) and Nem (nematic). M1 and M2 represent modulated smectic phases [50].
SampleChemical Formula and Phase Sequence
ST005522-(4-n-Hexyloxyphenyl)-5-n-octylpyrimidine
Cr 27.5 SmC 44.5 SmA 57.5 Nem 65 Iso
ST005542-(4-n-Decyloxyphenyl)-5-n-octylpyrimidine
Cr 32 SmC 59.5 SmA 65.5 Nem 69.5 I
ST028904-n-Nonyl-biphenyl-4 -carbonitrile, 9 CB
Cr 42 SmA 47.5 Nem 49.5 Iso
ST045242,3,6,7,10,11-Hexakis[dodecyloxy]triphenylene
Cr 55 M1 58 M2 63 Iso
Table 3. A summary of the outcomes of the experiments.
ExperimentMaterialPhaseResult
TX52/1ST00552SmCStable until re-entry at α = 4.75
TX52/2ST02890SmAWetted hull: breakup at  α = 4.4
TX52/3ST00552SmAStable until re-entry at α = 4.6
TX52/4ST02890IsoAsymmetric: breakup at  α = 2.26
TX52/5ST005520NemWetted hull: breakup at  α = 1.73
TX52/6ST04524M2Stable even after re-entry
TX55/1ST02890NemBreakup after melting at α = 4
TX55/2ST02890NemBreakup after melting at α = 4
TX55/3ST00554SmCStable until re-entry at α = 6.5
TX55/4ST00552SmAAir bubbles: breakup at  α = 3.82
TX55/5ST00554SmCStable until re-entry at α = 2
TX55/6ST00552SmAStable until re-entry at α = 2
Publisher’s Note: MDPI stays neutral with regard to jurisdictional claims in published maps and institutional affiliations.