Article

Effect of Ce-Doping on Microstructure and Adsorption- Photodegradation Behaviors of the Hydrothermally-Synthesized TiO2 Nanotubes

1
School of Materials Science and Engineering, Inner Mongolia University of Technology, Hohhot 010051, China
2
School of Physics and Intelligent Manufacturing Engineering, Chifeng University, Chifeng 024000, China
*
Author to whom correspondence should be addressed.
Crystals 2022, 12(8), 1094; https://doi.org/10.3390/cryst12081094
Submission received: 12 July 2022 / Revised: 27 July 2022 / Accepted: 2 August 2022 / Published: 4 August 2022
(This article belongs to the Section Inorganic Crystalline Materials)

Abstract

:
Ce-doped TiO2 nanotubes (Ce-TNTs) were synthesized by a hydrothermal method to obtain high-efficiency adsorption and photodegradation abilities for methylene blue (MB) dye. The transmission electron microscope (TEM), X-ray diffractimeter (XRD), nitrogen adsorption, X-ray photoelectron spectrum (XPS), and photodegradation tests were used to characterize the morphology, microstructure, ionic valance, and degradation behaviors of the TNTs. Results show that the Ce-doped TNTs are composed of anatase tubulars with an inner-hole diameter of 5 nm, outer diameter of 10–15 nm, length of several hundred nanometers, and a small amount of CeO2 nanoparticles. Ce3+ and Ce4+are dissolved in the anatase crystals, the ratio of which increases with an increase in Ce addition. Ce-doping yields a higher amount of surface oxygen, which results in a strong physical and chemical adsorption to the cationoid MB. 2.5 mol% Ce-doping produces the largest specific surface area, porosity, and photoabsorption threshold and the lowest Zeta potential, yielding the highest adsorption efficiency and photocatalytic ability even under sunlight irradiation.

1. Introduction

Removal of organic pollutants in water through photodegradation of nanostructured TiO2 is a dominant method to reduce the water pollution because of its strong redox capacity [1]. Many methods were used to prepare the nanocrystals, especially the self-assembly methods such as drop casting, vertical deposition, centrifugation, langmuir blodgett, spin coating, and dip coating [2]. Compared to the TiO2 nanoparticle (TNP) and the nanofilm (TNF), one-dimensional TiO2 nanotube (TNT) shows higher photocatalytic activity due to its larger specific surface area and stronger physicochemical activity. In addition, doping TiO2 with transition metals (Cu and Fe), noble metals (Pt, Pd, and Ag), and nonmetallic elements (S and N) [3,4,5,6,7] further improve the properties by reduction of band gap and improvement of separation of electron–hole pairs, while combining TiO2 with other metal oxides (e.g., ZnO, Al2O3, and rare-earth oxides) into composites was also adopted in the photodegradation area [8,9,10].
Rare-earth-element doping and composite of nanostructured TiO2 are the most attractive amongst them. Shi et al. [11] confirmed that Ce4+ doping has a significant effect on the resistance to growth of anatase crystals from gel and to transformation to rutile, which helps to prepare the ultrafine anatase crystals and enhance their thermal stability. Barkul et al. [12] observed that the band gap of Ce-doped TNPs decreases and the photocatalytic activity for degradation of methylene blue (MB) increases with an increase in dopant concentration from 1.0 mol% to 5.0 mol%. Rong et al. [13] noticed that in the 5 mol% Ce-doped TNPs synthesized by a sol–gel method, Ce-doping increases the visible light absorbable range and an increase in calcination temperature enhances the lattice oxygen, reduces the absorption oxygen and Ti2p3/2 binding energy, and Ce3+ oxidizes to Ce4+ as well. Asemi et al. [14] used a hydrothermal method to fabricate Ce-doped TiO2 nanorod arrays on a tin oxide glass, and they found that 3 mol% of Ce-doping has a maximum electrical conductivity and better photovoltaic performance, which was ascribed to the formation of oxygen vacancy in the nanostructures. Touati et al. [15] observed that 1 wt% Ce-doping significantly inhibits the electron–hole pairs recombination and reduces the energy gap of the sol–gel-derived TiO2 catalysts, which has 40% and 55% of conversions for TOC and color, respectively. Chung et al. [16] found that the photocatalytic performance of Ce-doped TiO2 thin films at lower doping is due to a less densely packed array of fine grains, while the performance at higher doping levels is ascribed to the liquid formation, greater packing densities, and blockage of active sites. The occurrence of Ce-Ti intervalence charge transfer and the oxygen vacancy lowers the band gap, reduces the recombination rate, and enhances the radiation absorption. Lutic et al. [17] prepared a Ce-doped TiO2 mesoporous, and their photocatalytic tests indicated the yields of up to 72% for Rhodamin 6G decolorization under a UV irradiation due to the synergetic effect of Ce3+, Ce4+, and Oα species. Shi et al. [18] noticed that Ce-doping leads to lattice distortion and expansion of TNPs, which brings about a red-shift of absorption and improves the photocatalytic activity for methyl orange. Suhaili and Jais [19] found that the higher Ce3+ content results in shifting of absorption edge to long wavelength, which consequently lowers the band gap energy of TNPs; 1.0 wt% Ce-doping offers the lowest band gap and thereby the best photocatalytic activity. Reli et al. [20] observed that 0.6–1.4 wt% Ce-doping makes the spectral response of sol–gel-derived TiO2 photocatalysts move to the visible light region; it significantly decreases with increasing the Ce loading. Alberoni et al. [21] synthesized 0.25–5.0 wt% Ce-doped TiO2 photocatalysts by a hydrothermal method. The CeO2-TiO2 nanoparticles and nanotubes were very active under UV light. The 0.25 wt% CeO2-doping yielded a MB degradation rate of 85% under UV irradiation for 120 min. Xue et al. [22] prepared Ce-doped TNTs through a hydrothermal treatment and impregnation method. Their absorption properties of visible light strongly depended on the Ce contents and calcination temperature. In addition, Ce-doping enhanced the photocatalytic activity for glyphosate, in which the 0.15 mol% Ce-doped TNTs show the best photocatalytic activity and the highest degradation rate of 76%. Qu et al. [23] used a sol–gel method and anodic aluminum oxide template to synthesize a TiO2/CeO2 core–shell TNT array, which exhibits the highest photocatalytic degradation efficiency of 80% for methyl orange under UV irradiation. Eleburuike et al. [24] prepared CeO2-modified TNTs by impregnating CeO2 on the hydrothermally-synthesized TNTs, in which the 9.0 mol% CeO2 addition shows 80.8% of photocatalytic degradation rate for PQ (paraquat dichloride). Moreover, Liang et al. [25] prepared 0–5 mol% Nd-doped TNPs and found that the 1 mol% Nd-doped TiO2 exhibits the highest photocatalytic activity of 96.5% for methyl orange. Parnicka et al. [26] synthesized the well-ordered TiO2-RE2O3 nanotubes using an anodic oxidation of Ti90RE10 alloy (RE = Ho, Er, Nd, Y, Ce, Tm) as a working electrode, which also has a better ability to remove pollutants from water and air. However, Rozman et al. [27] found that modification with rare earth elements is detriment of photocatalytic activity of the hydrothermally synthesized TiO2 nanoflakes despite having a light absorption threshold of 585 nm. The reason for the lower activity was related to the lower Ti3+/Ti4+ ratio and less hydroxyl oxygen.
The above studies about the Ce-doped TiO2 nanostructure were mainly focused on the photocatalytic behaviors. However, in the case of rapid removal of serious organic pollutants in a river or lake, it is very difficult to rapidly remove the pollutants merely by the photocatalytic reaction because it requires a long time, more than 60 min even using the best photocatalyst. In contrast, usage of TNTs to rapidly adsorb pollutants is alternative because of their higher specific surface area and surface activity. However, the adsorption behavior of TNTs, especially the Ce-doped TNTs, has not gotten great attention. Moreover, the preparation and microstructure of Ce-doped TNTs have not been sufficiently studied, which can largely influence their adsorption behavior. Here, we investigate the effects of Ce-doping (2.5–10.0 mol%) on the microstructure, surface characteristics, and absorption behaviors of TNTs so as to obtain an absorbent with high efficiency for removal of organic pollutants under sunlight irradiation.

2. Materials and Methods

Tetrabutyl titanate (C16H36O4Ti), cerium nitrate (Ce(NO3)3.6H2O, 99.5 wt%), absolute alcohol(C2H5OH), NaOH, and HCl (Sino farm Chemical Reagent Co., Ltd., Shanghai, China) were used as precursors. Methylene blue (MB, C16H18ClN3S·3H2O) was used as a pollutant.

2.1. Preparation of Ce-Doped TNPs

To prepare the Ce-doped TNTs, a sol–gel process was firstly adopted to synthesize their precursory nanopowders. Tetrabutyl titanate (80 mL) was hydrolyzed in 320 mL of absolute alcohol to form sol. The sol was evenly divided and poured into four beakers. Different amounts of cerium nitrate (0, 0.638 g, 1.276 g, and 2.552 g) were respectively added into the beakers to obtain mixed sols by stirring and ageing for 24 h. Dilute acetic acid solution (10 mol/L) was titrated into the sols until gels formed. The gels were aged for another 24 h and dried at 100 °C. The dried gels were calcinated at 500 °C for 2 h and then milled and screened into powders with a granularity range of 74–63 μm. Thus, the Ce-doped TNPs with 0.0, 2.5, 5.0, and 10.0 mol% Ce-doping were obtained.

2.2. Preparation of Ce-Doped TNTs

A hydrothermal process was adopted to prepare the TNTs. TNP (0.3 g) was placed in a stainless-steel (50 mL) reactor filled with a 10 M and 23.5 mL NaOH aqueous solution (10 mol/L, 23.5 mL), which was sealed and heated to 150 °C and kept for 12 h. The obtained samples were repeatedly washed with dilute HCI solution and deionized water until neutral. The washed samples were dried at 80 °C for 12 h to obtain the TNTs. ICP measurement of the waste liquid only found that trace Ce remained, indicating that Ce is roughly not lost during the synthesis.

2.3. Adsorption and Photochemical Tests

The experiments were divided into three groups at room temperature: (1) adsorption test under natural light, (2) photocatalytic test under UV light after 30 min of dark treatment, and (3) photodegradation test under UV and natural light irradiation.

2.3.1. Adsorption Test

10 mg of TNT samples were respectively added into 30 mL MB solutions. The solution was magnetically stirred throughout the adsorption process in dark condition. The TNT sample was intermittently separated out by a centrifuge; the concentration of dye in the filtrated solution was analyzed using a UV-Vis spectrophotometer (UV-3101PC, Kyoto, Japan). The adsorbed amount of dye (Qe) per unit mass of TNT was calculated by the following equation [28]:
Q e = ( C 0 C e ) V m
where C0 and Ce are the initial and equilibrium concentrations (mg/L), respectively, m is the mass of adsorbent (g), and V is the volume of solution (L).

2.3.2. Photocatalytic Test

The MB concentration of the solutions after a dark treatment of 30 min was inspected as reference in upcoming photocatalytic reaction. The solutions were irradiated up to 60 min by an ultraviolet lamp with a weaker power (50 W, 356 nm). The absorbance of the solutions cleaned by centrifugal separation was inspected every 10 min. The degradation ratio was obtained by the following formula [29].
A = 0.019 + 0.197 × C
η = Ct/C0
where A is the absorbance, C is the concentration of MB in solution, C0 is the original concentration (reference), and Ct is the concentration in time; η is the degradation ratio.

2.3.3. Photodegradation Test

10 mg of TNT sample was added into 30 mL of MB solution (10 mg/L), which was irradiated by UV and sunlight, respectively, without dark treatment. The degradation ratio of dye solutions was calculated by the following equation [30].
D = ( C 0 C e ) C e × 100 %
where C0 and Ce are the initial and equilibrium concentrations of dye (mg/L).

2.4. Characterizations

The structure and morphology of TNT samples were analyzed by a transmission electron microscope (TEM, Tecnai G2 F20 S-TWIN, FEI, California, America). A Cu mesh and Si substrate as sample carrier were used. Powder sample was dispersed in a 3 mL alcohol and supersonically treated. Then the mixture containing sample and alcohol was injected on the Cu mash and dried for measurement. The phase composition was inspected by an X-ray diffractometer (XRD, D/MAX 2500PC Rigaku) with a Cukɑ radiation and scanning speed of 3°/min. The surface area, pore volume, and pore size were evaluated by a nitrogen adsorption test (3H-2000PS2, BeiShiDa, Hefei, China). The zeta potential was measured using a StabinoR Particle Charge Mapping analyzer. The valance of elements was inspected by an X-ray photoelectron spectra (XPS, SCALAB 250Xi, Thermo Fisher Scientific, Tokyo, Japan) using MgKa as X-ray radical source.

3. Results and Discussion

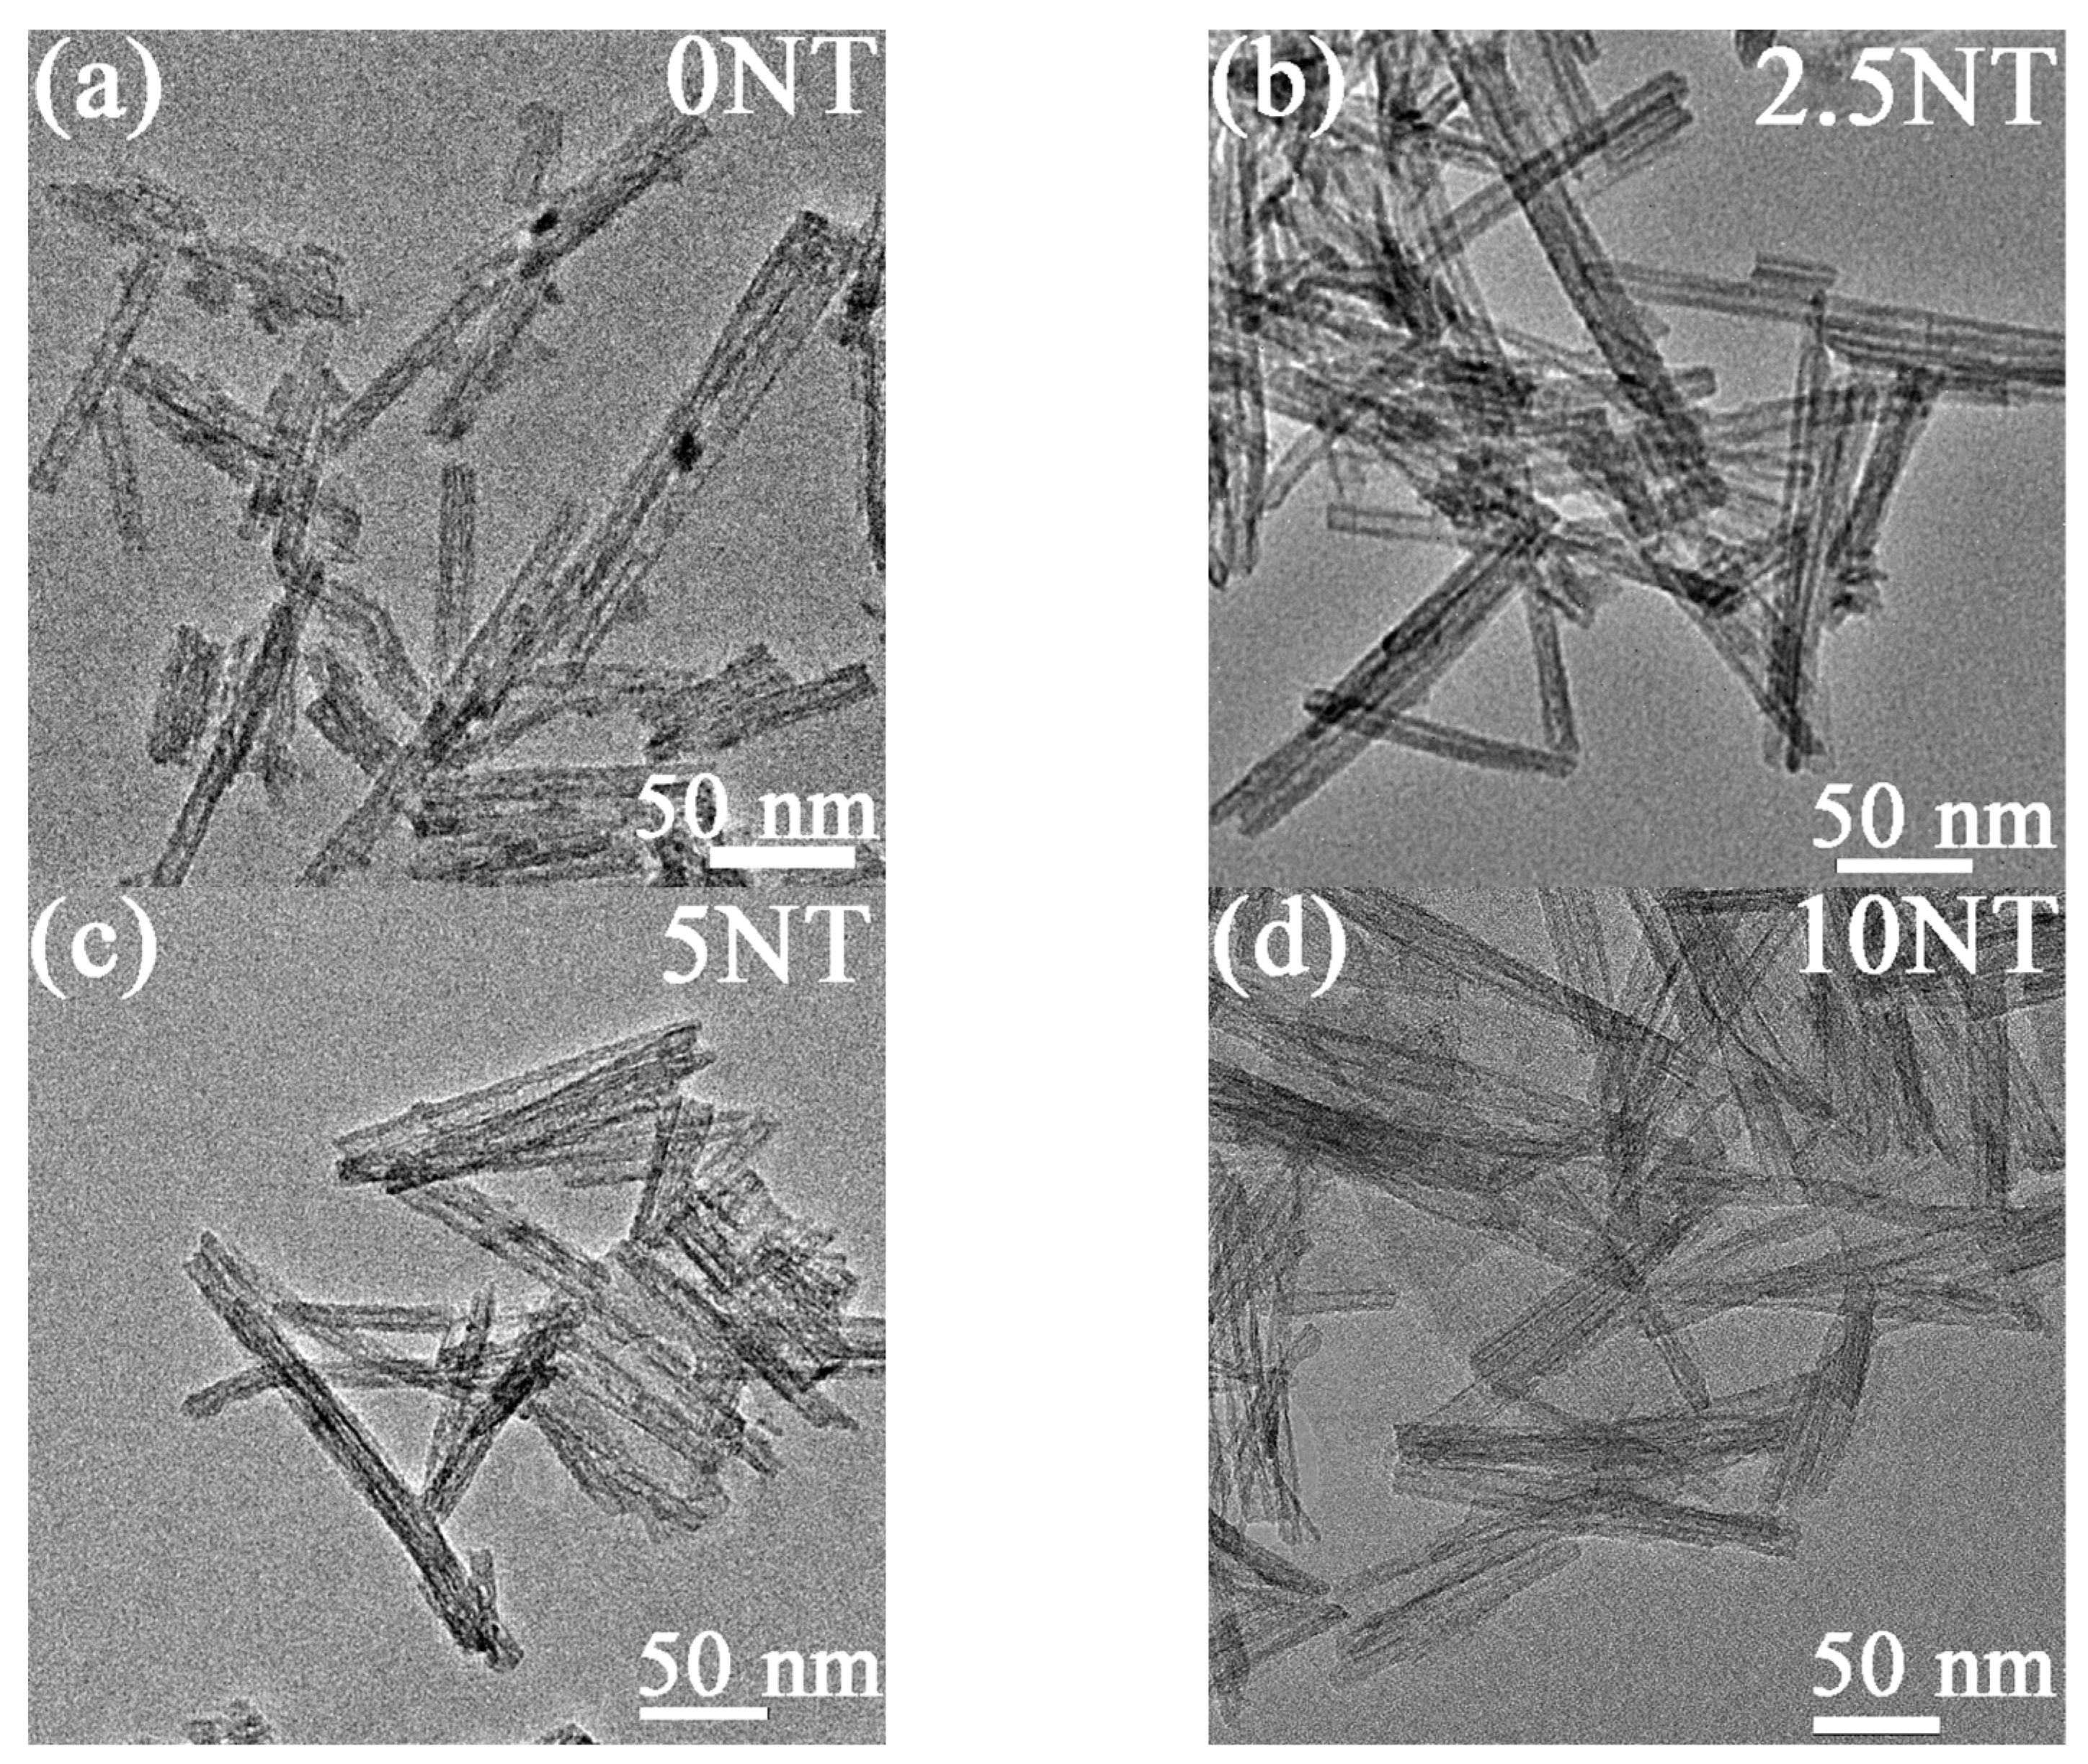
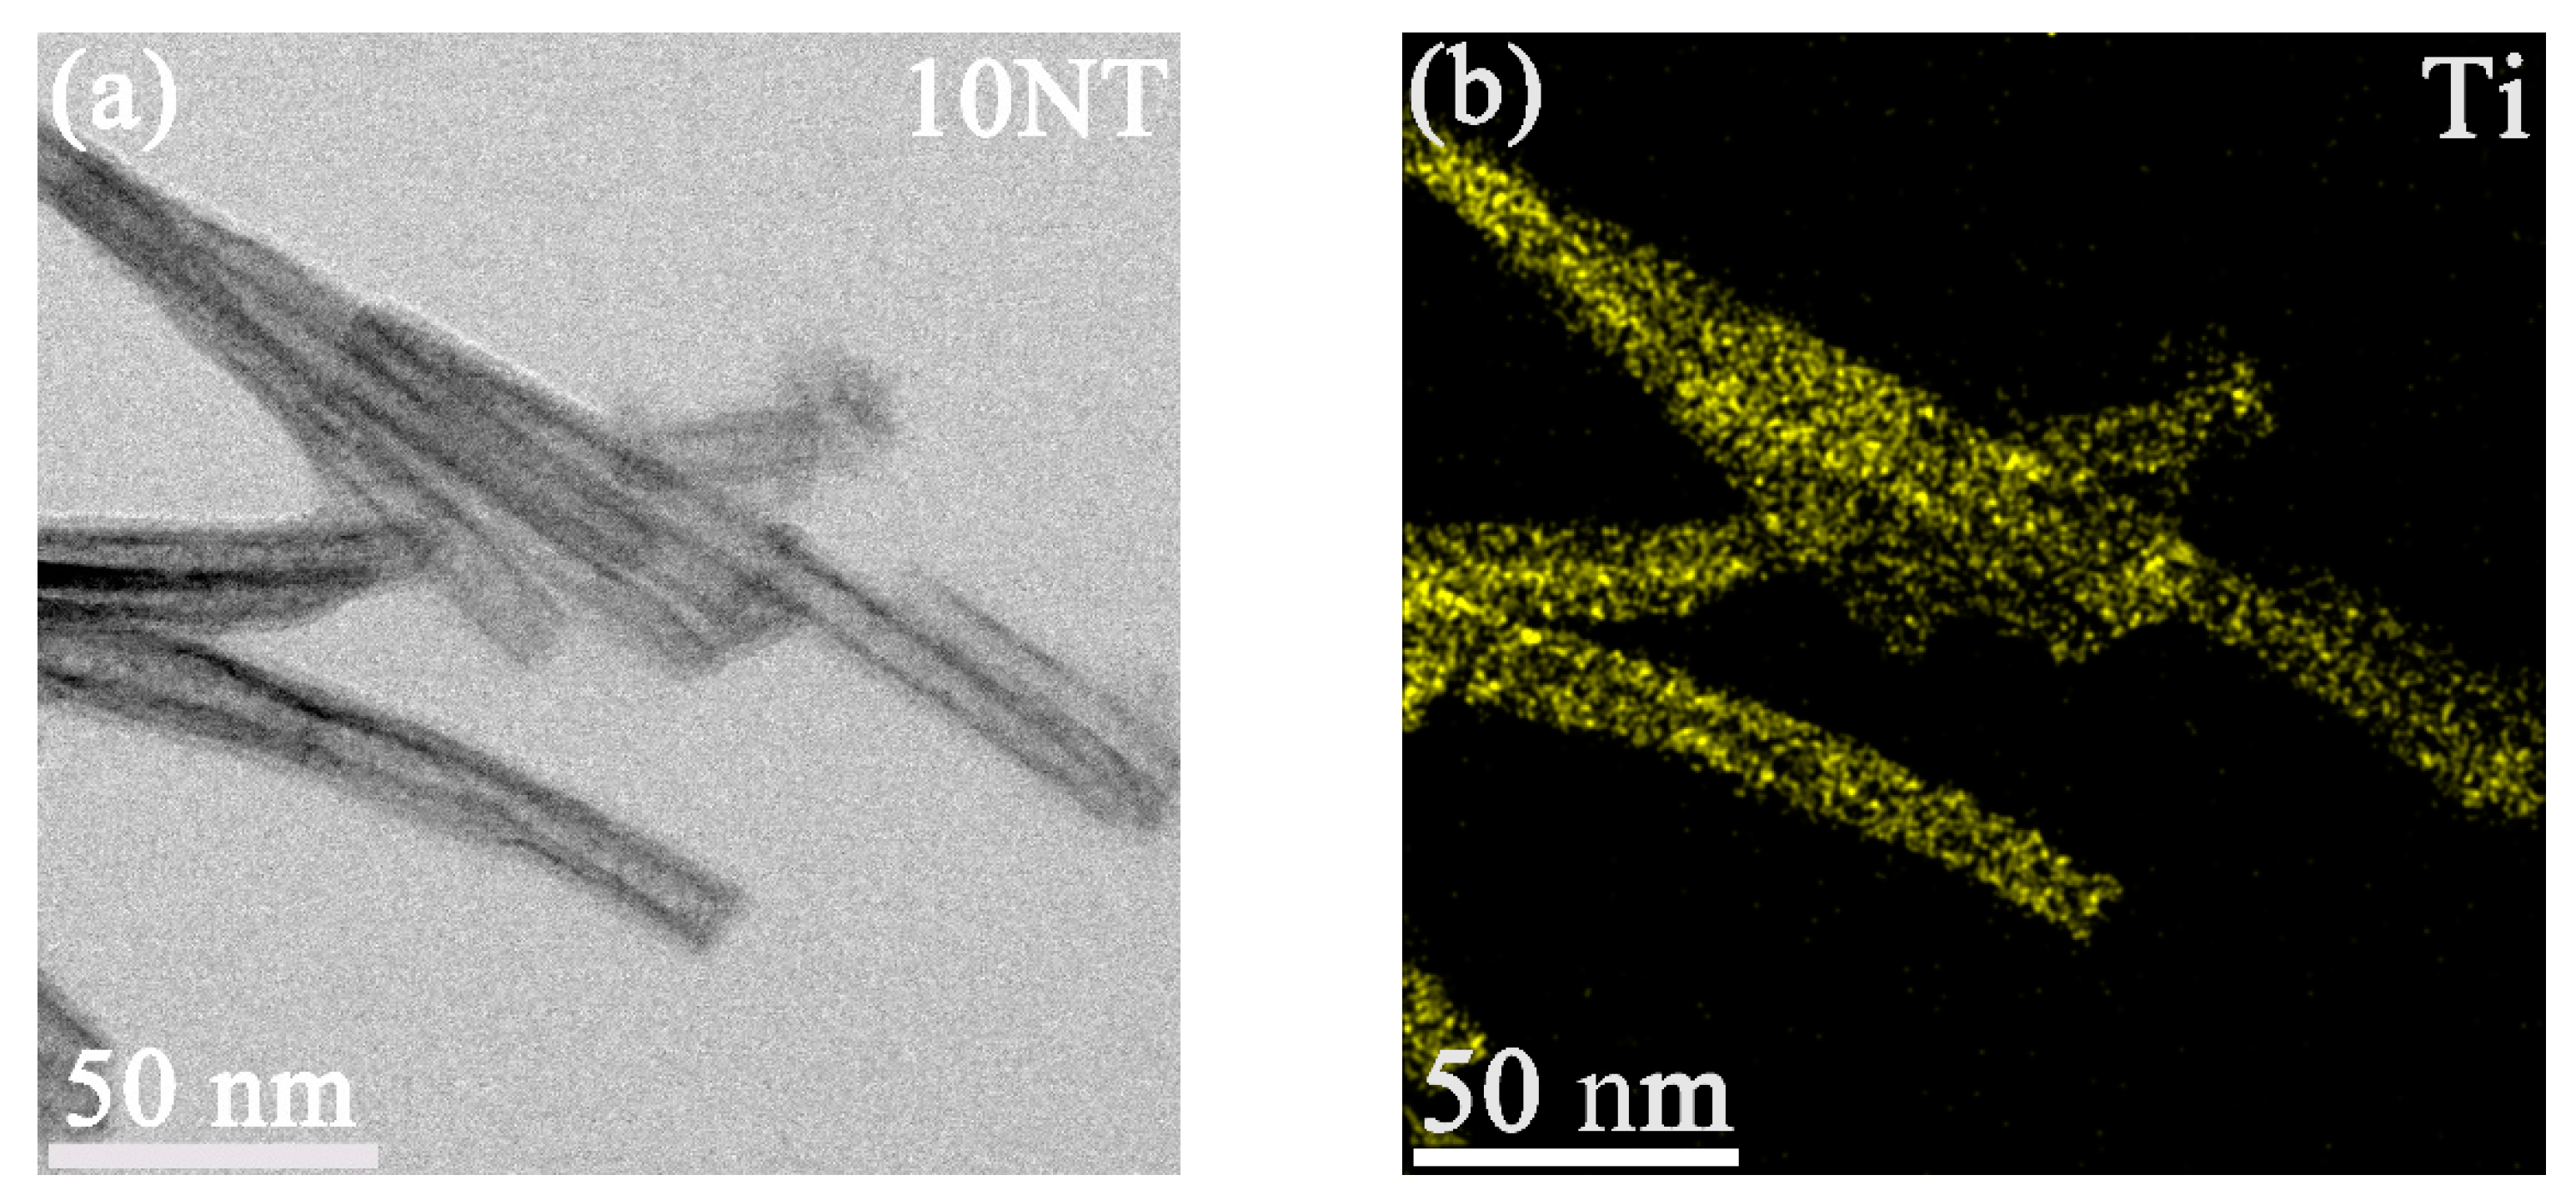
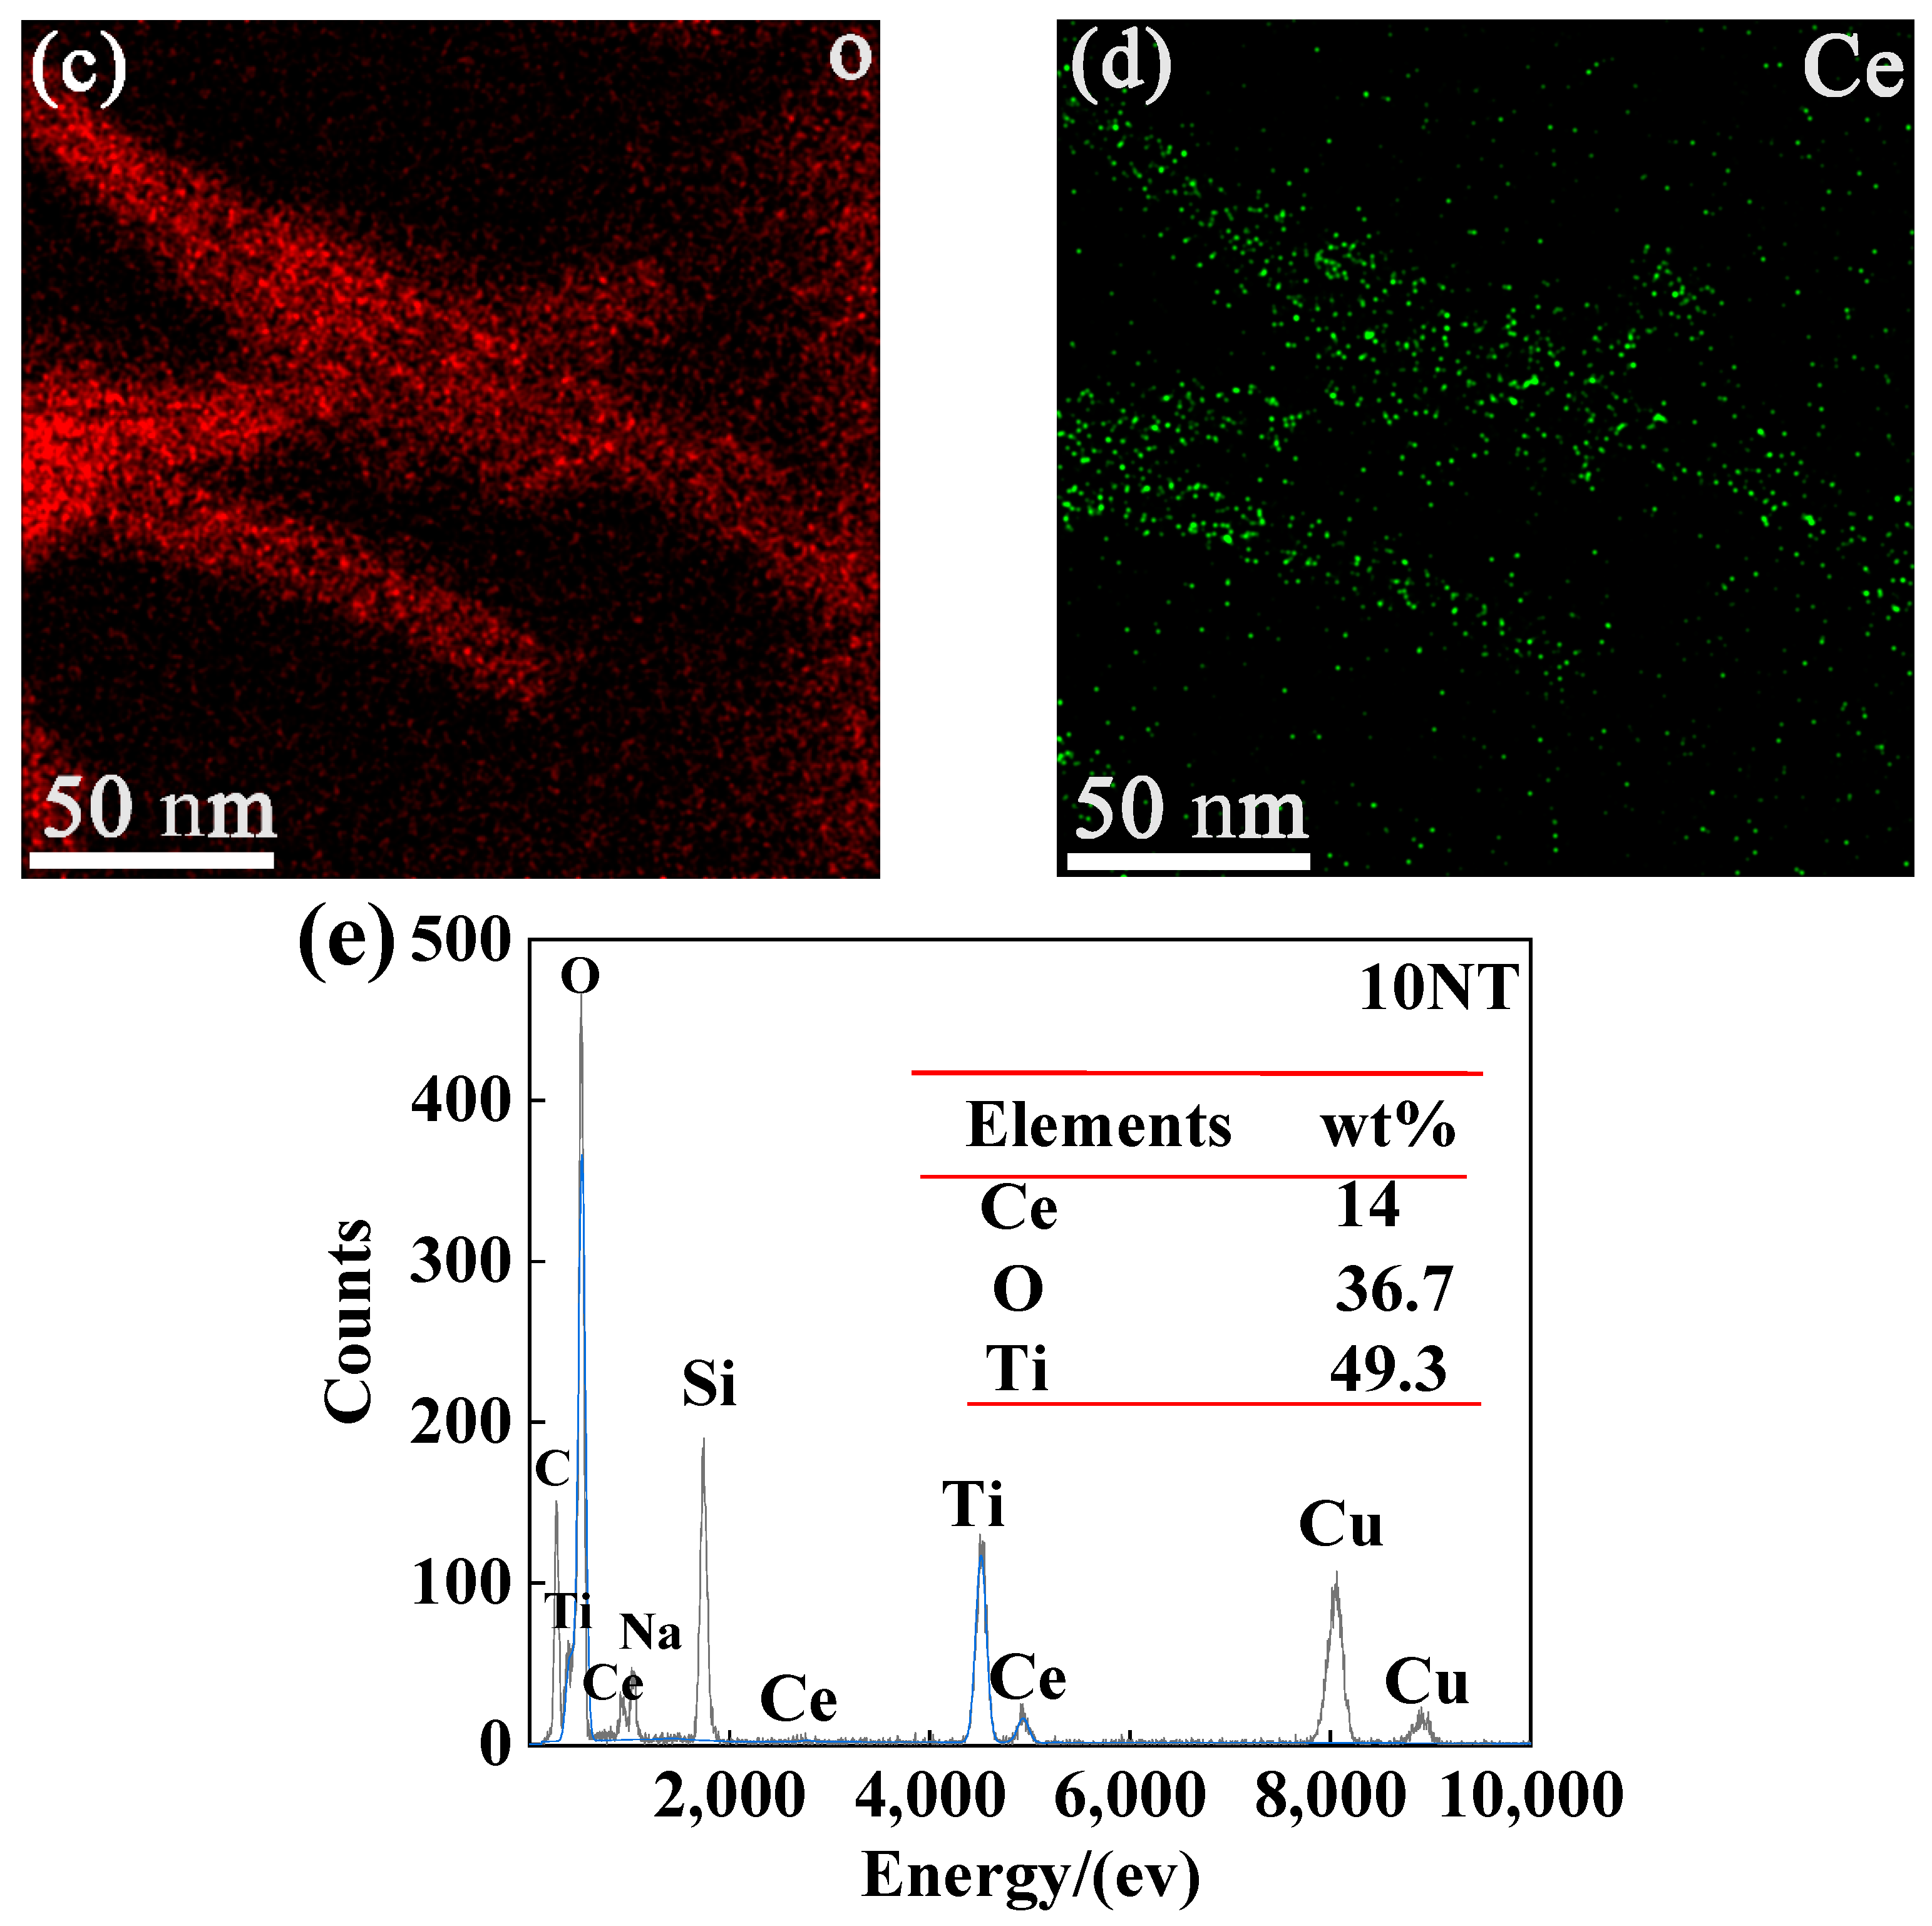
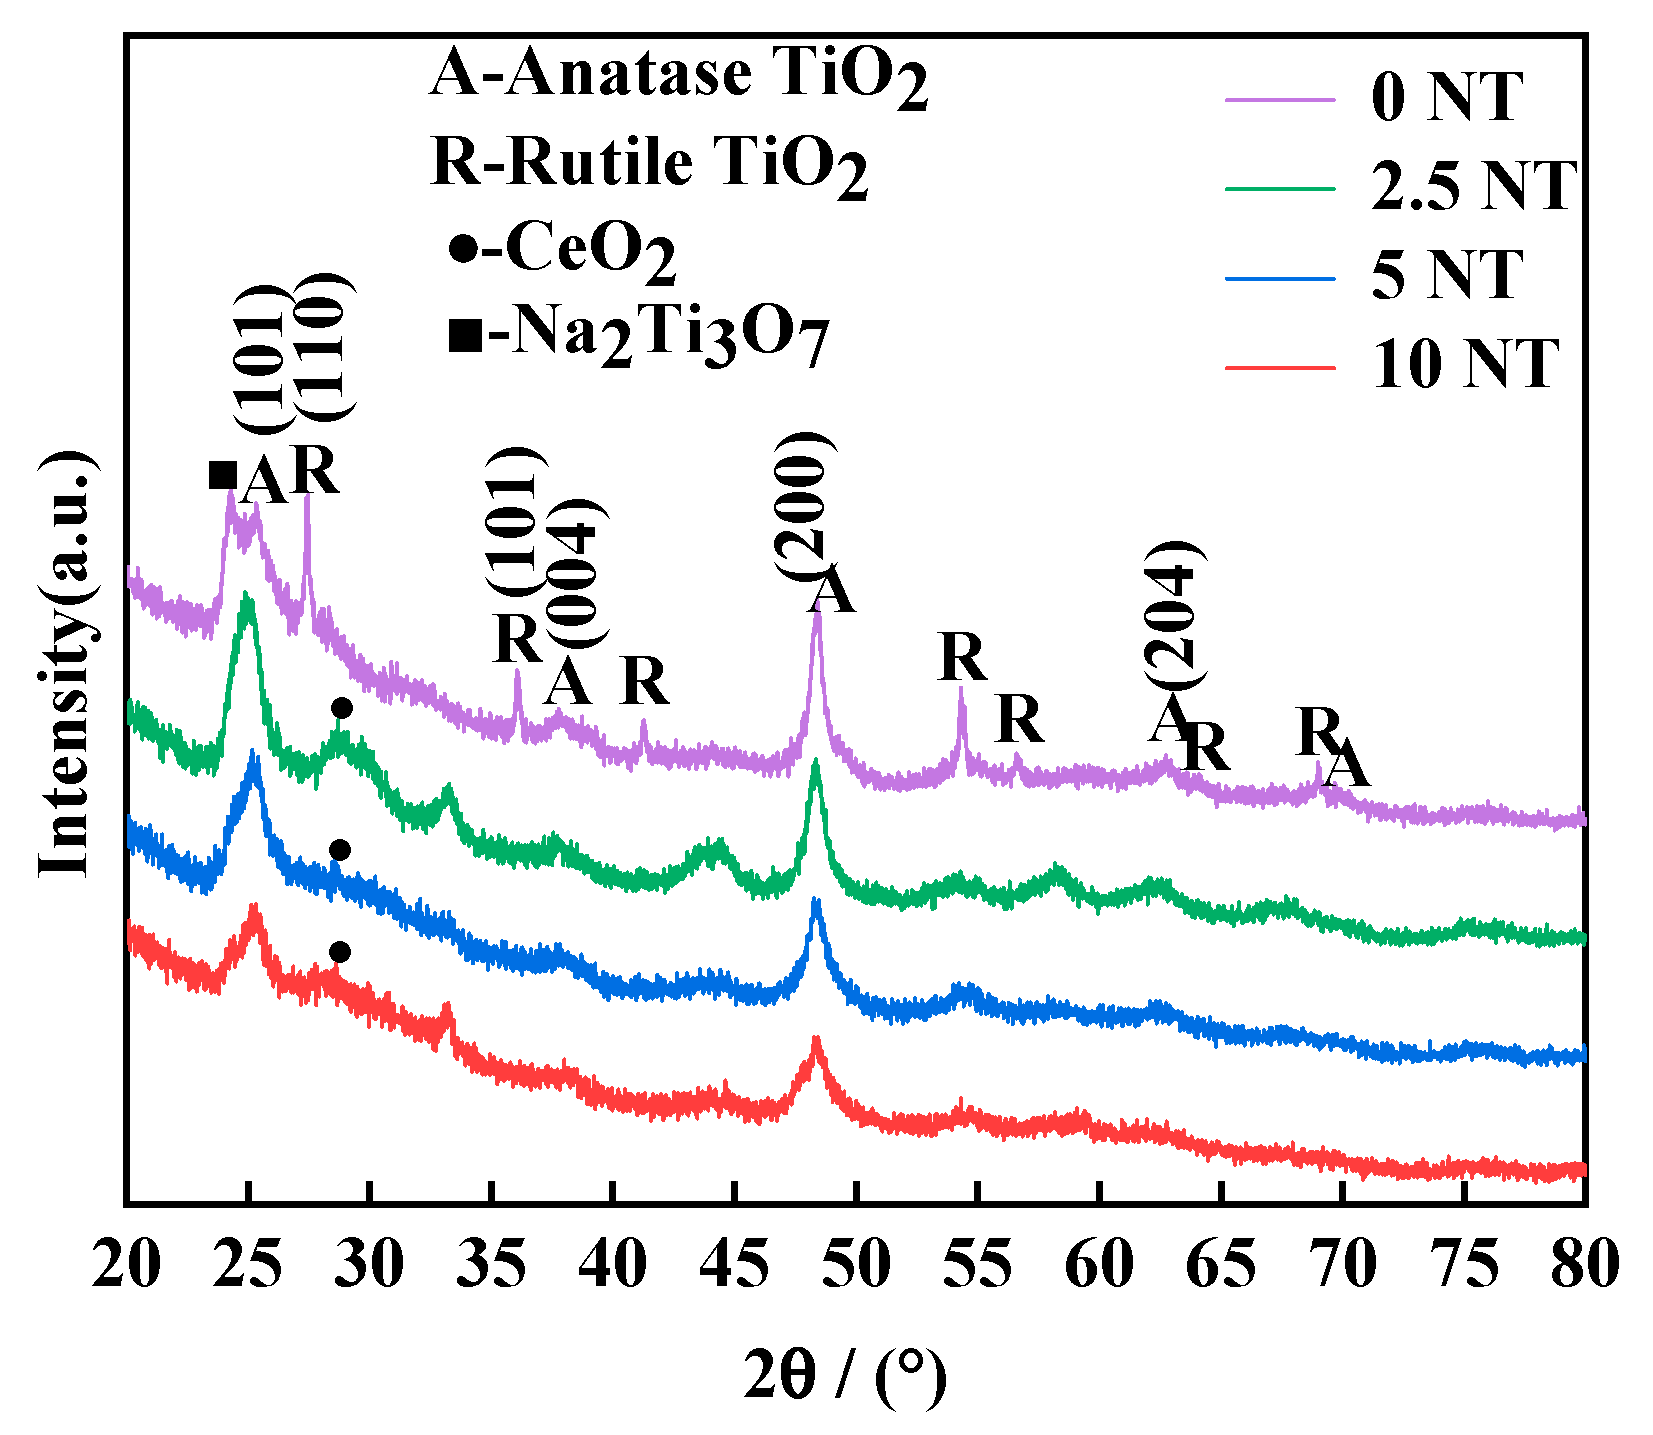
3.1. Morphology and Phase Composition of the TNTs

A Cu mesh as sample carrier was used. Powder samples were dispersed in a 3 mL alcohol and supersonically treated. Next, the mixture containing sample and alcohol was injected on the Cu mash and dried for measurement. The TNTs exhibit a tublar structure with an inner-hole diameter of 5 nm, an outer diameter of 10–15 nm, and a length of several hundred nanometers (Figure 1). Ce-doping slightly decreases the inner and outer diameters. The formation mechanism of TNTs turns out to be the result of the crystal planes in TNPs being layered in alkali solution, which were then scrolled into nanotubes to reduce the surface energy [31]. Ce ions are dissolved in TiO2 lattices and generate weaker Ti-O-Ce bonds, which decreases the combination between the layers and is favorable to scroll into nanotubes. Moreover, the addition of Ce ions enhances the lattice energy, which resists the growth of nanotubes and accordingly results in smaller nanotubes.
The EDS is a sum spectrum of the area covering the maps; it reveals the presence of Ti, O, Ce, and trace elements such as Na, C, Si, and Cu. The Si signal was originated from the substrate (silicon wafer) and the C and Cu signals came from the Cu mesh and C support; Na and C were derived from the chemical reagents. The EDS mapping image (Figure 2) demonstrates that Ce elements are dissolved in the lattice of the TNTs. The XRD analysis proves undoped TNT to compose of anatase (JCPDS: 84-1285), rutile (JCPDS: 83-2242) phases, and a few Sodium titanate (JCPDS:72-0148), while the Ce-doped TNT samples are composed of anatase and a small amount of CeO2 (JCPDS:81-0792) phases (Figure 3). The resistance effect of Ce on anatase to rutlie and the phase composition was also confirmed in the Ce-doped TNPs [11].

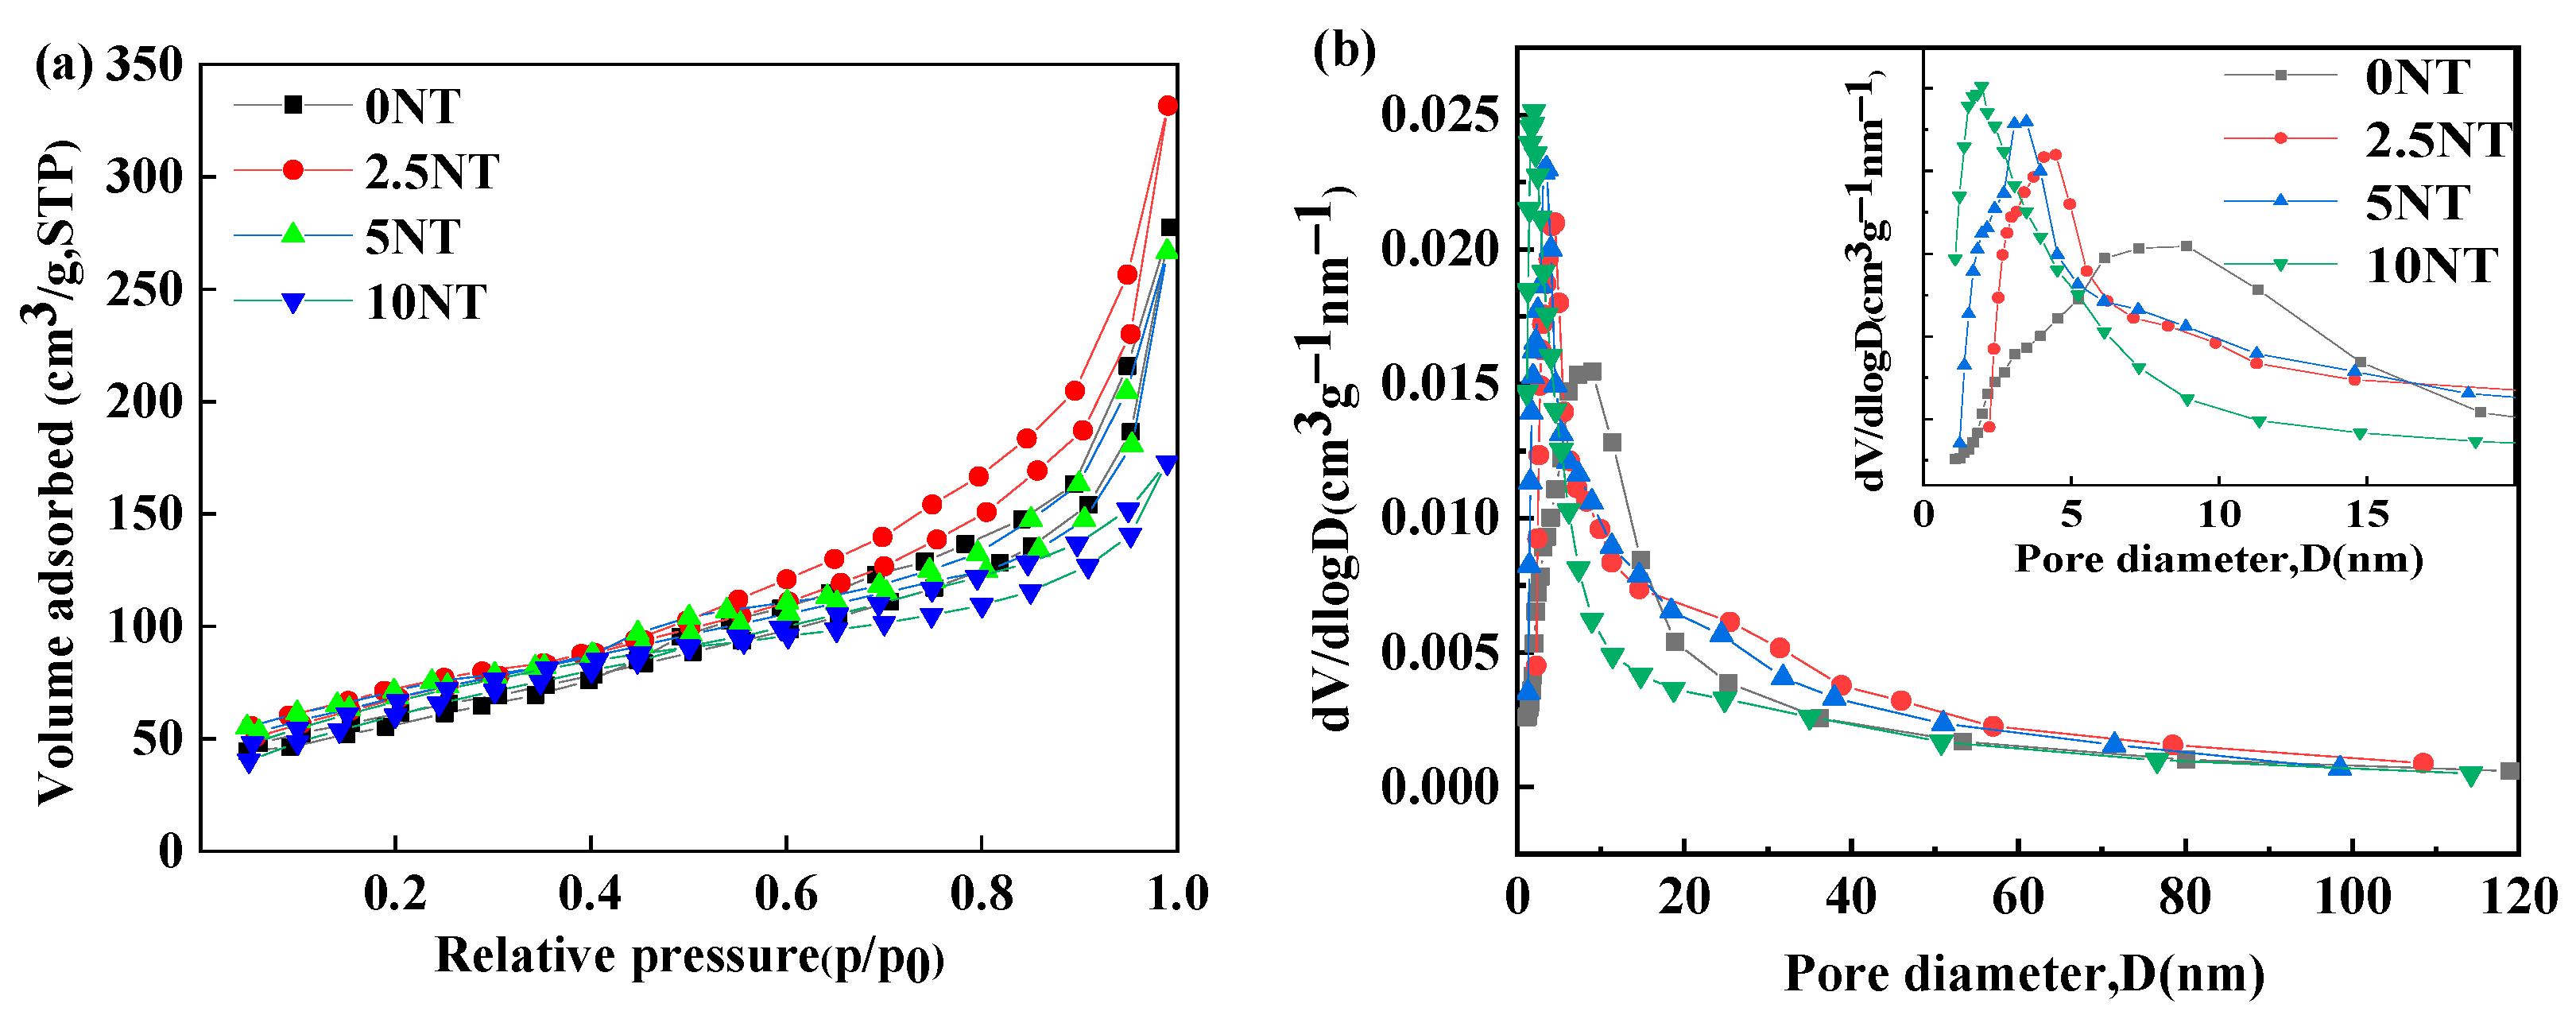
3.2. Specific Surface Analysis

The nitrogen adsorption–desorption isotherm curves of the TNTs are shown in Figure 4. The Ce-doped TNTs have a small hysteresis, which is due to the mesoporous structure with laminar fissure holes [31]. The TNTs have a pore size distribution of ~20 nm, most of which distribute between 2.0~9.0 nm. The larger pore size distribution is unfavorable to the remaining adsorbed gas and formation of the hysteresis loop. The pore size and the distribution ranges slightly decrease with an increase of Ce addition.
The specific surface area is increased with the Ce addition, which is much higher than that of the CeO2-TiO2 heterostructured TNTs [32]. Such an enhancement is due to the reduction of the diameter of the TNTs (Figure 1). The 2.5 mol% Ce-doped TNT has the largest specific surface area (196.01 m2/g) and pore volume (0.49 cm3/g) and the lowest Zeta-potential (−3.64 V) (Table 1), which means that this sample should have a stronger adsorption ability to cations in MB dye.

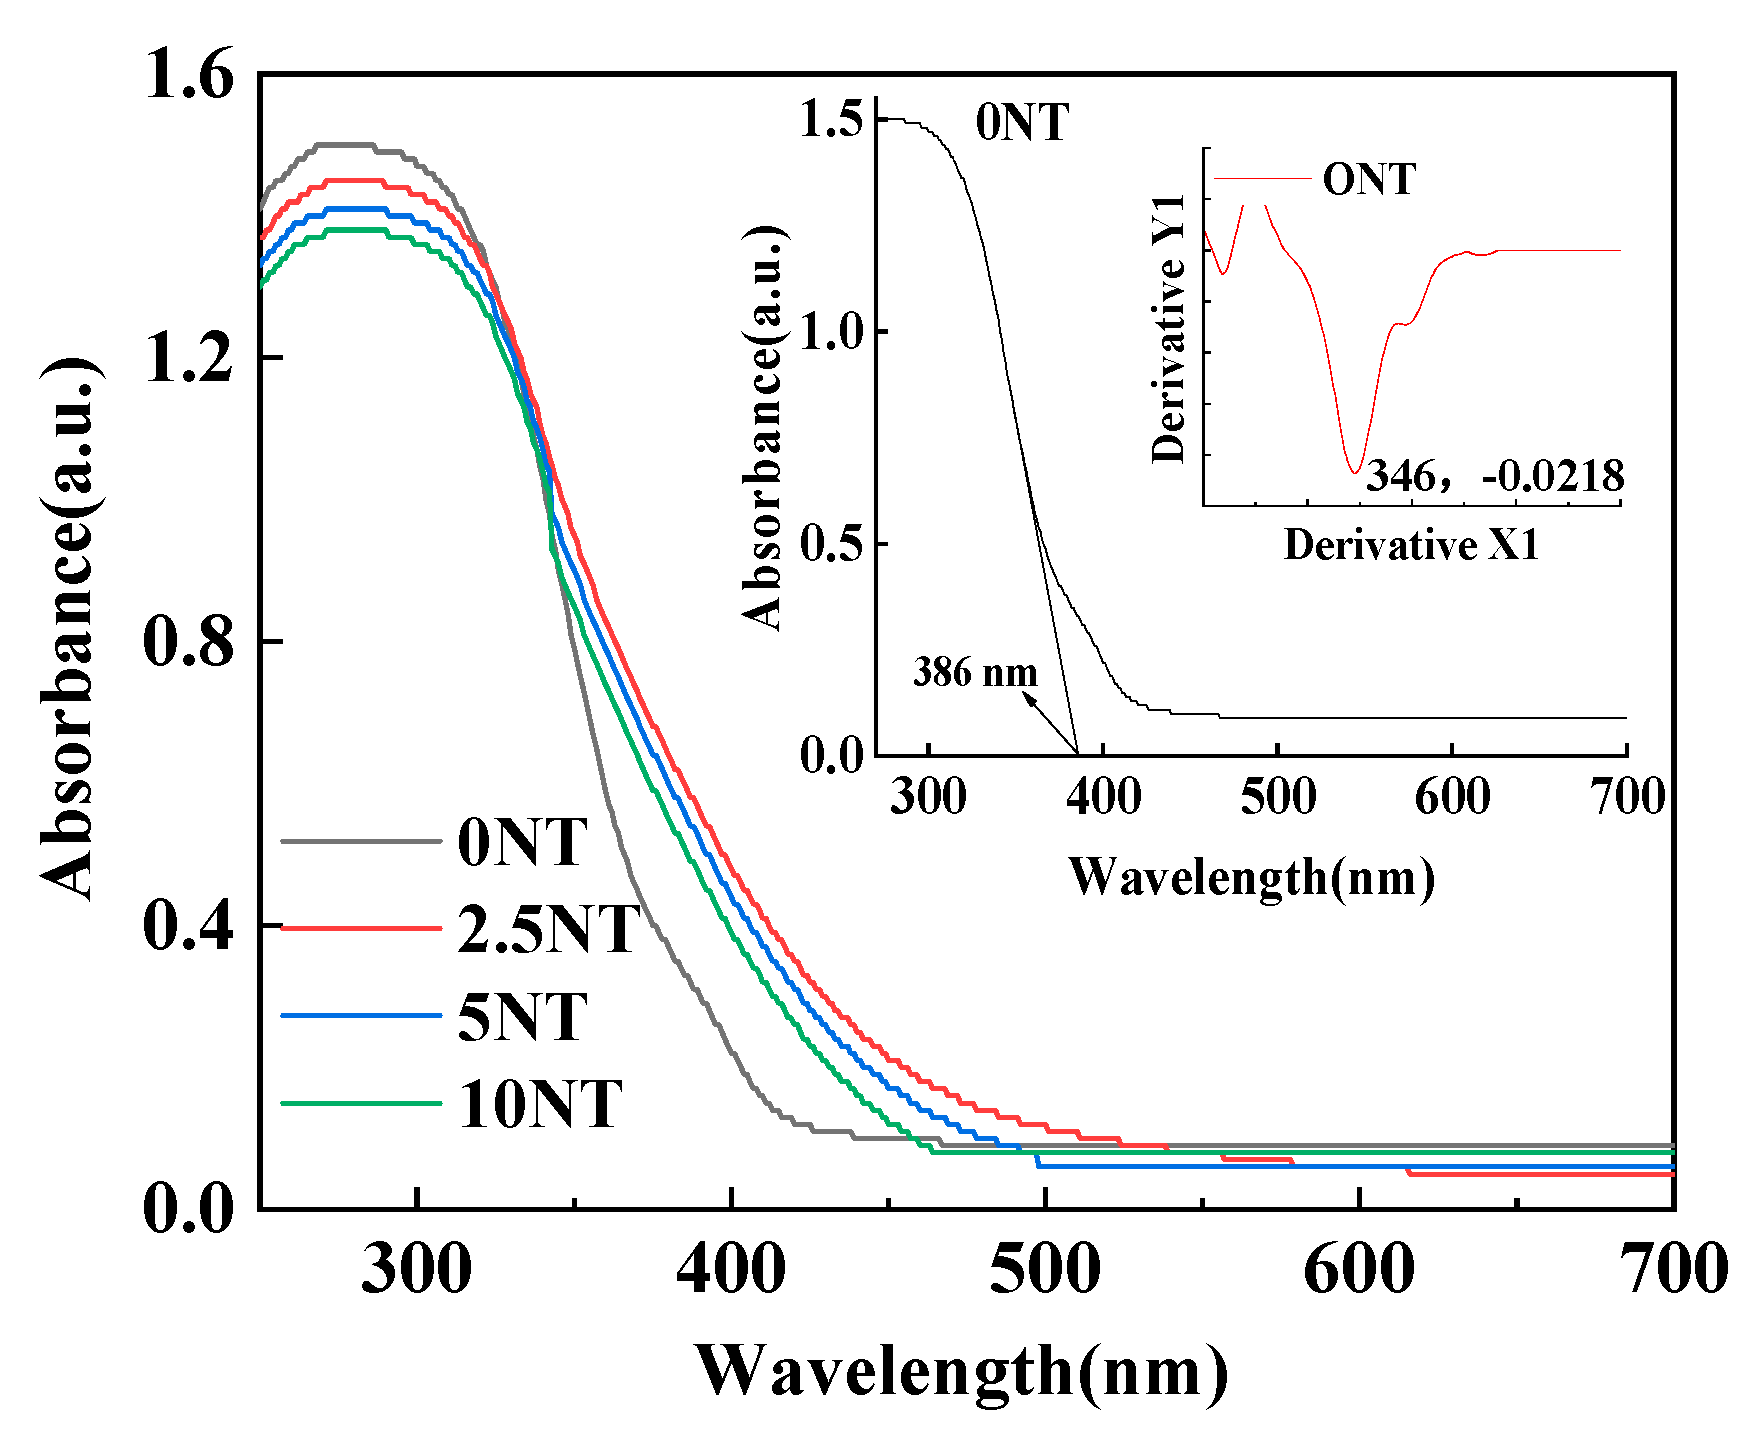
3.3. Photoabsorption of the TNT Samples

The photoabsorption threshold of the samples is red-shifted by the Ce addition (Figure 5). The 2.5 mol% Ce-doped TNT has the highest threshold of 447.96 nm (Table 2). This is attributed to the proper substitution of Ce3- and Ce4+ for Ti4+ cations in the TiO2 lattice, which generates a distortion of the lattice due to mismatch in their radius. Moreover, the substitution of Ce3+ for Ti4+ produces oxygen vacancies in the crystals, which increases the lattice energy, weakens the Ti-O bonds, and makes the electrons easy to jump onto the conduction bands, promoting the separation of electron–hole pairs and inhibiting their recombination [33]. This certainly helps in enhancement of the photodegradation effect of the samples. However, the extra addition of Ce does not have a higher photoabsorption threshold, which is due to more substitution of Ce3- and Ce4+ for Ti4+ in TiO2 lattice resisting the immigration of the electrons to the conduction bands owing to greatly increased lattice distortion [33].

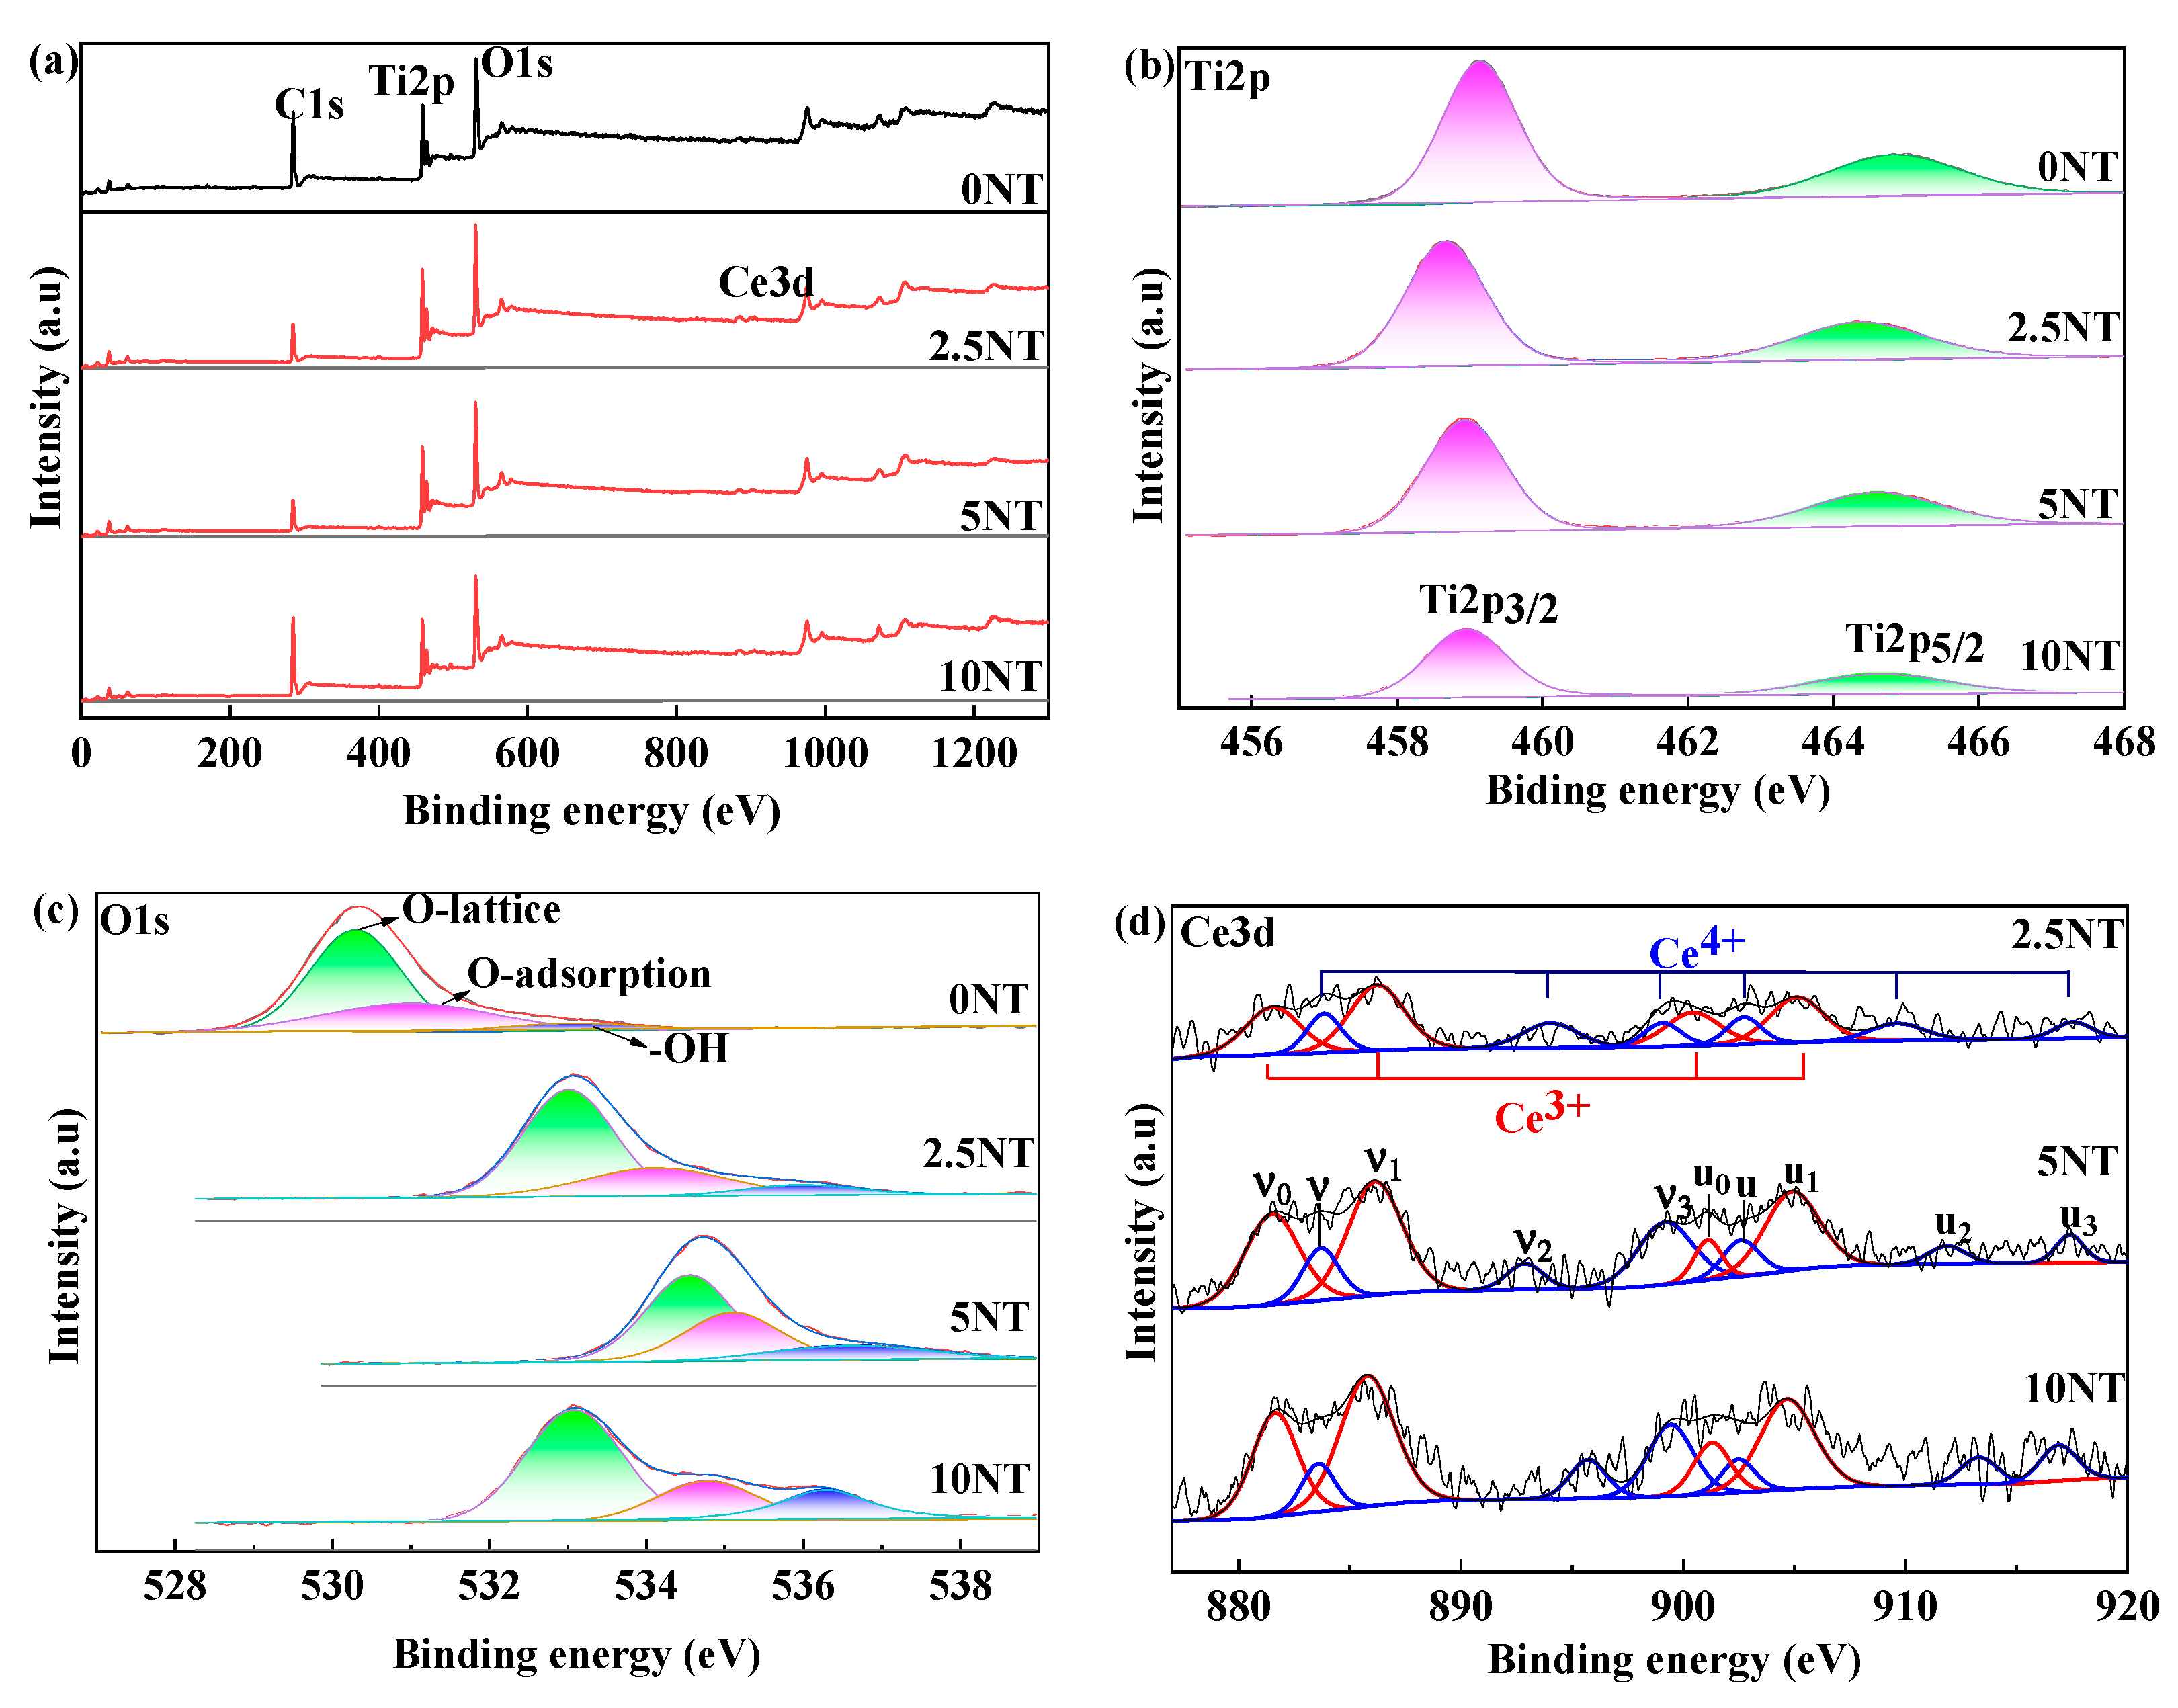
3.4. Valance of Ti and Ce Cations and the Occupation of O2−in Ce-Doped TNTs

The valence of Ti and Ce and the occupation of O2− anions greatly affects the physicochemical behaviors of the TNTs. It can be observed that Ti, Ce, and O elements are presented in the above samples (Figure 6a). The binding energies of Ti2p3/2 and Ti2p1/2 are 458.4 eV and 464.2 eV, which typically result from the octahedral coordinated Ti4+ ions. No Ti3+ ion was identified, as the bands are highly symmetric [34] (Figure 6b). This indicates that the difference in Ce contents does not affect the Ti2p binding energy. However, the Ce-doping results in a small displacement of core level position and an increase in band width of Ti2p3/2 and Ti2p1/2 (Figure 6b).
The O1s band can be split into three bands: lattice oxygen (OL) with a lower binding energy, chemisorbed oxygen (OC) or/and weakly bonded oxygen species, and surface oxygen (OS) by hydroxyl species and/or adsorbed water species with the highest binding energy (Figure 6c) [35].
Ce3d spectra is composed of two bands, labeled v and u, corresponding to the spin-orbit coupling of 3d5/2 and 3d3/2 (Figure 6d) [36]. The bands denoted as v(u), v2(u2), and v3(u3) are related to the photoemission from Ce4+ 3d core level with Ce3d94f2O2p4, Ce3d94f1O2p5, and Ce3d94f0O2p6 final states, respectively. The transfer of electrons from O2p to Ce 4f orbitals increases the electron density of Ce4+, thus decreasing the attraction of Ce nucleus to extranuclear electrons while enhancing the repulsion between electrons. This is why the binding energies of the Ce4+ 3d core level are decreased with the increased number of transferred electrons from O2p orbitals. The v0(u0) and v1(u1,) are also ascribed to the photoemission from Ce3+cations [37]. Based on these observations, it can be concluded that a mixture of Ce3+/Ce4+ coexists on the TNTs. This phenomenon was also confirmed by the study of Luo et al. [7].
Table 3 shows the ratios of different O2− and Ce3+/Ce4+ by a calculation of the band area. The measured total O2− content (OT) increases with Ce addition. However, it occurs within a trend of first increasing and then decreasing when the Ce addition is increased, although the Ce3+/Ce4+ratio increases. This is due to the increase of surface oxygen (Os) being greater than the increase of oxygen vacancy concentration by introducing Ce3+.
The lattice oxygen (OL) content first decreases and then increases, and the contents of OC and OS present the reversed trend with an increase of Ce addition. The increases of chemisorbed oxygen (OC) and surface oxygen (Os) indicate a higher adsorption activity of the Ce-doped TNTs. The extra addition of Ce, such as 10.0 mol%, decreases the concentration of chemisorbed oxygen and surface oxygen again, which may be ascribed to more Ce3+/Ce4+ ions largely occupying the surface active sites, decreasing the physical and chemical bonding between TNT and MB.

3.5. Adsorption and Photocatalytic Behaviors of the Samples
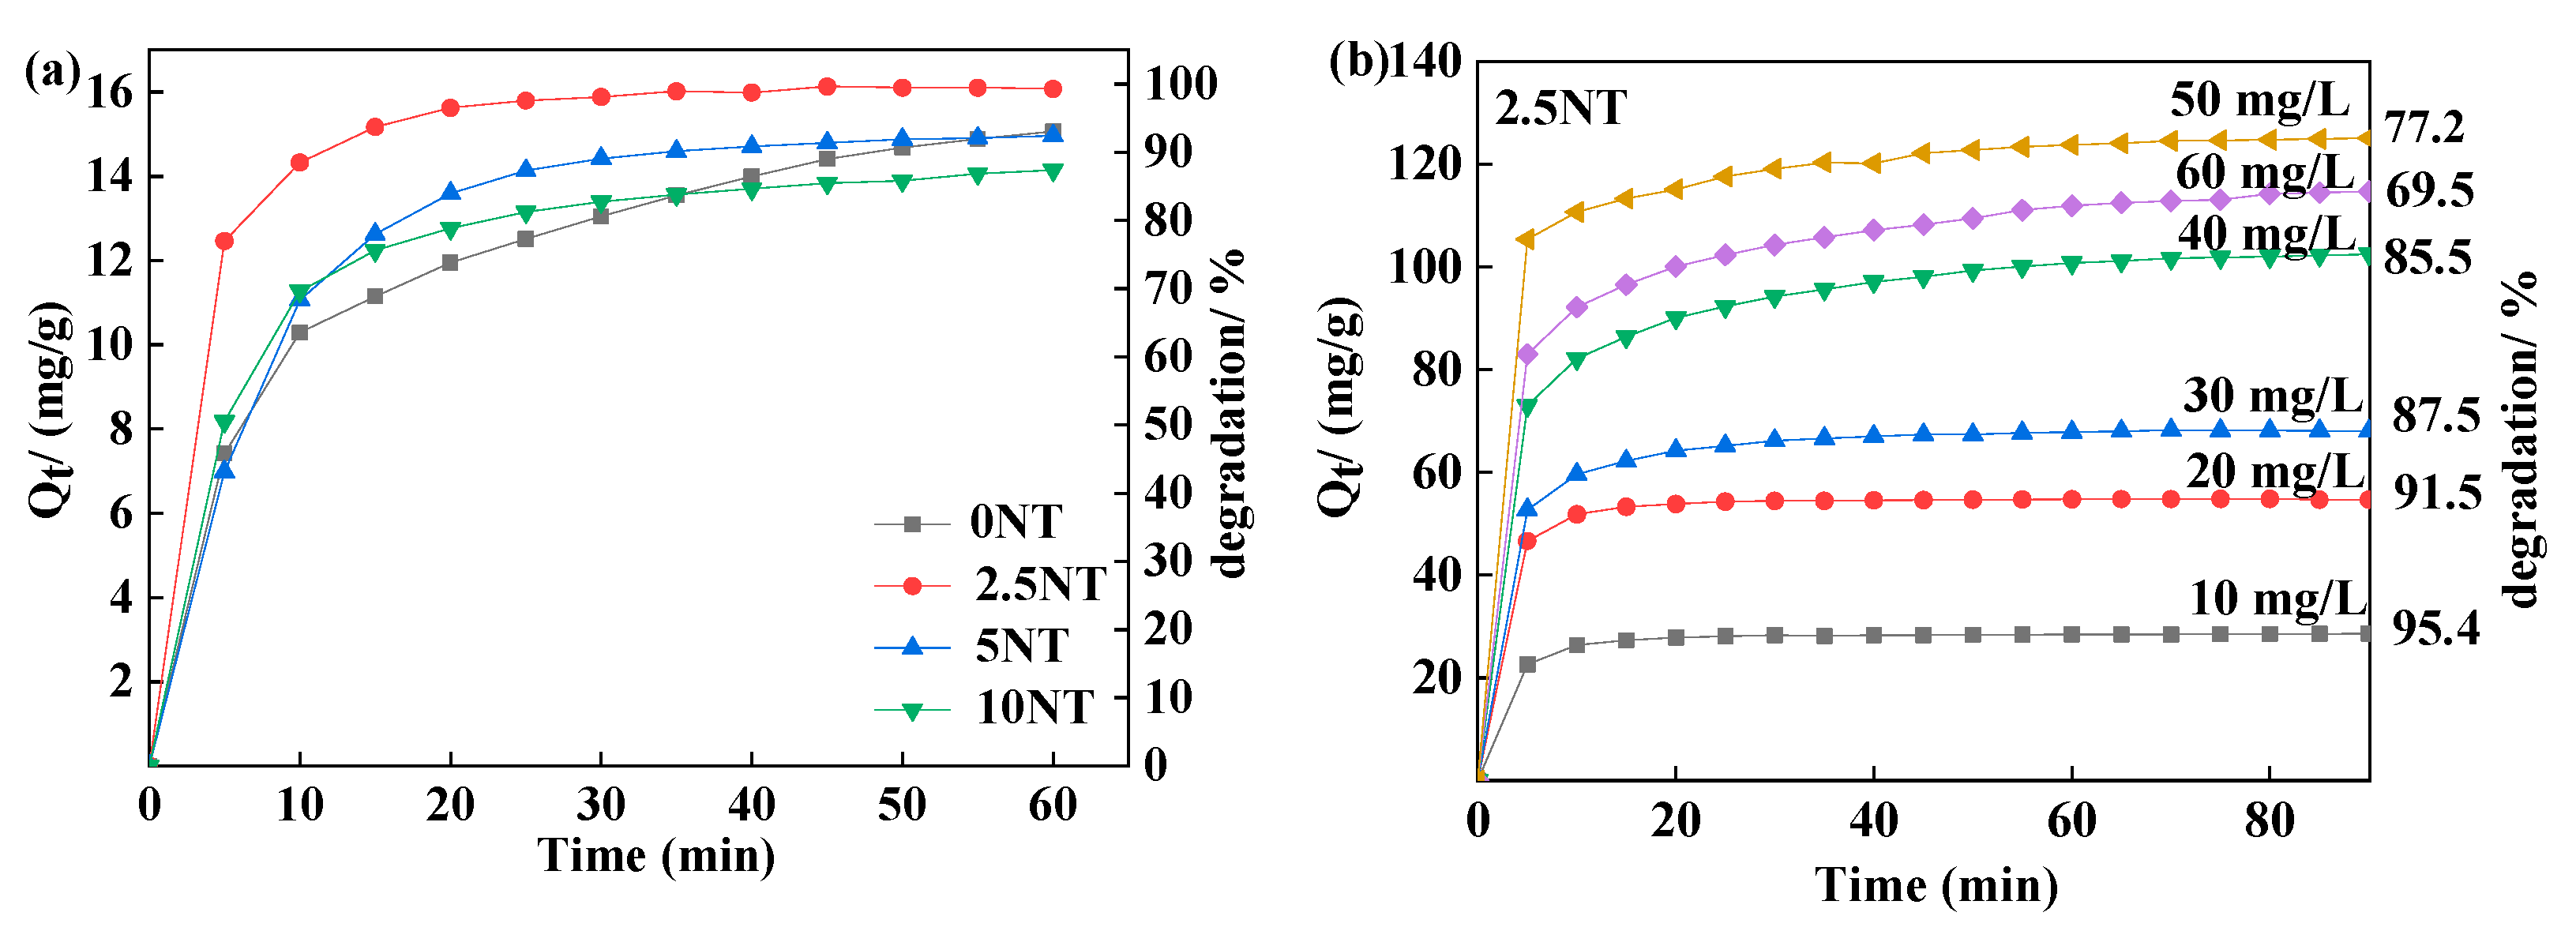
3.5.1. Adsorption

The adsorption experiments were carried out by adding 10 mg of TNTs into a MB dye solution with a concentration of 5 mg/L under a dark condition. All the samples have a fast adsorption rate, in which the 2.5TNT has the highest value, the adsorption amount achieves 16.2 mg/gTNT (removal of 99.3%), and the equilibrium adsorption is attained within 20 min (Figure 7a).
Different MB dye concentrations were used to examine the adsorption effect of the best 2.5TNT sample (Figure 7b). It was observed that the sample has the highest adsorption amount of 125.3 mg/gTNT (removal of 77.4%) in solution with 50 mg/L of MB concentration. Further increasing the concentration to 60 mg/L decreases the adsorption amount to 115 mg/gTNT (removal of 69.5%). This can be attributed to the adsorption-saturated MB molecular excluding further attachment of MB dye onto the TNTs.
This indicates that the 2.5TNT sample has an excellent adsorption ability for the MB dye. This is because the sample has the largest specific surface area, the porosity, the photoabsorption threshold, and the lowest Zeta potential, with the higher chemisorbed and the surface oxygen concentration amongst the samples as mentioned above.
The related adsorption mechanism can be explained by the following facts. (1) The Ce-doped TNTs show a strong electronegativity (Table 1) and a higher amount of chemsorbed and surface O2- concentration (Table 3). Moreover, the hydrothermal treatment in NaOH solution enhances the amount of OH groups [38,39]. On the other hand, the MB dye is a typical cationoid with H+ and N+ cations. The electrostatic attraction between them through “Vanderwaals Forces” results in a physical adsorption mechanism [40]. (2) Covalent and coordination bonds can also be formed between the anions and cations, which yields a chemical adsorption process.
In order to confirm the chemical adsorption mechanism, an adsorption kinetic calculation was conducted according to a pseudo-second-order kinetic model [36]:
t Q T = 1 k 2 Q e + t Q e
where t (min) is the contact time; Qe and Qt (mg/g) are the amounts of adsorbed MB at equilibrium and time t respectively; k2 (g/(mg∙min)) is the pseudo-second-order rate.
The results are illustrated in Figure 8 with a linear fitting. The correlation coefficient R2 (0.999) of the curves is close to 1, indicating that the adsorption behavior follows the pseudo-second-order kinetic model. This suggests that a chemical adsorption involving valence forces through sharing or exchange of electrons between adsorbent and adsorbate is significant. Therefore, it suggests that the total adsorption behavior of MB onto the TNTs is chemical adsorption based on a physical adsorption [41].

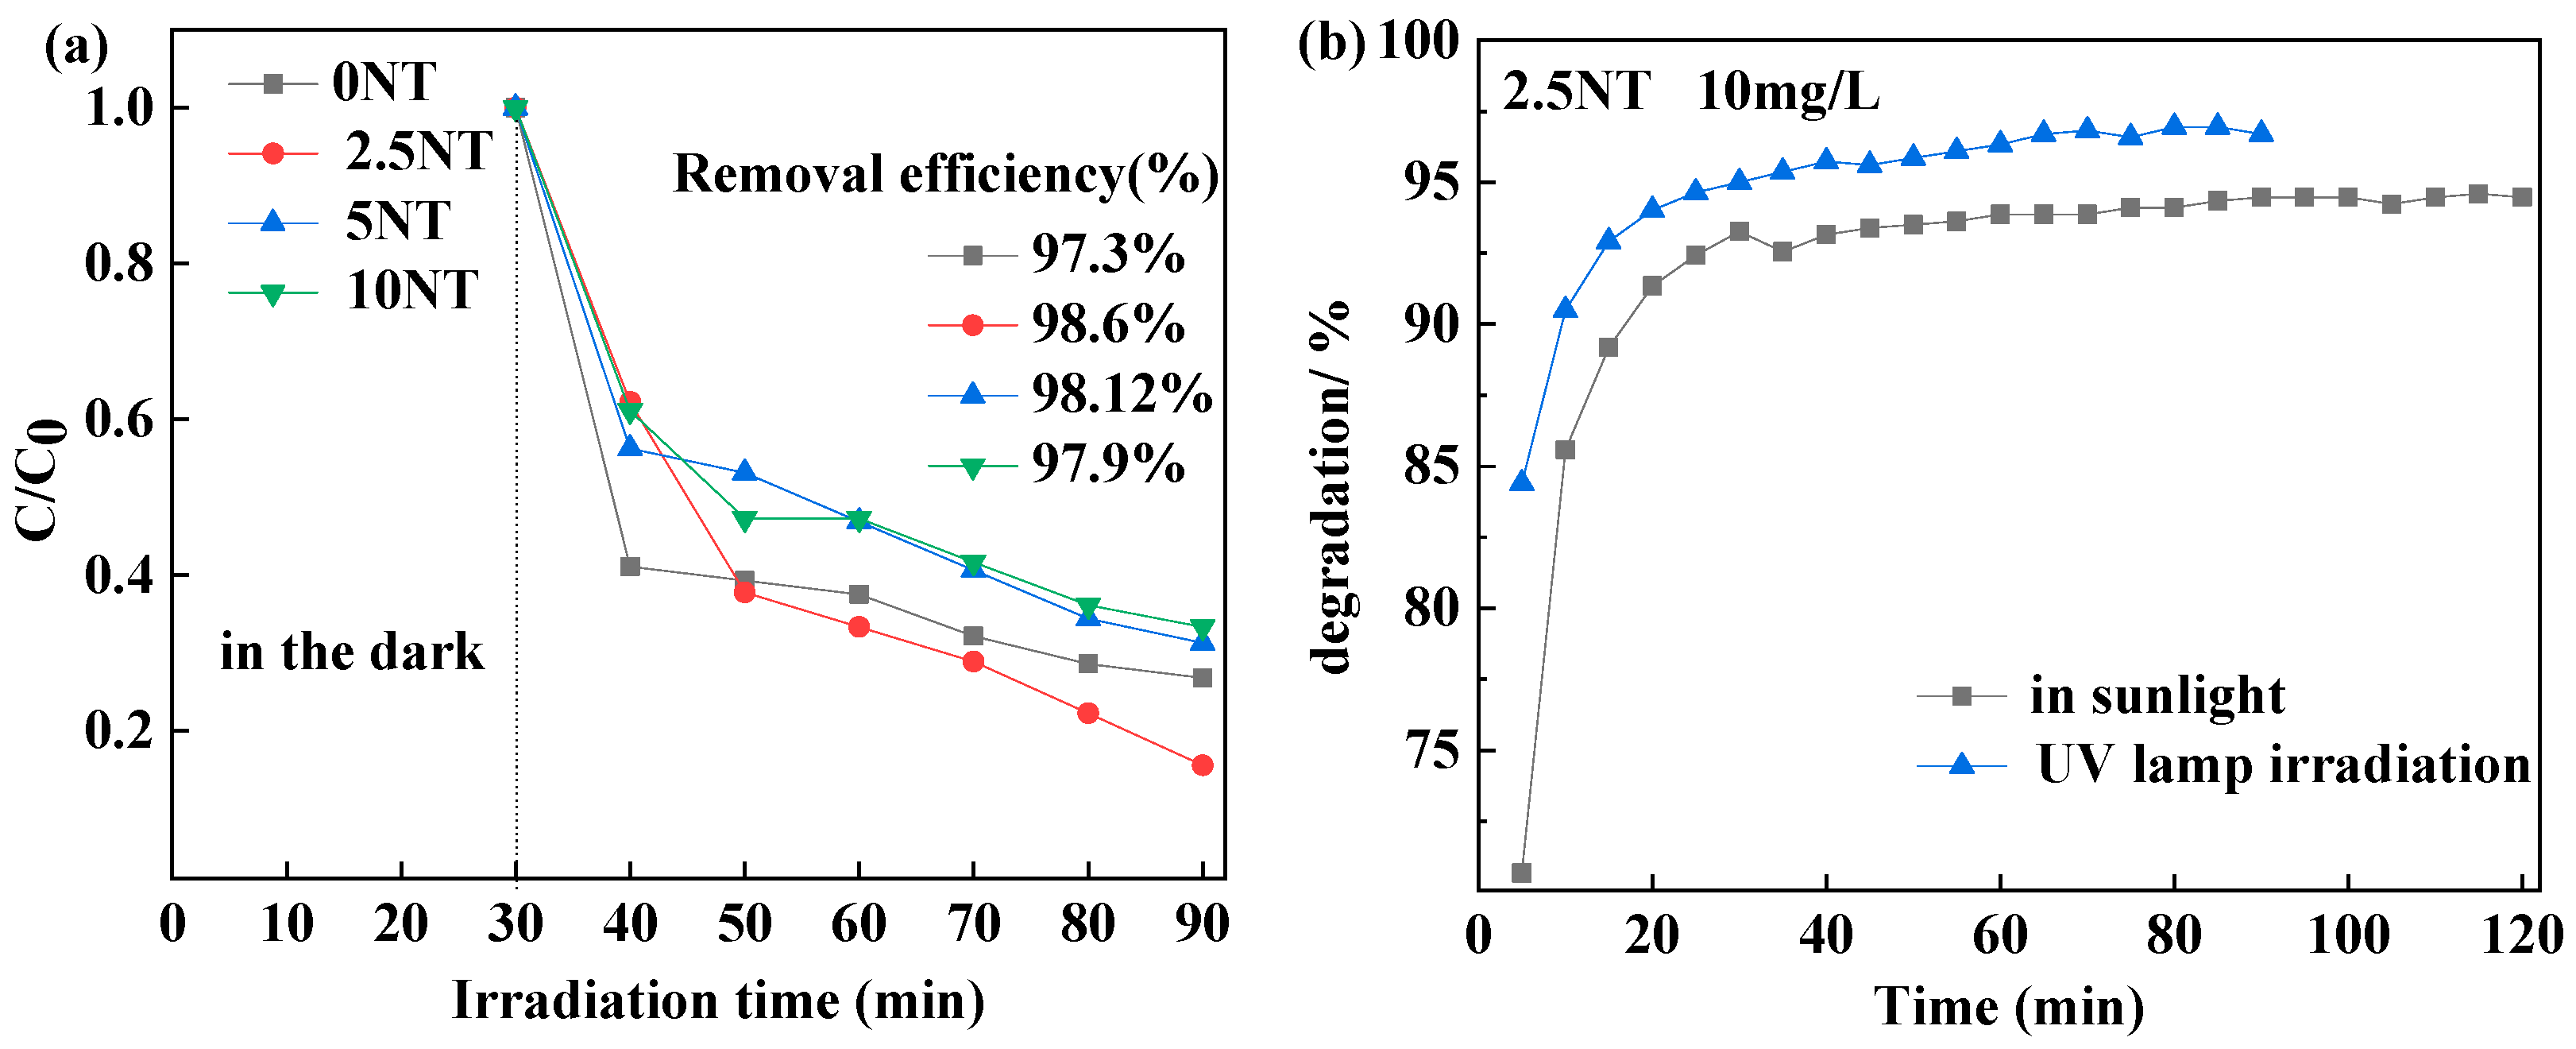
3.5.2. Photocatalytic Test

Figure 9a shows the photocatalytic behaviors of the TNT samples in solution with a 10 mg/L MB under a dark-reactioned for 30 min and subsequent UV irradiation. 2.5TNT has the highest photocatalytic efficiency of 98.69%. A complete degradation is achieved within 40–60 min. This indicates that the 2.5TNT also has rather strong photocatalytic degradation capacity upon the adsorption ability, so that it may be an excellent purifier for sewages with a rapid rate and high efficiency.
Figure 9b compares the photodegaration behavior (adsorption + photocatalytic) of 2.5TNT in solution with a 10 mg/L MB under sunlight and UV irradiation to examine the practicability. The degradation ratio is higher than 92.3% in both cases. The degradation in the sunlight is only lower of about 2.6% than that under UV irradiation. A complete degradation is also achieved within 40–60 min. This proves that the 2.5TNT could be used as a photodegradater in sunlight, not necessarily UV irradiation.
The photocatalytic degradation mechanism has also been widely discussed. The factors to influence the photocatalytic efficiency are mainly the surface area (contact area), photoabsorption threshold (band gap), surface oxygen and hydroxyl (redox ability), etc., improvement of which can absolutely enhance the degradation ability [41,42]. In the present test, a 2.5 mol% Ce-doping produces comprehensive improvement of the parameters, therefore, the excellent adsorption and photocatalytic performances were obtained.

4. Conclusions

The 2.5–10.0 mol% Ce-doped TNTs hydrothermally synthesized are composed of anatase tubulars and a small amount of CeO2 nanocrystals.
The hydrothermal synthesis makes Ce almost dissolve in the titania lattice, in the forms of Ce3+ and Ce4+, the ratio of which is increased with an increase in Ce addition.
Ce-doping yields a higher amount of chemisorbed oxygen and surface oxygen.
2.5 mol% Ce addition produces the largest specific surface area, porosity, and photoabsorption threshold and the lowest Zeta potential.
2.5 mol% Ce-doped TNT has a rapid and high-efficiency adsorption and photocatalytic ability for MB dye, even under sunlight irradiation.
The adsorption mechanism of MB onto the TNTs involves both the chemical adsorption and the physical adsorption.

Author Contributions

Data curation, K.W.; Investigation, K.W. and X.W.; Methodology, Z.S.; Project administration, Z.S.; Supervision, Z.S.; Validation, J.W.; Writing—original draft, K.W. All authors have read and agreed to the published version of the manuscript.

Funding

This research was funded by National Natural Science Foundation of China (51262021).

Institutional Review Board Statement

Not applicable.

Informed Consent Statement

Not applicable.

Data Availability Statement

The data presented in this study are available on request from the corresponding author.

Conflicts of Interest

The authors declare no conflict of interest. The funders had no role in the design of the study; in the collection, analyses, or interpretation of data; in the writing of the manuscript, or in the decision to publish the results.

References

  1. Natarajan, T.S.; Bajaj, H.C.; Tayade, R.J. Preferential adsorption behavior of methylene blue dye onto surface hydroxyl group enriched TiO2 nanotube and its photocatalytic Regeneration. J. Colloid Inter. Sci. 2014, 433, 104–114. [Google Scholar] [CrossRef] [PubMed]
  2. Yadav, A.; Gerislioglu, B.; Ahmadivand, A.; Kaushik, A.; Cheng, G.J.; Ouyang, Z.; Wang, Q.; Yadav, V.S.; Mishra, Y.K.; Wu, Y.; et al. Controlled self-assembly of plasmon-based photonic nanocrystals for high performance photonic technologies. Nano Today 2021, 37, 101072. [Google Scholar] [CrossRef]
  3. Melki, R.; Laoufi, N.A.; Mouheb, A. Effects of iron ions, doping methods and nanotubular morphology on TiO2 solar photocatalytic performance. Water Sci. Tech. 2021, 83, 12. [Google Scholar] [CrossRef]
  4. Méndez-Galván, M.; Celaya, C.A.; Jaramillo-Quintero, O.A.; Muñiz, J.; Díaz, G.; Lara-García, H.A. Tuning the band gap of M-doped titanate nanotubes (Mn, Fe, Co, Ni, and Cu): An experimental and theoretical study. Nanoscale Adv. 2021, 3, 1382–1391. [Google Scholar] [CrossRef]
  5. Emran, K.M.; Alanazi, H.E. Double layer lanthanide Pt/TiO2 nanotube arrays electrode as a cost-highly efficient electrocatalyst for hydrogen evolution in acid media. J. Exp. Nanosci. 2021, 16, 81–100. [Google Scholar] [CrossRef]
  6. Bae, H.-S.; Mahadik, M.A.; Seo, Y.-S.; Chae, W.S.; Chung, H.-S.; Ryu, H.I.; Cho, M.; Shea, P.J.; Choi, S.H.; Jang, J.S. Palladium metal oxide/hydroxide clustered cobalt oxide co-loading on acid treated TiO2 nanorods for degradation of organic pollutants and Salmonella typhimurium inactivation under simulated solar light. Chem. Eng. J. 2021, 408, 127260. [Google Scholar] [CrossRef]
  7. Wang, Y.; Ma, S.; Yu, H.; Liu, Y.; Gao, J.; Yang, L.; Zhang, M.; He, G.; Sun, Z. Effect of TiO2 arrays on surface enhanced Raman scattering (SERS) performance for Ag/TiO2 substrates. Nanotech 2021, 32, 075708. [Google Scholar] [CrossRef] [PubMed]
  8. Sutar, R.S.; Barkul, R.P.; Patil, M.K. Sunlight assisted photocatalytic degradation of different organic pollutants and simultaneous degradation of cationic and anionic dyes using titanium and zinc based nanocomposites. J. Mol. Liqu. 2021, 340, 117191. [Google Scholar] [CrossRef]
  9. Ho, Y.-R.; Chang, Y.-H.; Lin, C.-H.; Ou, S.-L.; Huang, J.-J. Al2O3-passivated TiO2 nanorods for solid–liquid heterojunction ultraviolet photodetectors. J. Mater. Sci. 2021, 56, 6052–6063. [Google Scholar] [CrossRef]
  10. Li, F.; Li, X.; Hou, M. Photocatalytic degradation of 2-mercaptobenzothiazole in aqueous La3+_TiO2 suspension for odor control. Appl. Catal. B Environ. 2004, 48, 185–194. [Google Scholar] [CrossRef]
  11. Shi, Z.; Yu, W.; Bayar, X. Study of crystallization behavior of Ce4+-modified titania gels. Scr. Mater 2004, 50, 885–889. [Google Scholar] [CrossRef]
  12. Barkul, R.P.; Shaikh, F.-N.A.; Delekar, S.D.; Patil, M.K. Visible light active Ce-doped TiO2 nanoparticles for photocatalytic degradation of methylene blue. Curr. Nanosci. 2017, 13, 110–116. [Google Scholar] [CrossRef]
  13. Rong, X.; Yan, J.; Yi, J.; Du, J.; Kang, K.; Gan, G. Analysis of chemical states of Ce-doped TiO2. J. Synth. Cryst. 2015, 44, 1383–1388. [Google Scholar]
  14. Asemi, M.; Ghanaatshoar, M. Hydrothermal growth of one-dimensional Ce-doped TiO2 nanostructures for solid-state DSSCs comprising Mg-doped CuCrO2. J. Mater. Sci. 2017, 52, 489–503. [Google Scholar] [CrossRef]
  15. Touati, A.; Hammedi, T.; Najjar, W.; Ksibi, Z.; Sayadi, S. Photocatalytic degradation of textile wastewater in presence of hydrogen peroxide: Effect of cerium doping titania. J. Ind. Eng. Chem. 2016, 35, 36–44. [Google Scholar] [CrossRef]
  16. Chung, L.; Chen, W.-F.; Koshy, P.; Sorrell, C.C. Effect of Ce-doping on the photocatalytic performance of TiO2 thin films. Mater. Chem. Phys. 2017, 197, 236–239. [Google Scholar] [CrossRef]
  17. Lutic, D.; Petrovschi, D.; Ignat, M.; Creţescu, I.; Bulai, G. Mesoporous cerium-doped titania for the photocatalytic removal of persistent dyes. Catal. Today 2018, 306, 300–309. [Google Scholar] [CrossRef]
  18. Shi, J.; Zou, Y.; Ma, D. Ce-doped titania nanoparticles: The effects of doped amount and calcination temperature on photocatalytic activity. IOP Conf. Series: Mater. Sci. Eng. 2017, 167, 012039. [Google Scholar] [CrossRef] [Green Version]
  19. Suhaili, S.Z.; Jais, U.S. Improved visible light photocatalytic activity of TiO2 nano powder by Ce3+ doping. In Proceedings of the 2012 IEEE Colloquium on Humanities, Science and Engineering (CHUSER), Kota Kinabalu, Malaysia, 3–4 December 2012. [Google Scholar] [CrossRef]
  20. Reli, M.; Ambrožová, N.; Šihor, M.; Matějová, L.; Čapek, L.; Obalová, L.; Matěj, Z.; Kotarba, A.; Kočí, K. Novel cerium doped titania catalysts for photocatalytic decomposition of ammonia. Appl. Catal. B Environ. 2015, 178, 108–116. [Google Scholar] [CrossRef]
  21. Alberoni, C.; Barroso-Martín, I.; Infantes-Molina, A.; Rodríguez-Castellón, E.; Talon, A.; Zhao, H.; You, S.; Vomiero, A.; Moretti, E. Ceria doping boosts methylene blue photodegradation in titania nanostructures. Mater. Chem. Front. 2021, 5, 4138–4152. [Google Scholar] [CrossRef]
  22. Xue, W.; Zhang, G.; Xu, X.; Yang, X.; Liu, C.; Xu, Y. Preparation of titania nanotubes doped with cerium and their photocatalytic activity for glyphosate. Chem. Eng. J. 2011, 167, 397–402. [Google Scholar] [CrossRef]
  23. Qu, X.; Xie, D.; Gao, L.; Du, F. Synthesis and photocatalytic activity of TiO2/CeO2 core–shell nanotubes. Mater. Sci. Semicond. Process. 2014, 26, 26–657. [Google Scholar] [CrossRef]
  24. Eleburuike, N.A.; Bakar, W.A.W.A.; Ali, R.; Omar, M.F. Photocatalytic degradation of paraquat dichloride over CeO2-modified TiO2 nanotubes and the optimization of parameters by response surface methodology. RSC Adv. 2016, 6, 104082–104093. [Google Scholar] [CrossRef]
  25. Liang, J.; Wang, J.; Song, K.; Wang, X.; Yu, K.; Liang, C. Enhanced photocatalytic activities of Nd-doped TiO2 under visible light using a facile sol-gel method. J. Rare Earths 2020, 38, 38–148. [Google Scholar] [CrossRef]
  26. Parnicka, P.; Mazierski, P.; Lisowski, W.; Klimczuk, T.; Nadolna, J.; Zaleska-Medynska, A. A new simple approach to prepare rare-earth metals-modified TiO2 nanotube arrays photoactive under visible light: Surface properties and mechanism investigation. Results Phys. 2019, 12, 12–412. [Google Scholar] [CrossRef]
  27. Rozman, N.; Tobaldi, D.M.; Cvelbar, U.; Puliyalil, H.; Labrincha, J.A.; Legat, A.; Škapin, A.S. Hydrothermal Synthesis of Rare-Earth Modified Titania: Influence on Phase Composition, Optical Properties, and Photocatalytic Activity. Materials 2019, 12, 713. [Google Scholar] [CrossRef] [PubMed] [Green Version]
  28. Nguyen, C.H.; Juang, R.-S. Efficient removal of cationic dyes from water by a combined adsorption-photocatalysis process using platinum-doped titanate nanomaterials. J. Taiwan Inst. Chem. Eng. 2019, 99, 166–179. [Google Scholar] [CrossRef]
  29. Wang, L.N. Study of Hydrothermal Synthesis Process and Photocatalytic Properties of TiO2 Nanotubes. Master’s Thesis, Inner Mongolia University of Technology, Hohhot, China, 2017. [Google Scholar]
  30. Tuyen, L.T.T.; Quang, D.A.; Toan, T.T.T.; Tung, T.Q.; Hoa, T.T.; Mau, T.X.; Khieu, D.Q. Synthesis of CeO2/TiO2 nanotubes and heterogeneous photocatalytic degradation of methylene blue. J. Environ. Chem. Eng. 2018, 6, 599–601. [Google Scholar] [CrossRef]
  31. Kasuga, T.; Hiramatsu, M.; Hoson, A. Titania nanotubes prepared by chemical processing. Adv. Mater. 1999, 11, 1307–1311. [Google Scholar] [CrossRef]
  32. Manibalan, G.; Murugadoss, G.; Thangamuthu, R.; Kumar, R.M.; Jayavel, R. Facile synthesis of heterostructure CeO2-TiO2 nanocomposites for enhanced electrochemical sensor and solar cell applications. J. Alloy. Compd. 2019, 773, 449–461. [Google Scholar] [CrossRef]
  33. Vieira, G.B.; José, H.J.; Peterson, M.; Baldissarelli, V.Z.; Alvarez, P.; Moreira, R.D.F.P.M. CeO2/TiO2 nanostructures enhance adsorption and photocatalytic degradation of organic compounds in aqueous suspension. J. Photochem. Photobiol. A Chem. 2018, 353, 325–336. [Google Scholar] [CrossRef]
  34. Wang, Y.; Zhao, J.; Wang, T.; Li, Y.; Li, X.; Yin, J.; Wang, C. CO2 photoreduction with H2O vapor on highly dispersed CeO2/TiO2 catalysts: Surface species and their reactivity. J. Catal. 2016, 337, 293–302. [Google Scholar] [CrossRef]
  35. Wang, Y.; Li, B.; Zhang, C.; Cui, L.; Kang, S.; Li, X.; Zhou, L. Ordered mesoporous CeO2-TiO2 composites: Highly efficient photocatalysts for the reduction of CO2 with H2O under simulated solar irradiation. Appl. Catal. B Environ. 2013, 130–131, 277–284. [Google Scholar] [CrossRef]
  36. Xiong, L.; Yang, Y.; Mai, J.; Sun, W.; Zhang, C.; Wei, D.; Chen, Q.; Ni, J. Adsorption behavior of methylene blue onto titanate nanotubes. Chem. Eng. J. 2010, 156, 313–320. [Google Scholar] [CrossRef]
  37. Xiu, Z.; Xing, Z.; Li, Z.; Wu, X.; Yan, X.; Hu, M.; Cao, Y.; Yang, S.; Zhou, W. Ti3+-TiO2/Ce3+-CeO2 Nanosheet heterojunctions as efficient visible-light-driven photocatalysts. Mater. Res. Bull. 2018, 100, 191–197. [Google Scholar] [CrossRef]
  38. Sahu, M.; Biswas, P. Single-step processing of copper-doped titania nanomaterials in a flame aerosol reactor. Nanoscale Res. Lett. 2011, 6, 441. [Google Scholar] [CrossRef] [PubMed] [Green Version]
  39. Ho, Y.S.; McKay, G. Pseudo-second order model for adsorption processes. Process. Biochem. 1999, 34, 451–465. [Google Scholar] [CrossRef]
  40. Yu, J.; Yu, H.; Cheng, B.; Trapalis, C. Effects of calcination temperature on the microstructures and photocatalytic activity of titanate nanotubes. J. Mol. Catal. A Chem. 2006, 249, 135–142. [Google Scholar] [CrossRef]
  41. Rapsomanikis, A.; Apostolopoulou, A.; Stathatos, E.; Lianos, P. Cerium-modified TiO2 nanocrystalline films for visible light photocatalytic activity. J. Photochem. Photobiol. A Chem. 2014, 280, 46–53. [Google Scholar] [CrossRef]
  42. Liu, B.; Zhao, X.; Zhang, N.; Zhao, Q.; He, X.; Feng, J. Photocatalytic mechanism of TiO2–CeO2 films prepared by magnetron sputtering under UV and visible light. Surf. Sci. 2005, 595, 203–211. [Google Scholar] [CrossRef]
Figure 1. TEM morphologies of the nanotubes doped with different amounts of Ce. (a) Undoped; (b) 2.5 mol%; (c) 5 mol%; (d) 10 mol%.
Crystals 12 01094 g001
Figure 2. HRTEM morphologies and EDS analysis of the 10 mol% Ce-doped TNT. (a) HR-TEM image; (b) Ti; (c) O; (d) Ce; and (e) Sum spectrum of the area covering the map.
Crystals 12 01094 g002aCrystals 12 01094 g002b
Figure 3. XRD patterns of the Ce-doped TNTs.
Crystals 12 01094 g003
Figure 4. BET surface analysis of the samples. (a) Nitrogen adsorption–desorption isotherm curves; (b) Distribution of pore size.
Crystals 12 01094 g004
Figure 5. UV-Vis curves of the samples.
Crystals 12 01094 g005
Figure 6. XPS spectrum curves of the TNTs. (a) Full spectrum; (b) Ti; (c) O; (d) Ce.
Crystals 12 01094 g006
Figure 7. Adsorption curves of the samples. (a) All samples, at a MB concentration of 5 mg/L; (b) 2.5TNT, at different MB concentrations.
Crystals 12 01094 g007
Figure 8. The linear plots of pseudo-second-order kinetic models.
Crystals 12 01094 g008
Figure 9. Photocatalytic photodegradation behaviors. (a) All of samples, UV radiation; (b) 2.5TNT, UV and visible light radiation.
Crystals 12 01094 g009
Table 1. BET measurement of the selected samples.
SampleSpecific Surface Area (m2/g)ZetaPore Volume (cm3/g)Peak Pore Diameter
(nm)
0TNT171.38−1.670.388.91
2.5TNT196.01−3.640.496.62
5TNT184.22−2.970.345.66
10TNT180.78−3.470.153.87
Table 2. Thresholds for photoabsorption of the sample.
SamplesThresholds
nmev
0TNT386.133.21
2.5TNT447.962.53
5TNT438.142.83
10TNT417.512.91
Table 3. Quantitative analysis of O and Ce ions of the TNT samples, mol%.
SampleO SpeciesCe Species
OTOLOCOSCe3+Ce4+
0TNT44.569.126.34.6--
2.5TNT50.260.527.711.863.336.7
5TNT50.858.827.913.373.426.6
10TNT54.664.524.49.172.1279
Publisher’s Note: MDPI stays neutral with regard to jurisdictional claims in published maps and institutional affiliations.

