
Endotaxial α-Fe Nanoparticles in the High-Fluence Iron-Implanted Single-Crystal MgO

 ,
,  , ,
, ,  and
and
Abstract
:1. Introduction
2. Experimental Methods
3. Results and Discussion
4. Conclusions
Author Contributions
Funding
Institutional Review Board Statement
Informed Consent Statement
Data Availability Statement
Acknowledgments
Conflicts of Interest
References
- Ohno, H.; Munekata, H.; Penney, T.; von Molnaár, S.; Chang, L.L. Magnetotransport properties of p-type (In,Mn)As diluted magnetic III-V semiconductors. Phys. Rev. Lett. 1992, 68, 2664–2667. [Google Scholar] [CrossRef]
- Ohno, H.; Shen, A.; Matsukura, F.; Oiwa, A.; Endo, A.; Katsumoto, S.; Iye, Y. (Ga,Mn)As: A new diluted magnetic semiconductor based on GaAs. Appl. Phys. Lett. 1998, 69, 363–365. [Google Scholar] [CrossRef]
- Dietl, T.; Ohno, H.; Matsukura, F.; Cibert, J.; Ferrand, D. Zener model description of ferromagnetism in zinc-blende magnetic semiconductors. Science 2000, 287, 1019–1022. [Google Scholar] [CrossRef]
- Sato, K.; Katayama-Yoshida, H. Ferromagnetism in a transition metal atom doped ZnO. Phys. E Low-Dimens. Syst. Nanostruct. 2001, 10, 251–255. [Google Scholar] [CrossRef]
- Zinnatullin, A.L.; Gumarov, A.I.; Gilmutdinov, I.F.; Kiiamov, A.G.; Vagizov, F.G.; Nuzhdin, V.I.; Valeev, V.F.; Khaibullin, R.I. Magnetic phase composition of ZnO film heavily implanted with Fe ions. Appl. Surf. Sci. 2019, 489, 220–225. [Google Scholar] [CrossRef]
- Dietl, T. A ten-year perspective on dilute magnetic semiconductors and oxides. Nat. Mater. 2010, 9, 965–974. [Google Scholar] [CrossRef] [PubMed]
- Estrin, Y.; Beygelzimer, Y.; Kulagin, R.; Gumbsch, P.; Fratzl, P.; Zhu, Y.; Hahn, H. Architecturing materials at mesoscale: Some current trends. Mater. Res. Lett. 2021, 9, 399–421. [Google Scholar] [CrossRef]
- Hamieh, M.; Jedrecy, N.; Hebert, C.; Demaille, D.; Perriere, J. Ferromagnetism and magnetoresistance of nanocomposite ZnO-Co thin films. Phys. Rev. B 2015, 92, 155302. [Google Scholar] [CrossRef]
- Xie, F.; Zhang, Y.; Wu, Z.; Qin, Z.; Ji, H.; Liu, X.; Hu, W. Effect of nonuniform microstructure on magnetoresistance and field sensitivity in Co–MgO nanocomposite films. Vacuum 2022, 200, 110976. [Google Scholar] [CrossRef]
- Zhang, Y.; Li, B.; Wu, Z.; Qin, Z.; Ji, H.; Liu, X.; Li, B.; Hu, W. Modulation of magnetoresistance and field sensitivity of Co–ZnO nanocomposite film by microstructure controlling. J. Phys. D Appl. Phys. 2021, 54, 365003. [Google Scholar] [CrossRef]
- Okay, C.; Vakhitov, I.R.; Valeev, V.F.; Khaibullin, R.I.; Rameev, B. Magnetic Resonance Study of Fe-Implanted TiO2 Rutile. Appl. Magn. Reson. 2017, 48, 347–360. [Google Scholar] [CrossRef]
- Li, D.Y.; Zeng, Y.J.; Pereira, L.M.C.; Batuk, D.; Hadermann, J.; Zhang, Y.Z.; Ye, Z.Z.; Temst, K.; Vantomme, A.; Van Bael, M.J.; et al. Anisotropic magnetism and spin-dependent transport in Co nanoparticle embedded ZnO thin films. J. Appl. Phys. 2013, 114, 033909. [Google Scholar] [CrossRef]
- Li, H.; Wang, C.; Li, D.; Homm, P.; Menghini, M.; Locquet, J.-P.; Van Haesendonck, C.; Van Bael, M.J.; Ruan, S.; Zeng, Y.-J. Magnetic orders and origin of exchange bias in Co clusters embedded oxide nanocomposite films. J. Phys. Condens. Matter 2019, 31, 155301. [Google Scholar] [CrossRef] [PubMed]
- Whited, R.C.; Flaten, C.J.; Walker, W.C. Exciton thermoreflectance of MgO and CaO. Solid State Commun. 1973, 13, 1903–1905. [Google Scholar] [CrossRef]
- Singh, J.P.; Lim, W.C.; Song, J.; Lee, S.; Chae, K.H. Fe+ and Zn+ ion implantation in MgO single crystals. Mater. Lett. 2021, 301, 130232. [Google Scholar] [CrossRef]
- Wang, X.; Ma, C.; Wang, X.; Zhou, W.; Tan, W. Room temperature ferromagnetism in N-implanted MgO: Synergistic effects of intrinsic and extrinsic defects. Mater. Res. Express 2021, 8, 066102. [Google Scholar] [CrossRef]
- Singh, J.P.; Lim, W.C.; Lee, J.; Song, J.; Lee, I.-J.; Chae, K.H. Surface and local electronic structure modification of MgO film using Zn and Fe ion implantation. Appl. Surf. Sci. 2018, 432, 132–139. [Google Scholar] [CrossRef]
- Mølholt, T.E.; Mantovan, R.; Gunnlaugsson, H.P.; Svane, A.; Masenda, H.; Naidoo, D.; Bharuth-Ram, K.; Fanciulli, M.; Gislason, H.P.; Johnston, K.; et al. Interstitial Fe in MgO. J. Appl. Phys. 2014, 115, 023508. [Google Scholar] [CrossRef]
- Misra, D.; Yadav, S.K. Prediction of Site Preference of Implanted Transition Metal Dopants in Rock-salt Oxides. Sci. Rep. 2019, 9, 12593. [Google Scholar] [CrossRef]
- Misra, D.; Yadav, S.K. On the origin of precipitation of transition metals implanted in MgO. Eur. Phys. J. B 2021, 94, 76. [Google Scholar] [CrossRef]
- Kaur, B.; Bhardwaj, R.; Singh, J.P.; Asokan, K.; Chae, K.H.; Goyal, N.; Gautam, S. Valence state and co-ordination of implanted ions in MgO. AIP Conf. Proc. 2020, 2220, 090003. [Google Scholar] [CrossRef]
- Lushchik, A.; Lushchik, C.; Popov, A.I.; Schwartz, K.; Shablonin, E.; Vasil’chenko, E. Influence of complex impurity centres on radiation damage in wide-gap metal oxides. Nucl. Instrum. Methods Phys. Res. Sect. B Beam Interact. Mater. At. 2016, 374, 90–96. [Google Scholar] [CrossRef]
- Baubekova, G.; Akilbekov, A.; Feldbach, E.; Grants, R.; Manika, I.; Popov, A.I.; Schwartz, K.; Vasil’chenko, E.; Zdorovets, M.; Lushchik, A. Accumulation of radiation defects and modification of micromechanical properties under MgO crystal irradiation with swift 132Xe ions. Nucl. Instrum. Methods Phys. Res. Sect. B Beam Interact. Mater. At. 2020, 463, 50–54. [Google Scholar] [CrossRef]
- Dubowik, J.; Baszyński, J. FMR study of coherent fine magnesioferrite particles in MgO-line shape behavior. J. Magn. Magn. Mater. 1986, 59, 161–168. [Google Scholar] [CrossRef]
- Shalimov, A.; Potzger, K.; Geiger, D.; Lichte, H.; Talut, G.; Misiuk, A.; Reuther, H.; Stromberg, F.; Zhou, S.; Baehtz, C.; et al. Fe nanoparticles embedded in MgO crystals. J. Appl. Phys. 2009, 105, 064906. [Google Scholar] [CrossRef]
- Potzger, K.; Reuther, H.; Zhou, S.; Mücklich, A.; Grötzschel, R.; Eichhorn, F.; Liedke, M.O.; Fassbender, J.; Lichte, H.; Lenk, A. Ion beam synthesis of Fe nanoparticles in MgO and yttria-stabilized zirconia. J. Appl. Phys. 2006, 99, 08N701. [Google Scholar] [CrossRef]
- Hayashi, N.; Sakamoto, I.; Toriyama, T.; Wakabayashi, H.; Okada, T.; Kuriyama, K. Embedded iron nano-clusters prepared by Fe ion implantation into MgO crystals. Surf. Coat. Technol. 2003, 169–170, 540–543. [Google Scholar] [CrossRef]
- Khalitov, N.I.; Khaibullin, R.I.; Valeev, V.F.; Dulov, E.N.; Ivoilov, N.G.; Tagirov, L.R.; Kazan, S.; Şale, A.G.; Mikailzade, F.A. Structural and magnetic studies of Co and Fe implanted BaTiO3 crystals. Nucl. Instrum. Methods Phys. Res. Sect. B Beam Interact. Mater. At. 2012, 272, 104–107. [Google Scholar] [CrossRef]
- Akdogan, N.; Nefedov, A.; Zabel, H.; Westerholt, K.; Becker, H.-W.; Somsen, C.; Gök, Ş.; Bashir, A.; Khaibullin, R.; Tagirov, L. High-temperature ferromagnetism in Co-implanted TiO2 rutile. J. Phys. D Appl. Phys. 2009, 42, 115005. [Google Scholar] [CrossRef]
- Martínez Boubeta, C.; Costa-Krämer, J.L.; Cebollada, A. Epitaxy, magnetic and tunnel properties of transition metal/MgO(001) heterostructures. J. Phys. Condens. Matter 2003, 15, R1123–R1167. [Google Scholar] [CrossRef]
- Matsnev, M.E.; Rusakov, V.S. SpectrRelax: An application for Moössbauer spectra modeling and fitting. AIP Conf. Proc. 2012, 1489, 178–185. [Google Scholar] [CrossRef]
- Ziegler, J.F.; Ziegler, M.D.; Biersack, J.P. SRIM—The stopping and range of ions in matter. Nucl. Instrum. Methods Phys. Res. Sect. B Beam Interact. Mater. At. 2010, 268, 1818–1823. [Google Scholar] [CrossRef]
- Layden, G.K.; McQuarrie, M.C. Effect of Minor Additions on Sintering of MgO. J Am. Ceram. Soc. 1959, 42, 89–92. [Google Scholar] [CrossRef]
- Wertz, J.E.; Auzins, P. Crystal Vacancy Evidence from Electron Spin Resonance. Phys. Rev. 1957, 106, 484–488. [Google Scholar] [CrossRef]
- Henderson, B.; Hall, T.P.P. Some studies of Cr3+ ions and Mn4+ ions in magnesium oxide. Proc. Phys. Soc. 1967, 90, 511–518. [Google Scholar] [CrossRef]
- O’Donnell, K.P.; Henderson, B.; O’Connell, D.; Henry, M.O. Axial Cr3+ centres in MgO: EPR and fluorescence studies. J. Phys. C Solid State Phys. 1977, 10, 3877–3884. [Google Scholar] [CrossRef]
- Kittel, C. Introduction to Solid State Physics, 8th ed.; Wiley: New York, NY, USA, 2005. [Google Scholar]
- Maksutoğlu, M.; Kazan, S.; Khalitov, N.I.; Nuzhdin, V.I.; Khaibullin, R.I.; Tagirov, L.R.; Roddatis, V.V.; Prikhodko, K.E.; Mikailzade, F.A. Magnetic resonance and magnetization in Fe implanted BaTiO3 crystal. J. Magn. Magn. Mater. 2015, 373, 103–107. [Google Scholar] [CrossRef]
- Suhl, H. Ferromagnetic Resonance in Nickel Ferrite Between One and Two Kilomegacycles. Phys. Rev. 1955, 97, 555–557. [Google Scholar] [CrossRef]
- Goryunov, Y.V.; Garif’yanov, N.N.; Khaliullin, G.G.; Garifullin, I.A.; Tagirov, L.R.; Schreiber, F.; Mühge, T.; Zabel, H. Magnetic anisotropies of sputtered Fe films on MgO substrates. Phys. Rev. B 1995, 52, 13450–13458. [Google Scholar] [CrossRef]
- Gubin, S.P. (Ed.) Magnetic Nanoparticles; Wiley: Weinheim, Germany, 2009. [Google Scholar]
- Gurevich, A.G. Magnetic Resonance in Ferrites and Antiferromagnets; Nauka: Moscow, Russia, 1973. (In Russian) [Google Scholar]
- Miyazaki, T.; Jin, H. The Physics of Ferromagnetism; Springer: Berlin, Germany, 2012. [Google Scholar]
- Ibusuki, T.; Kojima, S.; Kitakami, O.; & Shimada, Y. Magnetic anisotropy and behaviors of Fe nanoparticles. IEEE Trans. Magn. 2001, 37, 2223–2225. [Google Scholar] [CrossRef]
- Achkeev, A.A.; Khaibullin, R.I.; Tagirov, L.R.; Mackova, A.; Hnatowicz, V.; Cherkashin, N. Specific features of depth distribution profiles of implanted cobalt ions in rutile TiO2. Phys. Solid State 2011, 53, 543–553. [Google Scholar] [CrossRef]


| Components | Hyperfine Parameters | Valence State | Spectral Area, % | ||||
|---|---|---|---|---|---|---|---|
| δ, mm/s | 2ε, mm/s | HF, kOe | |||||
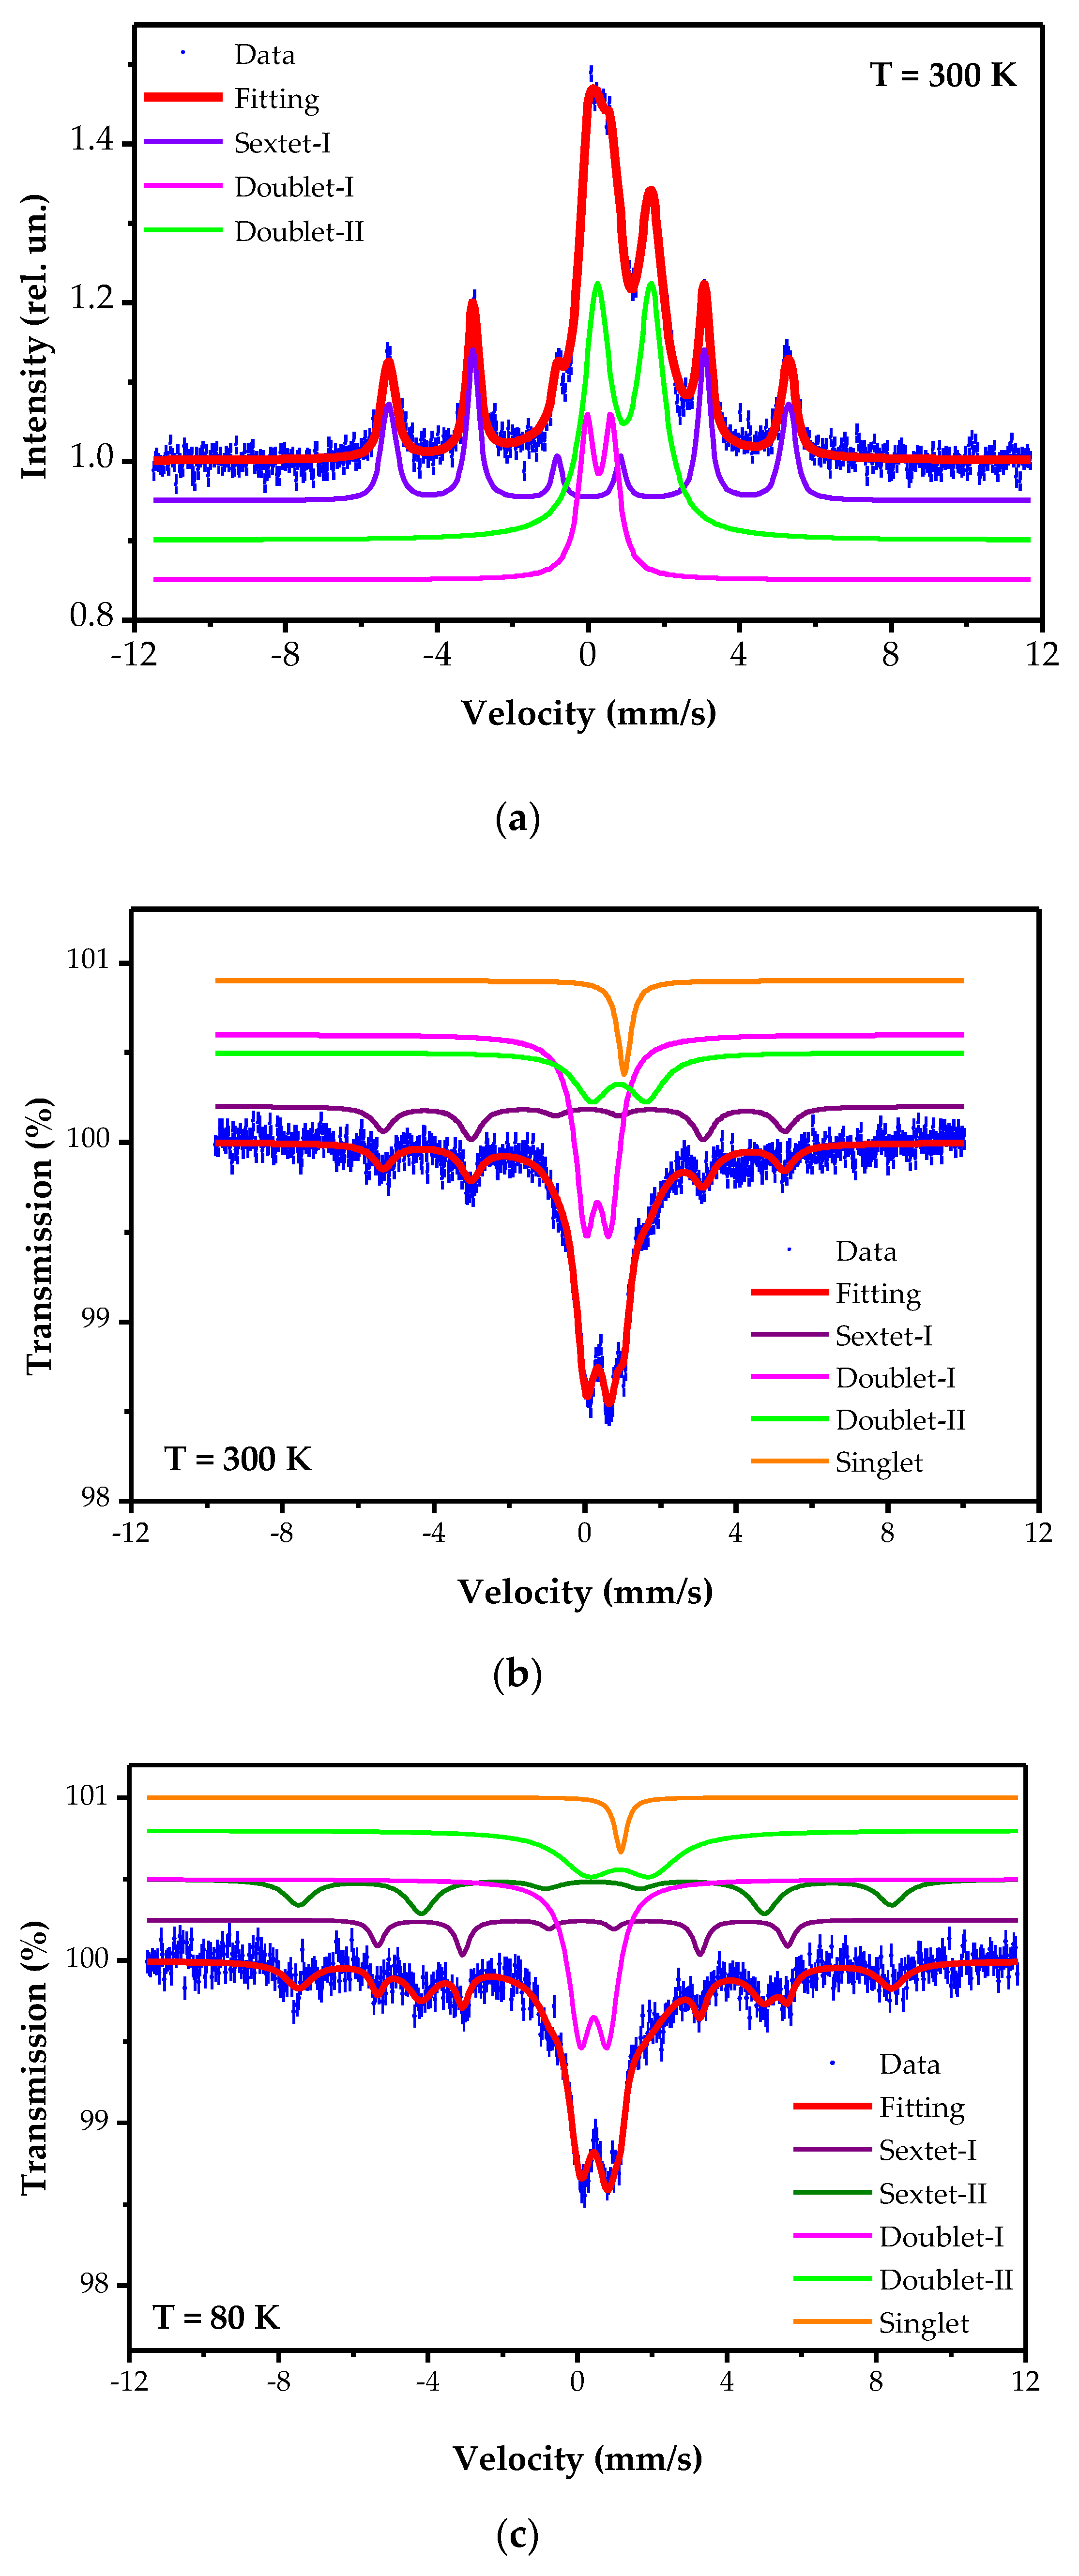
| CEMS 300 K | Sextet | 0 | 0 | 329 | Fe0 | 43.5 | |
| Doublet-I | 0.28 | 0.64 | - | Fe3+ | 22 | ||
| Doublet-II | 0.95 | 1.43 | - | Fe2+ | 34.5 | ||
| Transmission Mössbauer spectra | 300 K | Sextet | 0.01 | −0.08 | 329 | Fe0 | 19 |
| Doublet-I | 0.33 | 0.63 | - | Fe3+ | 50 | ||
| Doublet-II | 0.90 | 1.44 | - | Fe2+ | 22 | ||
| Singlet | 1.04 | 0 | - | Fe2+ | 9 | ||
| 80 K | Sextet-I | 0.12 | 0.03 | 340 | Fe0 | 11 | |
| Sextet-II | 0.44 | 0.06 | 491 | Fe3+ | 22 | ||
| Doublet-I | 0.44 | 0.73 | - | Fe3+ | 38 | ||
| Doublet-II | 1.11 | 1.68 | - | Fe2+ | 25 | ||
| Singlet | 1.16 | 0 | - | Fe2+ | 4 | ||
Publisher’s Note: MDPI stays neutral with regard to jurisdictional claims in published maps and institutional affiliations. |
© 2022 by the authors. Licensee MDPI, Basel, Switzerland. This article is an open access article distributed under the terms and conditions of the Creative Commons Attribution (CC BY) license (https://creativecommons.org/licenses/by/4.0/).
Share and Cite
Zinnatullin, A.L.; Gabbasov, B.F.; Lyadov, N.M.; Yusupov, R.V.; Khaibullin, R.I.; Vagizov, F.G. Endotaxial α-Fe Nanoparticles in the High-Fluence Iron-Implanted Single-Crystal MgO. Crystals 2022, 12, 1095. https://doi.org/10.3390/cryst12081095
Zinnatullin AL, Gabbasov BF, Lyadov NM, Yusupov RV, Khaibullin RI, Vagizov FG. Endotaxial α-Fe Nanoparticles in the High-Fluence Iron-Implanted Single-Crystal MgO. Crystals. 2022; 12(8):1095. https://doi.org/10.3390/cryst12081095
Chicago/Turabian StyleZinnatullin, Almaz L., Bulat F. Gabbasov, Nikolay M. Lyadov, Roman V. Yusupov, Rustam I. Khaibullin, and Farit G. Vagizov. 2022. "Endotaxial α-Fe Nanoparticles in the High-Fluence Iron-Implanted Single-Crystal MgO" Crystals 12, no. 8: 1095. https://doi.org/10.3390/cryst12081095