Abstract
Two polymorphs of a benzoxadiazole derivative were examined to determine the interactions leading to the formation of two distinct crystalline forms. Hirshfeld surface analysis was used to establish and contrast the interactions in the two samples. Fingerprints derived from the surface analysis were used to distinguish and lead the analysis in discovering the different interactions in the two crystals. π interactions, specifically, π-hole interactions with a nitro moiety, were found to play an important role in the formation of the crystal structure. Further, carbonyl interactions and π-stacking contribute to the overall relative stability of the different conformational polymorphs. Calculated energy frameworks were used to help visualize the interactions between molecules in the crystal structure, supported by an understanding of the individual interactions. The experimental data were supplemented with theoretical studies to establish a through understanding of these heterocyclic systems.
1. Introduction
Analyzing the crystal structures of organic polymorphs has led to the discovery of many fundamental concepts of organic chemistry such as the different conformation of cyclohexane [1]. These studies provide a foundation for the understanding of how organic molecules can adopt different conformations in addition to helping understand their liquid and gaseous-state structures. With the advancement of modern crystallographic instruments and techniques, the study of polymorphic forms of compounds has become more prominent [2]. Despite the noted increase in studies revolving around the crystallographic analysis of compounds, the study of polymorphs still appears to be a smaller niche within the broader field of structural chemistry [3]. However, there is a marked increase in the reports of polymorphs, especially among pharmaceutically relevant molecules, and the accompanying analysis of these compounds. Nevertheless there still remains a number of fundamental questions and scientific curiosities surrounding the field of study with polymorphism [4].
Despite the questions surrounding the crystallographic study of polymorphism, several well-established principles have been developed over the years. Of particular relevance to the present manuscript is the concept of how changes in torsion angles can lead to the formation of different polymorphic forms [2]. Holding a notable place within the field of polymorphs is the compound 5-methyl-2-[(2-nitrophenyl)amino]-3-thiophenecabonitrile, commonly referred to as ROY which, at the time of writing, has 12 crystalline forms [5]. As posited in the manuscript by Beran and coworkers, additional polymorphic forms are likely to exist, owing primarily, but not exclusively, to many energetically accessible torsion angles within the structure. Of note, functionalized derivatives of ROY show the same proclivity for polymorphism [6].
The pharmaceutical field has a particular interest with respect to the study of polymorphs. Properties such as solubility and tabletability are influenced by the solid-state structure of a compound [7]. In fact, quite a diverse set of properties can be influenced through the existence of polymorphs including surface reactivity and spectroscopic properties [8]. A recent report by Nogueira and co-workers details how different polymorphs can exhibit distinct colors depending on the crystal packing [9]. As detailed in their manuscript, Nogueira et al. describe several foundational studies that explain the different colors that are observed. They discuss how the colors relate to certain intermolecular interactions within the crystals. Specifically, the presence or absence of particular interactions leads to the formation of stable or meta-stable crystalline forms which can exhibit distinct colors.
Examining the intermolecular interactions in polymorphs is of fundamental importance to develop an understanding of the interactions that lead to the formation of a specific crystal structure [10]. Classification of the importance, relative strength, and even the presence of specific interactions in the crystalline state is an extremely active field of study [11]. Several fundamental texts and manuscripts exist which detail the history and current focus of study for this field, and only a small fraction can be referenced here [12,13,14]. As the acquisition of crystallographic data becomes more routine, but perhaps not simpler in execution, developing a thorough understanding of the structure and interactions within a crystal structure is of importance [15,16]. Further, advancements in both software and hardware have helped make progress in allowing for a more rigorous examination of crystal structures and the interactions within them [17,18].
Herein we present the synthesis and characterization of two polymorphs of a benzoxadiazole derivative (Figure 1). This compound is a part of our groups’ continued effort towards the rational design of biologically active compounds driven by structural analysis. Two conformational polymorphs were isolated from this intermediate product during a purification procedure. These two polymorphs allowed for a thorough examination of the different interactions leading to the formation of the crystal structures. π interactions, specifically π-holes and π-stacking, were found to be present in both samples. However, these interactions were also points of distinction due to the unique geometries involved. Further, hydrogen interactions involving the carbonyl moiety were a significant point of distinction. Both the carbonyl carbon and carbonyl oxygen were found to have different interactions when contrasting the two crystal structures. Hirshfeld surface analysis was used to quantify these interactions providing a facile method of distinguishing the interactions in each crystal.
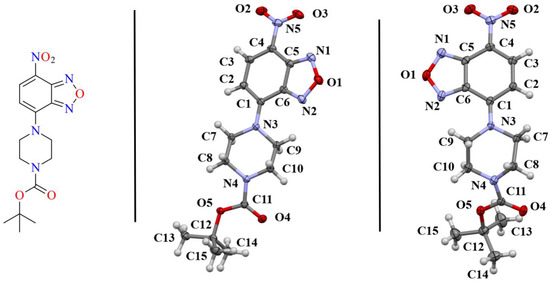
Figure 1.
(left) Sketch of the benzoxadiazole compounds examined herein. The asymmetric unit of the monoclinic polymorph 1-M (middle) and orthorhombic polymorph 1-O (right) are shown with 50% probability ellipsoids. The naming scheme for the crystals is shown. Coloring of atoms is by element, as depicted in the sketch.
2. Discussion
Compound 1 crystallized in both a monoclinic (1-M) and orthorhombic (1-O) crystal system. Both crystal structures had one molecule in the asymmetric unit (Figure 1). Figure 2 shows an overlay of the two structures that emphasizes the similarities and differences between the asymmetric units.
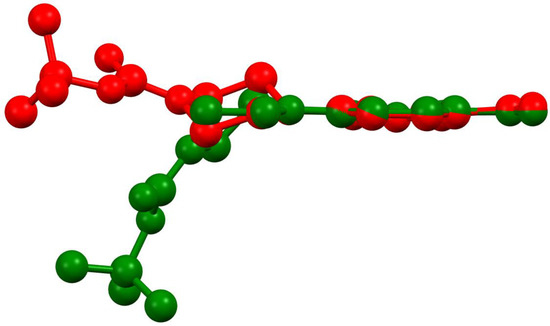
Figure 2.
An overlay of the molecular structures of the monoclinic (red) and orthorhombic (green) polymoprhs.
Examining Figure 1 and Figure 2 reveals several noteworthy structural details. First, the benzoxadiazole rings and the nitro groups overlapped almost completely in the two structures. Given the conjugated nature of the rings and the nitro moiety, we did not expect to see any notable changes in this portion of the structure. Indeed, the bond lengths within the rings were very similar (see Table 1). Second, the orientation of the ester group was different for the two structures. In 1-M, the carbonyl oxygen was oriented in the same direction as the benzoxadiazole oxygen (O1). In 1-O, the carbonyl group was oriented approximately 180° from this, facing the same direction as the aromatic hydrogens on the benzene ring of the heterocyclic core. The two orientations of the carbonyl group facilitated distinct interactions in the crystal structure (vide infra). Finally, the most notable distinction in the two structures was the chair vs. twist-boat conformation of the piperazine ring. The varying conformation of this ring shifted the position of the axial and equatorial hydrogens leading to different sets of interactions for the two conformers.

Table 1.
Table listing experimental and calculated bond distances for both 1-M and 1-O. The difference (experimental–calculated) is also shown. All units are in Å.
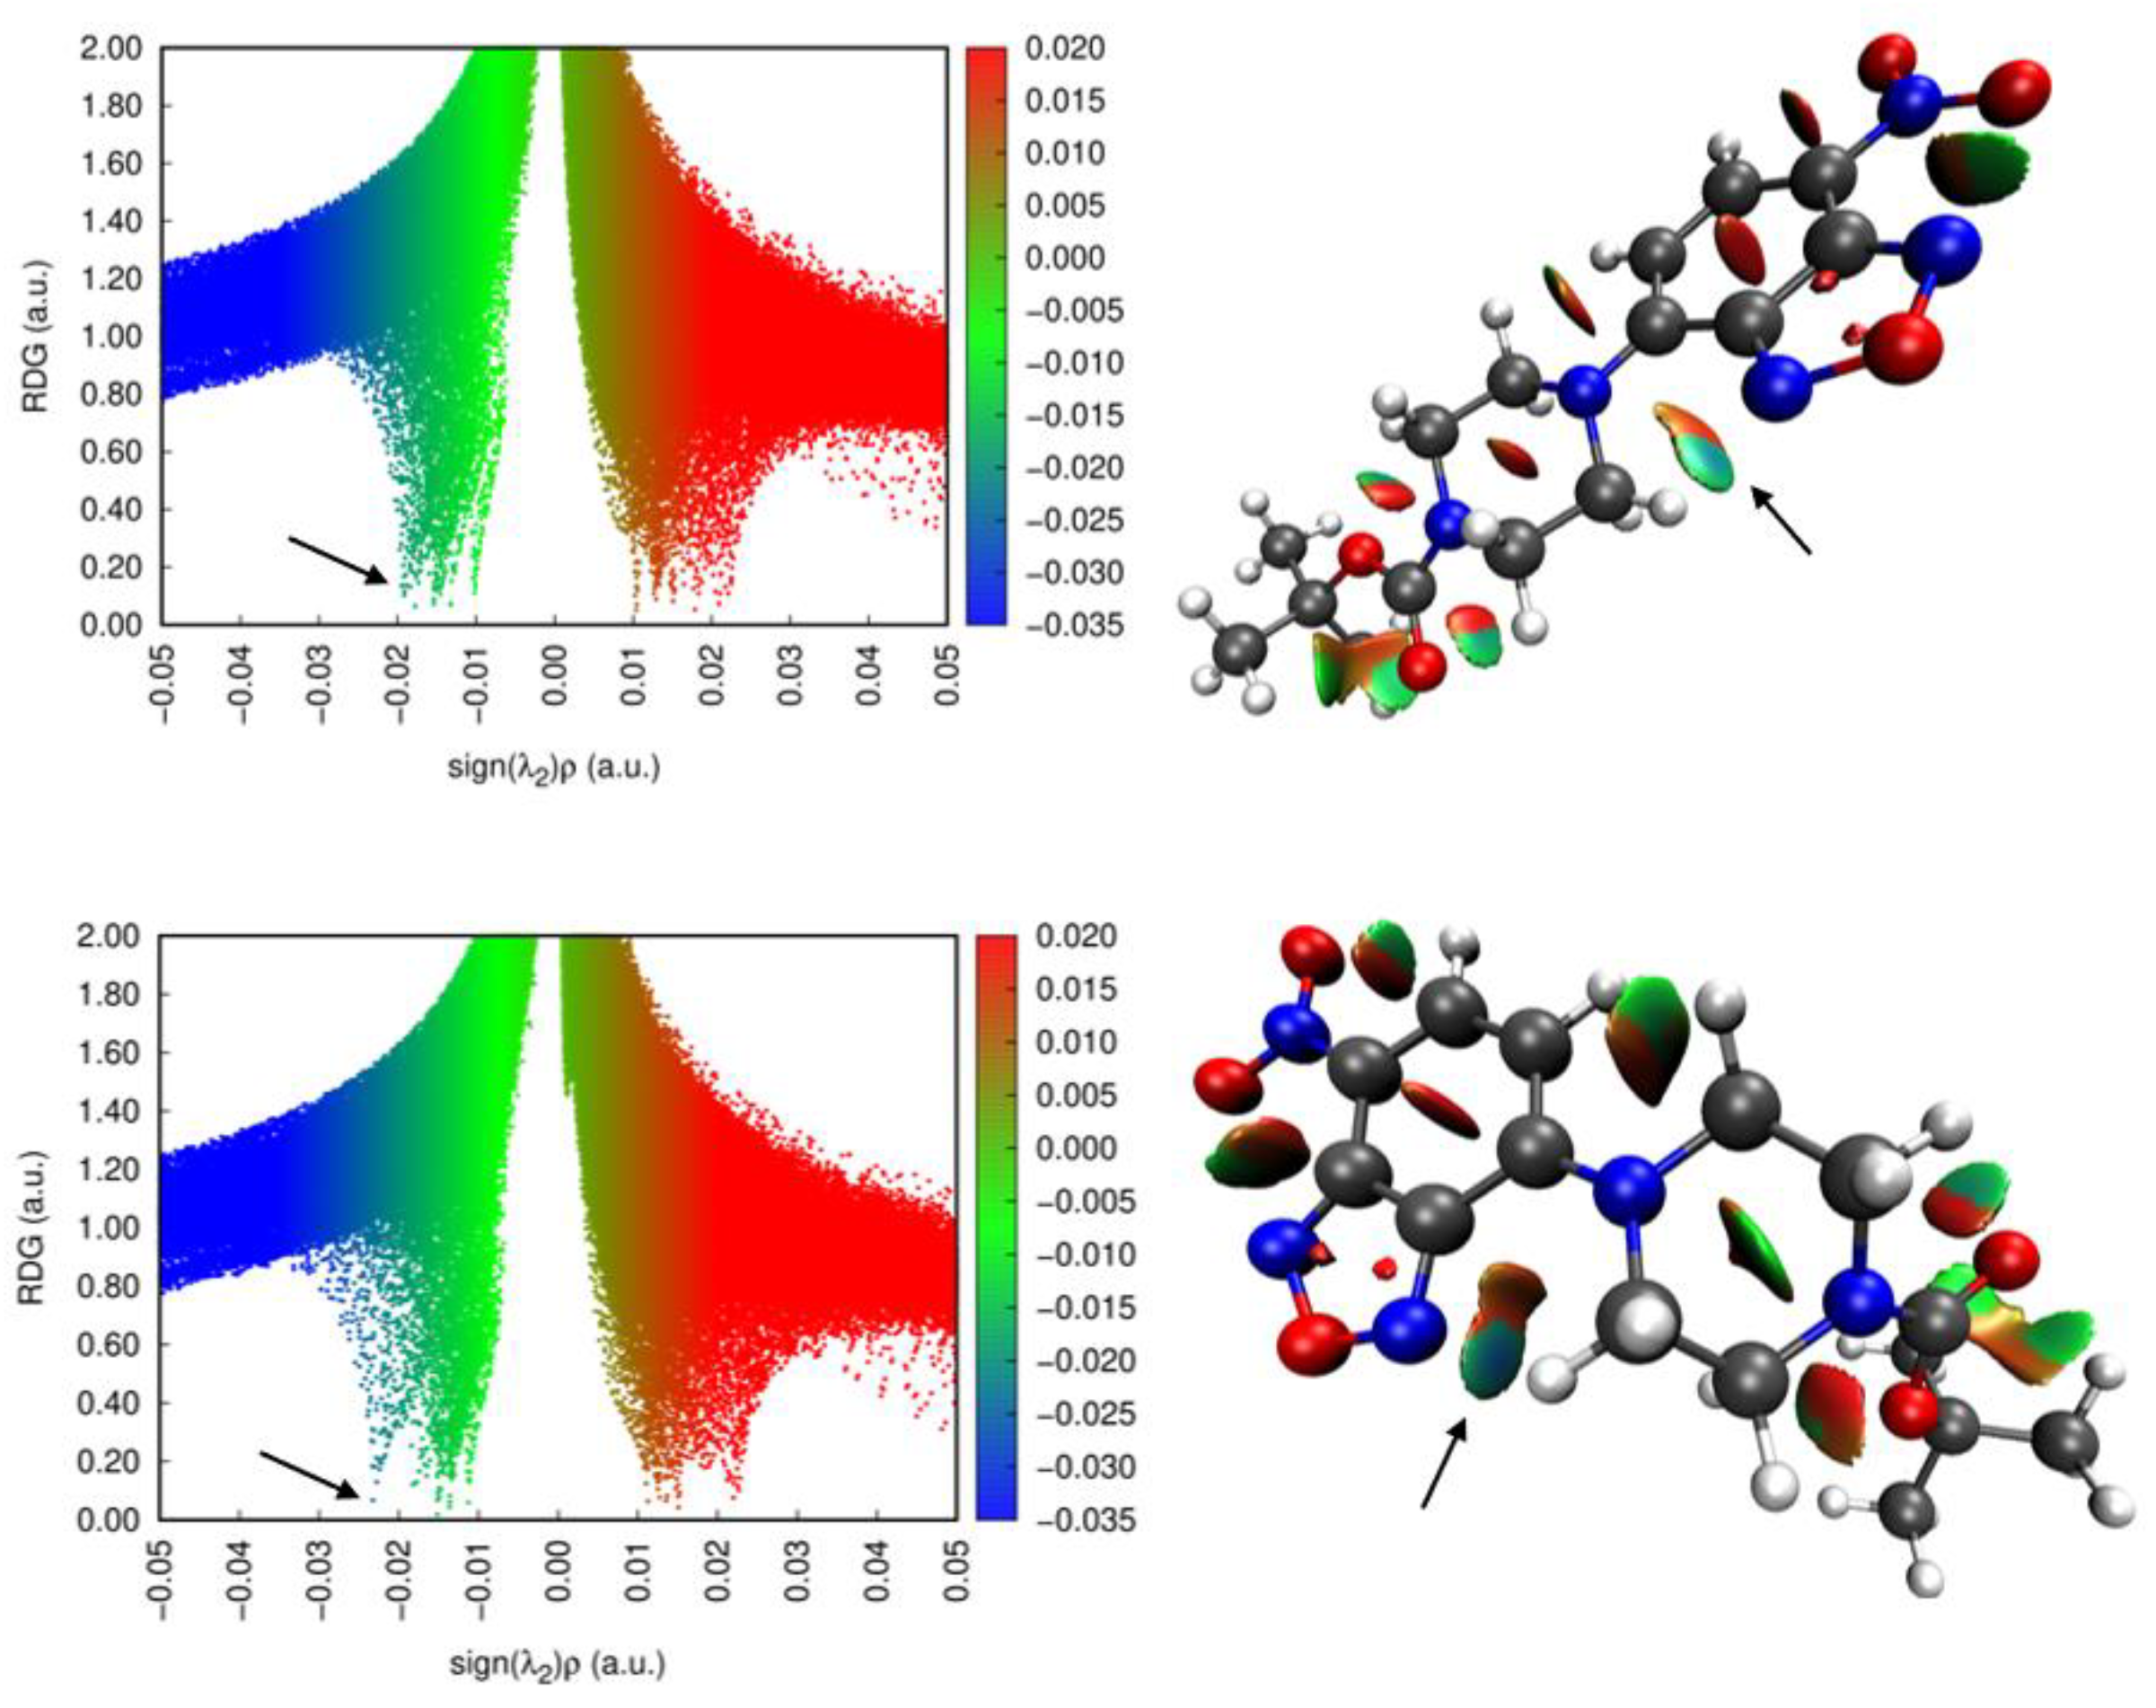
Before addressing the intermolecular interactions, we wished to examine the intramolecular interactions. RDG (reduced density gradient) analysis was performed on the two molecular structures from the polymorphs. The RDG scatter plots and the isosurfaces are shown in Figure 3. Examining the results of the analysis and looking at past literature [19] helped to reveals several significant intramolecular interactions in these systems.

Figure 3.
(left) Scatter plots of the reduced density gradient vs. sign (λ2)ρ for 1-M and 1-O. (right) The visualized RDG isosurfaces for both structures. Arrows are pointing to the corresponding points for the intramolecular H···N interaction.
First, there was a hydrogen interaction between the benzoxadiazole nitrogen (N2) and a hydrogen on the piperazine ring (H7A). In both conformers this interaction existed. For 1-M, the N2···H7A distance was 2.21 Å (d(H···N)) while in 1-O the N2···H7A distance was 2.13 Å (d(H···N)). Further, the geometry of these interactions was distinct. In 1-M, the hydrogen lay 0.862 Å below the plane of the nitrogen while in 1-O the hydrogen was nearly co-planar with the nitrogen atom, lying only 0.241 Å below the plane. Examining the RDG isosurfaces revealed a shaded blue region between N2 and the H atom, indicative of a strong non-covalent interaction. Careful inspection of the two isosurfaces, as well as the scatter plots, revealed a stronger (blue, more negative sign) interaction in 1-O than in 1-M in line with the observed changes in the geometry of this interaction.
Second, on the opposite side of the piperazine ring was C9 which formed another significant intramolecular interaction. The methylene hydrogen atoms on C9 adopted a conformation to avoid eclipsing the near-by aromatic hydrogens on C4. The RDG isosurface at this point revealed only van der Waals interactions (green/tan), and pointed to, at best, weakly stabilizing contacts between these atoms. These two intramolecular interactions, that is the H···N and H···H interactions, thus influenced the torsion angles and conformations of the attached ring. The angles and conformations of ring substituents on related systems have been shown to influence the optical properties of the formed materials [20]. A more detailed computational study of these interactions will be conducted to determine other conformations of the rings and their relative stability.
2.1. Hirshfeld Surface Analysis and Void Space
To help identify and distinguish the unique interactions in the two polymorphs, Hirshfeld surface analysis was completed on both structures. The fingerprints and surfaces for the entire molecules are shown in Figure 4 and Figure 5, respectively. Fingerprints for individual interaction groups will be addressed in the text as referenced.
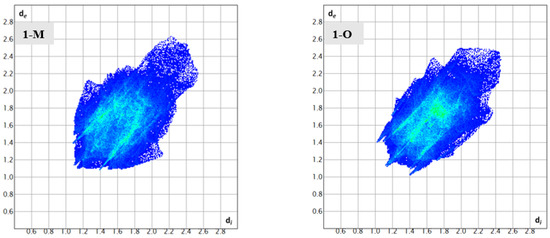
Figure 4.
The complete fingerprints for 1-M and 1-O.

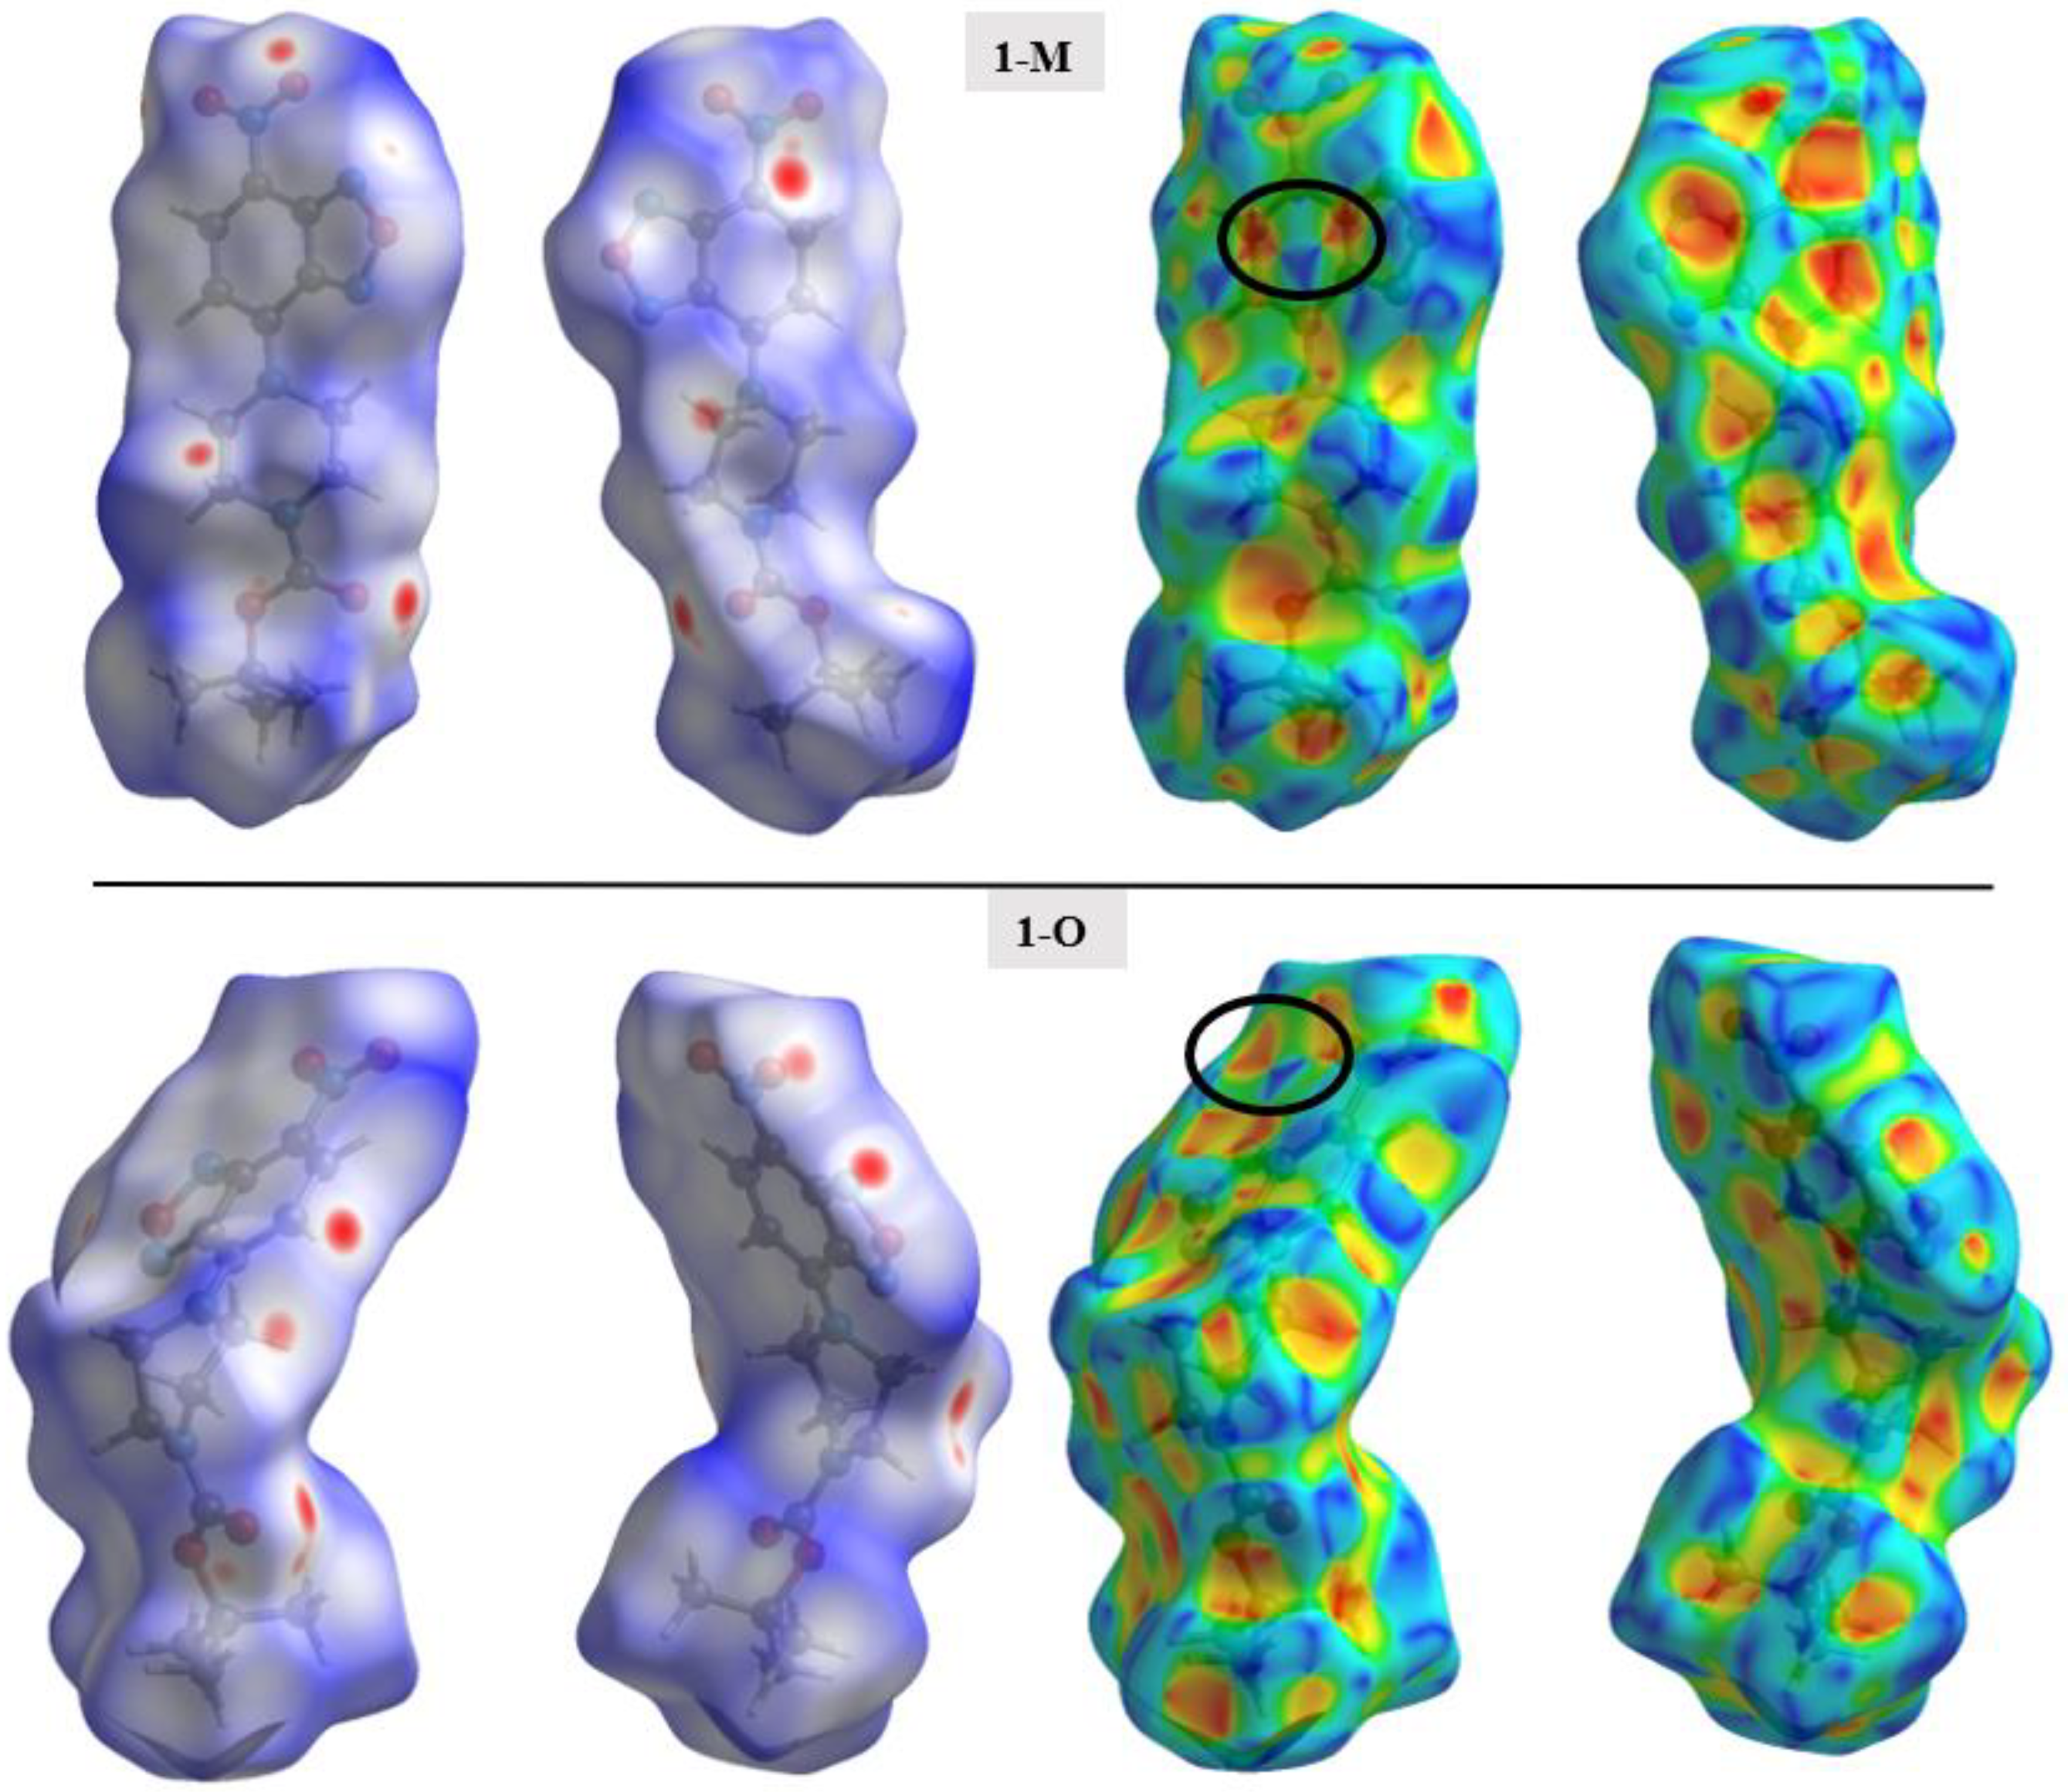
Figure 5.
The Hirshfeld surface mapped with dnorm (left) and the shape index (right) for both polymorphs. Two orientations of each surface are shown to help visualize the complete surface. Black circles are used to draw attention to characteristic patterns indicative of π-π stacking.
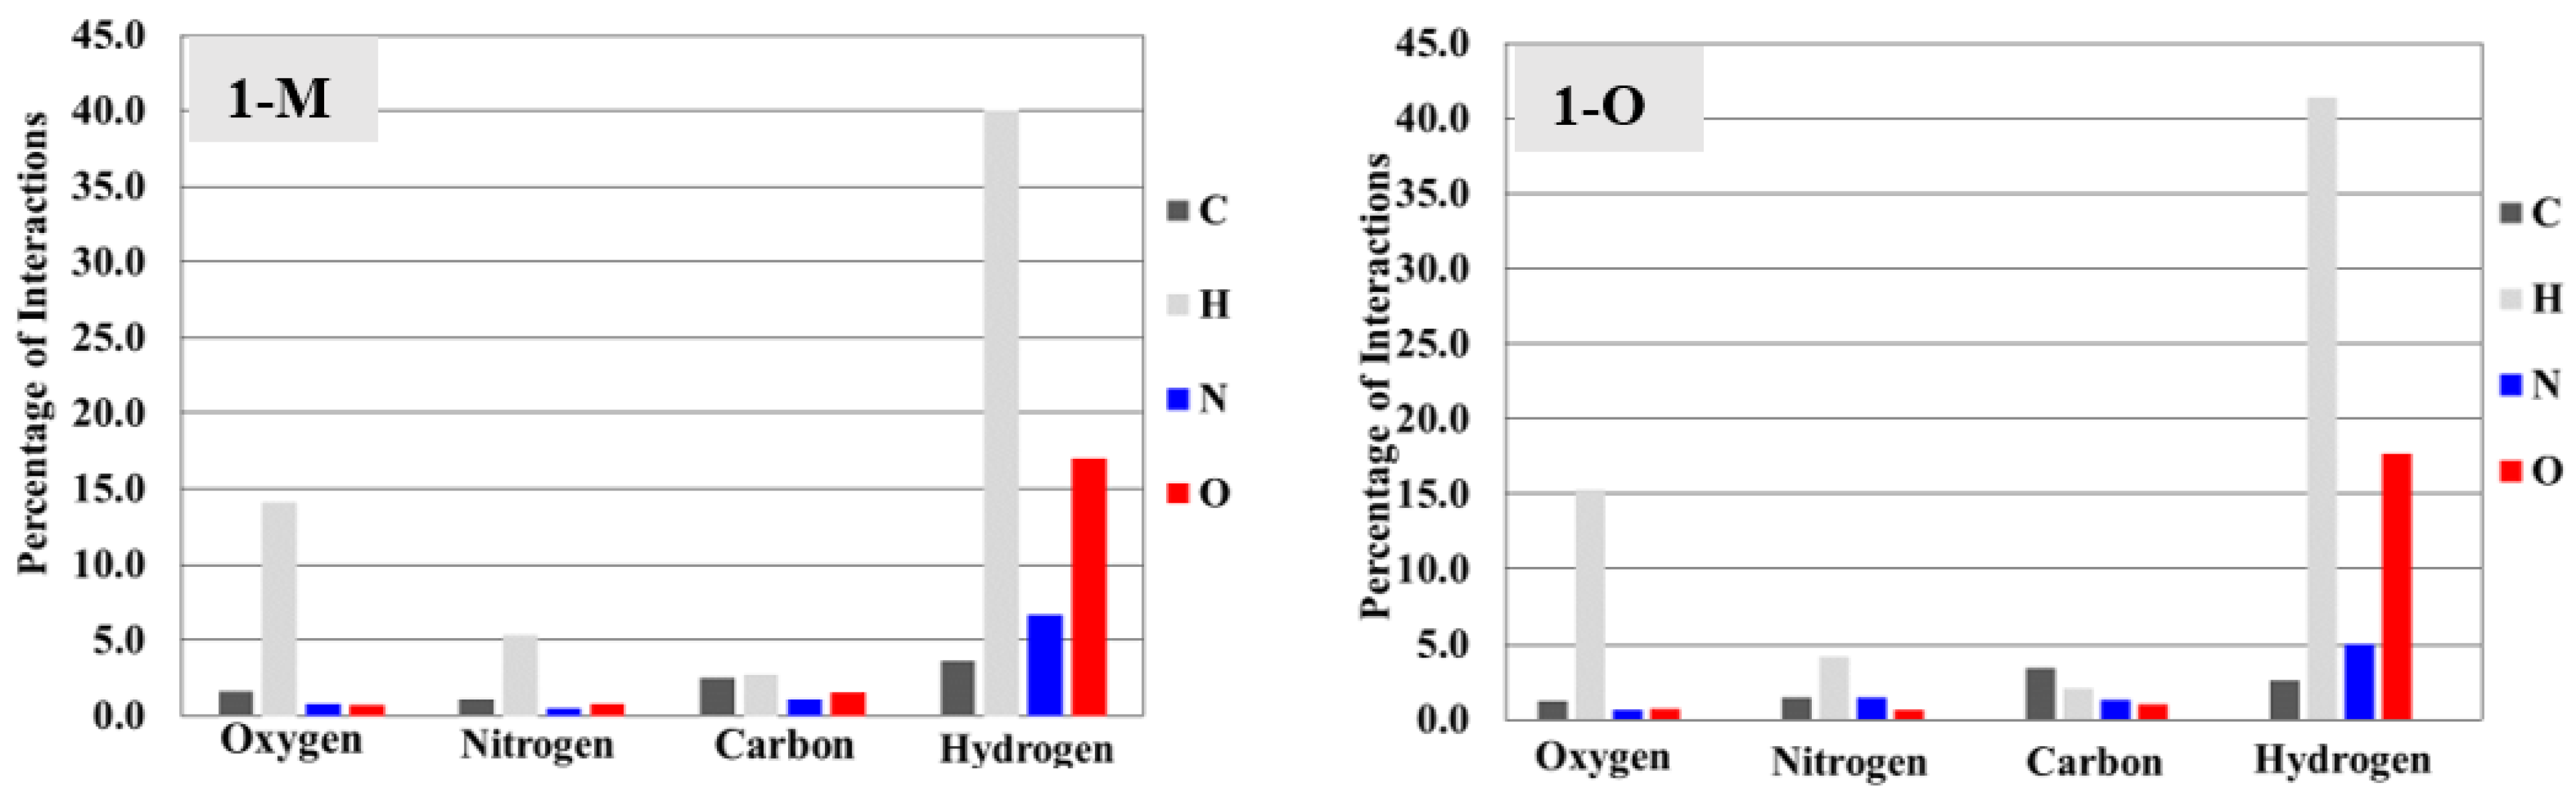
Surface analysis allows one to draw out the percentages of the individual interactions between atoms within a crystal structure (Figure 6). There were subtle differences in the overall interaction percentages of the two polymorphs. For the monoclinic structure (1-M), there was a lower percentage of H···H interactions than for the orthorhombic structure (1-O). There was a slightly lower percentage of H···O interactions in 1-M while there was a higher percentage of H···N interactions. A higher percentage of C···C interactions was exhibited by 1-O, which corresponded to π stacking. Close examination of the mapped dnorm surface of 1-O revealed the characteristic hexagonal ‘imprinted’ shape from the symmetry adjacent moiety in the π stacking. The shape index also displayed the characteristic alternating red and blue triangles which corresponded to the stacking.
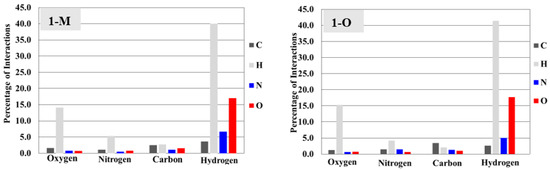
Figure 6.
Bar graphs representing the percentages of interactions between atoms derived from the Hirshfeld surface. For example, 1-M displays ~40% hydrogen interactions with hydrogens (tallest gray bar).
Overall, the biggest deviation in interactions arose from hydrogen atoms, followed by nitrogen, then oxygen. It should be stated that the differences, by percentage, were small but small changes in interactions can lead to significant changes in the stabilizing forces within a crystal [21]. The goal was not to draw exact conclusions from these numerical data alone, as the numerical data do not necessarily account for stabilizing vs. destabilizing interactions. However, examining the percentages of total interactions did help reveal which particular interactions did change, allowing for a focused examination surrounding these atoms.
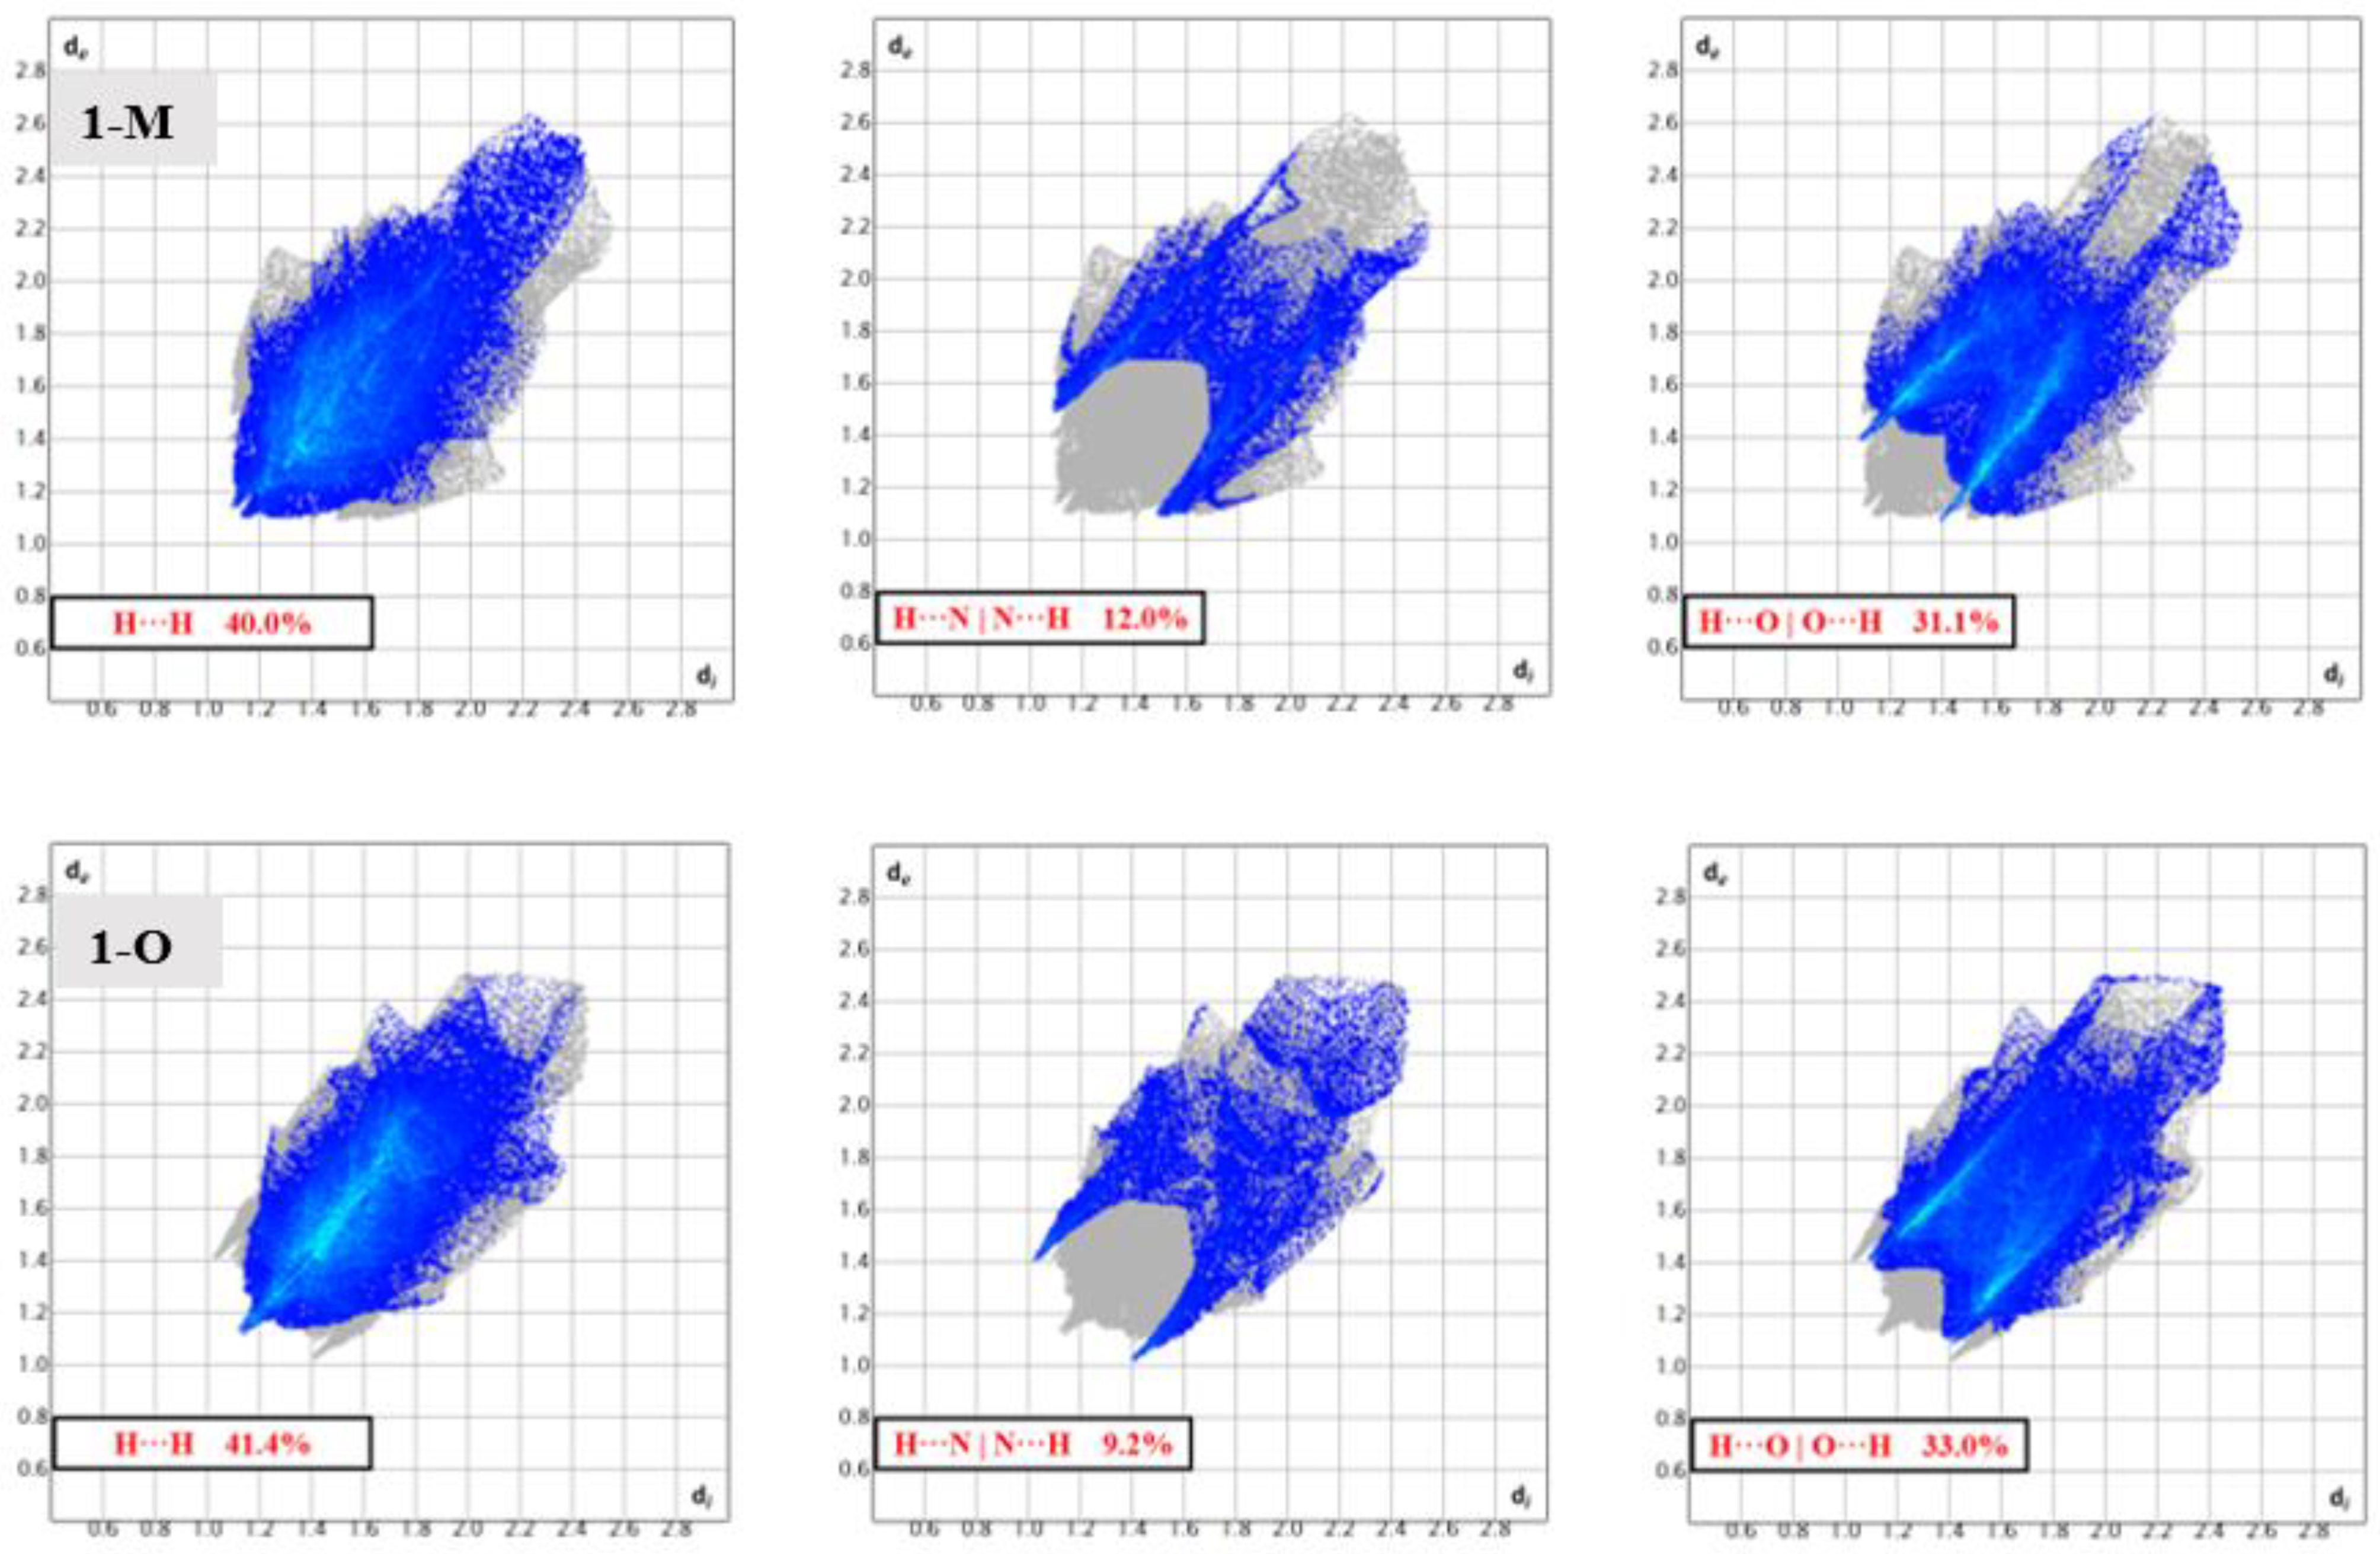
Structural fingerprints offer another visualization of the interactions for compounds. While the graphs of percentages of interactions can reveal overall changes, a structural fingerprint can reveal specific structural motifs and/or synthons [22]. For example, both fingerprints displayed a number of spikes, indicative of hydrogen interactions. Careful inspection of Figure 7 revealed five spikes in each structure. These five spikes corresponded to the reciprocal H···O|O···H, H···N|N···H spikes (four total) and a fifth spike for the H···H interactions. These spikes were well-established as common motifs within structural fingerprints [23,24]. The tail of the fingerprints, that is the top right-hand quadrant, contained a disperse set of interactions in both molecules. This disperse region is typically indicative of inefficient packing and/or atoms which only have long range interactions or produce voids [25].
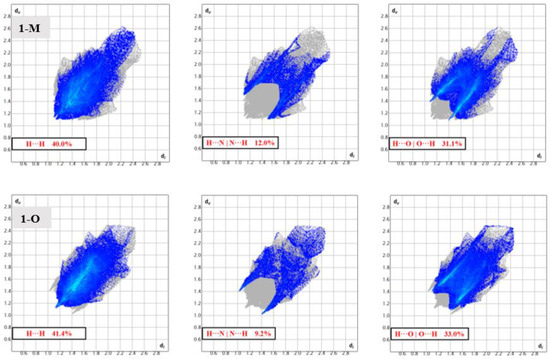
Figure 7.
Fingerprints depicting the ‘spikes’ arising from H···H, H···N, and H···O interactions in 1-M and 1-O. The differing shapes of these regions of interactions depict the distinct interactions in the polymorphs.
To examine the packing of the two polymorphs, the void space of the crystals was examined (see Figure 8). Structure 1-O had a higher total void space (198.37 Å3) than 1-M (144.75 Å3). Both crystals shared the feature of having one large void region near the piperazine ring with several additional smaller areas dispersed in the cell. For 1-M, the largest void domain resided near the equatorial position of the piperazine rings, appearing as a hydrophobic pocket as the surrounding environment is mostly comprised of C—H moieties. In 1-O, the void domain resided near the endo face of the twist-boat conformation for the piperazine ring. This void region also extended to the region nearby the adjacent carbonyl moiety. Analyzing these changes did coincide with the changes in the interactions within the two systems, offering a different visualization for the changes between the polymorphs.
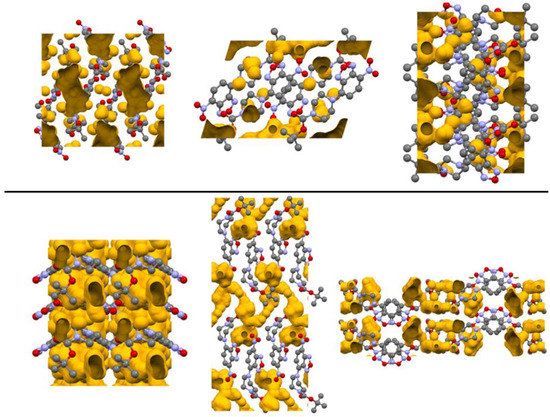
Figure 8.
Depiction of the crystalline voids in 1-M (top) and 1-O (bottom). Images are views from the crystallographic a, b, c axes from left to right. Hydrogen atoms omitted for clarity.
2.2. Interactions from the Carbonyl Group
As discussed, the carbonyl group displayed distinctive interactions when the two polymorphs were compared. Simply examining the Hirshfeld surface mapped with dnorm revealed a set of red spots over the carbonyl oxygen (O4) in both compounds indicative of short interactions. However, these interactions were quite unique for each polymorph. In 1-M, the carbonyl oxygen interacted with the π-hole of the nitrogen in the nitro moiety (3.0213(13) Å, d(O4···N5x, x = 1−x, 1/2 + y, 1/2−z), ∠C11—CO4···N5 = 159.54(8)°, see Figure 9). The geometry of this interaction, that is the distances and angle of the interaction, was in-line with previously reported studies [26,27]. This interaction was further examined through our computational studies (vide infra). Aside from the interaction with the nitro moiety, longer C=O···H interactions with both aromatic hydrogens on symmetry adjacent molecules with H···O distances of 2.80 and 2.90 Å were observed.
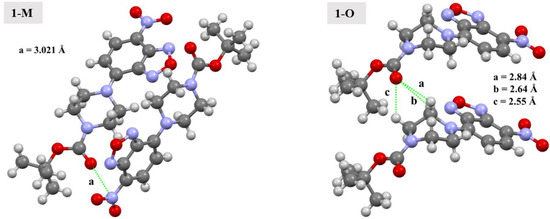
Figure 9.
Depiction of carbonyl interactions in 1-M and 1-O. Distances are given for the indicated interactions. Green lines represent the interactions between the atoms.
For 1-O, the interactions with O4 were considerably different. Two sets of red spots could be seen on the mapped dnorm surface, each of which corresponded to distinct C=O···H interactions. The larger spots corresponded to the carbonyl oxygen interacting with the methylene hydrogens on the piperazine ring (H9A and H10A) at distances of 2.64 Å (d(H9Ai···O4, i = +x, 1 + y, +z)) and 2.55 Å (d(H10Ai···O4)). Similar C—H···O interactions have been shown to be stabilizing in nature [14]. Additionally, studies have shown that π-hole interactions are of similar energetic magnitude as C—H···O interactions [28]. The smaller red spot on the mapped dnorm surface was O4 interacting with the methyl hydrogens from an adjacent t-butyl group (2.61 Å, d(O4···H14Bz, z = 1 − x, 2-y, −1/2 + z).
Looking at the respective fingerprints for the H···O | O···H and N···O|O···N interactions helped draw out these distinctive interactions from the carbonyl oxygen (see Figure 7 and Figure 10). Close inspection of the H···O|O···H fingerprint for 1-O revealed two sets of spikes: one blunted and one sharp. The blunt spike corresponded to the aforementioned CH2···O=C interactions while the sharp spike corresponded to the t-butyl group interactions. For 1-M, however, only one set of sharp spikes were seen, corresponding predominantly to the H···O interactions from the nitro moiety. The N···O|O···N fingerprints visualized the distinctive interactions. For 1-M, two sets of interactions could be seen. The set of interactions at di ≈ 1.7 Å, de ≈ 1.5 Å corresponded to the C=O···NO2 π-hole interaction while the upper set were residual contacts of the atoms due to π stacking. These dispersed π-stacking contacts but not the C=O···NO2 π-hole carbonyl interactions were also shown in 1-O.
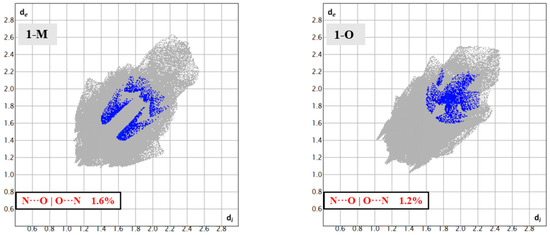
Figure 10.
Fingerprints for 1-M and 1-O showing the N···O reciprocal interactions. The lower set of blue spots in 1-M are from the discussed C=O···NNO2 interactions.
With respect to the carbonyl carbon (C11), both 1-M and 1-O displayed C—H···C interactions between the carbonyl carbon and methyl hydrogens from a symmetry adjacent t-butyl group. The fingerprints for the H···C|C···H interactions revealed some similarities and distinctions with the polymorphs regarding these interactions (Figure 11). For both crystals, the shortest H···C interaction was with C11 and an adjacent t-butyl group. The C—H···C distance was slightly shorter in 1-M (2.81 Å, d(H13Aj···C11, j = 2 − x,1/2 + y, ½ − z) than in 1-O (2.97 Å, d(H15Ak···C11, k = 1 − x, 1 − y, −1/2 − z). This CH3···C interaction effectively blocked one face of the carbonyl group given the bulk of the t-butyl moiety. The face opposite of the t-butyl group provided a distinction in the two structures, giving rise to a portion of the different shapes for the fingerprints.
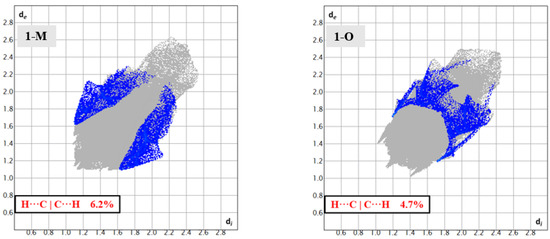
Figure 11.
Fingerprints for 1-M and 1-O showing the H···C reciprocal interactions.
For 1-M, C11 also interacted with the benzoxadiazole oxygen O1 at a distance of 3.3626(14) Å (d(C11···O1l, l = 1 − x, −1/2 + y, 1/2 − z)), albeit at a longer distance than previously reported interactions [29]. For 1-O, however, there were no interactions on the opposite face from the t-butyl group. This region, thus, was mostly unoccupied, accounting for a portion of the void space in the crystal. Close inspection of the mapped dnorm surface revealed a dark blue region in this pocket on 1-O, indicative of the absence of short interactions and manifesting as part of the disperse points on the fingerprints in the di ≈ de ≈ 2.4 Å region of the plot.
The ester oxygen (O5) was another point of distinction between the two polymorphs. The alkoxy oxygen of esters has been shown to participate in intra- and intermolecular interactions in previously reported examples [30]. In both cases, however, there were fewer interactions with the alkoxy oxygen atom predominantly due to steric hindrance. For 1-M, O5 interacted with a set of methyl hydrogens from an adjacent t-butyl group. The interactions were approximately 2.86 Å in distance. For 1-O, however, similar interactions with methyl hydrogens were further at approximately 2.99 Å. It should be noted that there were fewer explicit interactions observed with O5 in 1-O. This led to a void near the ester oxygen. When examining the optimized structures for both 1-M and 1-O, the exposed surface area of O5 was nearly identical at 4.894 Å3 for 1-M and 4.857 Å3 for 1-O; thus, the change in interactions was not likely to be caused by the change in conformation of the piperazine ring or the orientation of the carbonyl group. The distinct conformations of the rings showed a potential change in steric hindrance near the ester moiety caused by a change in position of the hydrogen atoms on the ring when examining a space filling model (see Figure 12). It should be stated that the distances for the interactions with the ester alkoxy oxygen in either polymorph were longer than in previously reported structures wherein these interactions were purported to be of importance to the formation of the crystal [31].
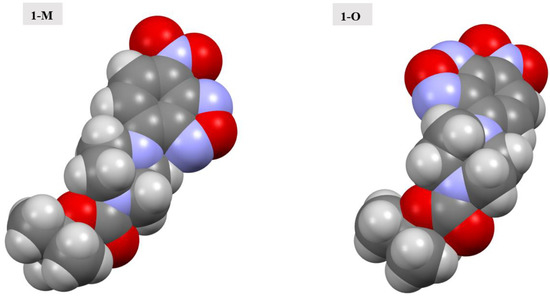
Figure 12.
Spacefilling models of the molecular structures of 1-M and 1-O.
Contrasting the two polymorphs with respect to carbonyl interactions led to several key observations. First, the carbonyl oxygen was capable of interacting with either methyl or methylene groups on the piperazine ring. Second, the alkoxy ester oxygen also interacted with adjacent hydrogen moieties, though at longer distances than the carbonyl oxygen. Third, the carbonyl carbon also displayed unique contacts with both H and O atoms. Finally, the carbonyl oxygen could interact with the π-hole of the nitro moiety.
2.3. Interactions from/with the Piperazine
The conformational change from chair to twist-boat for the piperazine ring impacted several key interactions which were present in the two crystal structures. One point to bear in mind is that the piperazine rings not only have different conformations, but also have different angles with respect to the benzoxadiazole ring. The torsion angles are shown in Figure 13 for clarity. As can be seen, the aromatic nitrogen (N3) of the piperazine ring in 1-O had less of a ‘twist’ as compared with the nitrogen of 1-M, wherein a larger torsion angle was observed.
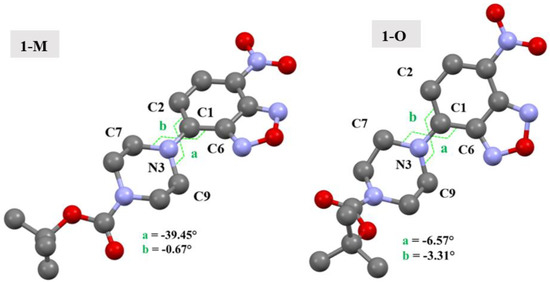
Figure 13.
Molecular structures of 1-M and 1-O showing the torsion angles which show the different arrangement of the piperazine ring. Hydrogens omitted for clarity.
The most common interactions observed with the piperazine ring were H···O interactions arising from the nitro moiety on symmetry adjacent molecules. This was true for both polymorphs, though variations in distances and angles of the interactions were observed, as expected. For 1-M, both equatorial and axial hydrogens on the piperazine ring made close contact with the adjacent oxygen atoms. The majority of these interactions ranged from 2.56 to 3.19 Å. For 1-O, these interactions ranged from 2.68 to 2.90 Å, putting both sets of interactions in the range of previously reported interactions of this nature [32]. The remaining interactions appeared to be H···H interactions from adjacent t-butyl moieties, and the previously discussed carbonyl interactions in 1-O (vide supra).
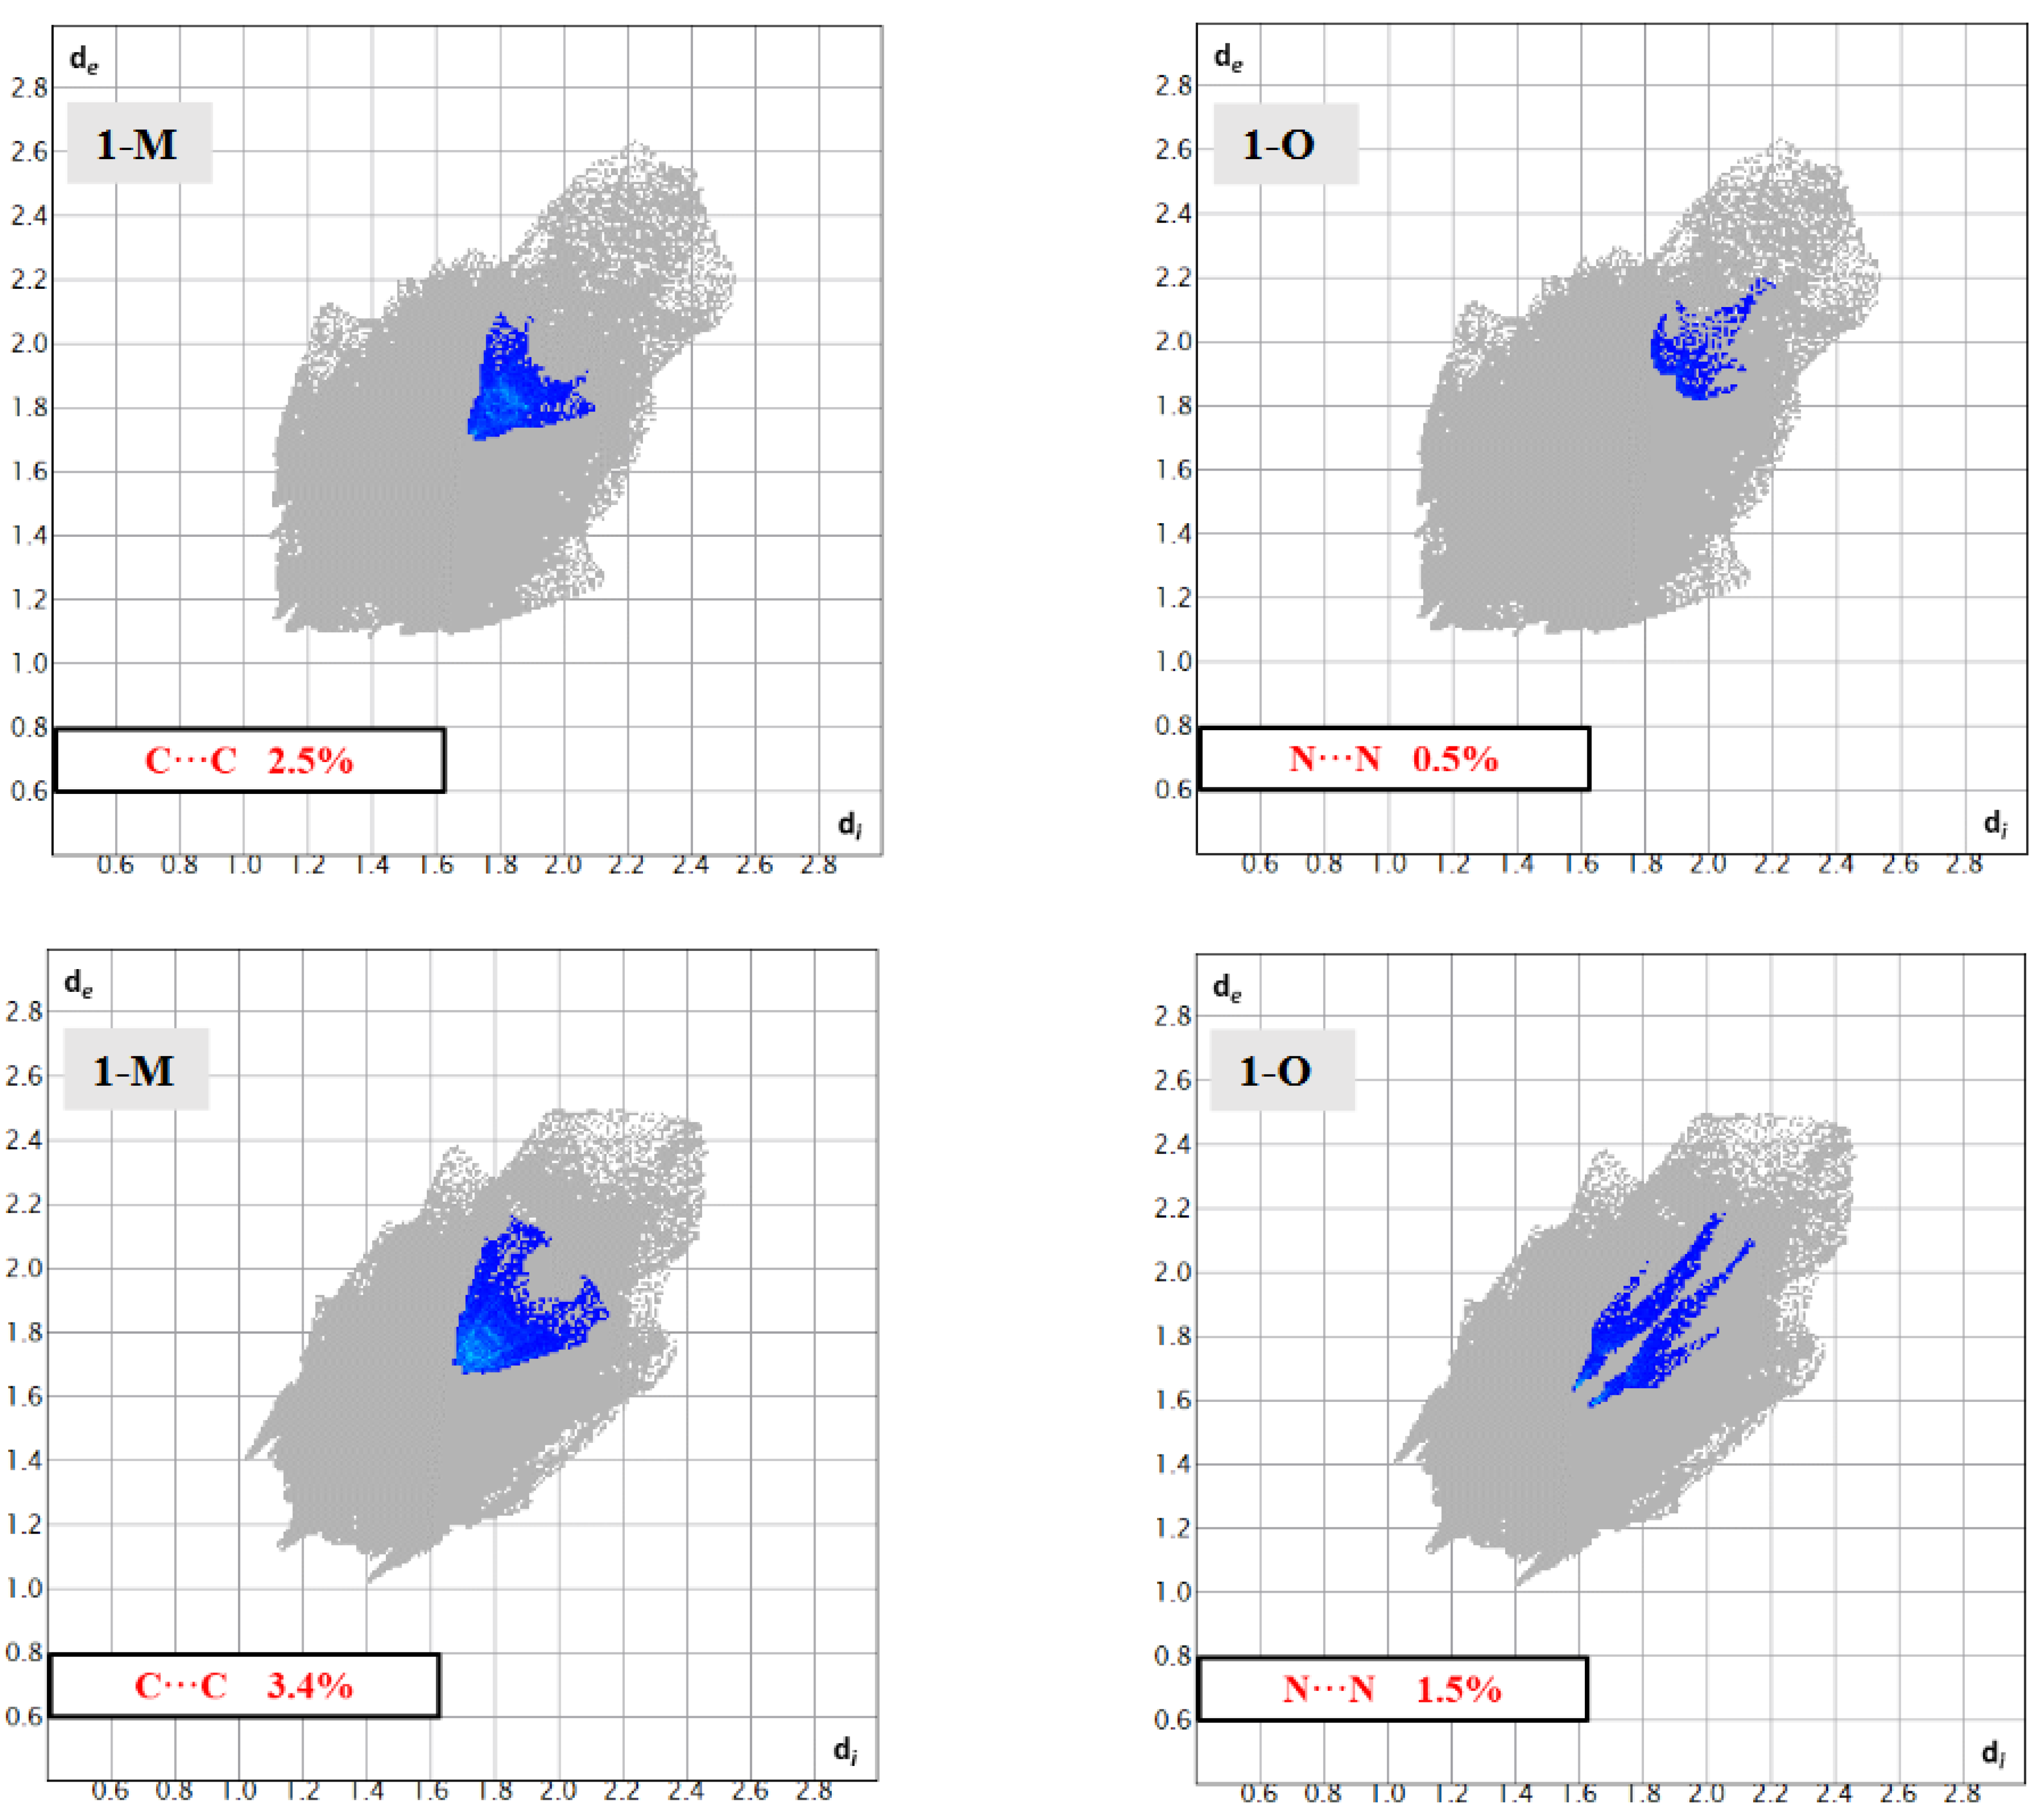
One common feature in the structures was the presence of distinct N···NO2(π) interactions. In 1-O, the arrangement of the benzoxadiazole rings led to the formation of π···π stacks. Further, this stacking also led to the formation of N···NO2(π) interactions between the aromatic amine N3 and the nitrogen in the nitro group (N5) at a N···N distance of 3.234(3) Å (d(N5···N3m, m = 3/2 − x, +y, −1/2 + z)). A similar interaction was also displayed by 1-M though it was longer at 3.770 Å (d(N5···N3n, n = 3/2 − x, +y, −1/2 + z)). There are two important structural features to note with respect to these N···N interactions. First, note that due to the difference of the torsion angle for the piperizine rings in 1-M vs. 1-O, the angle of this N···N interaction was different with a C1—N3···N5 angle of 88.44(15)° for 1-O and 96.30(6)° for 1-M. Second, while both structures did exhibit π-π stacking, the stacking motif was quite different (see Figure 14). The different arrangements naturally led to a different arrangement of the N atoms, allowing 1-O to form both the π stacks and the N···N interactions with the same molecule. In 1-M, however, the π stacks did not form the N···N interactions. These distinctions were readily visualized with the fingerprints of the N···N and C···C interactions for both structures (Figure 15). This was an unexpected interaction given the delocalization of the electrons on the aromatic amine would likely weaken this π-hole interaction with the nitro moiety.
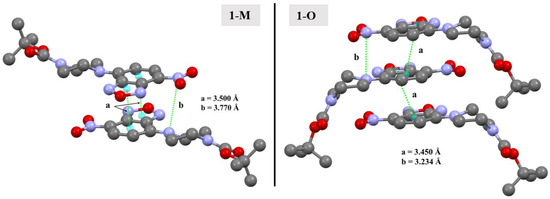
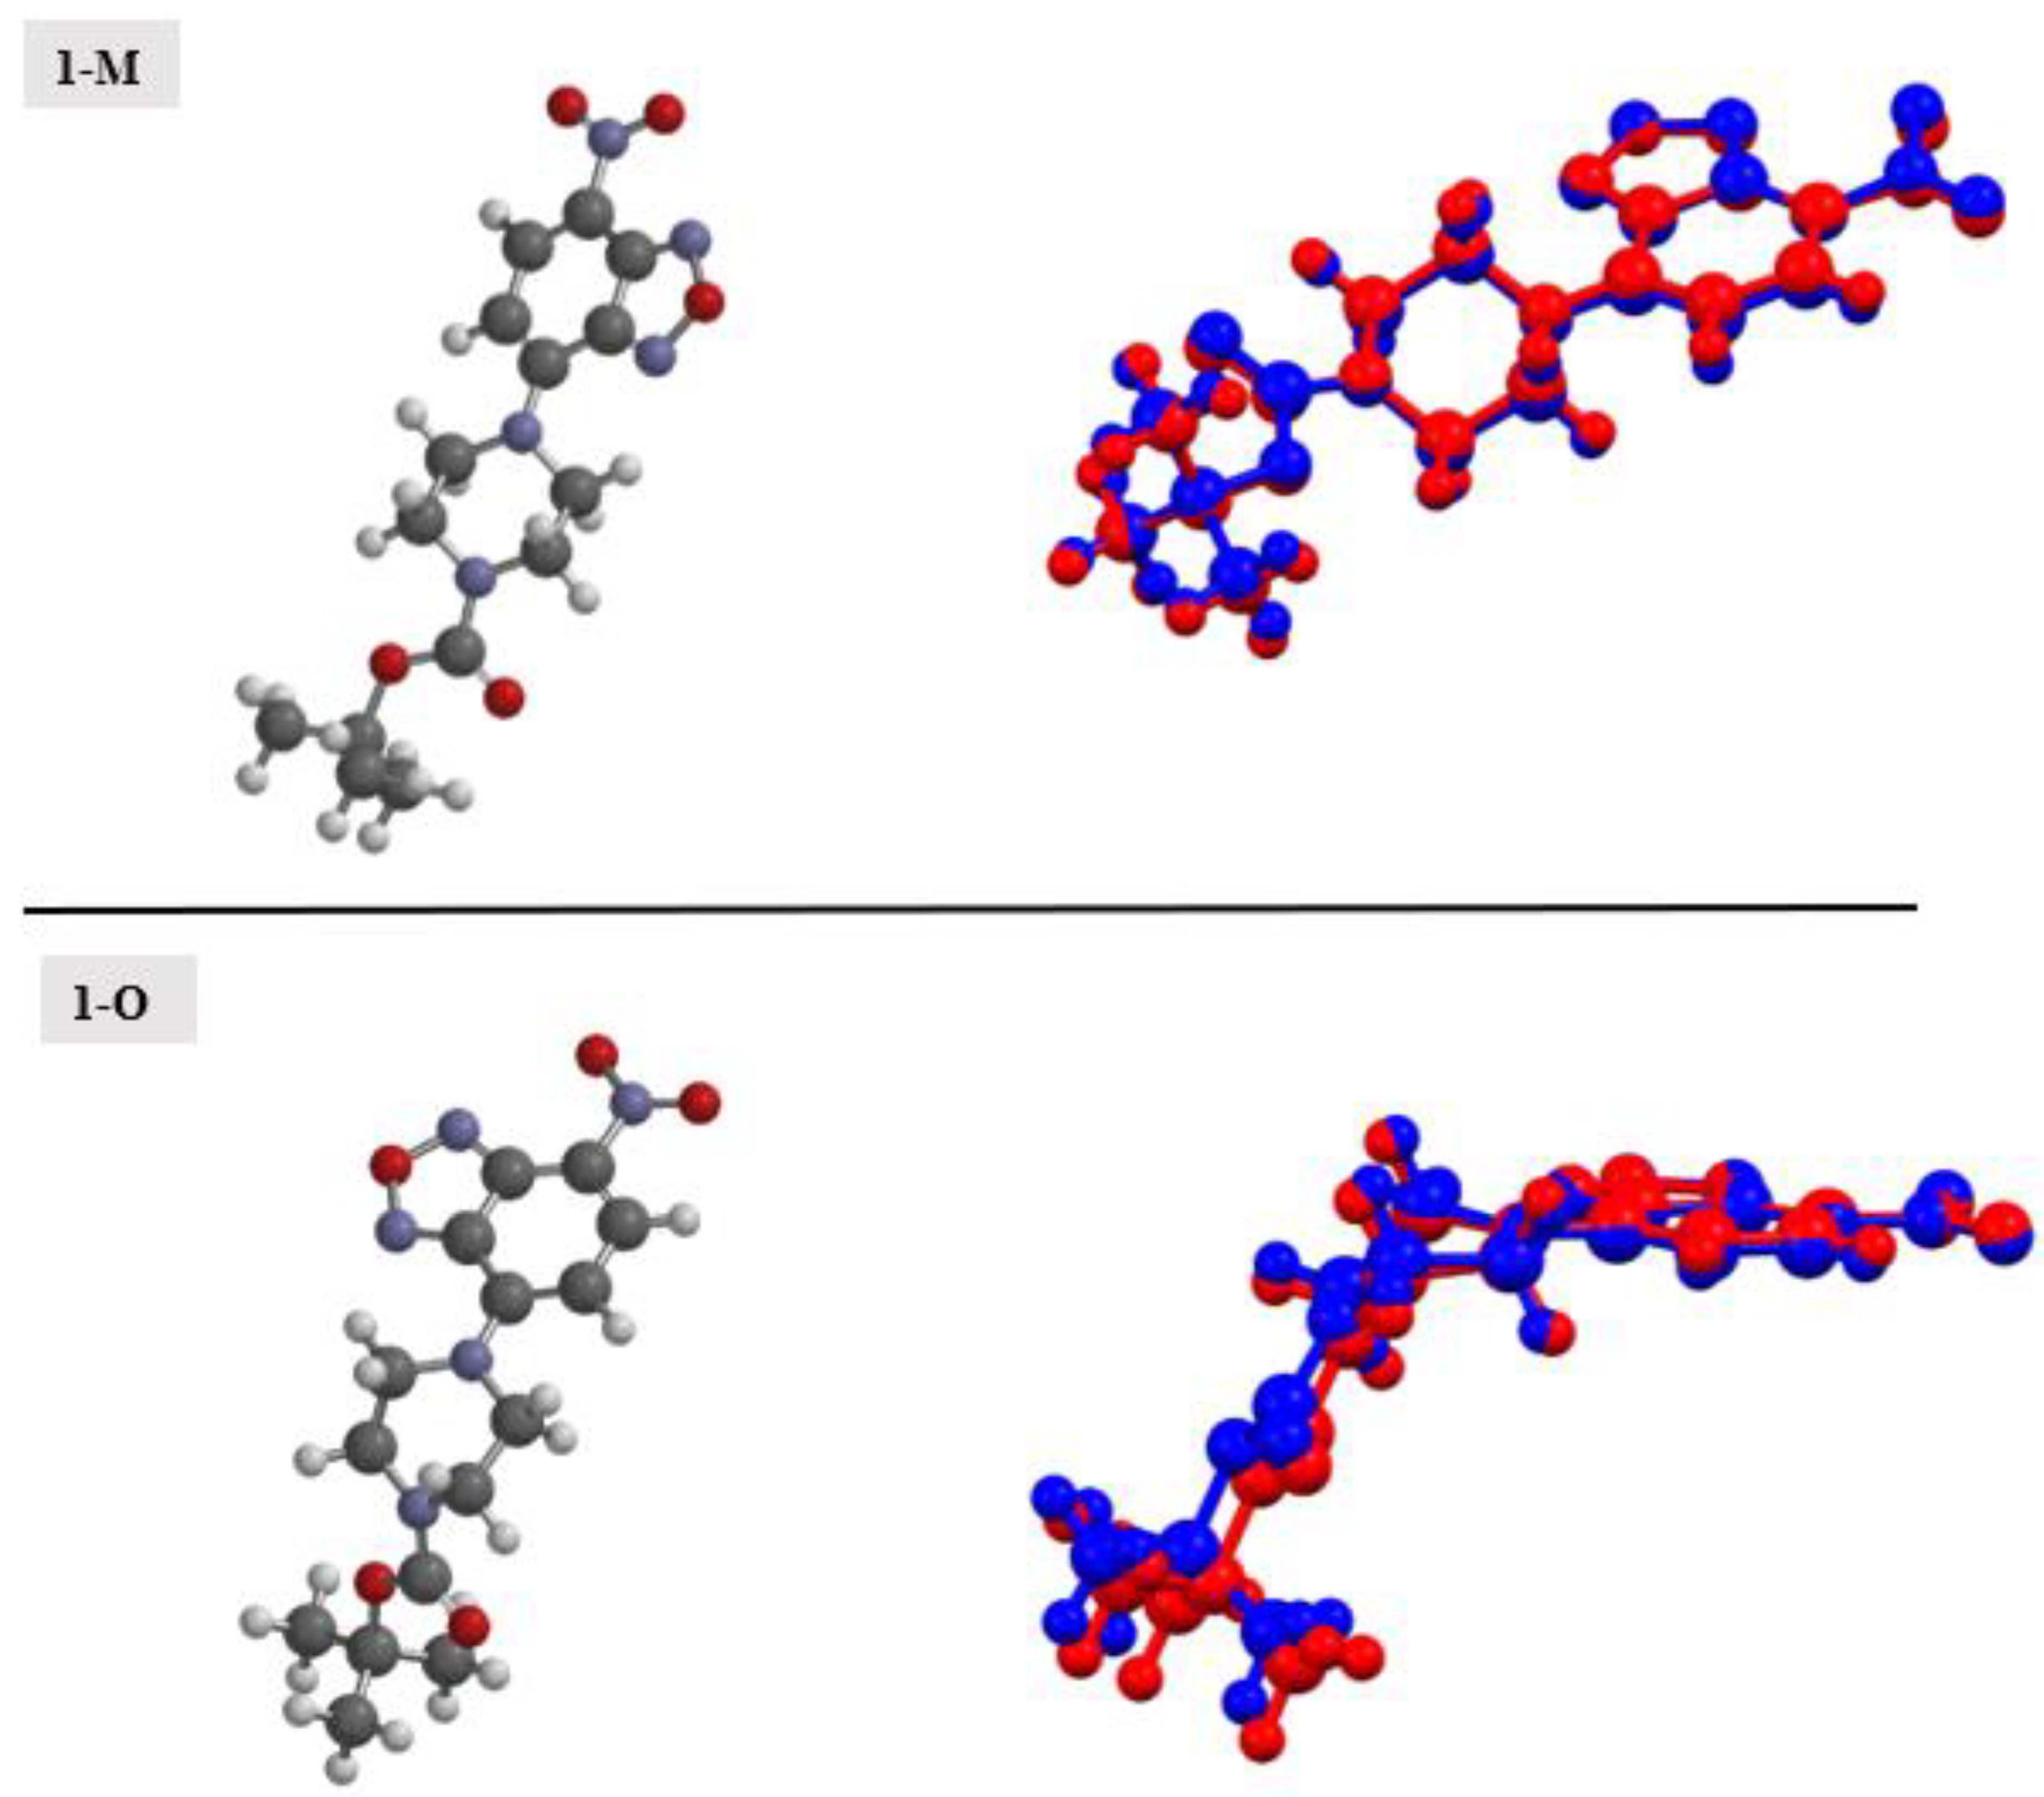
Figure 14.
Depictions of the π-π interactions in 1-M and 1-O (a) and the N···NNO2 π-hole interactions (b). Hydrogens omitted for clarity.

Figure 15.
Fingerprints for 1-M and 1-O showing the C···C and N···N interactions.
As a summary, several key features were observed with the piperazine ring. First, H··· interactions were the most common interactions in terms of quantity. With respect to these interactions, 1-M had shorter interactions with a larger range of distances. Slightly longer H··· interactions were shown by 1-O, but in a narrower range. Second, the methylene hydrogens were also observed interacting with the carbonyl moiety in 1-O but not 1-M. These interactions were of comparable distance to those observed with the nitro moieties. Finally, N···N interactions were observed between the aromatic piperazine nitrogen and a nitro moiety in both polymorphs.
2.4. Energy Frameworks
Energy frameworks provide a visualization of the forces which lead to the formation of a crystal, or, at the least, how individual moieties in a crystal interact [33,34]. Images of the frameworks are shown in Figure 16 and Table 2 summarizes the individual interactions and the calculated energies corresponding to the colored molecules in the figures.
Figure 16.
Energy frameworks for 1-M (top) and 1-O (bottom) viewed from the a, b, c axis (left to right). Tube coloring indicates coulombic (red), dispersion (green), and total (blue) energies. A cutoff of 15 kJ/mol was used.
Table 2.
Table listing calculated energies for the frameworks, color-coded by molecules in the images.
For both structures, dispersion was the dominant energetic framework, with electrostatic energy being second. The calculated repulsion energy, however, was larger than the electrostatic energy in most cases. Examination of the visualized frameworks in Figure 16 shows that the total energy frameworks (blue) matched closest with the dispersion frameworks (green). For both molecules, the largest single contribution arose from the interactions wherein both π-stacking and the π-hole interactions were present (purple for 1-M, red for 1-O). The second largest dispersion contribution came from interactions with the carbonyl group. Here, the difference in the structures was more distinct as 1-M had the carbonyl group forming π-hole interactions with the nitro moiety while 1-O formed C=O···H interactions with the piperazine ring. For these interactions, 1-M had a higher repulsion term (+31.8 kJ/mol) than 1-O (+28.5 kJ/mol) likely due to the proximity of the t-butyl group in 1-M. Curiously, 1-O had a destabilizing interaction from longer H···H interactions between the piperazine ring and a t-butyl group (orange color, Etot = +1.1 kJ/mol). Such a repulsive interaction was not exhibited by 1-M.
2.5. Computational Studies
The molecular structures from the crystals were computationally optimized (Figure 17). Table 1 lists a comparison of the relevant bond distances between the calculated and experimental structures. In general, there was good agreement between the calculated and experimental structures with bond distances being comparable. Examining the calculated total energy of the structures, the chair conformation (1-M, −1232.72532 au) was a lower energy conformer when contrasted with the twist-boat conformer (1-O, −1232.7225 au).

Figure 17.
Optimized structures for 1-M and 1-O (left). An overlay of the experimental structure (blue) and the calculated structures (red) (right).
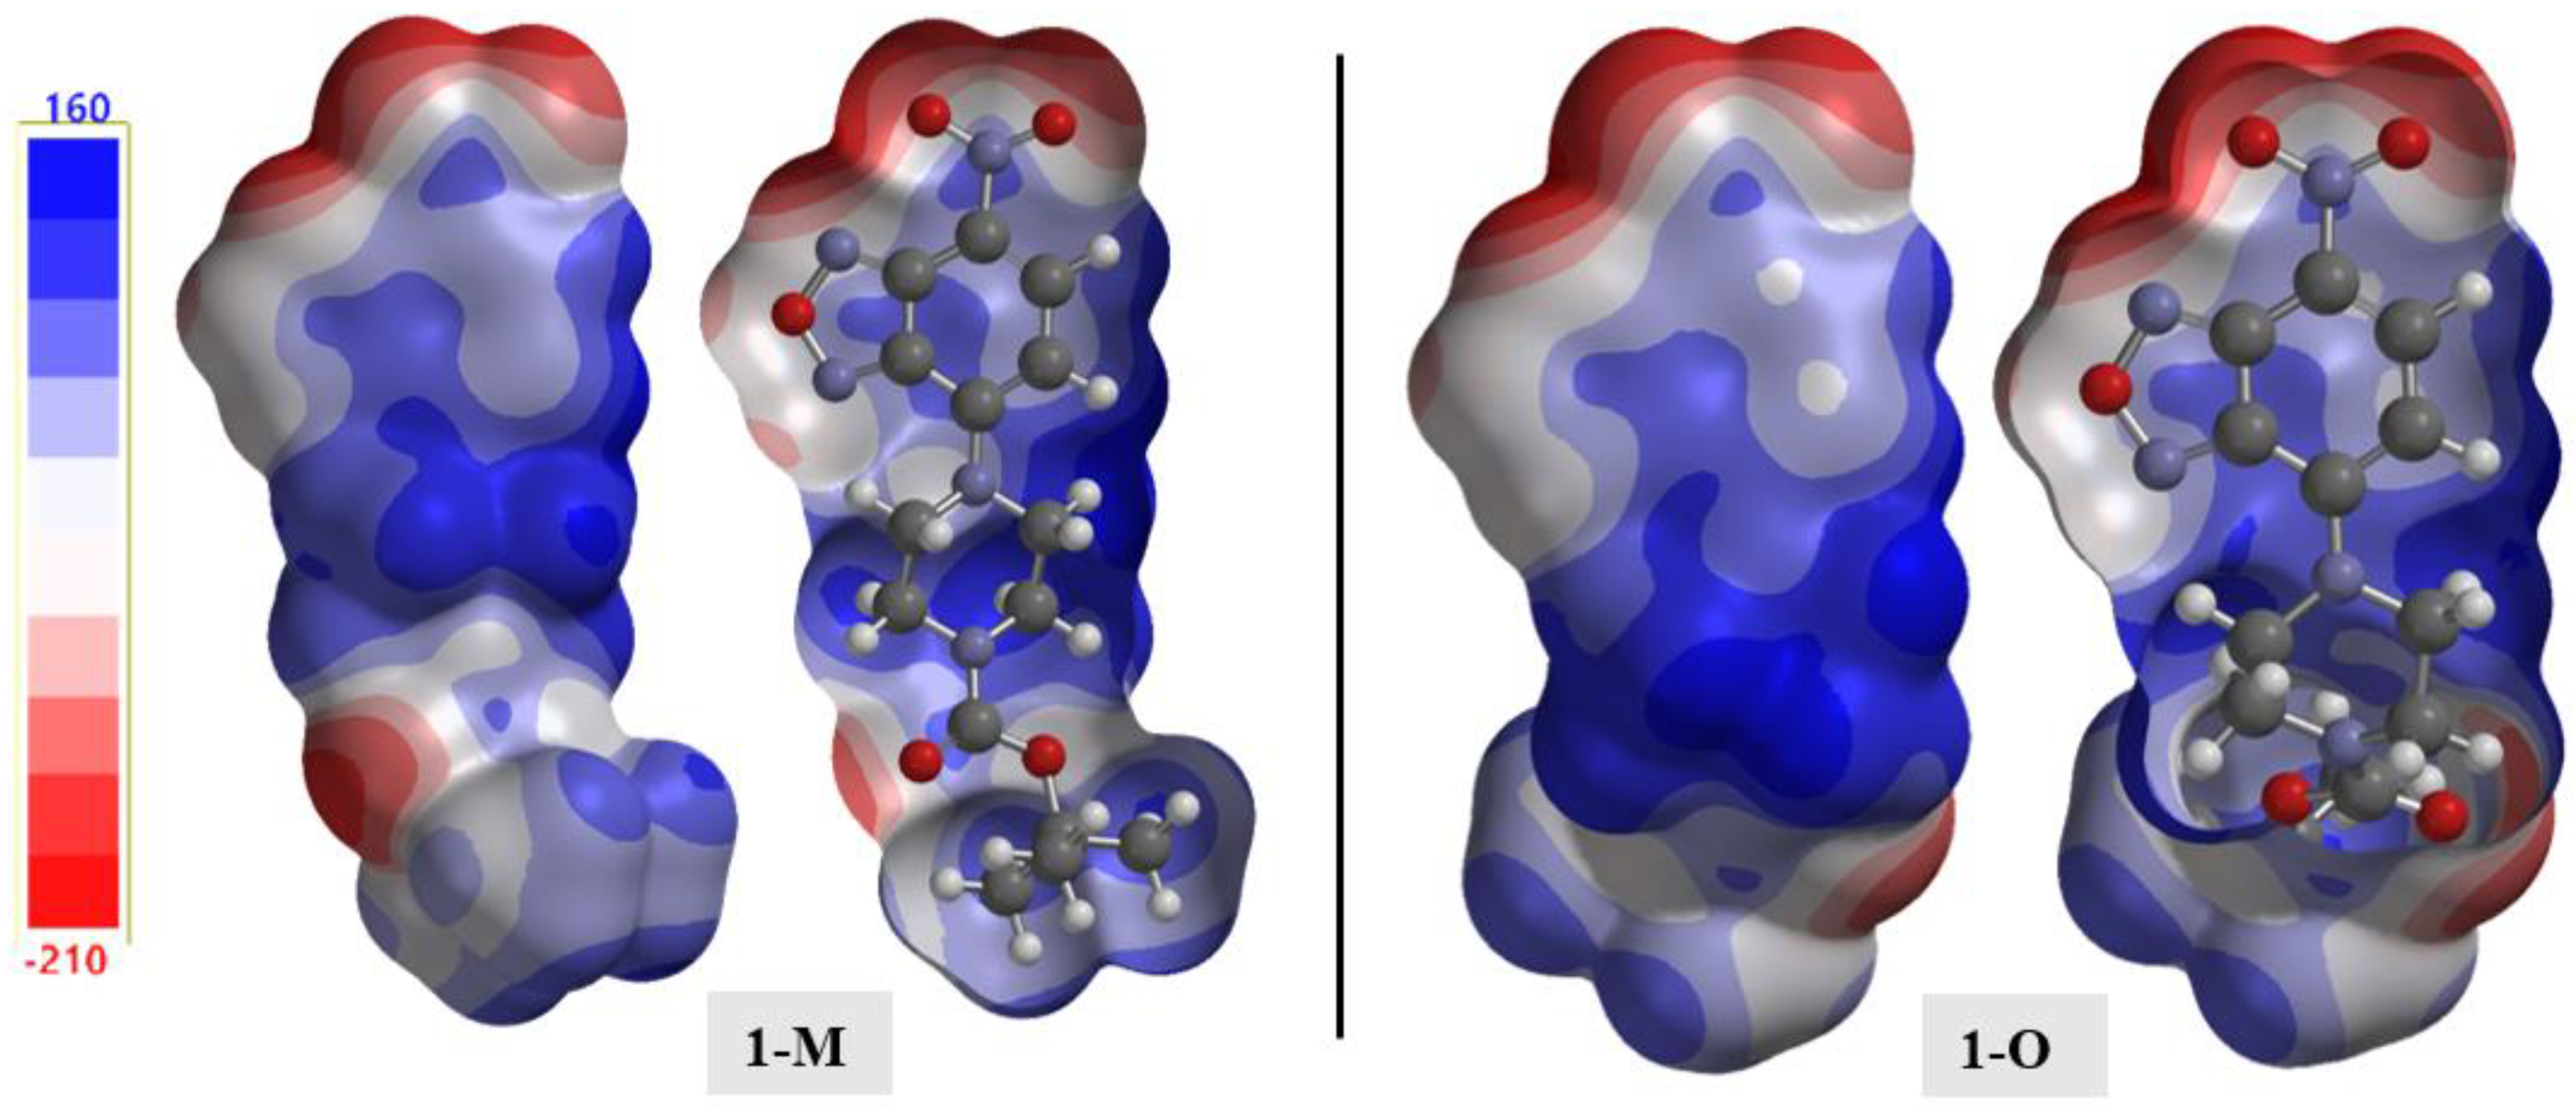
The electrostatic potential (ESP) is a useful tool for distinguishing potential interactions, especially in the case of crystal packing [35,36]. The calculated structures mapped with the ESP are shown in Figure 18. A few salient details emerged when examining the ESP surface. First, examining the ESP surface surrounding the nitro moiety revealed the π-hole as the light blue shaded surface above the nitrogen atom. As discussed in previous sections, interactions within this region of positive potential were present in both structures. Second, the nitrogen atoms in the oxadiazole ring had different negative potentials, with N1 (Vs,min = −199.1 kJ) being more negative than N2 (Vs,min = −48.0 kJ). Third, the oxadiazole oxygen O1 was the least negative of the oxygen atoms in the structure with a potential of Vs,min = −74.3 kJ. This observation helped rationalize the longer interactions arising from this oxygen atom as compared with the other more negative oxygen-bearing moieties in the structure.
Figure 18.
The calculated electrostatic potential maps for 1-M and 1-O. A cutaway of the surface is shown for clarity.
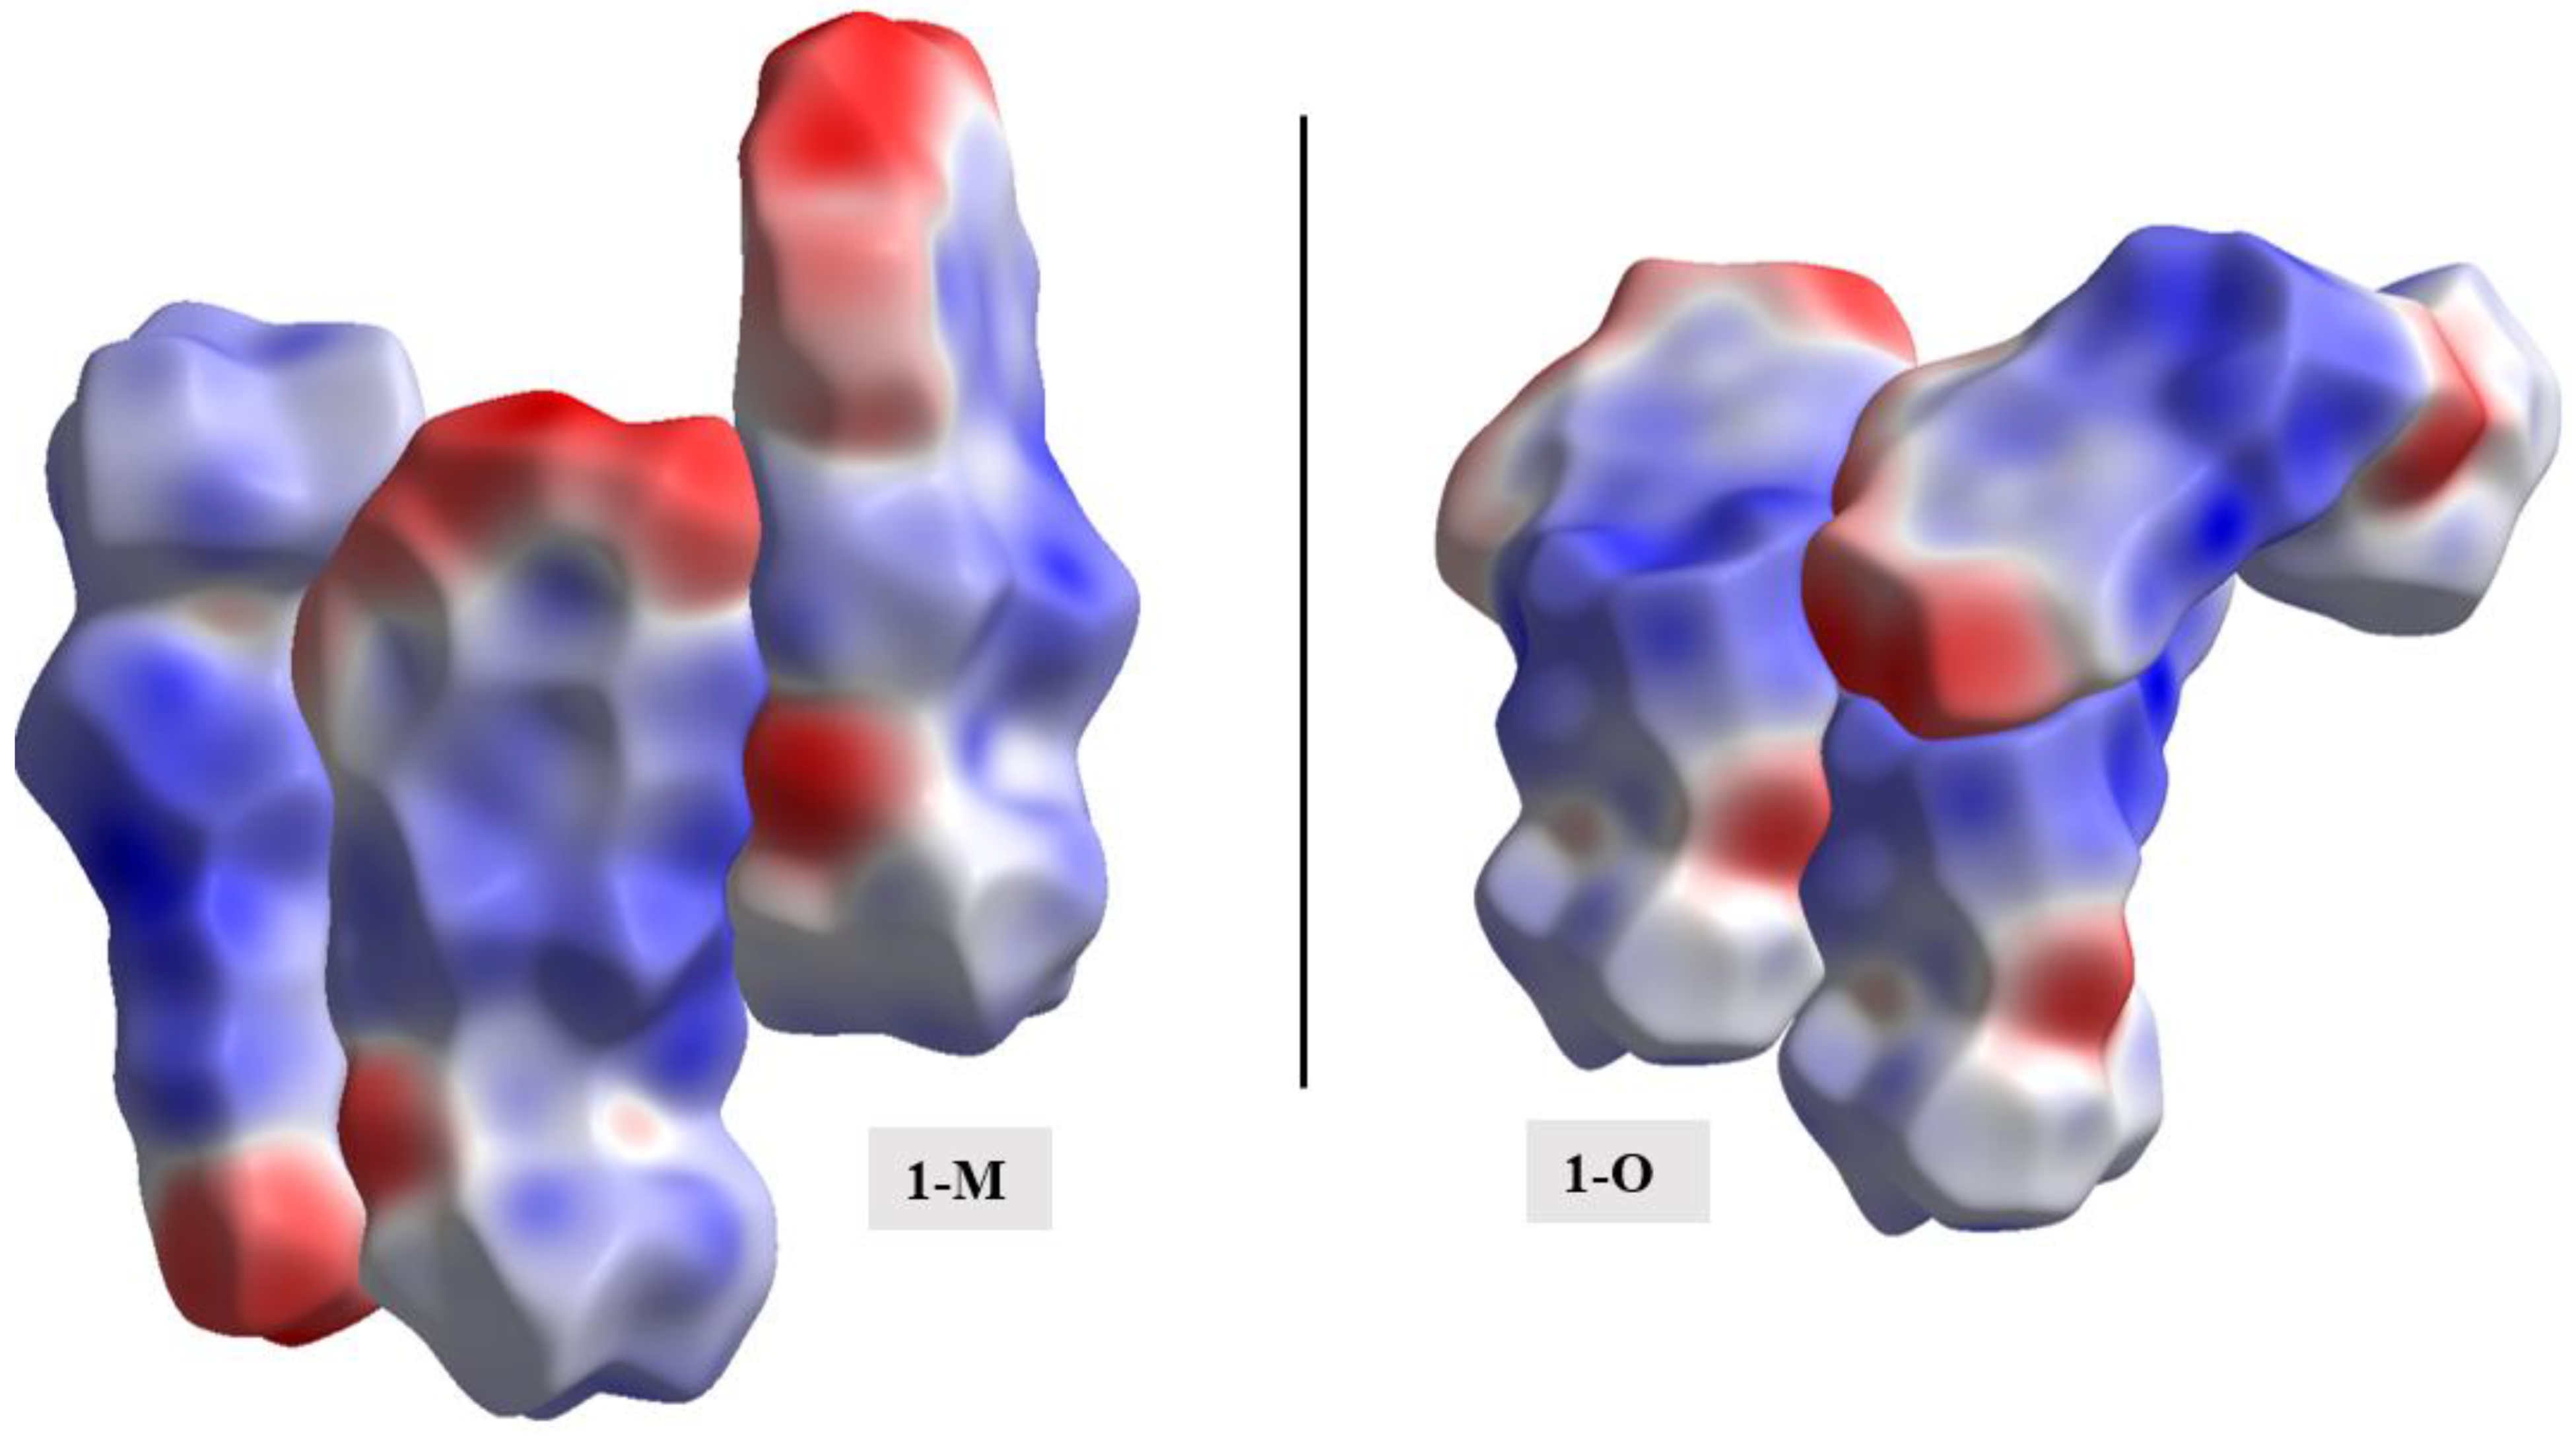
As with the energy frameworks, the ESP can also shed light into how molecules pack together. The Hirshfeld surfaces were mapped with the ESP for the molecules and a representative packing of the structures was generated (see Figure 19). The negative regions, i.e., nitro and carbonyl moieties, favored interactions with the more positive surfaces of the compounds (i.e., hydrogens). The carbonyl···nitro interaction in 1-M, when viewing the mapped ESP surface, showed a close overlap of two negative regions making this interaction a curious distinction when comparing the two molecules.

Figure 19.
A representative packing of the compounds with the Hirshfeld surfaces mapped with the electrostatic potentials.
To help with future studies [37], a set of chemical descriptors were collected for each polymorph (see Table 3). Comparing the two sets of descriptors revealed a few noteworthy observations. For example, the changes in molecular geometry could be observed when comparing the differences in volume for both polymorphs. Further, a notable change in asphericity was seen wherein 1-O (0.272) had a value approximately 67% of 1-M (0.402).
Table 3.
Tabulated chemical descriptor data for 1-M and 1-O. a—Volume of the Hirshfeld surface, Å3; b—calculated volume, Å3; c—Crystalline void space, Å3; d—Hirshfeld surface area, Å2, e—Å2; f—calculated dipole moment, Debye.
3. Conclusions
Two polymorphs of a substituted 2,1,3-benzoxazdiazole compound were crystallized. The distinguishing intermolecular interactions of the polymorphs were analyzed, and the crystal structures thoroughly examined using Hirshfeld surface analysis, void space analysis, and computational studies. Our studies revealed several distinguishing characteristics and important non-covalent interactions.
Two main distinctions were observed in the polymorphs: conformational changes in a piperazine ring and the orientation of a carbonyl group relative to the heterocyclic core. Both of these changes led to non-covalent interactions being distinguished which accounted for the formation of the polymorphic forms. Examination of the fingerprints derived from the Hirshfeld surfaces helped with distinguishing these characteristic changes via variations in the shapes of the individual fingerprint regions.
Of particular relevance was the presence of distinctive π-hole interactions. Interactions between the carbonyl oxygen and the nitrogen of the nitro moiety were observed for one polymorph (1-M). However, both structures showed π-hole interactions involving the aromatic amine and the nitro group. However, the polymorph 1-O had a notably shorter N···N interaction. Torsion angles in the aromatic amine appeared to be the distinguishing factor for these interactions.
Calculated energy frameworks were used to help draw visual distinctions in the interactions leading to the two polymorphs. Dispersion forces were found to be the dominant contribution in both structures. The frameworks revealed destabilizing H···H interactions in the orthorhombic form, which was a unique distinction in the structures.
Intramolecular interactions between the benzoxadiazole ring and hydrogen atoms on the substituents led to the formation of N···H hydrogen bonds. However, steric interactions were also a concern. These intramolecular interactions likely cause the different piperazine conformers, as was observed in other related structures [38,39]. As such, we anticipate other energetically accessible conformers of this compound to be possible.
4. Experimental Section
Synthesis of tert-butyl 4-(7-nitro-2,1,3-benzofurazan-4-yl)-1-piperazinecarboxylate (1).
A round bottom flask containing a stir bar was charged with 20 mL of dimethylformamide. To this 400.0 mg of 4-chloro-7-nitrobenzofurazan (2.0 mmol), 745.0 mg of tert-butylpiperazine-1-carboxylate (4.0 mmol), and 557.0 microliters of triethylamine (4.0 mol) was added. The mixture was sealed with a septum and allowed to stir for 45 min. The reaction was monitored by TLC (99:1 dichloromethane:methanol). Once the reaction had reached completion, 75 mL of water was added, and the solution was stirred for 10 min. A red colored solid formed upon the addition of the water. This red solid was collected, washed with water, and dried under vacuum yielding (580.0 mg, 86% yield).
Single crystals suitable for diffraction were grown from the slow evaporation of dichloromethane yielding 1-M. Slow evaporation from acetone yielded 1-O.
1H-NMR (400 MHz; chloroform) δ 8.39 (d, J = 8.6 Hz, 1H), 6.28 (d, J = 8.6 Hz, 1H), 4.11 (d, J = 0.6 Hz, 4H), 3.74 (s, 4H), 1.49 (s, 9H).
13C-NMR (101 MHz; acetone-d6): δ 155.0, 146.4, 146.0, 145.8, 136.4, 103.9, 80.3, 49.9, 28.5.
5. Spectroscopy
1H and 13C NMR spectroscopies were performed on a JEOL 400 MHz NMR. Deuterated NMR solvents were purchased from Cambridge Isotope Labs. Chemical shifts were referenced to the residual solvent peaks in the NMR spectra. Complete NMR spectra are provided in the supplemental information. Infrared spectra were recorded on a Perkin Elmer Spectrum II with ATR attachment.
6. Single Crystal Diffraction
For both compounds, data were collected, reflections were indexed and processed, and the files scaled and corrected for absorption using APEX3 [40] and SADABS [41]. For all compounds, the space groups were assigned using XPREP within the SHELXTL suite of programs [42,43], the structures were solved by direct methods using ShelXS or ShelXT [44] and refined by full matrix least squares against F2 with all reflections using Shelxl2018 [45] using the graphical interfaces Shelxle [46] and/or Olex2 [47]. H atoms were positioned geometrically and constrained to ride on their parent atoms. C-H bond distances were constrained to 0.95 Å for aromatic C-H moieties and 0.98 Å for methylene and methyl C-H moieties. Methyl H atoms were allowed to rotate to best fit the experimental electron density. Uiso(H) values were set to a multiple of Ueq(C) with 1.2 for C-H units.
Complete crystallographic data, in the CIF format, were deposited with the Cambridge Crystallographic Data Centre. CCDC 2,192,541 and 2,192,542 contains the supplementary crystallographic data for this paper. These data can be obtained free of charge from The Cambridge Crystallographic Data Centre via www.ccdc.cam.ac.uk/data_request/cif (accessed on 27 July 2022).
7. Computational Studies
The molecular structures from the crystals were loaded into the Spartan Software suite (Spartan’20, Wavefunction, Inc., Irvine, CA, USA) and the geometries optimized using ωB97X-D functional [48] with the 6-311++G(2d,2p) basis set. Optimized structures were checked for imaginary frequencies.
Hirshfeld surfaces, the resultant images, energy frameworks, and fingerprint plots were calculated and produced using CrystalExplorer21 [49]. Distance analysis of the structures was accomplished using Olex2 and Mercury [50].
Energetic frameworks were calculated following the established procedures [34]. Corrected interactions energies [51] were calculated using the CE-B3LYP/6-31G(d,p) model imbedded within CrystalExplorer using Tonto [52]. The sizes of the tubes were relative to the magnitude of the interactions for the molecules. A tube size of 300 was used for the images. A cutoff of 15 kJ/mol was used for all framework images.
Reduced density gradient [53] (RDG) analysis was accomplished using the Multiwfn software [54]. Visualization of the results was accomplished using VMD [55]. The input wavefunction files for the analysis were acquired using ORCA [56] employing the ωB97X [48] methods and the def2-TZVPPD [57,58] basis set in conjunction with the NoSpherA2 [59] software in Olex2. The isosurfaces were plotted with a 0.6 isovalue to best represent the interactions discussed.
Crystalline voids were calculated using Mercury based on contact surfaces. A probe radius of 0.7 Å with a 0.1 Å grid spacing was used.
Supplementary Materials
The following supporting information can be downloaded at: https://www.mdpi.com/article/10.3390/cryst12081143/s1. Figure S1. 1H NMR of compound 1; Figure S2. 13C NMR of compound 2; Figure S3. Infrared spectrum of Compound 1 taken from reaction; The CIF crystallographic data.
Author Contributions
Conceptualization, P.C.H. and A.J.B.; methodology, P.C.H. and M.Z.; software, P.C.H. and M.Z.; validation, P.C.H., A.J.B., M.Z.; formal analysis, P.C.H. and M.Z.; investigation, P.C.H., M.Z., and K.S.; resources, P.C.H.; data curation, P.C.H. and M.Z.; writing—original draft preparation, P.C.H.; writing—review and editing, P.C.H., A.J.B., M.Z., and K.S.; visualization, P.C.H.; supervision, P.C.H. and A.J.B.; project administration, P.C.H. and A.J.B.; funding acquisition, P.C.H., A.J.B., and M.Z. All authors have read and agreed to the published version of the manuscript.
Funding
Funding for this work was provided by Ave Maria University Department of Chemistry and Physics. P.C.H would like to thank Florida Gulf Coast University Department of Chemistry and Physics for use of their equipment. Part of this material is based upon work supported by the National Science Foundation through the Major Research Instrumentation Program under Grants No. CHE-1530959 and CHE-1625543.
Conflicts of Interest
The authors declare no conflict of interest.
References
- Cruz-Cabeza, A.J.; Bernstein, J. Conformational Polymorphism. Chem. Rev. 2014, 114, 2170–2191. [Google Scholar] [CrossRef]
- Nangia, A. Conformational Polymorphism in Organic Crystals. Acc. Chem. Res. 2008, 41, 595–604. [Google Scholar] [CrossRef] [PubMed]
- Kersten, K.; Kaur, R.; Matzger, A. Survey and analysis of crystal polymorphism in organic structures. IUCrJ 2018, 5, 124–129. [Google Scholar] [CrossRef] [PubMed]
- Cruz-Cabeza, A.J.; Feeder, N.; Davey, R.J. Open questions in organic crystal polymorphism. Commun. Chem. 2020, 3, 142. [Google Scholar] [CrossRef]
- Beran, G.J.O.; Sugden, I.J.; Greenwell, C.; Bowskill, D.H.; Pantelides, C.C.; Adjiman, C.S. How many more polymorphs of ROY remain undiscovered. Chem. Sci. 2022, 13, 1288–1297. [Google Scholar] [CrossRef]
- Lévesque, A.; Maris, T.; Wuest, J.D. ROY Reclaims Its Crown: New Ways to Increase Polymorphic Diversity. J. Am. Chem. Soc. 2020, 142, 11873–11883. [Google Scholar] [CrossRef]
- Chistyakov, D.; Sergeev, G. The Polymorphism of Drugs: New Approaches to the Synthesis of Nanostructured Polymorphs. Pharmaceutics 2020, 12, 34. [Google Scholar] [CrossRef]
- Themed issue: Polymorphism and crystal forms. N. J. Chem. 2008, 32, 1657–1658. [CrossRef]
- Nogueira, B.A.; Castiglioni, C.; Fausto, R. Color polymorphism in organic crystals. Commun. Chem. 2020, 3, 34. [Google Scholar] [CrossRef]
- McKinnon, J.J.; Fabbiani, F.P.A.; Spackman, M.A. Comparison of Polymorphic Molecular Crystal Structures through Hirshfeld Surface Analysis. Cryst. Growth Des. 2007, 7, 755–769. [Google Scholar] [CrossRef]
- Bourne, S.A. Intermolecular Interactions in Crystals: Fundamentals of Crystal Engineering; Novoa, J.J., Ed.; The Royal Society of Chemistry: London, UK, 2018. [Google Scholar]
- Desiraju, G.R.; Vittal, J.J.; Ramanan, A. Crystal Engineering; Indian Institute of Science: Bangalore, India; Singapore, 2011. [Google Scholar] [CrossRef]
- Gavezzotti, A. Molecular Aggregation: Structure Analysis and Molecular Simulation of Crystals and Liquids; IUCr Monographs on Crystallography; Oxford University Press: Oxford, UK; New York, NY, USA, 2007. [Google Scholar]
- Dunitz, J.D.; Gavezzotti, A. Supramolecular Synthons: Validation and Ranking of Intermolecular Interaction Energies. Cryst. Growth Des. 2012, 12, 5873–5877. [Google Scholar] [CrossRef]
- Galli, S. X-ray Crystallography: One Century of Nobel Prizes. J. Chem. Educ. 2014, 91, 2009–2012. [Google Scholar] [CrossRef]
- Hargittai, I. Crystallography in Structural Chemistry. Struct. Chem. 2014, 25, 1321–1326. [Google Scholar] [CrossRef]
- Vologzhanina, A.V. Intermolecular Interactions in Functional Crystalline Materials: From Data to Knowledge. Crystals 2019, 9, 478. [Google Scholar] [CrossRef]
- Spackman, M.A.; Spackman, P.R.; Thomas, S.P. 13 Beyond Hirshfeld surface analysis: Interaction energies, energy frameworks and lattice energies with CrystalExplorer. In Complementary Bonding Analysis; Grabowsky, S., Ed.; De Gruyter: Berlin, Germany, 2021; pp. 329–352. [Google Scholar] [CrossRef]
- Saha, S.; Samanta, A. Photophysical and Dynamic NMR Studies on 4-Amino-7-nitrobenz-2-oxa-1, 3-diazole Derivatives: Elucidation of the Nonradiative Deactivation Pathway. J. Phys. Chem. A 1998, 102, 7903–7912. [Google Scholar] [CrossRef]
- Saha, S. 4-Amino derivatives of 7-nitro-2,1,3-benzoxadiazole: The effect of the amino moiety on the structure of fluorophores. Acta Crystallogr. Sect. C Cryst. Struct. Commun. 2002, 58, o174–o177. [Google Scholar] [CrossRef]
- Gavezzotti, A. Computational Studies of Crystal Structure and Bonding. In Advanced X-ray Crystallography; Rissanen, K., Ed.; Springer: Berlin/Heidelberg, Germany, 2012; pp. 1–32. [Google Scholar] [CrossRef]
- Desiraju, G.R. Supramolecular Synthons in Crystal Engineering—A New Organic Synthesis. Angew. Chem. Int. Ed. 1995, 34, 2311–2327. [Google Scholar] [CrossRef]
- Spackman, M.A.; McKinnon, J.J. Fingerprinting intermolecular interactions in molecular crystals. CrystEngComm 2002, 4, 378–392. [Google Scholar] [CrossRef]
- Tan, S.L.; Jotani, M.M.; Tiekink, E.R.T. Utilizing Hirshfeld surface calculations, non-covalent interaction (NCI) plots and the calculation of interaction energies in the analysis of molecular packing. Acta Crystallogr. Sect. E Crystallogr. Commun. 2019, 75, 308–318. [Google Scholar] [CrossRef]
- McKinnon, J.J.; Spackman, M.A.; Mitchell, A.S. Novel tools for visualizing and exploring intermolecular interactions in molecular crystals. Acta Crystallogr. Sect. B Struct. Sci. 2004, 60, 627–668. [Google Scholar] [CrossRef]
- Bauzá, A.; Mooibroek, T.J.; Frontera, A. Directionality of π-holes in nitro compounds. Chem. Commun. 2015, 51, 1491–1493. [Google Scholar] [CrossRef] [PubMed]
- Franconetti, A.; Frontera, A.; Mooibroek, T.J. Intramolecular π–hole interactions with nitro aromatics. CrystEngComm 2019, 21, 5410–5417. [Google Scholar] [CrossRef]
- Bauzá, A.; Frontera, A.; Mooibroek, T.J. π-Hole Interactions Involving Nitro Aromatic Ligands in Protein Structures. Chem. Eur. J. 2019, 25, 13436–13443. [Google Scholar] [CrossRef] [PubMed]
- Sahariah, B.; Sarma, B.K. Relative orientation of the carbonyl groups determines the nature of orbital interactions in carbonyl–carbonyl short contacts. Chem. Sci. 2019, 10, 909–917. [Google Scholar] [CrossRef]
- Yang, S.; Garner, A.C.; Wallis, J.D. N–H⋯O hydrogen bonding to the alkoxy oxygen of a carboxylic ester group: Crystal structures of methyl 2,6-diaminobenzoate and its derivatives. CrystEngComm 2020, 22, 3701–3712. [Google Scholar] [CrossRef]
- Molčanov, K.; Kojić-Prodić, B.; Raos, N. Analysis of the less common hydrogen bonds involving ester oxygen sp 3 atoms as acceptors in the crystal structures of small organic molecules. Acta Crystallogr. Sect. B Struct. Sci. 2004, 60, 424–432. [Google Scholar] [CrossRef] [PubMed]
- Johnstone, R.; Loureiro, R.; Cristiano, M.; Labat, G. Bond Energy/Bond Order Relationships for N-O Linkages and a Quanti-tative Measure of Ionicity: The Role of Nitro Groups in Hydrogen-Bonding. Ark. Arch. Org. Chem. 2010, 5, 142–169. [Google Scholar]
- Dunitz, J.D.; Gavezzotti, A. How molecules stick together in organic crystals: Weak intermolecular interactions. Chem. Soc. Rev. 2009, 38, 2622–2633. [Google Scholar] [CrossRef] [PubMed]
- Turner, M.J.; Thomas, S.P.; Shi, M.W.; Jayatilaka, D.; Spackman, M.A. Energy frameworks: Insights into interaction anisotropy and the mechanical properties of molecular crystals. Chem. Commun. 2015, 51, 3735–3738. [Google Scholar] [CrossRef]
- Murray, J.S.; Politzer, P. The electrostatic potential: An overview. WIREs Comput. Mol. Sci. 2011, 1, 153–163. [Google Scholar] [CrossRef]
- Spackman, M.A.; McKinnon, J.J.; Jayatilaka, D. Electrostatic potentials mapped on Hirshfeld surfaces provide direct insight into intermolecular interactions in crystals. CrystEngComm 2008, 10, 377–388. [Google Scholar] [CrossRef]
- Muratov, E.N.; Bajorath, J.; Sheridan, R.P.; Tetko, I.V.; Filimonov, D.; Poroikov, V.; Oprea, T.I.; Baskin, I.I.; Varnek, A.; Roitberg, A.; et al. QSAR without borders. Chem. Soc. Rev. 2020, 49, 3525–3564. [Google Scholar] [CrossRef] [PubMed]
- Ismail, I.; Chen, Z.; Sun, L.; Ji, X.; Ye, H.; Kang, X.; Huang, H.; Song, H.; Bolton, S.G.; Xi, Z.; et al. Highly efficient H2S scavengers via thiolysis of positively-charged NBD amines. Chem. Sci. 2020, 11, 7823–7828. [Google Scholar] [CrossRef]
- De Almeida, R.F.M.; Santos, T.C.B.; da Silva, L.C.; Suchodolski, J.; Krasowska, A.; Stokowa-Sołtys, K.; Puchalska, M.; Starosta, R. NBD derived diphenyl(aminomethyl)phosphane—A new fluorescent dye for imaging of low pH regions and lipid membranes in living cells. Dye. Pigment. 2021, 184, 108771. [Google Scholar] [CrossRef]
- Bruker. Apex3 V2019.1-0, SAINT V8.40A; Bruker AXS Inc.: Madison, WI, USA, 2019. [Google Scholar]
- Krause, L.; Herbst-Irmer, R.; Sheldrick, G.M.; Stalke, D. Comparison of silver and molybdenum microfocus X-ray sources for single-crystal structure determination. J. Appl. Crystallogr. 2015, 48, 3–10. [Google Scholar] [CrossRef]
- Bruker, AXS Inc. SHELXTL Suite of Programs, Version 6.14; Bruker Advanced X-Ray Solutions; Bruker AXS Inc.: Madison, WI, USA, 2000–2003. [Google Scholar]
- Sheldrick, G.M. A short history of SHELX. Acta Crystallogr. Sect. A 2008, A64, 112–122. [Google Scholar] [CrossRef]
- Sheldrick, G.M. SHELXT—Integrated space-group and crystal-structure determination. Acta Crystallogr. Sect. A Found. Adv. 2015, 71, 3–8. [Google Scholar] [CrossRef]
- Sheldrick, G.M. Crystal structure refinement with SHELXL. Acta Crystallogr. Sect. C Struct. Chem. 2015, C71, 3–8. [Google Scholar] [CrossRef]
- Hübschle, C.B.; Sheldrick, G.M.; Dittrich, B. ShelXle: A Qt graphical user interface for SHELXL. J. Appl. Crystallogr. 2011, 44, 1281–1284. [Google Scholar] [CrossRef]
- Dolomanov, O.V.; Bourhis, L.J.; Gildea, R.J.; Howard, J.A.K.; Puschmann, H. OLEX2: A complete structure solution, refinement and analysis program. J. Appl. Cryst. 2009, 42, 339–341. [Google Scholar] [CrossRef]
- Mardirossian, N.; Head-Gordon, M. ωB97X-V: A 10-parameter, range-separated hybrid, generalized gradient approximation density functional with nonlocal correlation, designed by a survival-of-the-fittest strategy. Phys. Chem. Chem. Phys. 2014, 16, 9904–9924. [Google Scholar] [CrossRef] [PubMed]
- Spackman, P.R.; Turner, M.J.; McKinnon, J.J.; Wolff, S.K.; Grimwood, D.J.; Jayatilaka, D.; Spackman, M.A. CrystalExplorer: A program for Hirshfeld surface analysis, visualization and quantitative analysis of molecular crystals. J. Appl. Crystallogr. 2021, 54, 1006–1011. [Google Scholar] [CrossRef] [PubMed]
- Macrae, C.F.; Bruno, I.J.; Chisholm, J.A.; Edgington, P.R.; McCabe, P.; Pidcock, E.; Rodriguez-Monge, L.; Taylor, R.; van de Streek, J.; Wood, P.A. Mercury CSD 2.0–new features for the visualization and investigation of crystal structures. J. Appl. Crystallogr. 2008, 41, 466–470. [Google Scholar] [CrossRef]
- Mackenzie, C.F.; Spackman, P.R.; Jayatilaka, D.; Spackman, M.A. CrystalExplorer model energies and energy frameworks: Extension to metal coordination compounds, organic salts, solvates and open-shell systems. IUCrJ 2017, 4, 575–587. [Google Scholar] [CrossRef]
- Jayatilaka, D.; Grimwood, D.J. Tonto: A Fortran Based Object-Oriented System for Quantum Chemistry and Crystallography. In Computational Science—ICCS 2003; Sloot, P.M.A., Abramson, D., Bogdanov, A.V., Gorbachev, Y.E., Dongarra, J.J., Zomaya, A.Y., Eds.; Springer: Berlin/Heidelberg, Germany, 2003; pp. 142–151. [Google Scholar]
- Johnson, E.R.; Keinan, S.; Mori-Sánchez, P.; Contreras-García, J.; Cohen, A.J.; Yang, W. Revealing Noncovalent Interactions. J. Am. Chem. Soc. 2010, 132, 6498–6506. [Google Scholar] [CrossRef]
- Lu, T.; Chen, F. Multiwfn: A multifunctional wavefunction analyzer. J. Comput. Chem. 2012, 33, 580–592. [Google Scholar] [CrossRef]
- Humphrey, W.; Dalke, A.; Schulten, K. VMD: Visual molecular dynamics. J. Mol. Graph. 1996, 14, 33–38. [Google Scholar] [CrossRef]
- Neese, F. Software update: The ORCA program system, version 4.0. Wiley Interdiscip. Rev. Comput. Mol. Sci. 2018, 8, e1327. [Google Scholar] [CrossRef]
- Rappoport, D.; Furche, F. Property-optimized Gaussian basis sets for molecular response calculations. J. Chem. Phys. 2010, 133, 134105. [Google Scholar] [CrossRef]
- Hellweg, A.; Rappoport, D. Development of new auxiliary basis functions of the Karlsruhe segmented contracted basis sets including diffuse basis functions (def2-SVPD, def2-TZVPPD, and def2-QVPPD) for RI-MP2 and RI-CC calculations. Phys. Chem. Chem. Phys. 2015, 17, 1010–1017. [Google Scholar] [CrossRef]
- Kleemiss, F.; Dolomanov, O.V.; Bodensteiner, M.; Peyerimhoff, N.; Midgley, L.; Bourhis, L.J.; Genoni, A.; Malaspina, L.A.; Jayatilaka, D.; Spencer, J.L.; et al. Accurate crystal structures and chemical properties from NoSpherA2. Chem. Sci. 2021, 12, 1675–1692. [Google Scholar] [CrossRef] [PubMed]


Publisher’s Note: MDPI stays neutral with regard to jurisdictional claims in published maps and institutional affiliations. |
© 2022 by the authors. Licensee MDPI, Basel, Switzerland. This article is an open access article distributed under the terms and conditions of the Creative Commons Attribution (CC BY) license (https://creativecommons.org/licenses/by/4.0/).