
Sensing and Detection Capabilities of One-Dimensional Defective Photonic Crystal Suitable for Malaria Infection Diagnosis from Preliminary to Advanced Stage: Theoretical Study


Abstract
:1. Introduction
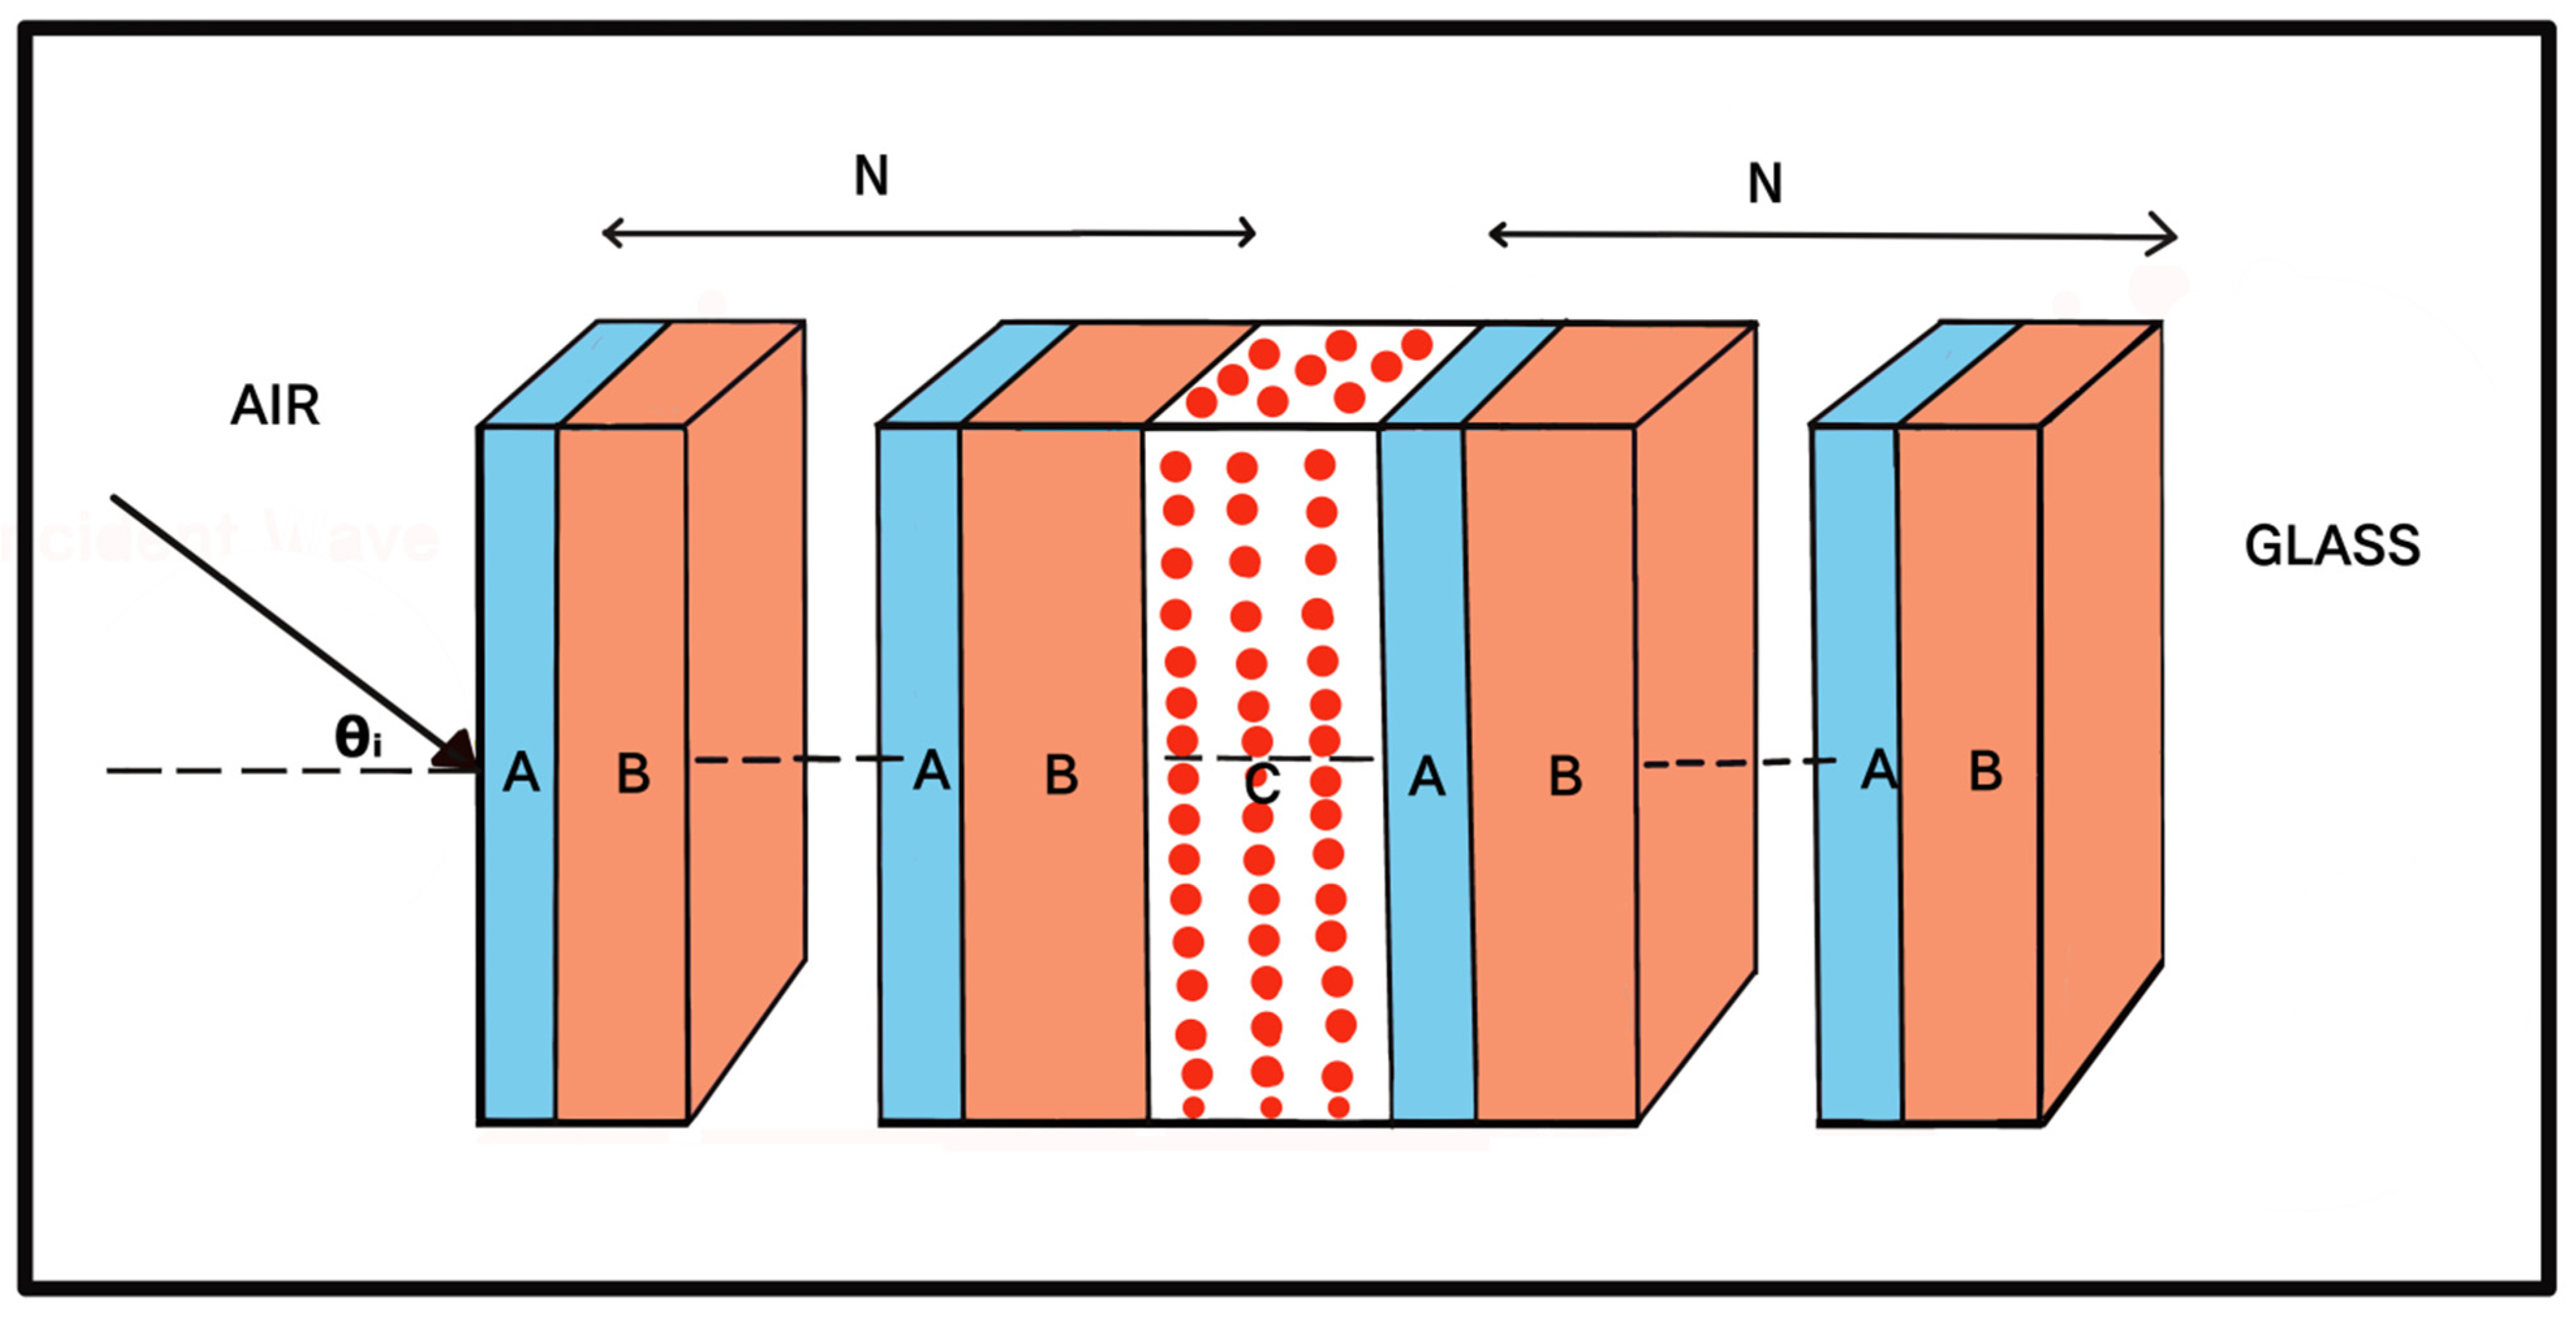
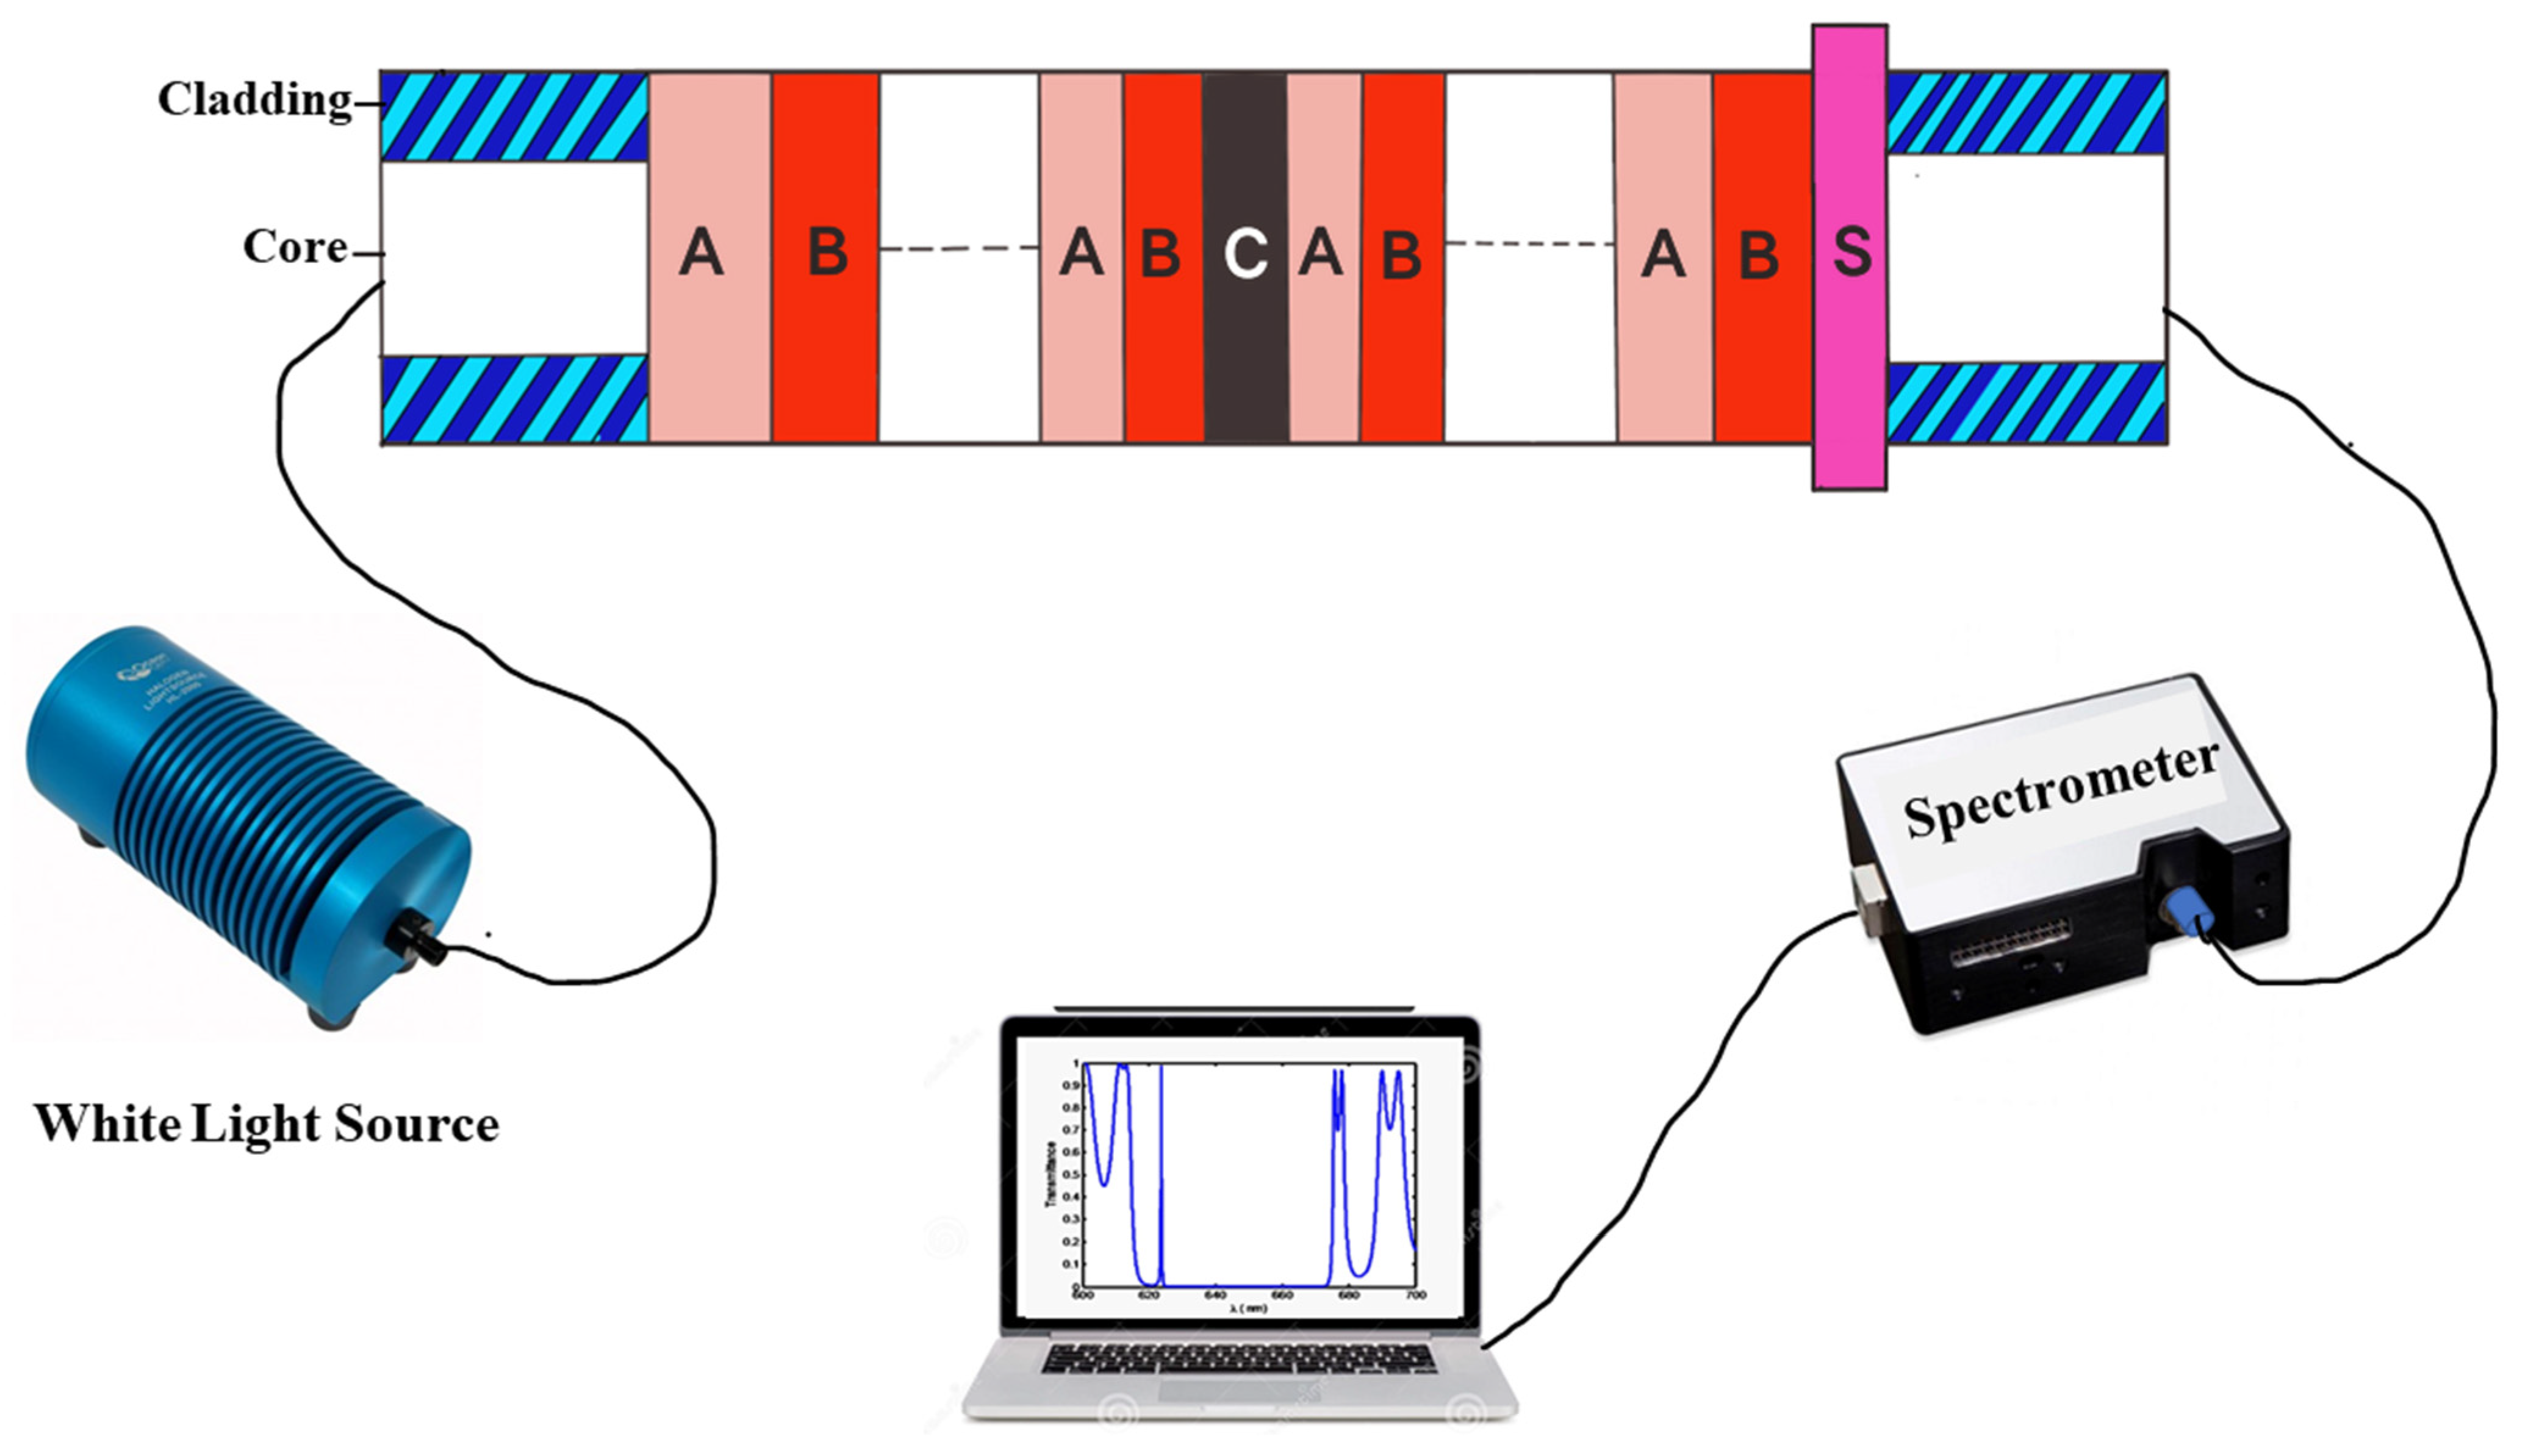
2. Structural Design
3. Theoretical Formulation
4. Results and Discussions
4.1. Description of Malaria Samples Used
4.2. Initialization of Biosensing Application of the Proposed Design Loaded with Water Sample
4.3. Evaluation of Biosensor Performance Loaded with Different Blood Samples
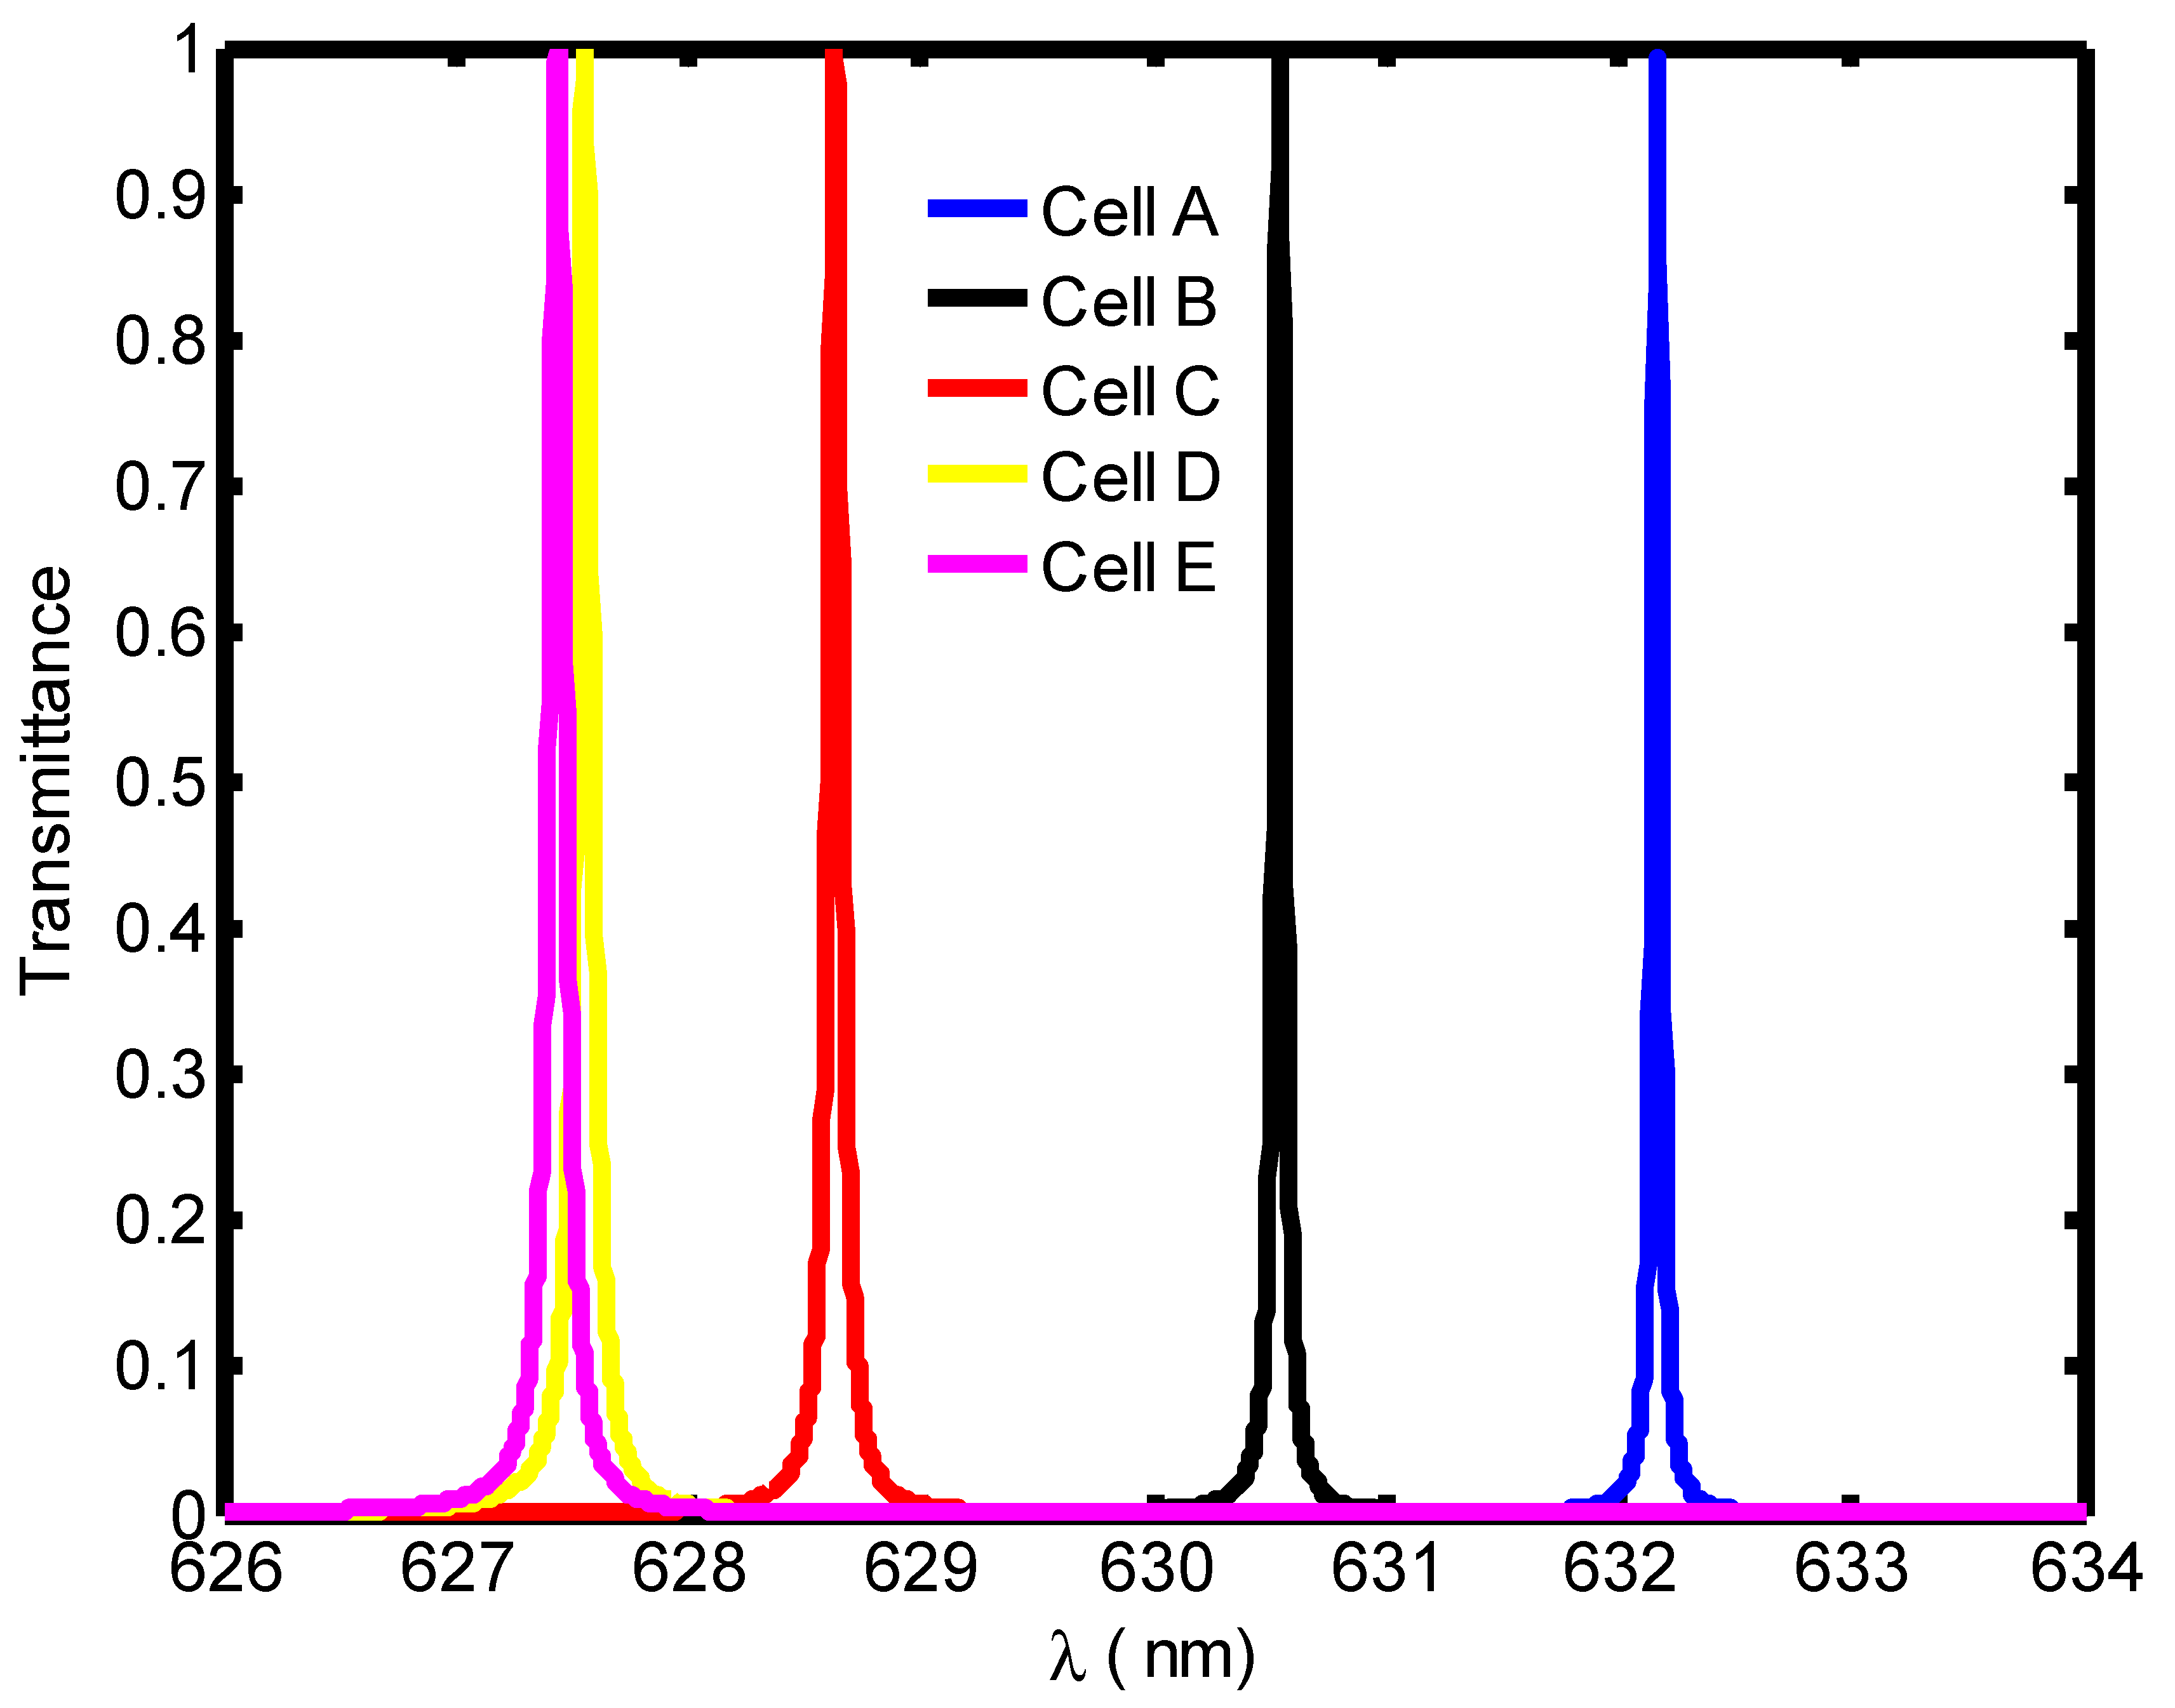
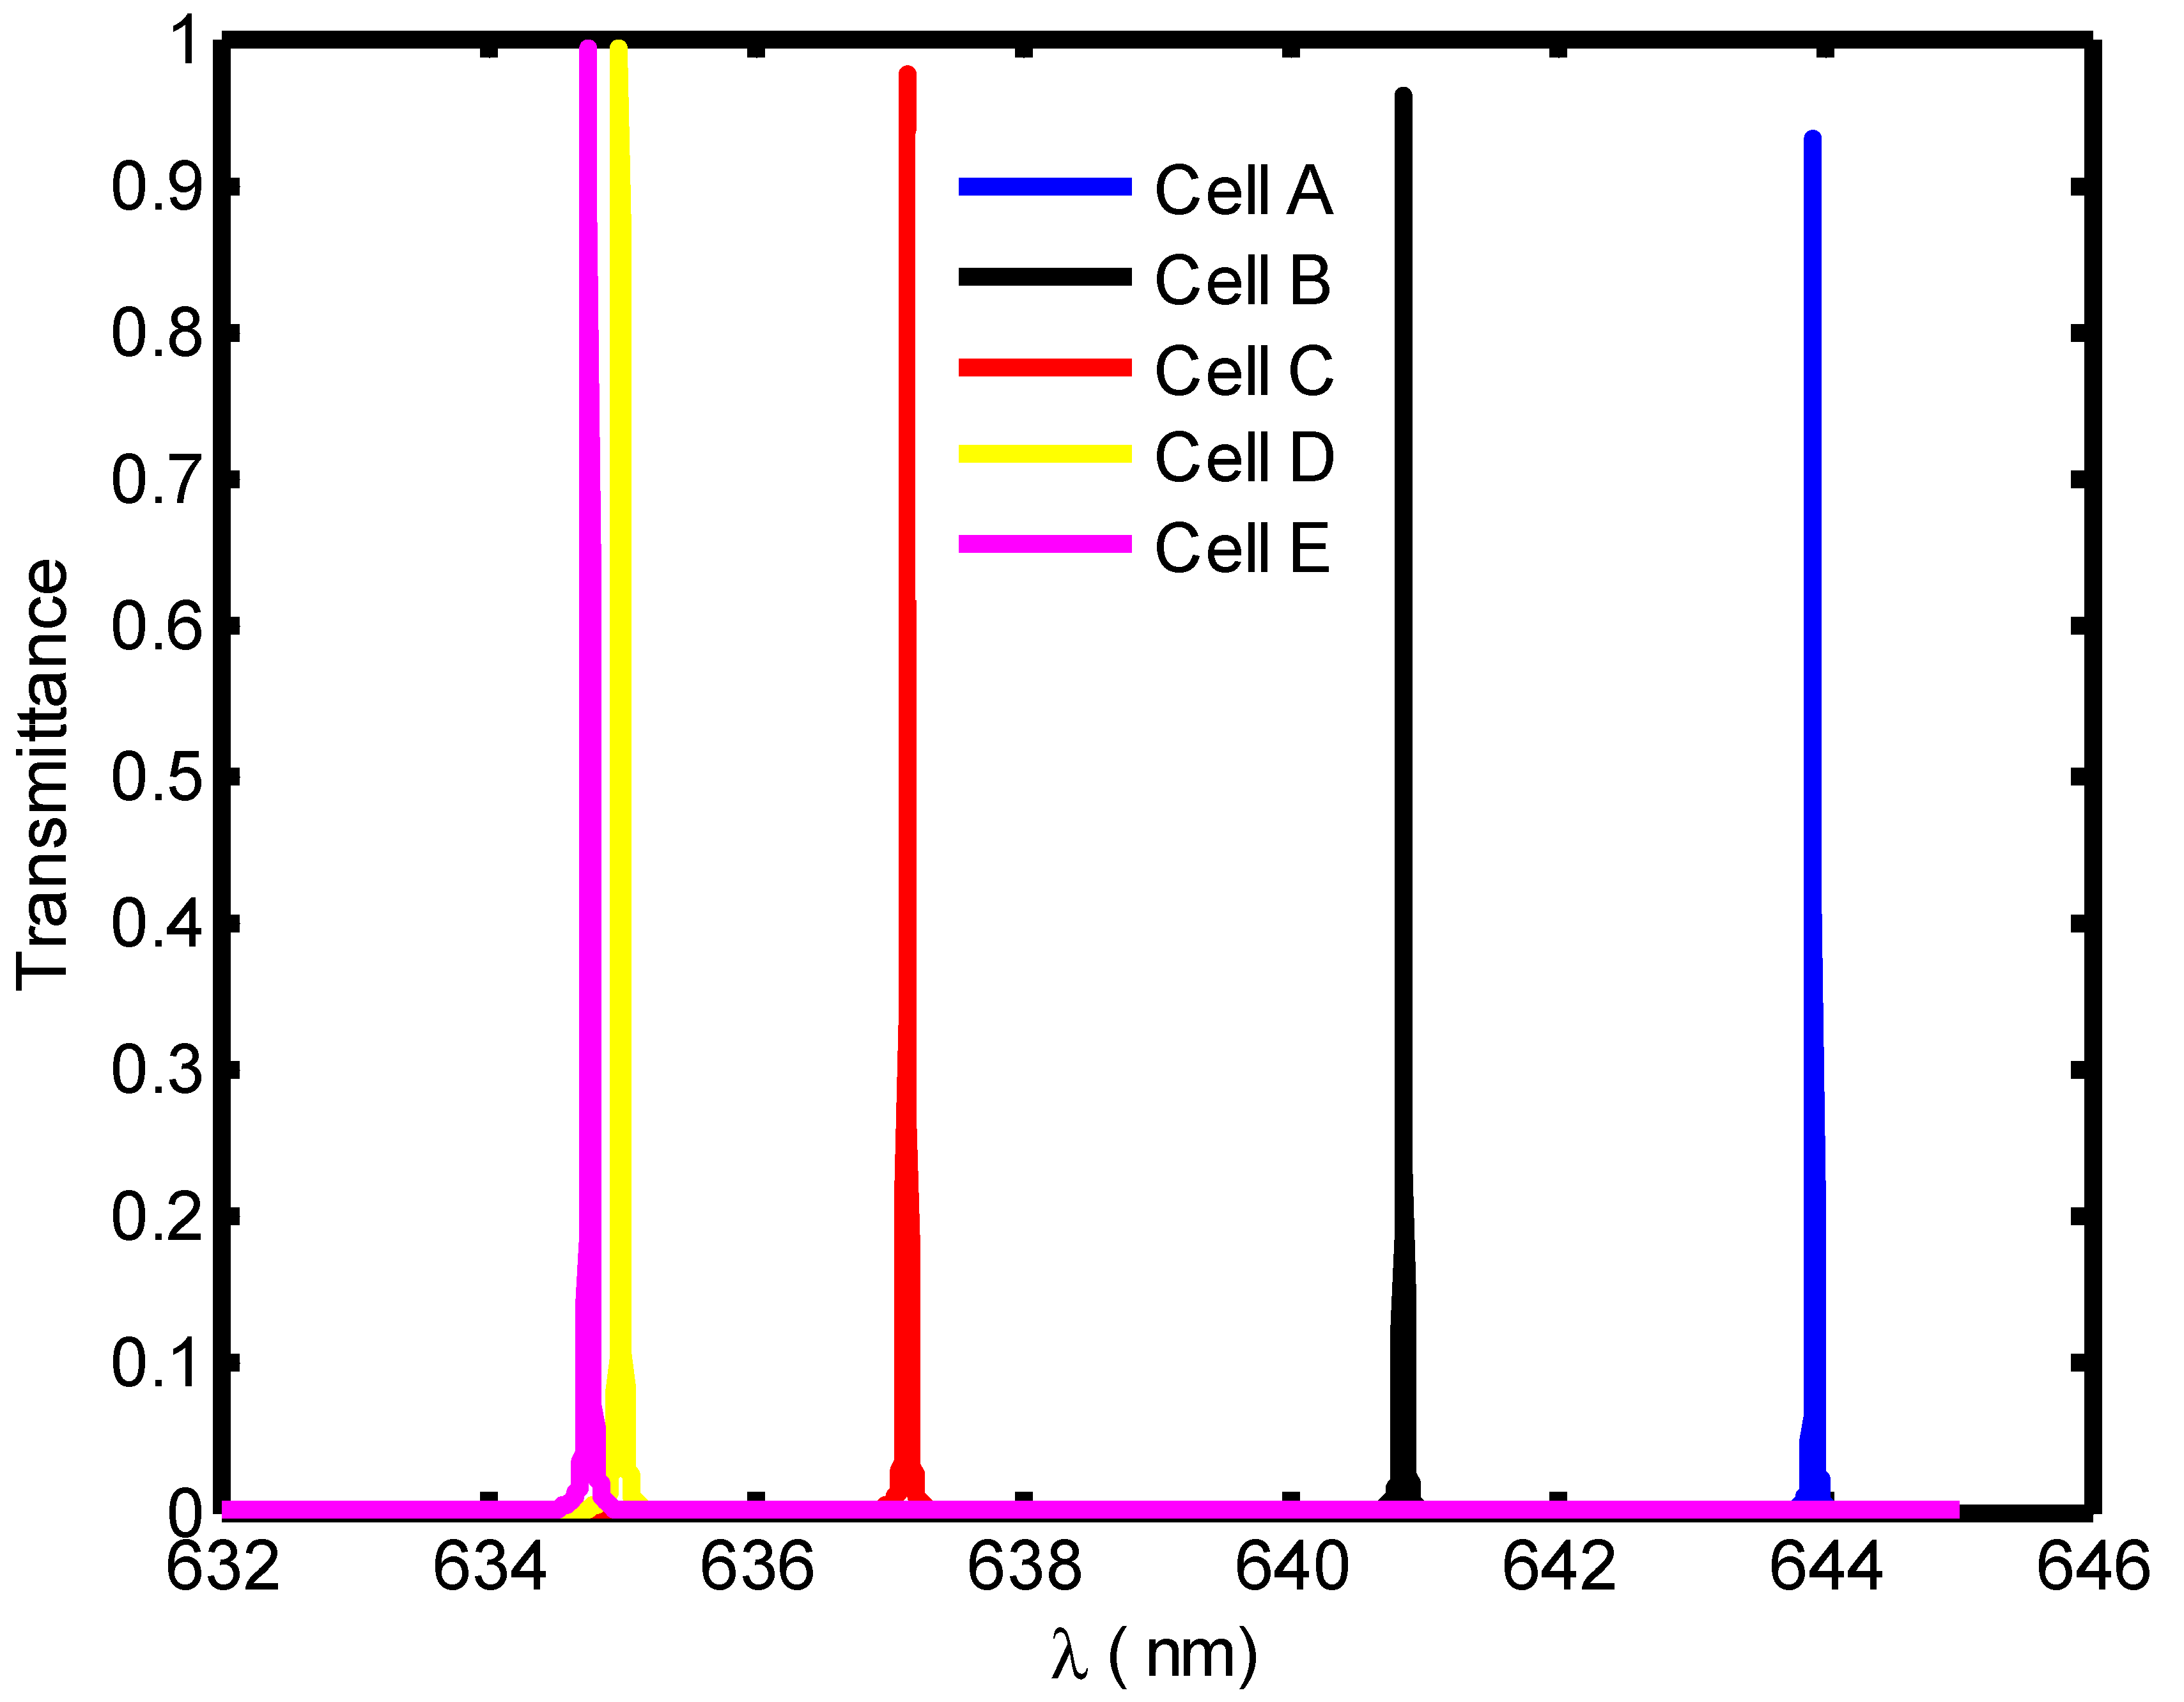
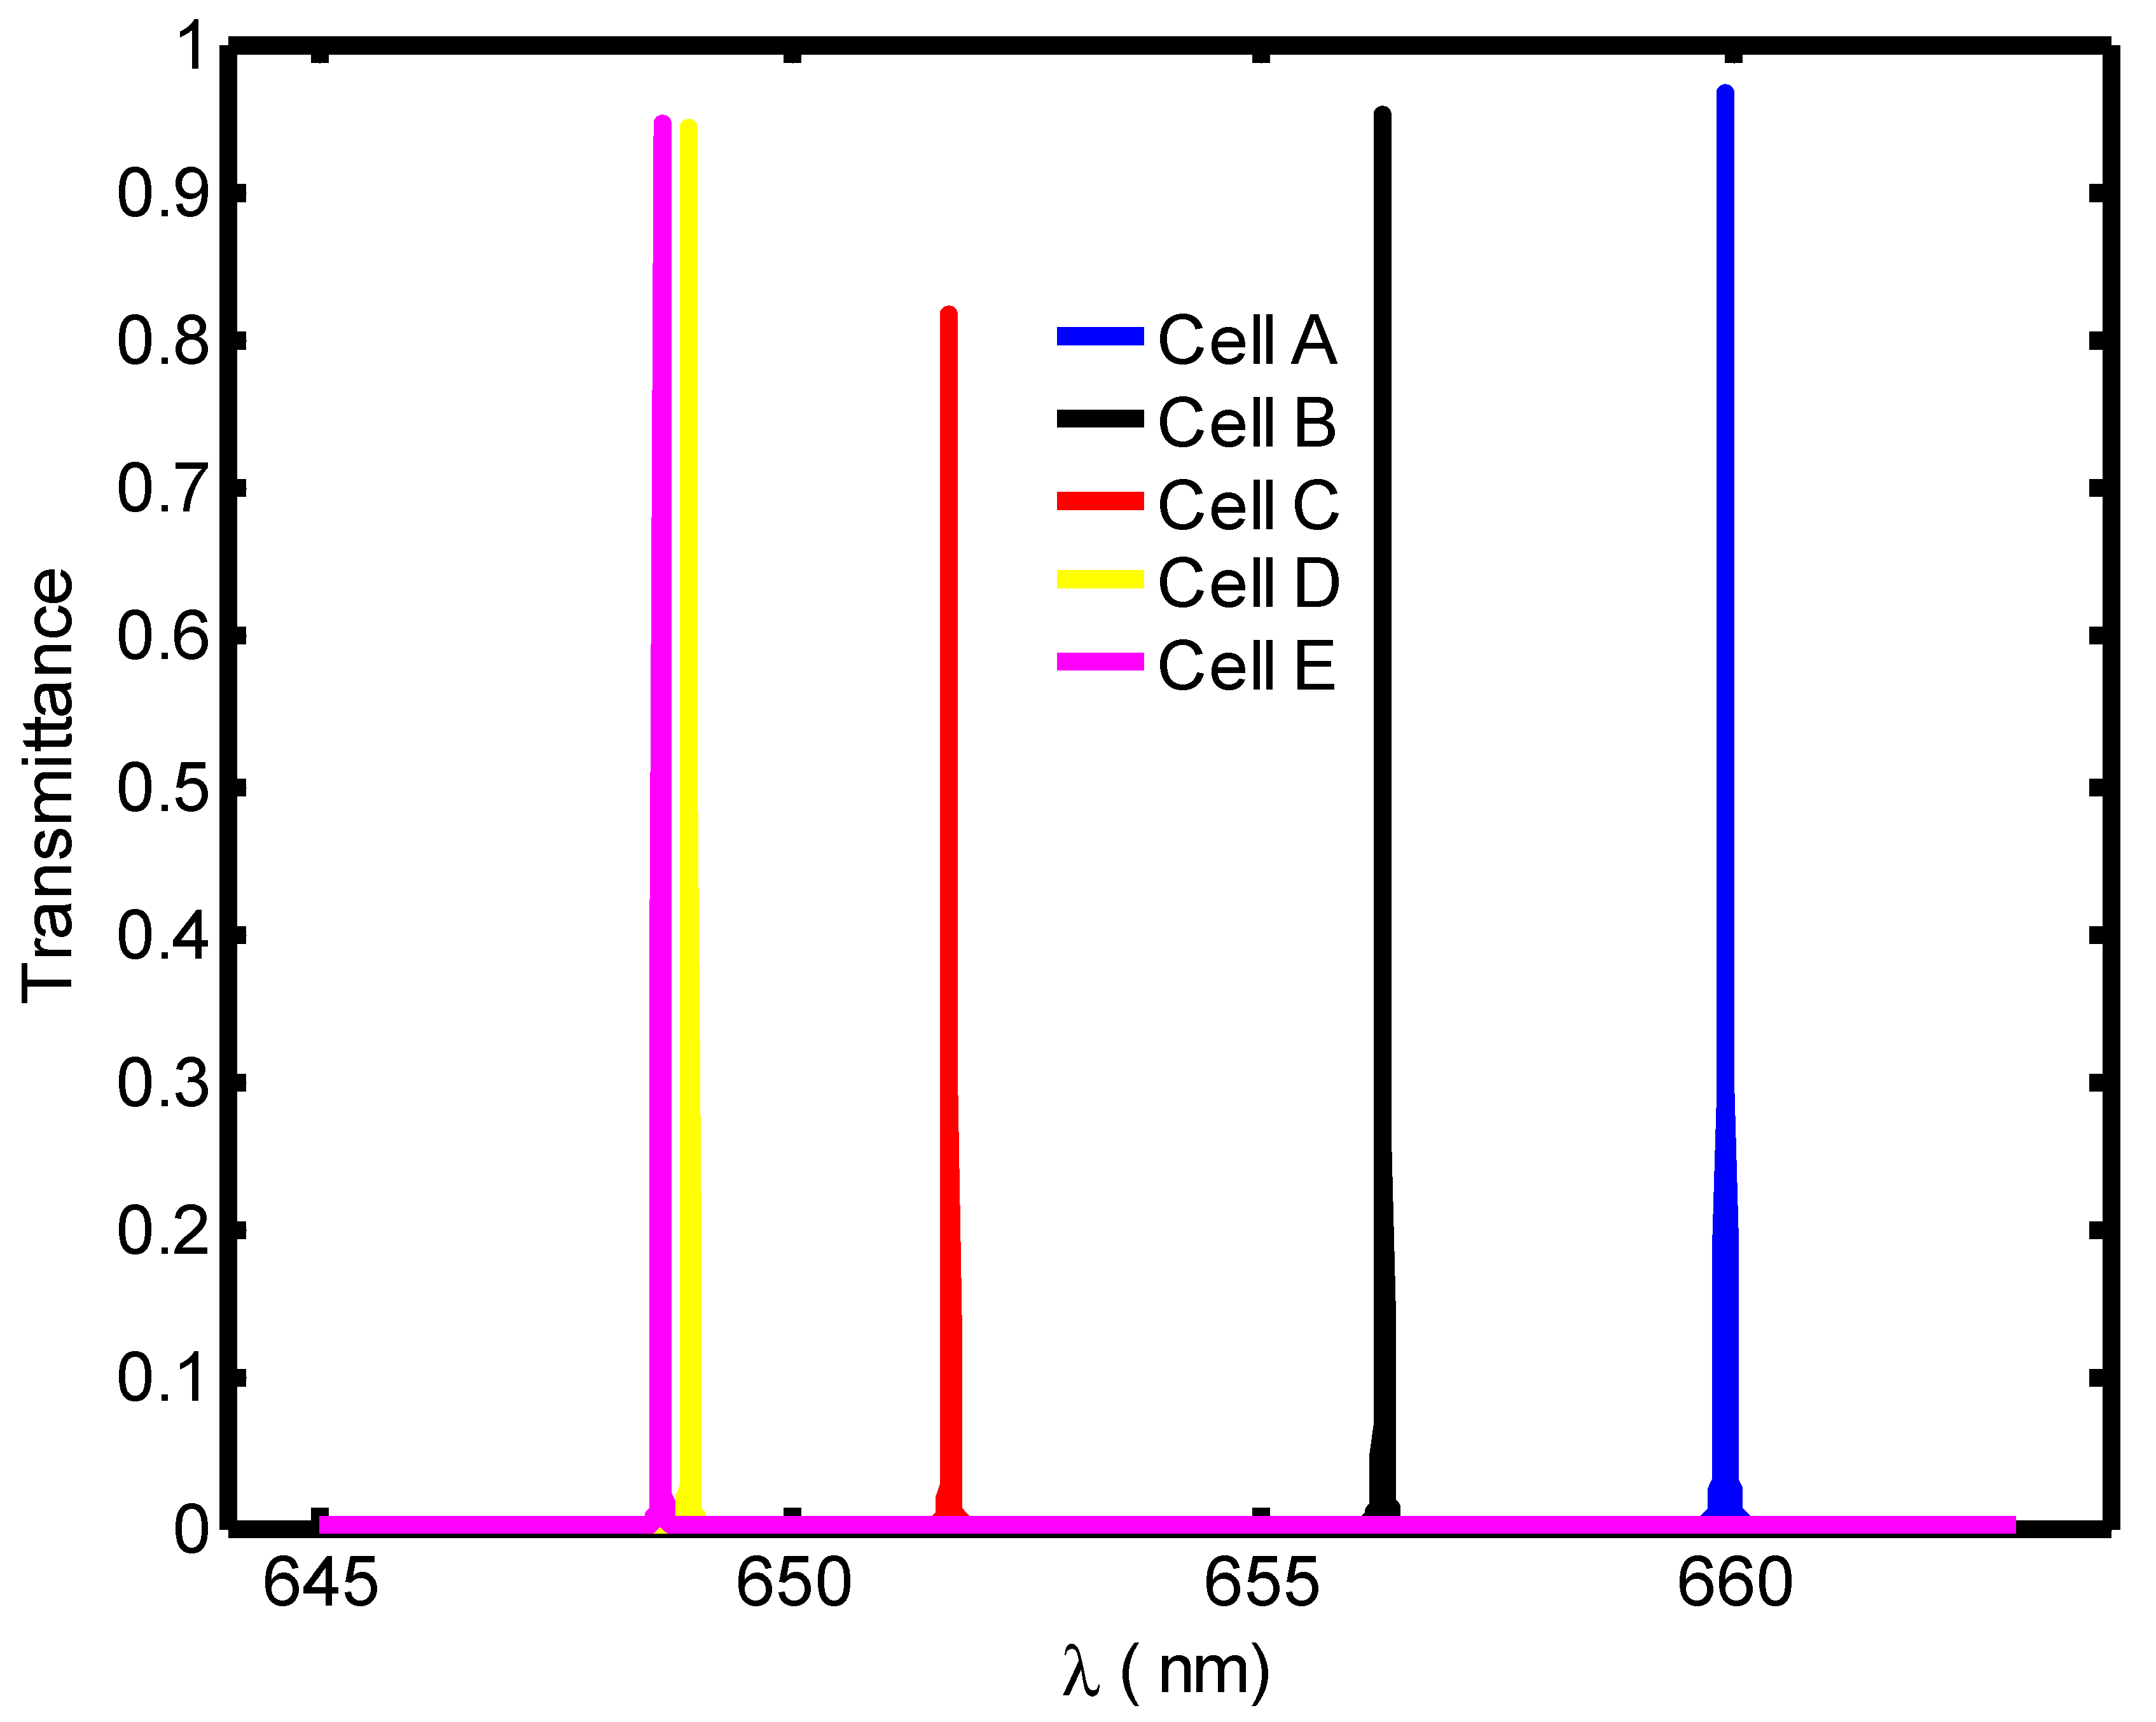
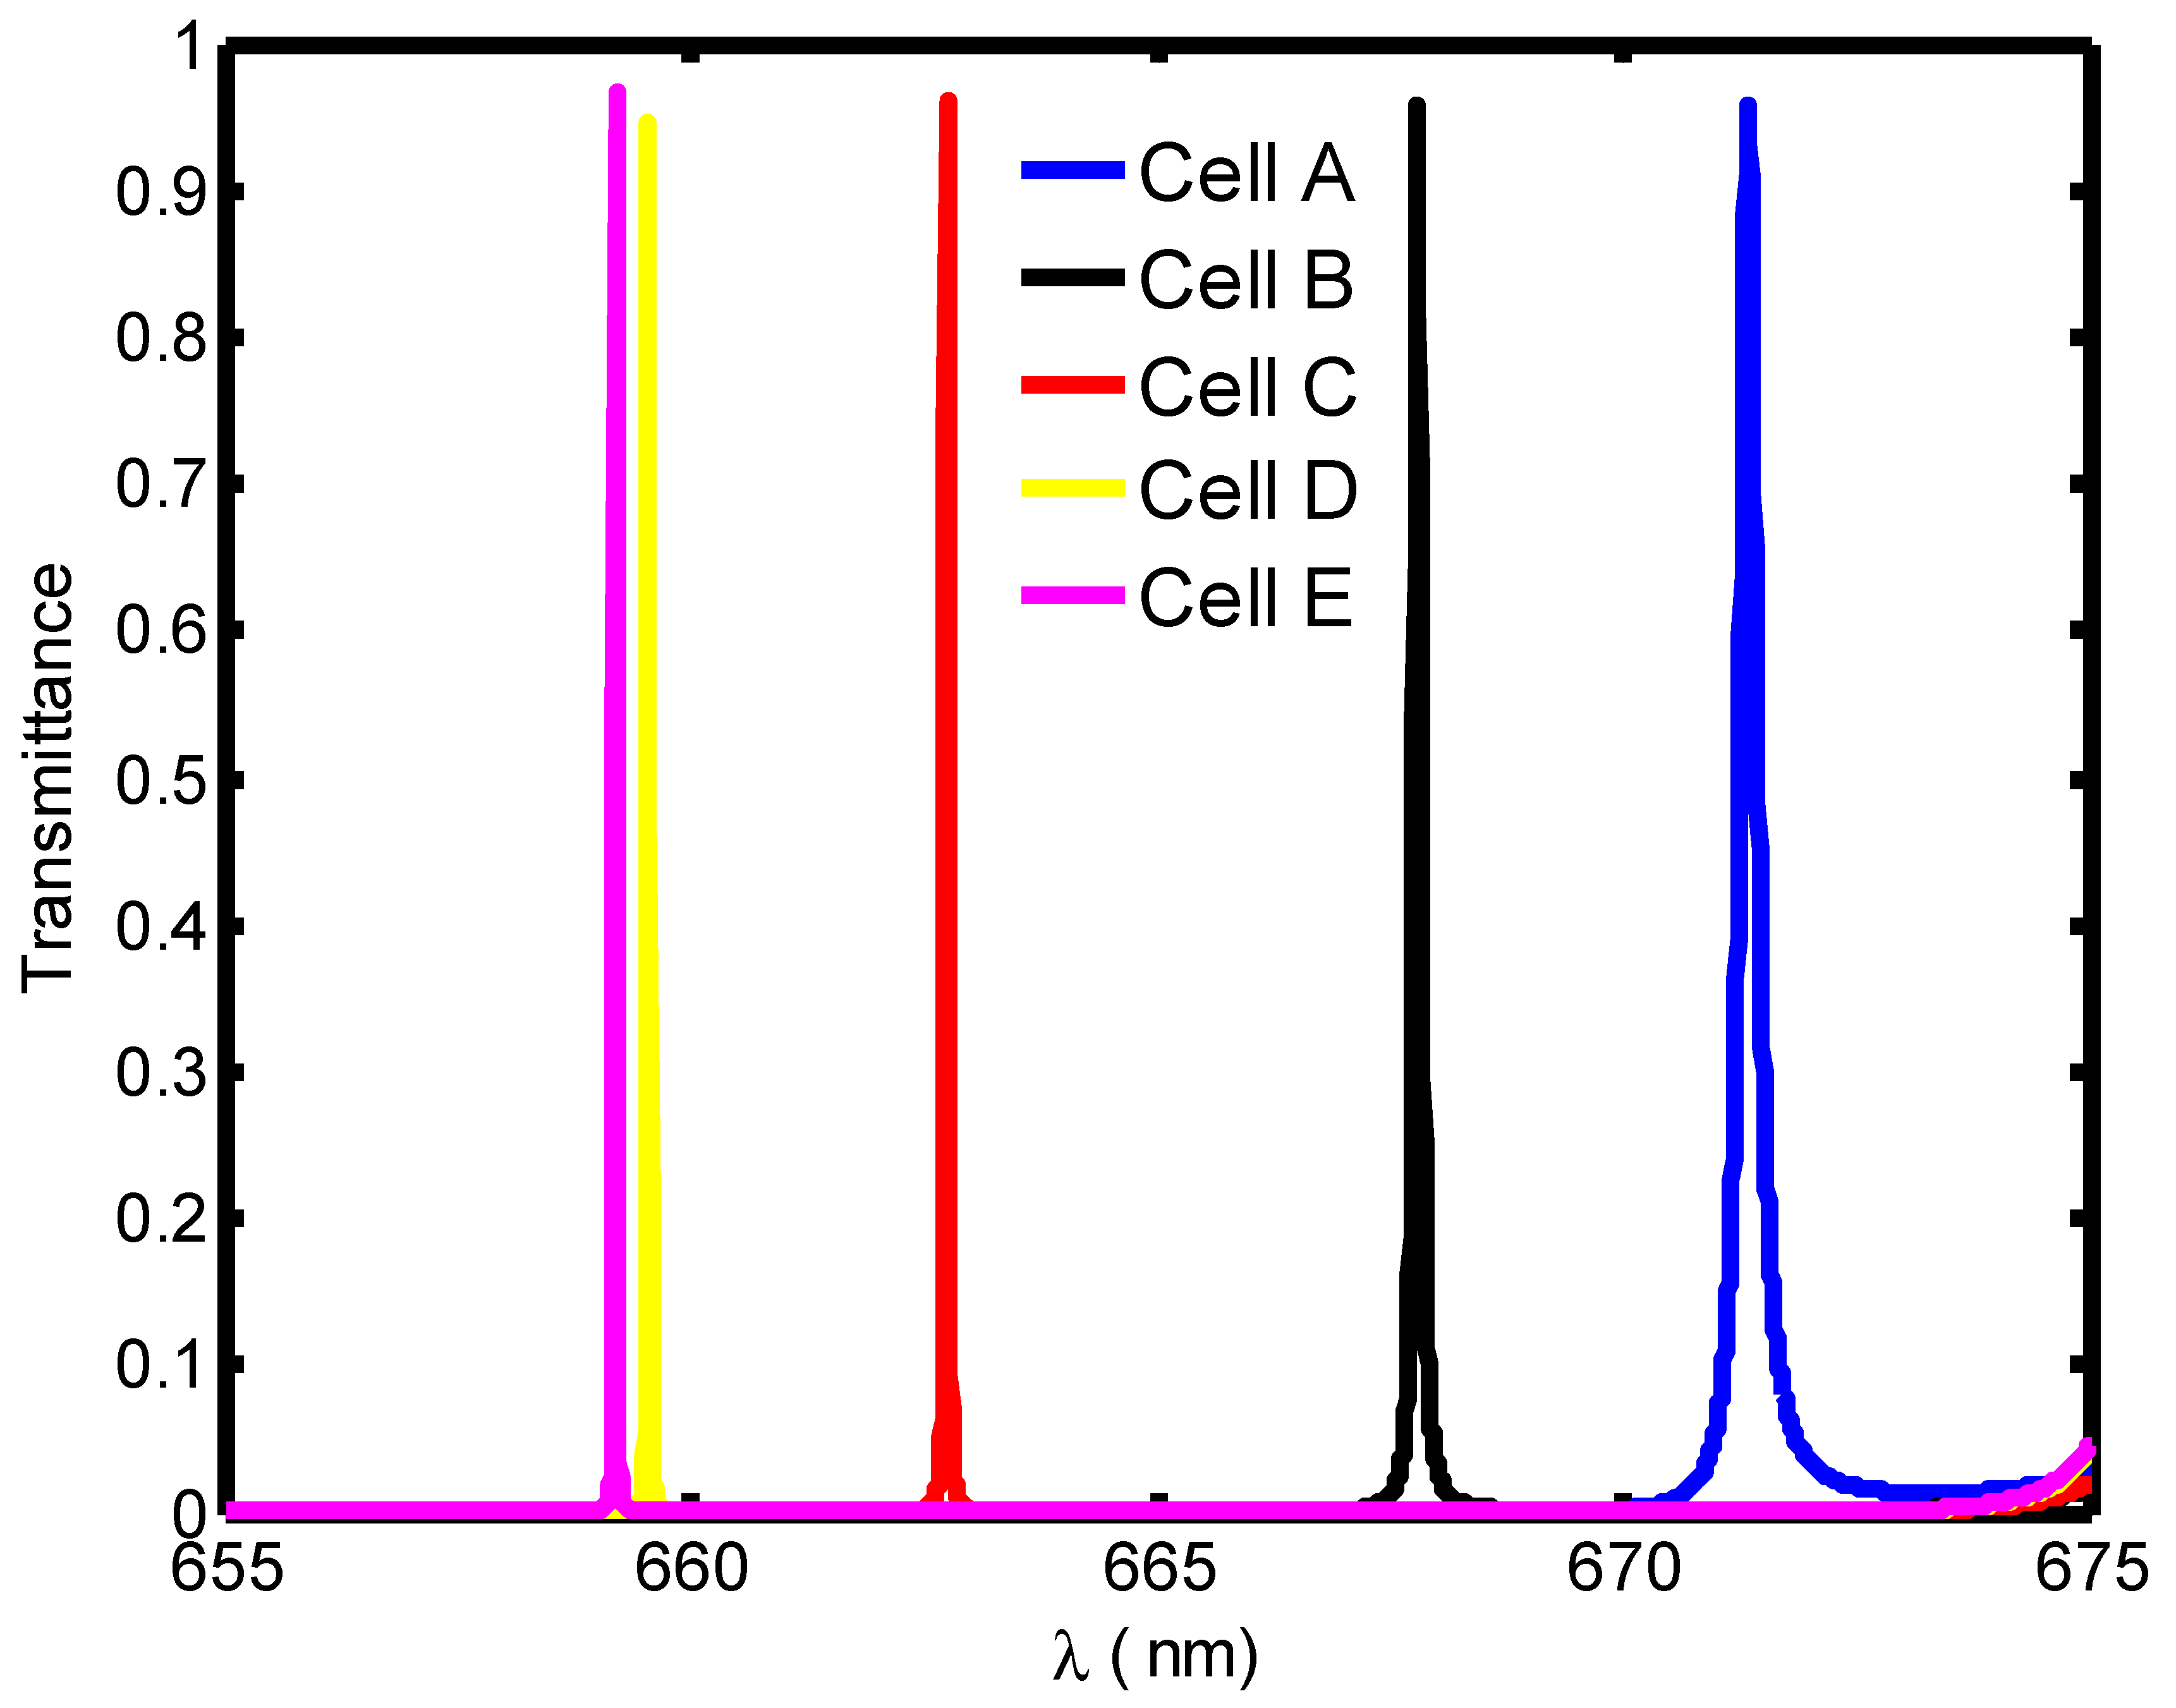
4.4. Evaluation of the Performance of Proposed Biosensors Corresponding to Optimum Cavity Thickness under Normal Incidence
5. Conclusions
Author Contributions
Funding
Institutional Review Board Statement
Informed Consent Statement
Data Availability Statement
Conflicts of Interest
References
- Yablonovitch, E. Inhibited Spontaneous Emission in Solid-State Physics and Electronics. Phys. Rev. Lett. 1987, 58, 2059–2062. [Google Scholar] [CrossRef] [PubMed] [Green Version]
- John, S. Strong localization of photons in certain disordered dielectric superlattices. Phys. Rev. Lett. 1987, 58, 2486–2489. [Google Scholar] [CrossRef] [PubMed] [Green Version]
- Awasthi, S.K.; Mishra, A.; Malaviya, U.; Ojha, S. Wave propagation in a one-dimensional photonic crystal with metamaterial. Solid State Commun. 2009, 149, 1379–1383. [Google Scholar] [CrossRef]
- Awasthi, S.K.; Malaviya, U.; Ojha, S.P. Enhancement of omnidirectional total-reflection wavelength range by using one-dimensional ternary photonic bandgap material. J. Opt. Soc. Am. B 2006, 23, 2566–2571. [Google Scholar] [CrossRef]
- Danaie, M.; Kiani, B. Design of a label-free photonic crystal refractive index sensor for biomedical applications. Photon- Nanostructures—Fundam. Appl. 2018, 31, 89–98. [Google Scholar] [CrossRef]
- Aly, A.H.; Awasthi, S.K.; Mohaseb, M.A.; Matar, Z.S.; Amin, A.F. MATLAB Simulation-Based Theoretical Study for Detection of a Wide Range of Pathogens Using 1D Defective Photonic Structure. Crystals 2022, 12, 220. [Google Scholar] [CrossRef]
- Aly, A.H.; Awasthi, S.K.; Mohamed, D.; Matar, Z.S.; Al-Dossari, M.; Amin, A.F. Study on a one-dimensional defective photonic crystal suitable for organic compound sensing applications. RSC Adv. 2021, 11, 32973–32980. [Google Scholar] [CrossRef] [PubMed]
- Aly, A.H.; Awasthi, S.K.; Mohamed, A.M.; Matar, Z.S.; Mohaseb, M.A.; Al-Dossari, M.; Tammam, M.T.; Zaky, Z.A.; Amin, A.F.; Sabra, W. Detection of Reproductive Hormones in Females by Using 1D Photonic Crystal-Based Simple Reconfigurable Biosensing Design. Crystals 2021, 11, 1533. [Google Scholar] [CrossRef]
- Zaky, Z.A.; Moustafa, B.; Aly, A.H. Plasma cell sensor using photonic crystal cavity. Opt. Quantum Electron. 2021, 53, 591. [Google Scholar] [CrossRef]
- Elsayed, A.M.; Ahmed, A.M.; Aly, A.H. Glucose sensor modeling based on Fano resonance excitation in titania nanotube photonic crystal coated by titanium nitride as a plasmonic material. Appl. Opt. 2022, 61, 1668. [Google Scholar] [CrossRef]
- Mehaney, A.; Abadla, M.M.; Elsayed, H.A. 1D porous silicon photonic crystals comprising Tamm/Fano resonance as high performing optical sensors. J. Mol. Liq. 2021, 322, 114978. [Google Scholar] [CrossRef]
- Troia, B.; Paolicelli, A.; De, F.; Passaro, V.M.N. Photonic Crystals for Optical Sensing: A Review. In Advances in Photonic Crystals; IntechOpen: Rijeka, Croatia, 2013. [Google Scholar] [CrossRef] [Green Version]
- Zhou, X.; Zhang, L.; Armani, A.M.; Liu, J.; Duan, X.; Zhang, D.; Zhang, H.; Pang, W. An Integrated Photonic Gas Sensor Enhanced by Optimized Fano Effects in Coupled Microring Resonators With an Athermal Waveguide. J. Light. Technol. 2015, 33, 4521–4530. [Google Scholar] [CrossRef]
- Bougriou, F.; Bouchemat, T.; Bouchemat, M.; Paraire, N. Optofluidic sensor using two-dimensional photonic crystal waveguides. Eur. Phys. J. Appl. Phys. 2013, 62, 11201. [Google Scholar] [CrossRef]
- Pursiainen, O.L.J.; Baumberg, J.J.; Ryan, K.; Bauer, J.; Winkler, H.; Viel, B.; Ruhl, T. Compact strain-sensitive flexible photonic crystals for sensors. Appl. Phys. Lett. 2005, 87, 101902. [Google Scholar] [CrossRef] [Green Version]
- Roggan, A.; Friebel, M.; Dörschel, K.; Hahn, A.; Müller, G. Optical Properties of Circulating Human Blood in the Wavelength Range 400–2500 nm. J. Biomed. Opt. 1999, 4, 36–46. [Google Scholar] [CrossRef] [Green Version]
- A Report by the World Economic Forum and the Harvard School of Public Health. September 2011. Available online: www.weforum.org/EconomicsOfNCDappendix (accessed on 1 September 2019).
- Lee, V.S.; Tarassenko, L. Absorption and multiple scattering by suspensions of aligned red blood cells. J. Opt. Soc. Am. A 1991, 8, 1135–1141. [Google Scholar] [CrossRef] [PubMed]
- Zhernovaya, O.; Sydoruk, O.; Tuchin, V.; Douplik, A. The refractive index of human hemoglobin in the visible range. Phys. Med. Biol. 2011, 56, 4013–4021. [Google Scholar] [CrossRef] [Green Version]
- Bayer, R.; Çaǧlayan, S.; Guenther, B. Discrimination between orientation and elongation of RBC in laminar flow by means of laser diffraction. Proc. SPIE 1994, 2136, 105–114. [Google Scholar] [CrossRef]
- Prahl, S.A. 1999. Available online: http://omlc.ogi.edu/spectra/hemoglobin/index.html (accessed on 1 September 2019).
- Enejder, A.M.K.; Swartling, J.; Aruna, P.; Andersson-Engels, S. Influence of cell shape and aggregate formation on the optical properties of flowing whole blood. Appl. Opt. 2003, 42, 1384–1394. [Google Scholar] [CrossRef]
- Lindberg, L.-G.; Öberg, P. Optical properties of blood in motion. Opt. Eng. 1993, 32, 253–257. [Google Scholar] [CrossRef]
- Sharma, P.; Sharan, P. Design of photonic crystal based ring resonator for detection of different blood constituents. Opt. Commun. 2015, 348, 19–23. [Google Scholar] [CrossRef]
- Tangpukdee, N.; Duangdee, C.; Wilairatana, P.; Krudsood, S. Malaria Diagnosis: A Brief Review. Korean J. Parasitol. 2009, 47, 93–102. [Google Scholar] [CrossRef] [PubMed] [Green Version]
- Gentilini, M. Maladies parasitaires. In MédecineTropicale, 5th ed.; 2ème Tirage Actualisé; Flammarion Médecine Science: Paris, France, 1995; pp. 51–122. Available online: https://www.decitre.fr/livres/medecine-tropicale-9782257143945.html (accessed on 1 September 2019).
- WHO Report. 2019. Available online: https://www.who.int/malaria/publications/world-malaria-report-2019/en/ (accessed on 1 September 2019).
- Agnero, M.A.; Konan, K.; Tokou, Z.G.C.S.; Kossonou, Y.T.A.; Dion, B.S.; Kaduki, K.A.; Zoueu, J.T. Malaria-Infected Red Blood Cell Analysis through Optical and Biochemical Parameters Using the Transport of Intensity Equation and the Microscope’s Optical Properties. Sensors 2019, 19, 3045. [Google Scholar] [CrossRef] [Green Version]
- Erdman, L.K.; Kain, K.C. Molecular diagnostic and surveillance tools for global malaria control. Travel Med. Infect. Dis. 2008, 6, 82–99. [Google Scholar] [CrossRef] [PubMed]
- Bell, D.; Wongsrichanalai, C.; Barnwell, J.W. Ensuring quality and access for malaria diagnosis: How can it be achieved? Nat. Rev. Genet. 2006, 4, S7–S20. [Google Scholar] [CrossRef]
- E Clendennen, T.; Long, G.W.; Baird, J.K.; Iii, T.E.C. QBC® and Giemsa-stained thick blood films: Diagnostic performance of laboratory technologists. Trans. R. Soc. Trop. Med. Hyg. 1995, 89, 183–184. [Google Scholar] [CrossRef]
- Shaheen, S.A.; Taya, S.A. Propagation of p-polarized light in photonic crystal for sensor application. Chin. J. Phys. 2017, 55, 571–582. [Google Scholar] [CrossRef]
- Sovizi, M.; Aliannezhadi, M. Design and simulation of high-sensitivity refractometric sensors based on defect modes in one-dimensional ternary dispersive photonic crystal. J. Opt. Soc. Am. B 2019, 36, 3450–3456. [Google Scholar] [CrossRef]
- Taya, S. Ternary photonic crystal with left-handed material layer for refractometric application. Opto-Electronics Rev. 2018, 26, 236–241. [Google Scholar] [CrossRef]
- Banerjee, A. Design of enhanced sensitivity gas sensors by using 1D defect ternary photonic band gap structures. Indian J. Phys. 2019, 94, 535–539. [Google Scholar] [CrossRef]
- Xie, Q.; Chen, Y.; Li, X.; Yin, Z.; Wang, L.; Geng, Y.; Hong, X. Characteristics of D-shaped photonic crystal fiber surface plasmon resonance sensors with different side-polished lengths. Appl. Opt. 2017, 56, 1550–1555. [Google Scholar] [CrossRef]
- Zhang, Z.; Shen, T.; Wu, H.; Feng, Y.; Wang, X. Polished photonic crystal fiber refractive index sensor based on surface plasmon resonance. J. Opt. Soc. Am. B 2021, 38, F61. [Google Scholar] [CrossRef]
- Nie, T.; Han, Z.; Gou, Z.; Wang, C.; Tian, H. High anti-interference dual-parameter sensor using EIT-like effect photonic crystal cavity coupled system. Appl. Opt. 2022, 61, 1552–1558. [Google Scholar] [CrossRef] [PubMed]
- Baraket, Z.; Soltani, O.; Kanzari, M. Design of magnetic field direction’s sensor based on a 1D tunable magneto-photonic crystal. Opt. Quantum Electron. 2022, 54, 637. [Google Scholar] [CrossRef]
- Parandin, F.; Heidari, F.; Aslinezhad, M.; Parandin, M.M.; Roshani, S.; Roshani, S. Design of 2D photonic crystal biosensor to detect blood components. Opt. Quantum Electron. 2022, 54, 618. [Google Scholar] [CrossRef]
- Parandin, F.; Heidari, F.; Rahimi, Z.; Olyaee, S. Two-Dimensional photonic crystal Biosensors: A review. Opt. Laser Technol. 2021, 144, 107397. [Google Scholar] [CrossRef]
- Liu, Y.; Salemink, H.W.M. Photonic crystal-based all-optical on-chip sensor. Opt. Express 2012, 20, 19912–19920. [Google Scholar] [CrossRef] [Green Version]
- Olyaee, S.; Dehghani, A.A. Ultrasensitive Pressure Sensor Based on Point Defect Resonant Cavity in Photonic Crystal. Sens. Lett. 2013, 11, 1854–1859. [Google Scholar] [CrossRef]
- Pacholski, C. Photonic Crystal Sensors Based on Porous Silicon. Sensors 2013, 13, 4694–4713. [Google Scholar] [CrossRef]
- Matar, Z.S.; Al-Dossari, M.; Awasthi, S.K.; El-Gawaad, N.S.A.; Hanafy, H.; Amin, R.M.; Fathy, M.I.; Aly, A.H. Theoretical Study on Polycarbonate-Based One-Dimensional Ternary Photonic Structures from Far-Ultraviolet to Near-Infrared Regions of Electromagnetic Spectrum. Crystals 2022, 12, 642. [Google Scholar] [CrossRef]
- Del Villar, I.; Matias, I.R.; Arregui, F.J.; Claus, R. Analysis of one-dimensional photonic band gap structures with a liquid crystal defect towards development of fiber-optic tunable wavelength filters. Opt. Express 2003, 11, 430–436. [Google Scholar] [CrossRef] [PubMed]
- Saravanan, S.; Dubey, R. Optical and morphological studies of TiO2 nanoparticles prepared by sol–gel method. Mater. Today: Proc. 2021, 47, 1811–1814. [Google Scholar] [CrossRef]
- Awasthi, S.K.; Panda, R.; Shiveshwari, L. Multichannel tunable filter properties of 1D magnetized ternary plasma photonic crystal in the presence of evanescent wave. Phys. Plasmas 2017, 24, 072111. [Google Scholar] [CrossRef]
- Awasthi, S.K.; Panda, R.; Chauhan, P.K.; Shiveshwari, L. Multichannel tunable omnidirectional photonic band gaps of 1D ternary photonic crystal containing magnetized cold plasma. Phys. Plasmas 2018, 25, 052103. [Google Scholar] [CrossRef]
- Ankita; Suthar, B.; Bhargava, A. Biosensor Application of One-Dimensional Photonic Crystal for Malaria Diagnosis. Plasmonics 2020, 16, 59–63. [Google Scholar] [CrossRef]
- Agnero, M.A.; Konan, K.; Kossonou, A.T.; Bagui, O.K.; Zoueu, J.T. A New Method to Retrieve the Three-Dimensional Refractive Index and Specimen Size Using the Transport Intensity Equation, Taking Diffraction into Account. Appl. Sci. 2018, 8, 1649. [Google Scholar] [CrossRef] [Green Version]
- Mazeron, P.; Muller, S.; Elazouzi, H. Deformation of erythrocytes under shear: A small-angle light scattering study. Biorheology 1997, 34, 99–110. [Google Scholar] [CrossRef]
- Phillips, K.G.; Jacques, S.L.; Mccarty, O.J.T. Measurement of Single Cell Refractive Index, Dry Mass, Volume, and Density Using a Transillumination Microscope. Phys. Rev. Lett. 2012, 109, 118105. [Google Scholar] [CrossRef] [Green Version]
- Tycko, D.H.; Metz, M.H.; Epstein, E.A.; Grinbaum, A. Flow-cytometric light scattering measurement of red blood cell volume and hemoglobin concentration. Appl. Opt. 1985, 24, 1355. [Google Scholar] [CrossRef]
- El-Khozondar, H.J.; Mahalakshmi, P.; El-Khozondar, R.J.; Ramanujam, N.; Amiri, I.; Yupapin, P. Design of one dimensional refractive index sensor using ternary photonic crystal waveguide for plasma blood samples applications. Phys. E: Low-Dimensional Syst. Nanostructures 2019, 111, 29–36. [Google Scholar] [CrossRef]
- Mohammed, N.A.; Hamed, M.M.; Khalaf, A.A.; Alsayyari, A.; El-Rabaie, S. High-sensitivity ultra-quality factor and remarkable compact blood components biomedical sensor based on nanocavity coupled photonic crystal. Results Phys. 2019, 14, 102478. [Google Scholar] [CrossRef]
- Lidiya, A.E.; Raja, R.V.J.; Pham, V.D.; Ngo, Q.M.; Vigneswaran, D. Detecting hemoglobin content blood glucose using surface plasmon resonance in D-shaped photonic crystal fiber. Opt. Fiber Technol. 2019, 50, 132–138. [Google Scholar] [CrossRef]
- Abadla, M.M.; Elsayed, H.A. Detection and sensing of hemoglobin using one-dimensional binary photonic crystals comprising a defect layer. Appl. Opt. 2020, 59, 418–424. [Google Scholar] [CrossRef] [PubMed]

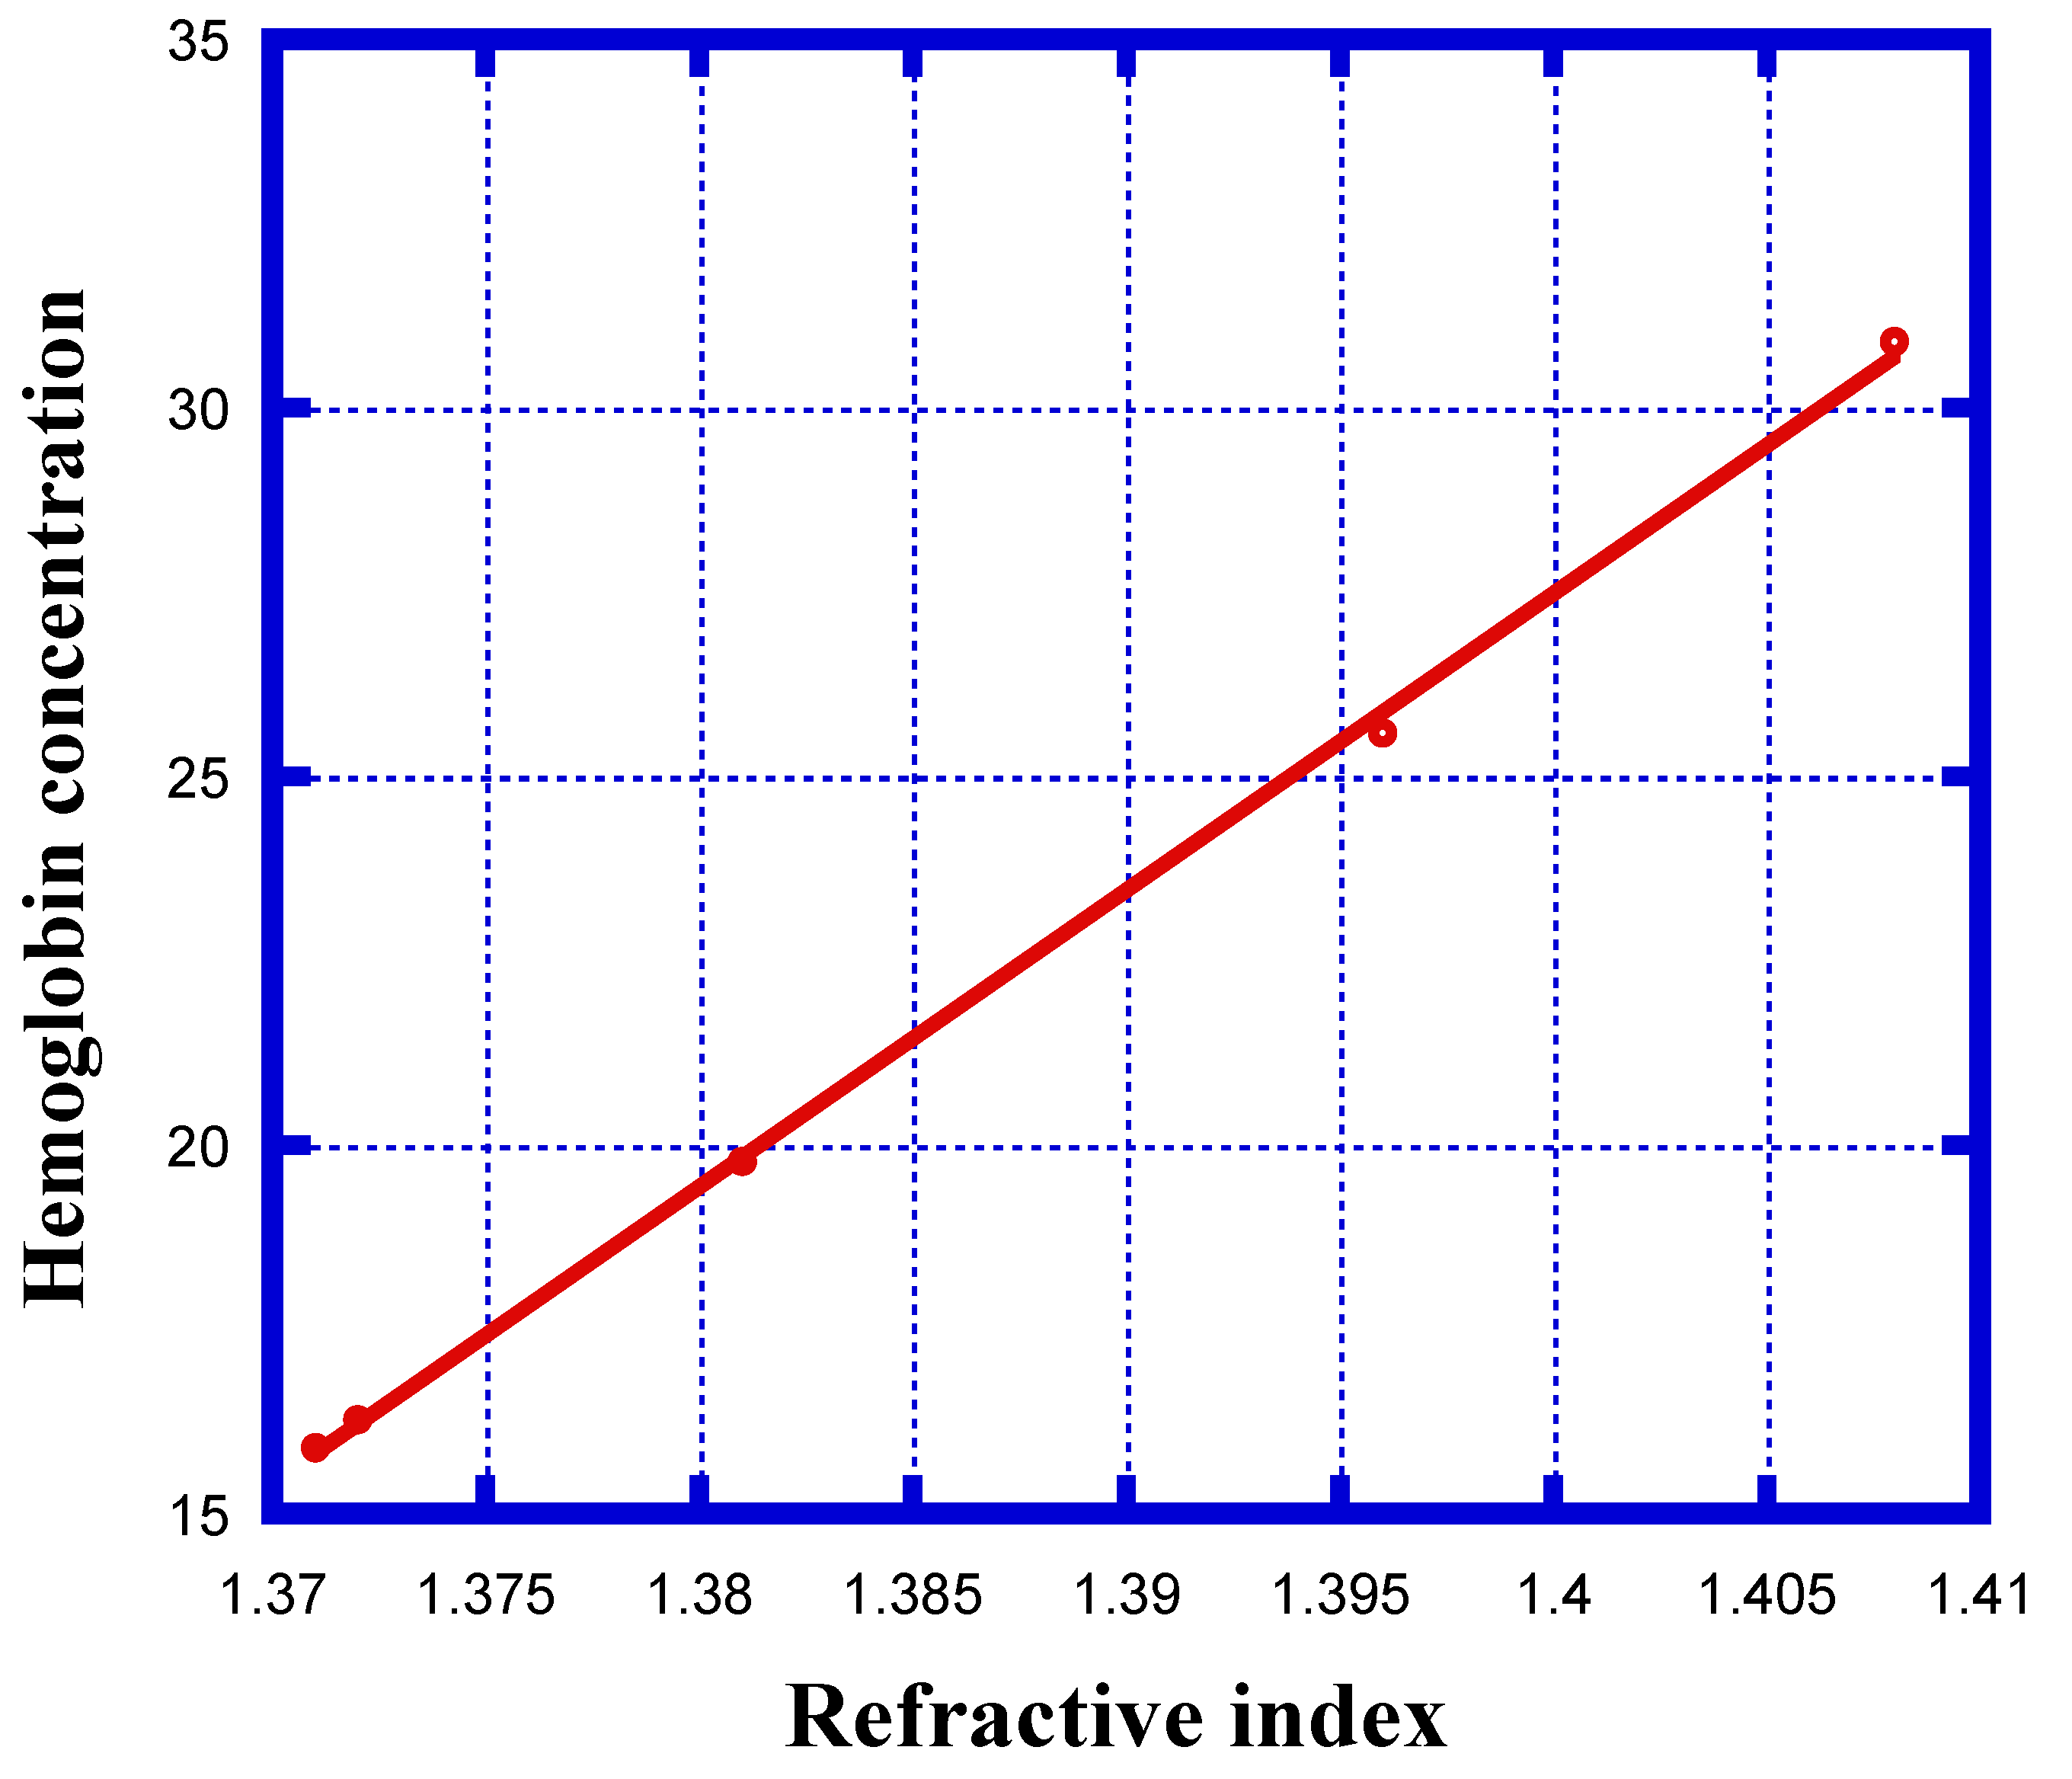
| Stage of Infection | RBC Component | Refractive Index | Hemoglobin Concentration (g/dL) |
|---|---|---|---|
| Healthy | Cell A | 1.408 | 30.9 |
| Ring | Cell B | 1.396 | 25.59 |
| Trophozoite | Cell C | 1.381 | 19.78 |
| Schizont | Cell D | 1.372 | 16.28 |
| Schizont | Cell E | 1.371 | 15.9 |
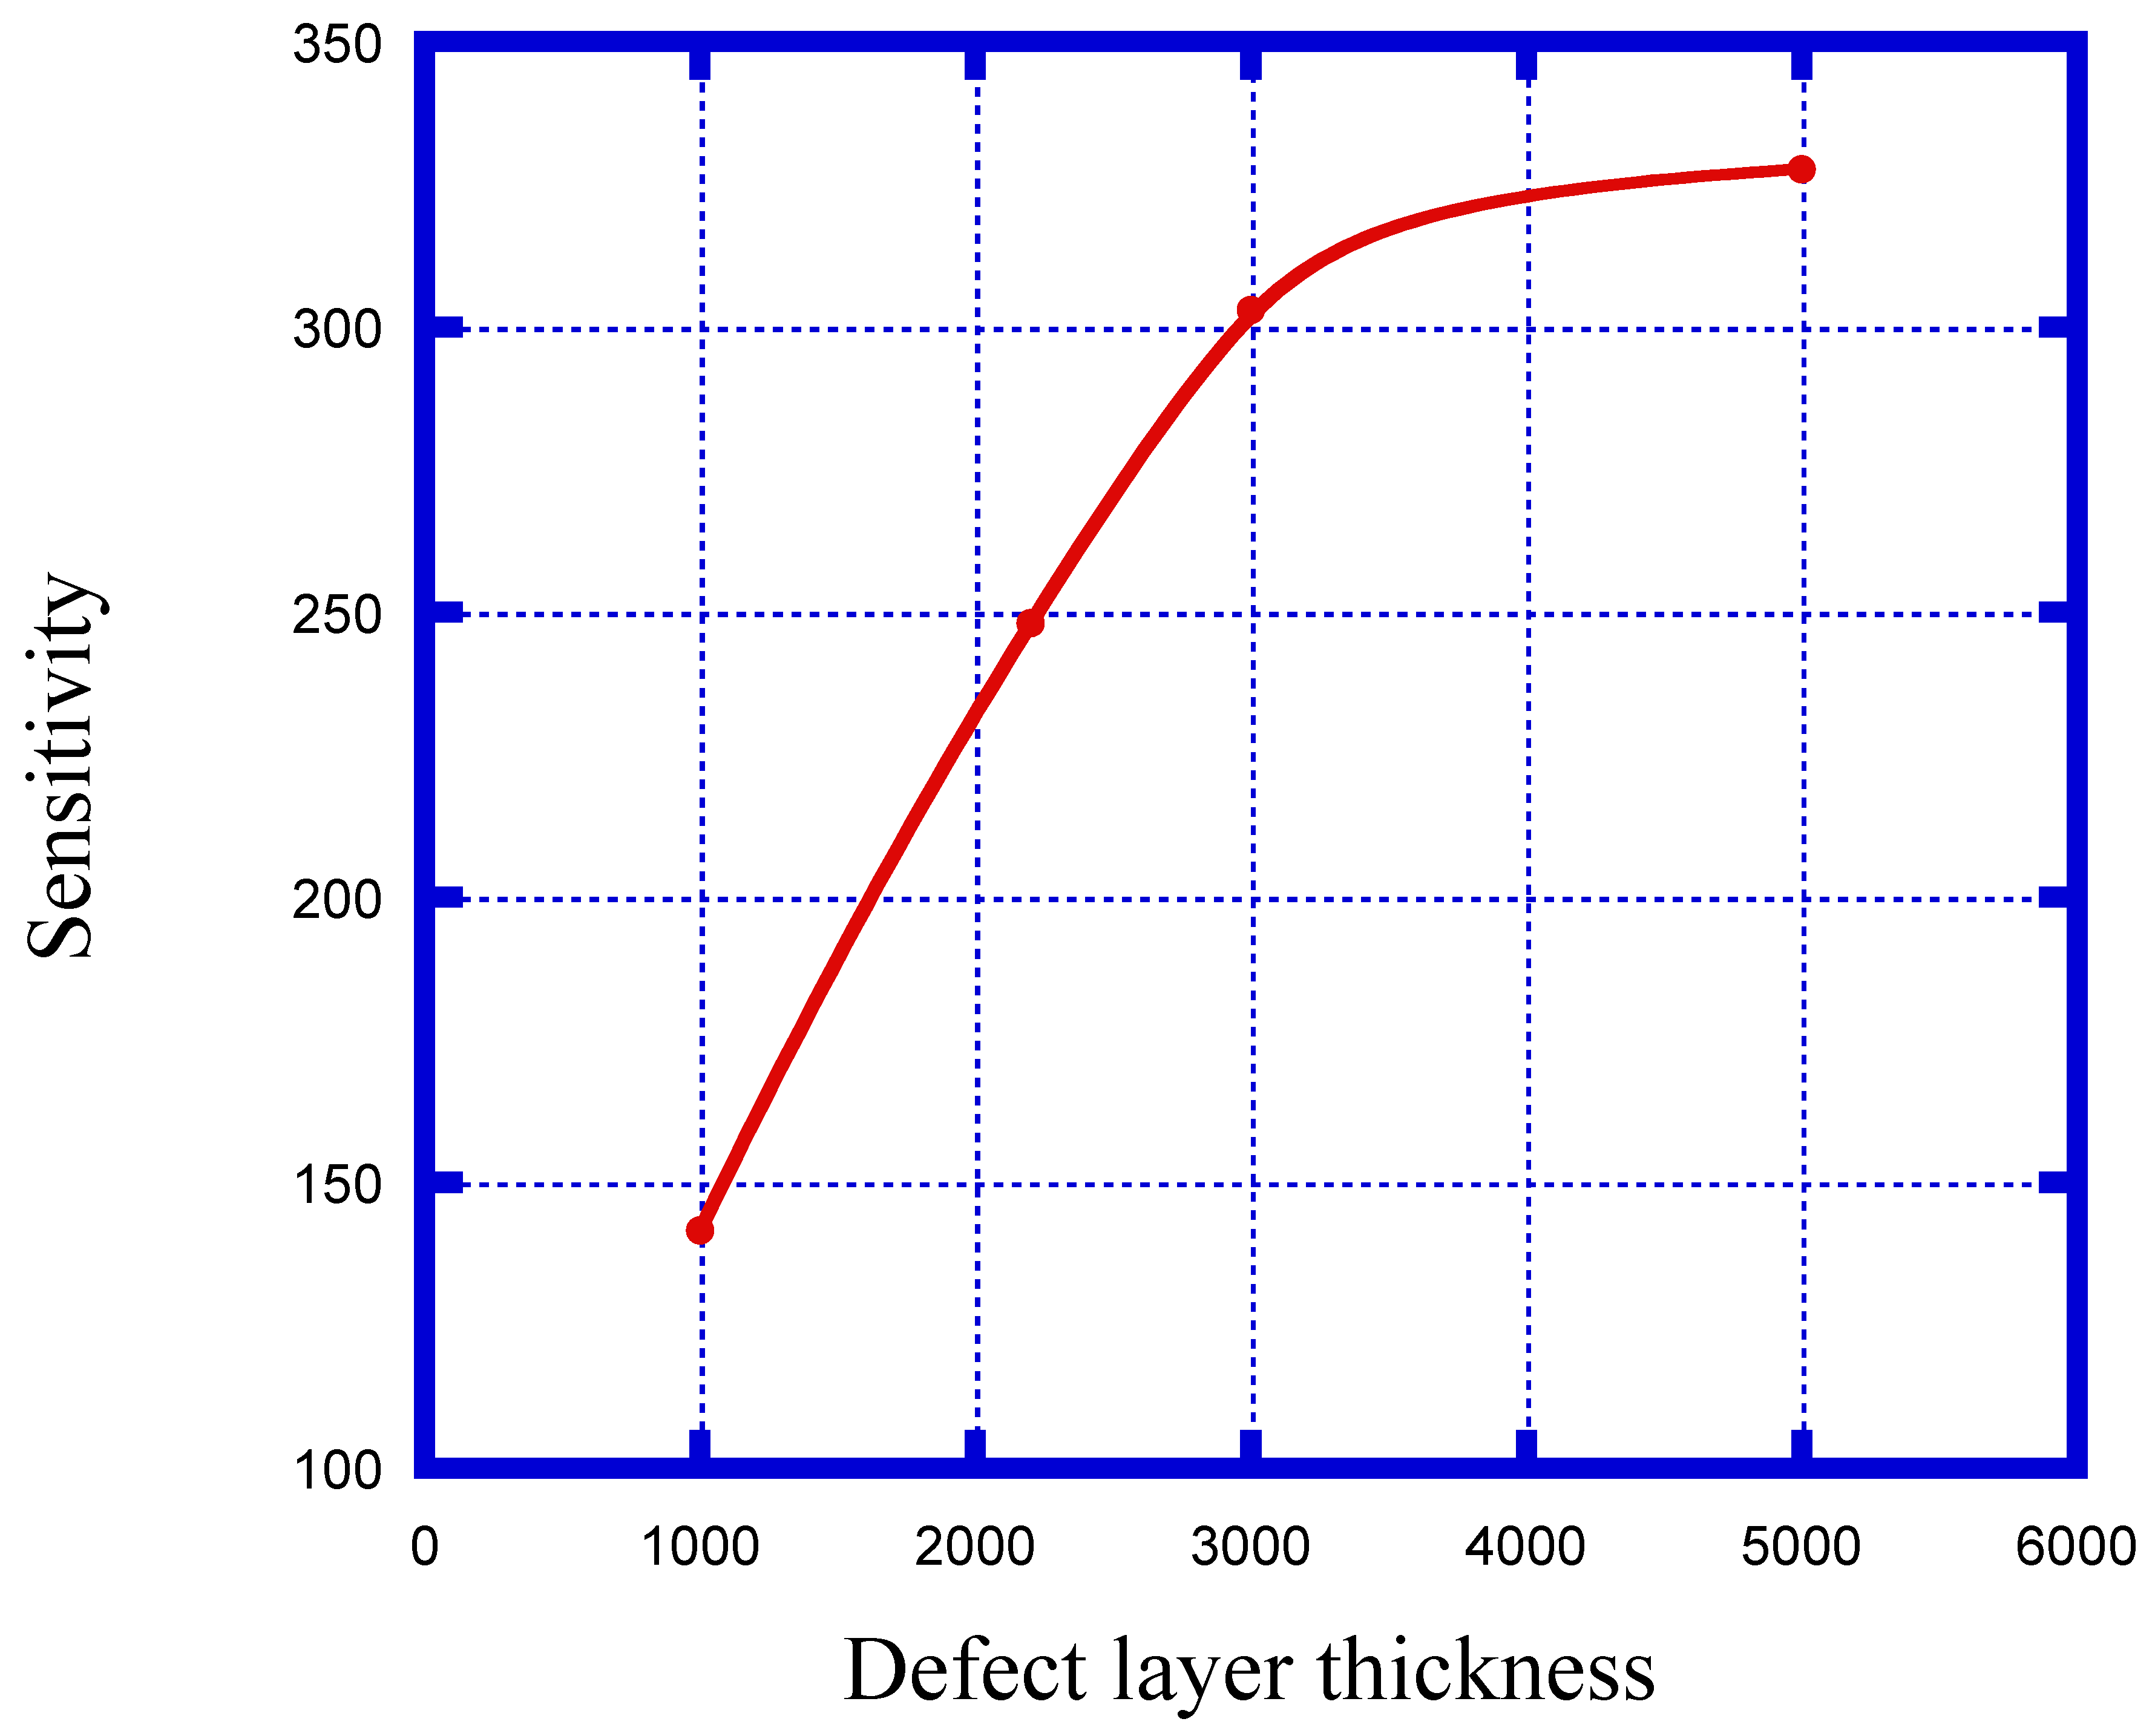
| Defect Layer Thickness (nm) | Sensitivity (nm/RIU) |
|---|---|
| dd = 1000 | 141.6 |
| dd = 2200 | 248.1 |
| dd = 3000 | 303 |
| dd = 5000 | 327.7 |
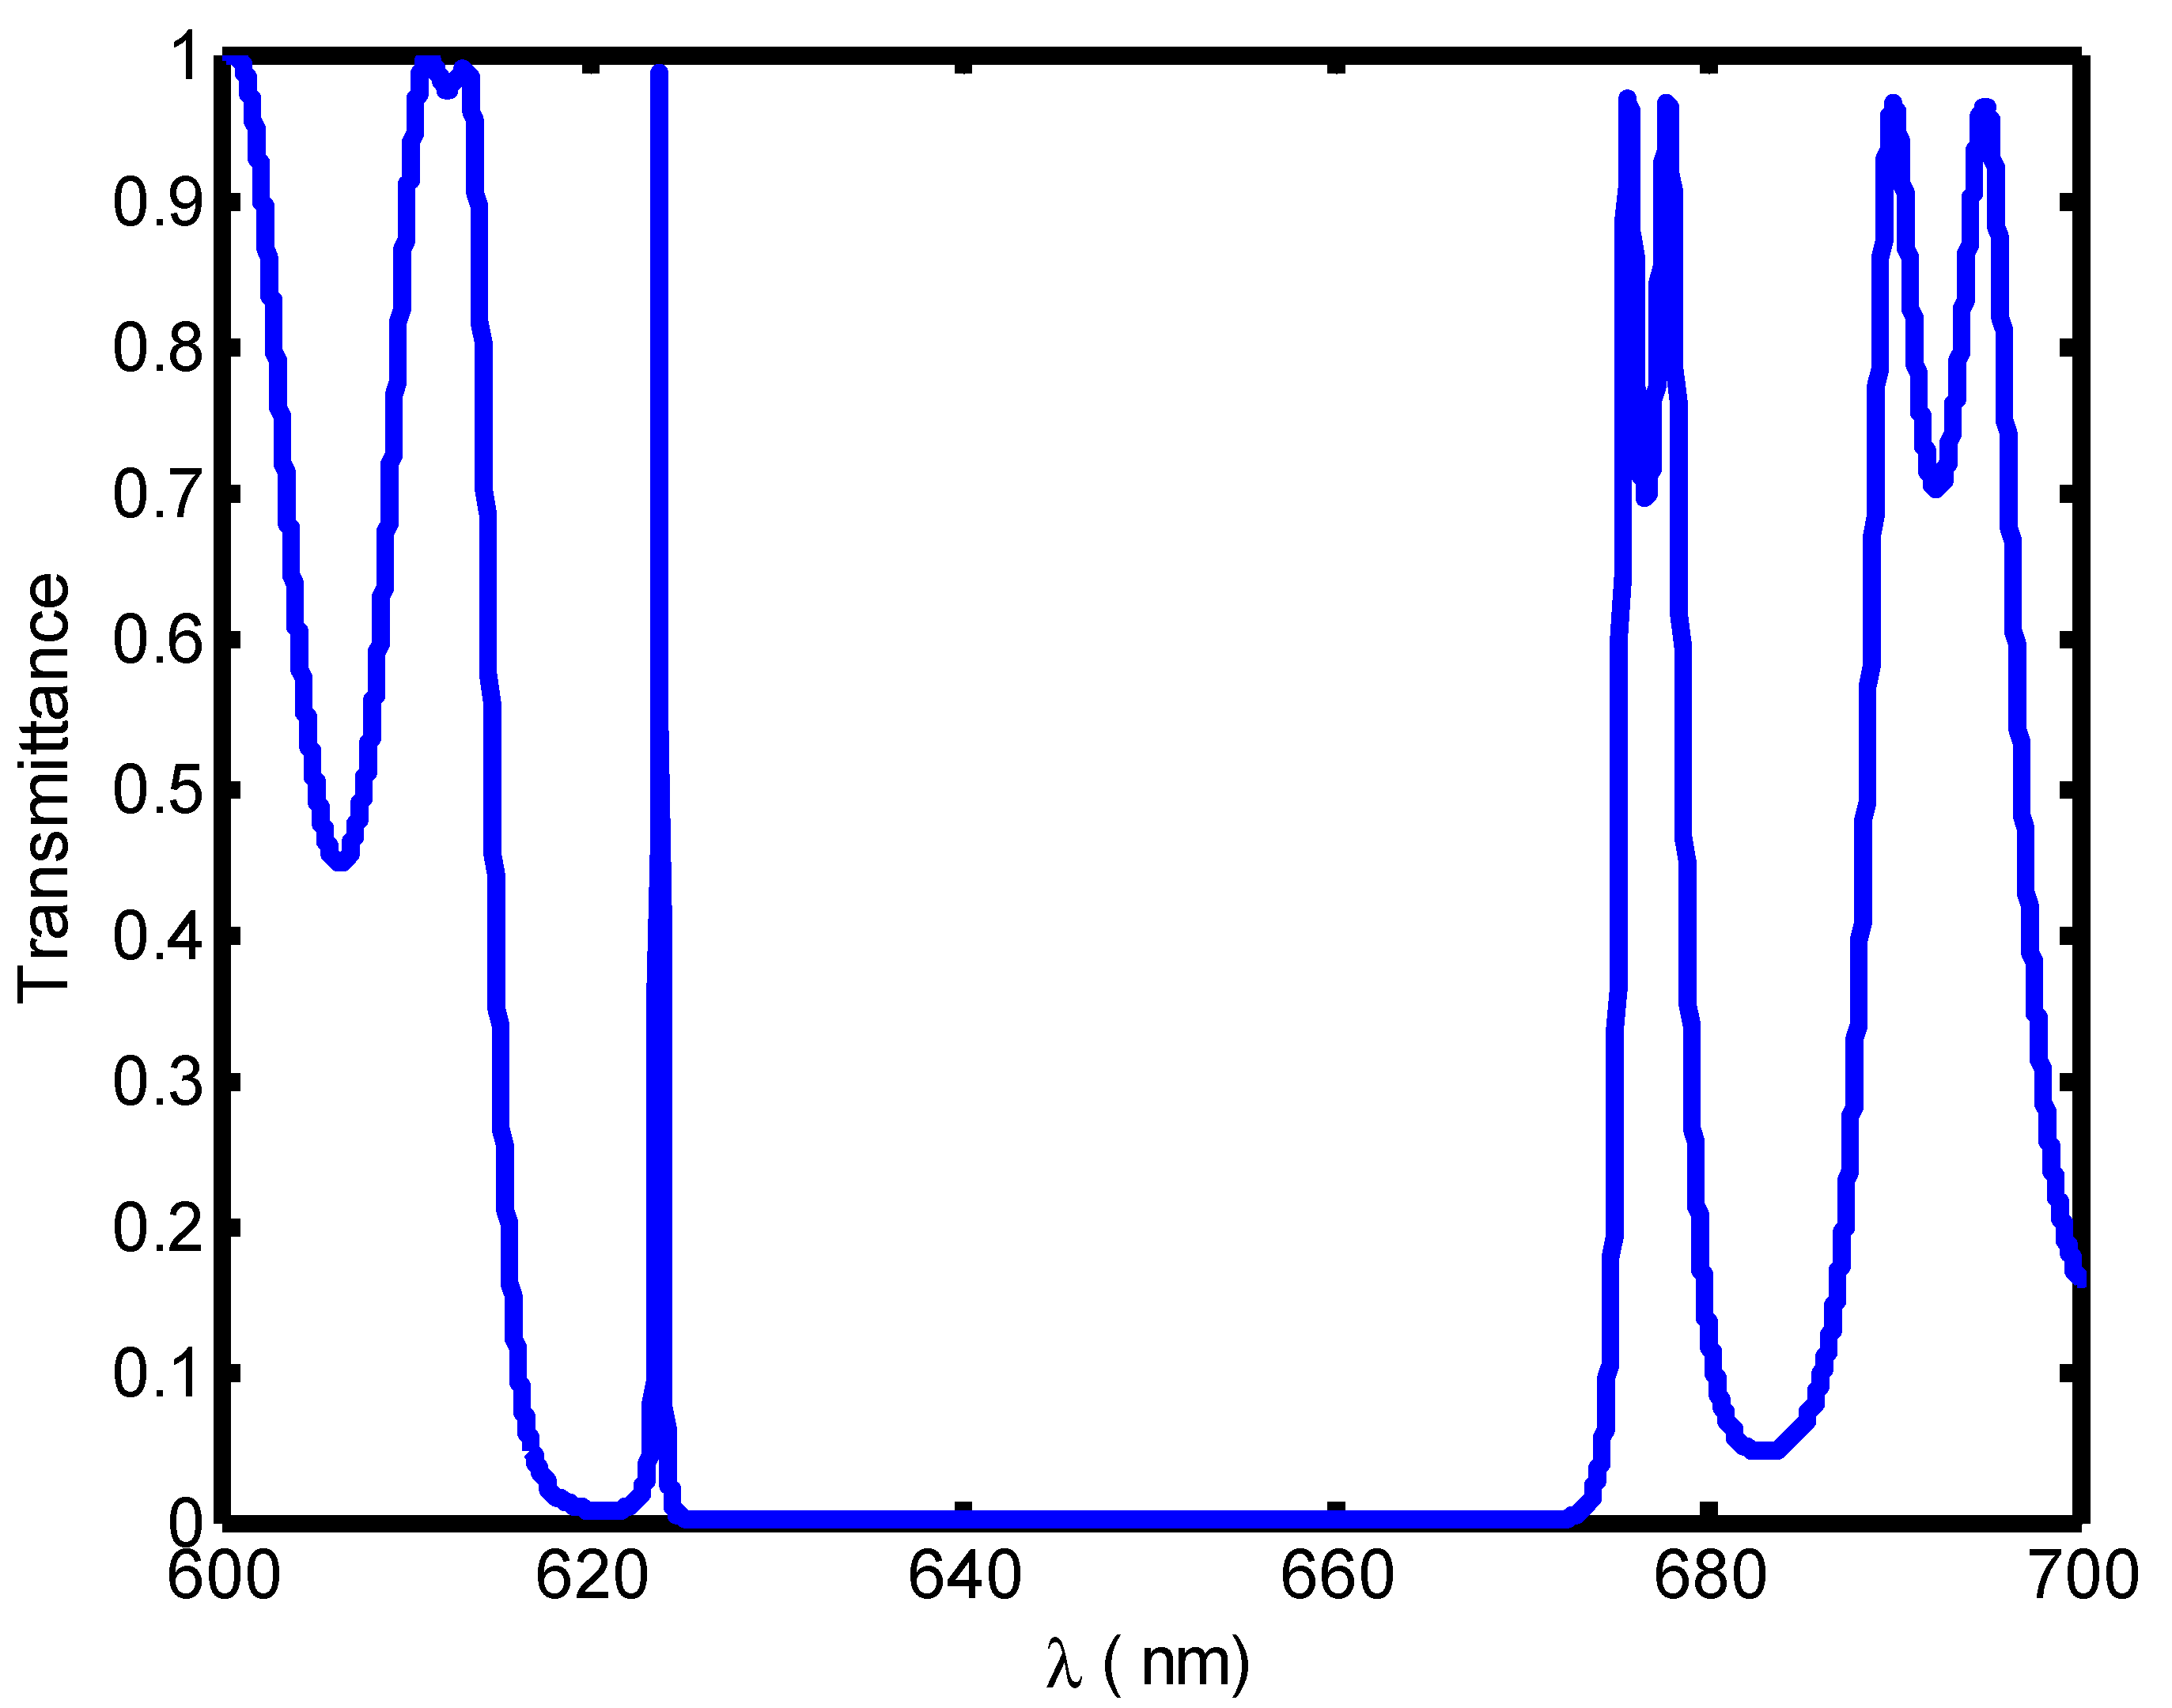
| Blood Component | Refractive Index | λPeak (nm) | S (nm/RIU) | FoM | QF | |
|---|---|---|---|---|---|---|
| Cell A | 1.408 | 671.4 | --- | 0.11 | --- | 6103.63 |
| Cell B | 1.396 | 667.8 | 300 | 0.036 | 8333.3 | 18550 |
| Cell C | 1.381 | 662.7 | 322.2 | 0.0135 | 23,866.7 | 49,088.8 |
| Cell D | 1.372 | 659.6 | 327.7 | 0.01 | 32,770 | 65960 |
| Cell E | 1.371 | 659.2 | 310.5 | 0.0095 | 32,684.2 | 69,389.47 |
| Year | Structure Details | Type of Analyte | S | FoM | QF | Reference |
|---|---|---|---|---|---|---|
| 2019 | 1D PC with graphene coated cavity walls | Blood plasma | 51.49 nm/RIU | NR | NR | [55] |
| 2019 | 2D PC waveguide structure | 10 different blood components | 473.38 | 7324.2 | NR | [56] |
| 2019 | D shaped PC fiber | Blood glucose | 0.83 | NR | NR | [57] |
| 2020 | 1D PC without coated cavity walls | Blood hemoglobin | 141 | 0.48 | NR | [58] |
| This work | 1D PC without coated cavity walls | Red blood cells | 327.7 | 32770 | 69,389.47 | --- |
Disclaimer/Publisher’s Note: The statements, opinions and data contained in all publications are solely those of the individual author(s) and contributor(s) and not of MDPI and/or the editor(s). MDPI and/or the editor(s) disclaim responsibility for any injury to people or property resulting from any ideas, methods, instructions or products referred to in the content. |
© 2023 by the authors. Licensee MDPI, Basel, Switzerland. This article is an open access article distributed under the terms and conditions of the Creative Commons Attribution (CC BY) license (https://creativecommons.org/licenses/by/4.0/).
Share and Cite
Saini, S.K.; Awasthi, S.K. Sensing and Detection Capabilities of One-Dimensional Defective Photonic Crystal Suitable for Malaria Infection Diagnosis from Preliminary to Advanced Stage: Theoretical Study. Crystals 2023, 13, 128. https://doi.org/10.3390/cryst13010128
Saini SK, Awasthi SK. Sensing and Detection Capabilities of One-Dimensional Defective Photonic Crystal Suitable for Malaria Infection Diagnosis from Preliminary to Advanced Stage: Theoretical Study. Crystals. 2023; 13(1):128. https://doi.org/10.3390/cryst13010128
Chicago/Turabian StyleSaini, Sujit Kumar, and Suneet Kumar Awasthi. 2023. "Sensing and Detection Capabilities of One-Dimensional Defective Photonic Crystal Suitable for Malaria Infection Diagnosis from Preliminary to Advanced Stage: Theoretical Study" Crystals 13, no. 1: 128. https://doi.org/10.3390/cryst13010128
APA StyleSaini, S. K., & Awasthi, S. K. (2023). Sensing and Detection Capabilities of One-Dimensional Defective Photonic Crystal Suitable for Malaria Infection Diagnosis from Preliminary to Advanced Stage: Theoretical Study. Crystals, 13(1), 128. https://doi.org/10.3390/cryst13010128