Article

Structural Determination of the Hexacoordinated [Zn(L)2]2+ Complex Isomer Type Using Solution-State NMR, DFT Calculations and X-ray Crystallography

by
Berislav Perić
1,*,
Natalija Pantalon Juraj
1,
Zoran Štefanić
2 and
Srećko I. Kirin
1,*
1
Laboratory for Solid State and Complex Compounds Chemistry, Ruđer Bošković Institute, Bijenička c. 54, HR-10000 Zagreb, Croatia
2
Laboratory for Chemical and Biological Crystallography, Ruđer Bošković Institute, Bijenička c. 54, HR-10000 Zagreb, Croatia
*
Authors to whom correspondence should be addressed.
Crystals 2023, 13(1), 16; https://doi.org/10.3390/cryst13010016
Submission received: 30 November 2022 / Revised: 14 December 2022 / Accepted: 19 December 2022 / Published: 22 December 2022

Abstract

:
The isomerism of zinc complex [Zn(L)2]2+ with tridentate ligand L having acetamide and pyridine groups on each side of the central amino- nitrogen atom has been investigated by DFT calculations, liquid state NMR and single-crystal X-ray diffraction. DFT was used for obtaining the ensembles of low-energy conformers of L and [Zn(L)2]2+ and for the calculation of NMR parameters for all conformers. For all generated conformers of L and [Zn(L)2]2+, the Mean Absolute Error [MAE(conf)] was tested as a structural quality parameter and compared with MAE(Bolz) for Boltzmann weighted ensembles. The most populated conformers had MAE(conf) values below 0.1 and 1 ppm for 1H shifts and 13C shifts, respectively. For the [Zn(L)2]2+ complex, the mer- C2 symmetric isomer was the most stable, in accordance with the X-ray structure of [Zn(L)2]2[SiF6][BF4]2. The cancellation of the magnetic equivalence of some nuclei valid for free L, when coordinated to the Zn2+ cation, was theoretically explained by the correct averaging of NMR parameters in the calculation procedure.

1. Introduction

For more than a hundred years, single-crystal X-ray crystallography has been the most precise scientific method for determining three-dimensional structures of molecules. The success of this method is based on the well-developed procedures for processing experimental data and the fact that measurements are carried out on samples in solid state where atomic movements are limited to oscillations around equilibrium positions. Samples in liquid state are unusable for this technique because the necessary periodicity of X-ray scatterers (i.e., atoms) is lost. On the other hand, NMR spectroscopy has developed into one of the most important analytical methods for samples in the liquid state, as well as in the solid state. The fortunate circumstance that many interactions affecting the NMR spectrum are canceled in the isotropic liquid medium makes liquid NMR spectroscopy easier to use than solid-state NMR spectroscopy (ssNMR). These interactions do not affect the spectrum but rather can be observed indirectly in the spectra. Usually, only three types of parameters are cited in almost every characterization of a new chemical compound: the chemical shift (δ), indirect spin-spin coupling (J), and multiplicity of signals. NMR crystallography, as the most recent scientific method (compared with X-ray crystallography and NMR spectroscopy), uses experimental parameters from NMR (mainly from ssNMR) in order to determine the structure of the sample at the atomic scale. However, the procedures and computer programs for NMR crystallography have not yet reached as much popularity in the experimental chemists’ community as the X-ray crystallography procedures have. In order to bring NMR spectroscopy even closer to experimental chemists (as a tool for 3D structural determination of molecules), Willoughby et al. suggested a 4-step protocol which leans on the computation of NMR parameters on a set of candidate structures, all of them with geometry optimized by computational chemistry methods [1]. They also suggested the comparison of calculated chemical shifts (δic), with chemical shifts obtained experimentally (δio) by computation of a “measure” of the structural model quality, i.e., the Mean Absolute Error (MAE) [1]:
MAE = (Σi |δicδio|)/N.
Label i is label of the one shift signal from N characteristic signals in the 1H or 13C spectra. Through this definition we can see immediately the analogy with the X-ray crystallographic R value [2]:
R = (Σh||Fhc| − K |Fho||)/(Σh|Fho|),
K = Σh|Fhc|/Σh|Fho|
where summation is performed over all measured X-ray reflections h. |Fho| and |Fhc| are absolute values of the calculated and observed structure factors for reflection h, respectively. The |Fho| value is connected with the intensity of reflection measured in the experiment and the |Fhc| value depends on the structural model. According to the above definition, K is just a numerical scale factor bringing the average |Fhc| values on the same numerical scale as the average |Fho| values. A large number of available reflections in X-ray diffraction experiments, especially in single-crystal X-ray diffraction, is the main reason for high reliability of X-ray diffraction as a structural determination method. Nevertheless, a number of NMR available experimental parameters (1H shifts, 13C shifts, J couplings in liquid NMR) and all other parameters available in ssNMR (dipolar couplings D, quadrupolar interaction Q, etc.), could be the basis for development of analogously reliable procedures for structural determination of molecules from NMR parameters.
In our group, one of the focuses of the research was on stereochemistry of metal coordination complexes [3,4] such as tridentate ligands of A-B-A type forming mer, trans-fac or cis-fac isomers of [M(A-B-A)2] complexes (M = metal) [3]. In our previous works, we investigated trans-fac- preferring imda [5,6] and cis-fac- preferring bpa [6,7] ligands (imda = iminodiacetamide, bpa = bis(2-picolyl)amine). Herein, we decided to prepare a new ligand L consisting of both chelating moieties, imda and bpa, for which different preferences were expected. In this way, the structural isomerism of metal coordination was further enriched because the ligand L was now of the A-B-C type. The preparation, characterization, and the structures of a new acetamide-pyridine ligand (L) and its zinc(II) complex [Zn(L)2]2+ (Scheme 1) are described in this paper.
All possible isomers of a [M(A-B-C)2] metal complexes are given in Scheme 2, and derivation of these isomers from the mer-, trans-fac- or cis-fac- isomers of [M(A-B-A)2] complexes is given in the Supplementary material (pages 2 and 3). Structural determination of ligand L and complex [Zn(L)2]2+ was based on liquid NMR measurements and DFT calculations by a similar 4-step procedure according to Willoughby et al. [1]. However, the programs and recommendations given by Grimme [8] were used. An advantage of the Grimme procedure is that the calculation of all parameters affecting the 1H NMR spectrum are taken into consideration, including 1H-1H J couplings. One of the goals of the present work was to test the usage of the MAE parameter (1) as a structural quality measure, so we computed MAE values for each of the candidate structural models for L and for [Zn(L)2]2+ [MAE(conf) values].
Finally, comparison of the [Zn(L)2]2+ structure obtained by the above mentioned procedure with the structure of [Zn(L)2]2+ complex from coordination compound [Zn(L)2]2][SiF6][BF4]2, obtained from the single-crystal X-ray diffraction, will be presented.

2. Materials and Methods

2.1. Synthesis and Characterisation

2.1.1. General Remarks

Reactions were carried out in ordinary glassware and chemicals were used as purchased from commercial suppliers without further purification. 2-Chloro-N-phenylacetamide (P1) was prepared according to a previously reported procedure [9]. The reactions were carried out in a microwave reactor (CEM Discover, CEM Inc, Scottsdale, AZ, USA), monitored by TLC on Silica Gel 60 F254 or neutral aluminium oxide 60 F254 plates and detected with a UV lamp (254 nm). L was purified using automated flash chromatography (Teledyne Isco CombiFlash Rf, Lincoln NE 68504, USA) equipped with a UV detector (254 nm) and pre-packed silica gel columns. Mass spectra were recorded on a HPLC-MS system (Agilent Technologies 1200, Budapest, Hungary) coupled with a 6410 Triple-Quadrupole mass spectrometer, operating in a positive ESI mode. IR spectra were recorded using KBr pellets with a Bruker Alpha FT-IR spectrometer.
NMR spectra were obtained on a Bruker Avance 300 or 600 spectrometer, operating at 300.13 or 600.13 MHz for 1H and 75.47 or 150.90 MHz for 13C. Chemical shifts, δ (ppm), indicated a downfield shift from the residual solvent signal [10]. 1H shifts and 1H-1H J couplings for L and [Zn(L)2]2+ were determined by using the optimization procedure of the NUMMRIT algorithm from the program Spinworks 4 [11], i.e., by defining spin systems and optimizing their δ and J values to coincide with experimental transitions (Supplementary material, Figures S8, S9, S12 and S13). These shifts and J couplings were taken as observed values (δo and Jo) in the calculation of MAE values, Equation (1). 1H spectra were calibrated according to residual acetonitrile signal at 1.94 ppm. Experimental 13C shifts (δo) for L and [Zn(L)2]2+ were determined directly from the 13C NMR spectra recorded in the {1H} decoupled APT mode and calibrated on residual acetonitrile signal at 1.32 ppm (Supplementary material, Figures S7 and S11). 2D 1H-1H COSY, 1H-13C HSQC, 1H-13C HMBC and 1H-1H NOESY spectra were recorded for L and [Zn(L)2]2+ in acetonitrile-d3 and used for the assignment of the signals (Supplementary Material, Figures S15–S23).

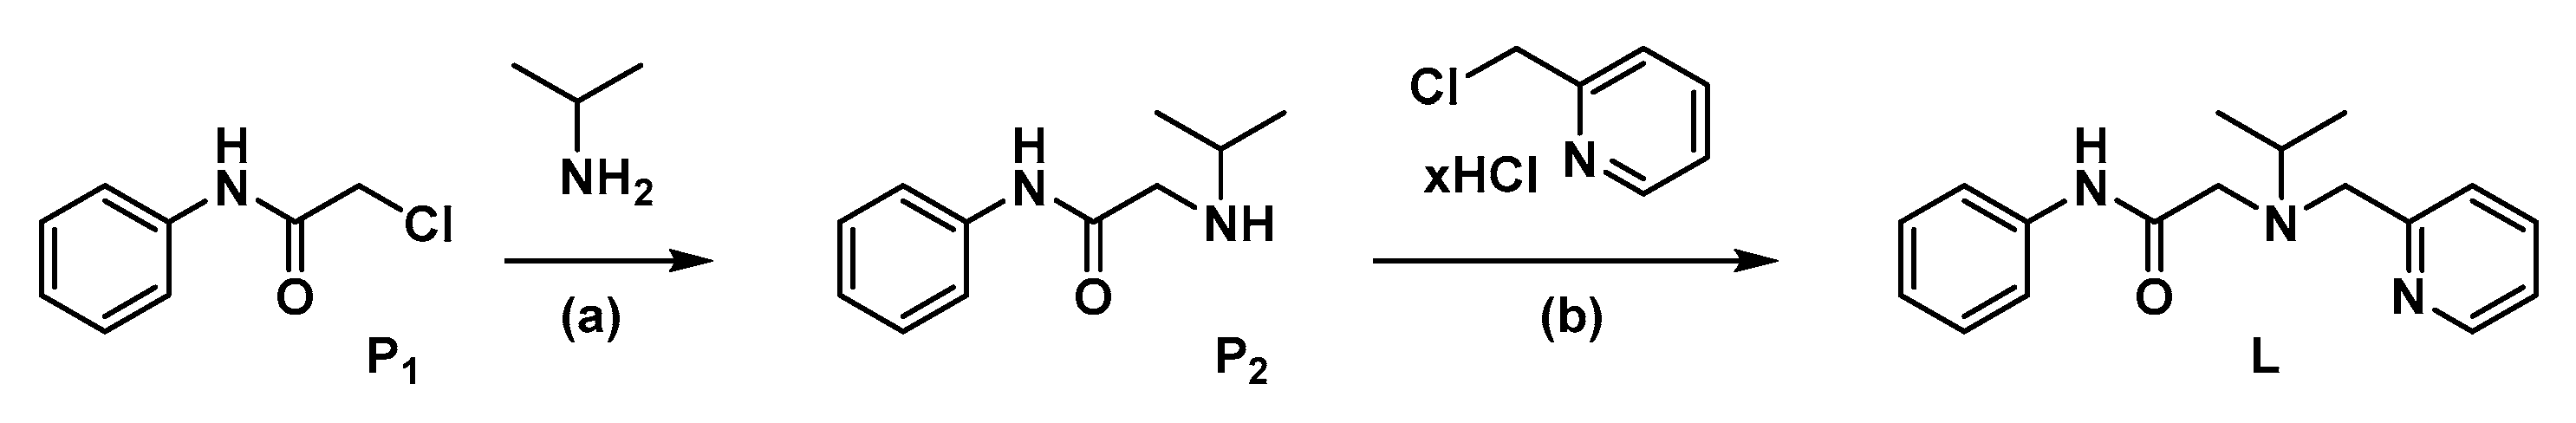
2.1.2. Synthesis of P2

2-Chloro-N-phenylacetamide P1 (1.5 g, 8.8 mmol) and KI (1.5 g, 8.8 mmol) were mixed in 20 mL acetonitrile until dissolved, then isopropylamine (1.13 mL, 13.3 mmol) was added, and the reaction mixture was stirred in a round bottom flask equipped with a condenser in a microwave reactor (50 W, reflux) for 30 min. The solvent was evaporated, and the mixture dissolved in citric acid and ethyl acetate and washed with ethyl acetate. Then NaHCO3 (sat.) was added to the aqueous layer until basic pH was achieved, and the product was extracted with ethyl acetate. The organic layer was dried over anhydrous sodium sulfate, filtered and evaporated in a vacuum yielding the product in the form of a light-yellow oil. Rf = 0.21, ethyl acetate:hexane = 4:6. Yield: 1.12 g (5.8 mmol, 66%). 1H NMR (300 MHz, DMSO) δ 9.80 (s, 1H), 7.66–7.57 (m, 2H), 7.36–7.24 (m, 2H), 7.10–6.98 (m, 1H), 3.27 (s, 2H), 2.73 (hept, J = 6.2 Hz, 1H), 2.28 (s, 1H), 1.00 (d, J = 6.2 Hz, 6H).

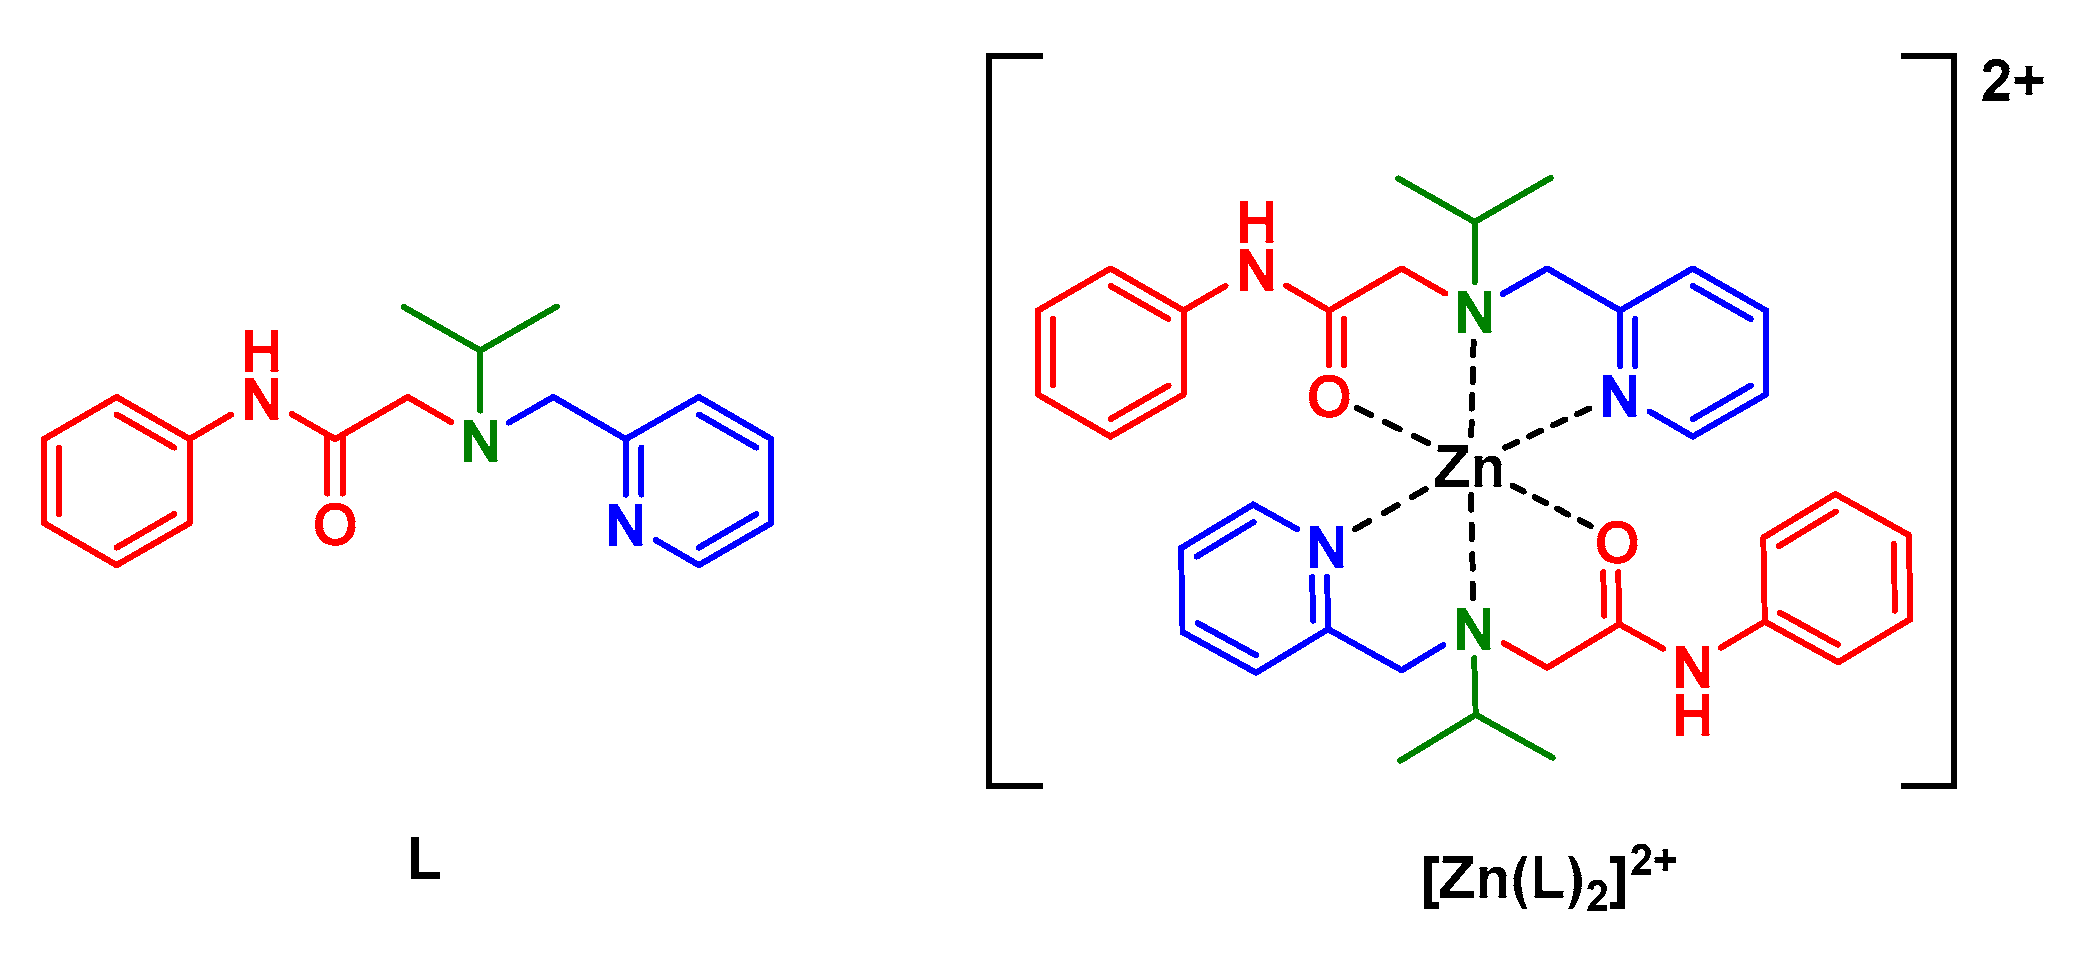
2.1.3. Synthesis of L

A solution of P2 (300 mg, 1.56 mmol), 2-(chloromethyl)pyridine hydrochloride (256 mg, 1.56 mmol), KI (256 mg, 1.56 mmol), and DIPEA (1.1 mL, 15.6 mmol) in DMF (10 mL) was stirred in a round bottom flask equipped with a condenser in a microwave reactor (50 W, 100 °C) for 1 h. The reaction was allowed to cool to room temperature. The mixture was dissolved in ethyl acetate, washed with NaHCO3 and brine, the organic layer dried over anhydrous sodium sulfate, filtered and evaporated in a vacuum. The crude product L was purified by automated flash chromatography (0% to 10% methanol in dichloromethane), Rf = 0.5, 5% methanol in dichloromethane. Yield: 317 mg (1.1 mmol, 72%), yellow oil. 1H NMR (600 MHz, CD3CN) δ 10.63 (s, 1H), 8.67–8.61 (m, 1H), 7.73–7.69 (m, 1H), 7.71–7.66 (m, 2H), 7.37–7.30 (m, 3H), 7.25–7.20 (m, 1H), 7.10–7.04 (m, 1H), 3.85 (s, 2H), 3.25 (s, 2H), 2.92 (hept, J = 6.6 Hz, 1H), 1.06 (d, J = 6.6 Hz, 6H). 13C NMR (151 MHz, CD3CN) δ 171.67, 160.54, 150.33, 139.91, 137.71, 129.76, 124.32, 124.16, 123.37, 120.07, 58.54, 54.72, 52.59, 18.58. ESI-MS: m/z 306.1 (M + Na+, 31%), 284.1 (M + H+, 100%). IR (KBr) ν ˜ /cm−1: 3454, 3216, 3056, 2966, 2931, 2831, 1682, 1597, 1530, 1443, 1315, 1173, 756, 694, 506.

2.1.4. Preparation of the [Zn(L2)]2+ Complex for NMR Measurements

Metal complexes for NMR measurements were prepared in situ, by dissolving L and zinc(II) triflate in different ratios in deuterated acetonitrile. Zinc(II) triflate was used instead of zinc(II) tetrafluoroborate due to the hygroscopic nature of zinc(II) tetrafluoroborate. Upon addition of increasing amounts of Zn(II) to L, formation of complexes of ML2 and ML stoichiometry at 0.5 and 1 equiv Zn(II) were observed, respectively (Supplementary material, Figures S24 and S25). IR (KBr) ν ˜ /cm−1: 3444, 3275, 2972, 2924, 1645, 1610, 1564, 1498, 1450, 1313, 1084, 760, 532, 482. 1H NMR (600 MHz, CD3CN, 293 K) δ 9.60 (s, 1H), 8.23–8.14 (m, 2H), 7.78 (d, J = 7.8 Hz, 1H), 7.58–7.53 (m, 1H), 7.45–7.35 (m, 4H), 7.29–7.22 (m, 1H), 4.63 (d, J = 15.3 Hz, 1H), 4.55 (d, J = 15.4 Hz, 1H), 4.04 (d, J = 17.1 Hz, 1H), 3.48 (d, J = 17.0 Hz, 1H), 3.13–3.08 (m, 1H), 1.17 (d, J = 6.2 Hz, 3H), 0.86 (d, J = 6.8 Hz, 3H). 13C NMR (151 MHz, CD3CN) δ 173.99, 156.61, 149.44, 143.00, 137.03, 130.23, 127.17, 126.61, 126.55, 122.15, 58.72, 52.14, 52.07, 20.94, 13.10.

2.1.5. Synthesis of [Zn(L)2]2][SiF6][BF4]2

Methanol solutions of the ligand L (24 mg, 0.08 mmol) and Zn(BF4)2·H2O (10 mg, 0.04 mmol) were heated until completely dissolved, mixed, and the mixture was placed in a tank with diethyl-ether for vapor diffusion. A small amount of colorless cubic crystals of [Zn(L)2]2][SiF6][BF4]2 suitable for X-ray diffraction were obtained after four months.

2.2. Calculation of the NMR Parameters

2.2.1. General Remarks

All DFT quantum chemistry calculations (optimizations, electronic energies, shieldings and J-couplings) were performed using the ORCA program (version 5.0.1) [12]. Geometry optimizations were performed with the r2SCAN-3c//def2-mTZVPP level of the DFT theory [13], electronic energies were performed with pw6b95-d4//def2-TZVPD level of the theory, and shieldings were calculated by the GIAO method [14]. Shieldings and J-couplings were performed using the PBE0-d4/def2-TZVP level of DFT theory. For J-couplings, all H–H atom pairs in the conformer/isomer closer than 8 Å were calculated, calculating only the Fermi-contact term [8]. The calculations used an implicit smd solvent model of acetonitrile.

2.2.2. Generation of Conformer/Rotamer Ensembles (Step 1)

First crude structural models for L and for each possible isomer of [Zn(L)2]2+ were prepared by the Avogadro program, initially optimized by the UFF force filed [15]. These models were used in the generation of conformer/rotamer ensembles, performed using the default iMTD-GC workflow of the CREST program [16]. The workflow consisted of iterative repetitions of molecular meta-dynamic runs, regular dynamics runs, Z-matrix crossing, and final geometry optimizations. The GFN2 parametrization of the semiempirical GFN-xTB theory was used [17], with the implicit gbsa solvation model for acetonitrile. Although all six isomers of [Zn(L)2]2+ were used as starting models, the final conformer/rotamer ensembles contained identical sets of isomers, with the C2 symmetric mer- isomer as the most stable one. Interestingly, the trans-fac-2 type, and the three cis-fac type isomers, were not obtained.

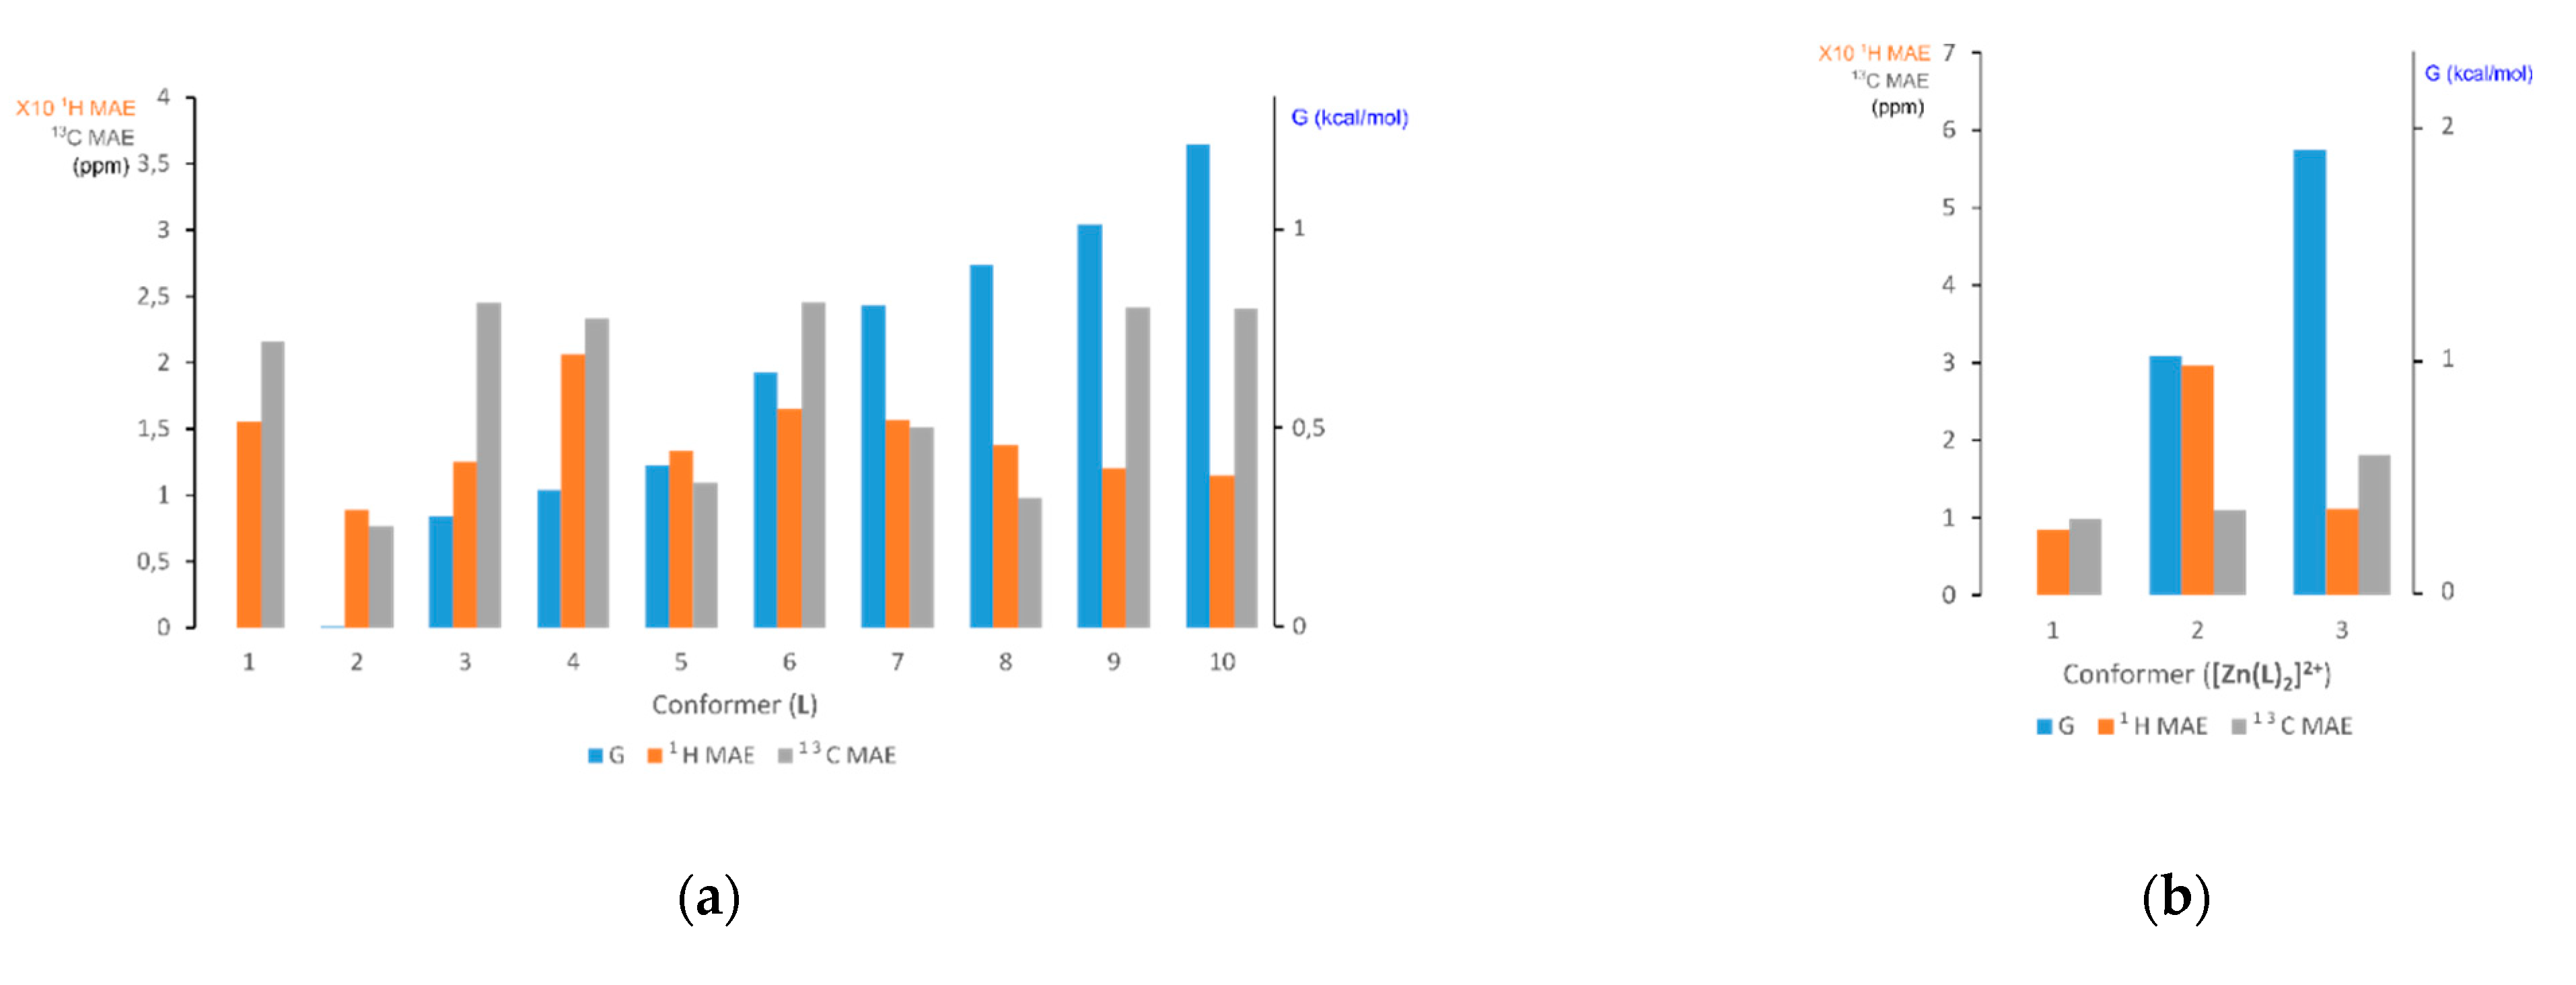
2.2.3. Free Energy Ranking of Conformers in Solution (Step 2)

Conformer/rotamer ensembles generated in step 1 were further analyzed with the CENSO program [16,18]. Geometry optimizations were performed using r2SCAN-3c//def2-mTZVPP level of the DFT theory [17] with smd solvation model for the acetonitrile. After geometry optimizations, free energies of conformers (Gi) were refined by calculation of the electronic energy using the pw6b95-d4//def2-TZVPD level of DFT theory (with smd solvent model for acetonitrile) and, with calculation of after geometry optimizations, the mRRHO contribution to the free energy was calculated with the with GFN-xTB semiempirical theory (GFN2 parametrization), with the alpb solvent model for acetonitrile [16,18]. Six conformer/rotamer ensembles of the [Zn(L)2]2+ complex, generated by six separate CREST calculations (different starting isomers), became identical ensembles containing only three significantly populated conformers: one conformer of the trans-fac-1 isomer and two conformers of the mer- isomer. The most stable was the C2 symmetric mer- isomer, the same one that was obtained by GFN2 semi-empirical optimizations at the end of the CREST calculation (step 1). The term “significantly populated” means that the calculated Boltzmann population (k = Boltzmann constant):
pi(T) = Exp(−Gi/kT)/Σ[Exp(−Gi/kT)]
was above 1% at room temperature (T = 293 K). Summations in Equation (3) were over all generated conformer/rotamer ensembles. Calculated free energy of the complex [Zn(L)2]2+ (product in the complexation reaction) was compared with calculated free energy of the reactants (2L + Zn2+). Negative value obtained (−203 kcal/mol) showed favorable complexation direction of the reaction. Structures of the ten significantly populated conformers of L and three significantly populated conformers/isomers of [Zn(L)2]2+ were deposited in two XYZ-format files as additional Supplementary Material.

2.2.4. Computation of NMR Parameters (Step 3)

For all significantly populated conformers of L and [Zn(L)2]2+, the 1H and 13C shieldings, as well as 1H–1H J-couplings, were calculated in two steps: first the 1H shieldings and 1H–1H J-couplings were calculated for all H atoms. Then, the 13C shielding calculations for all C atoms were performed.

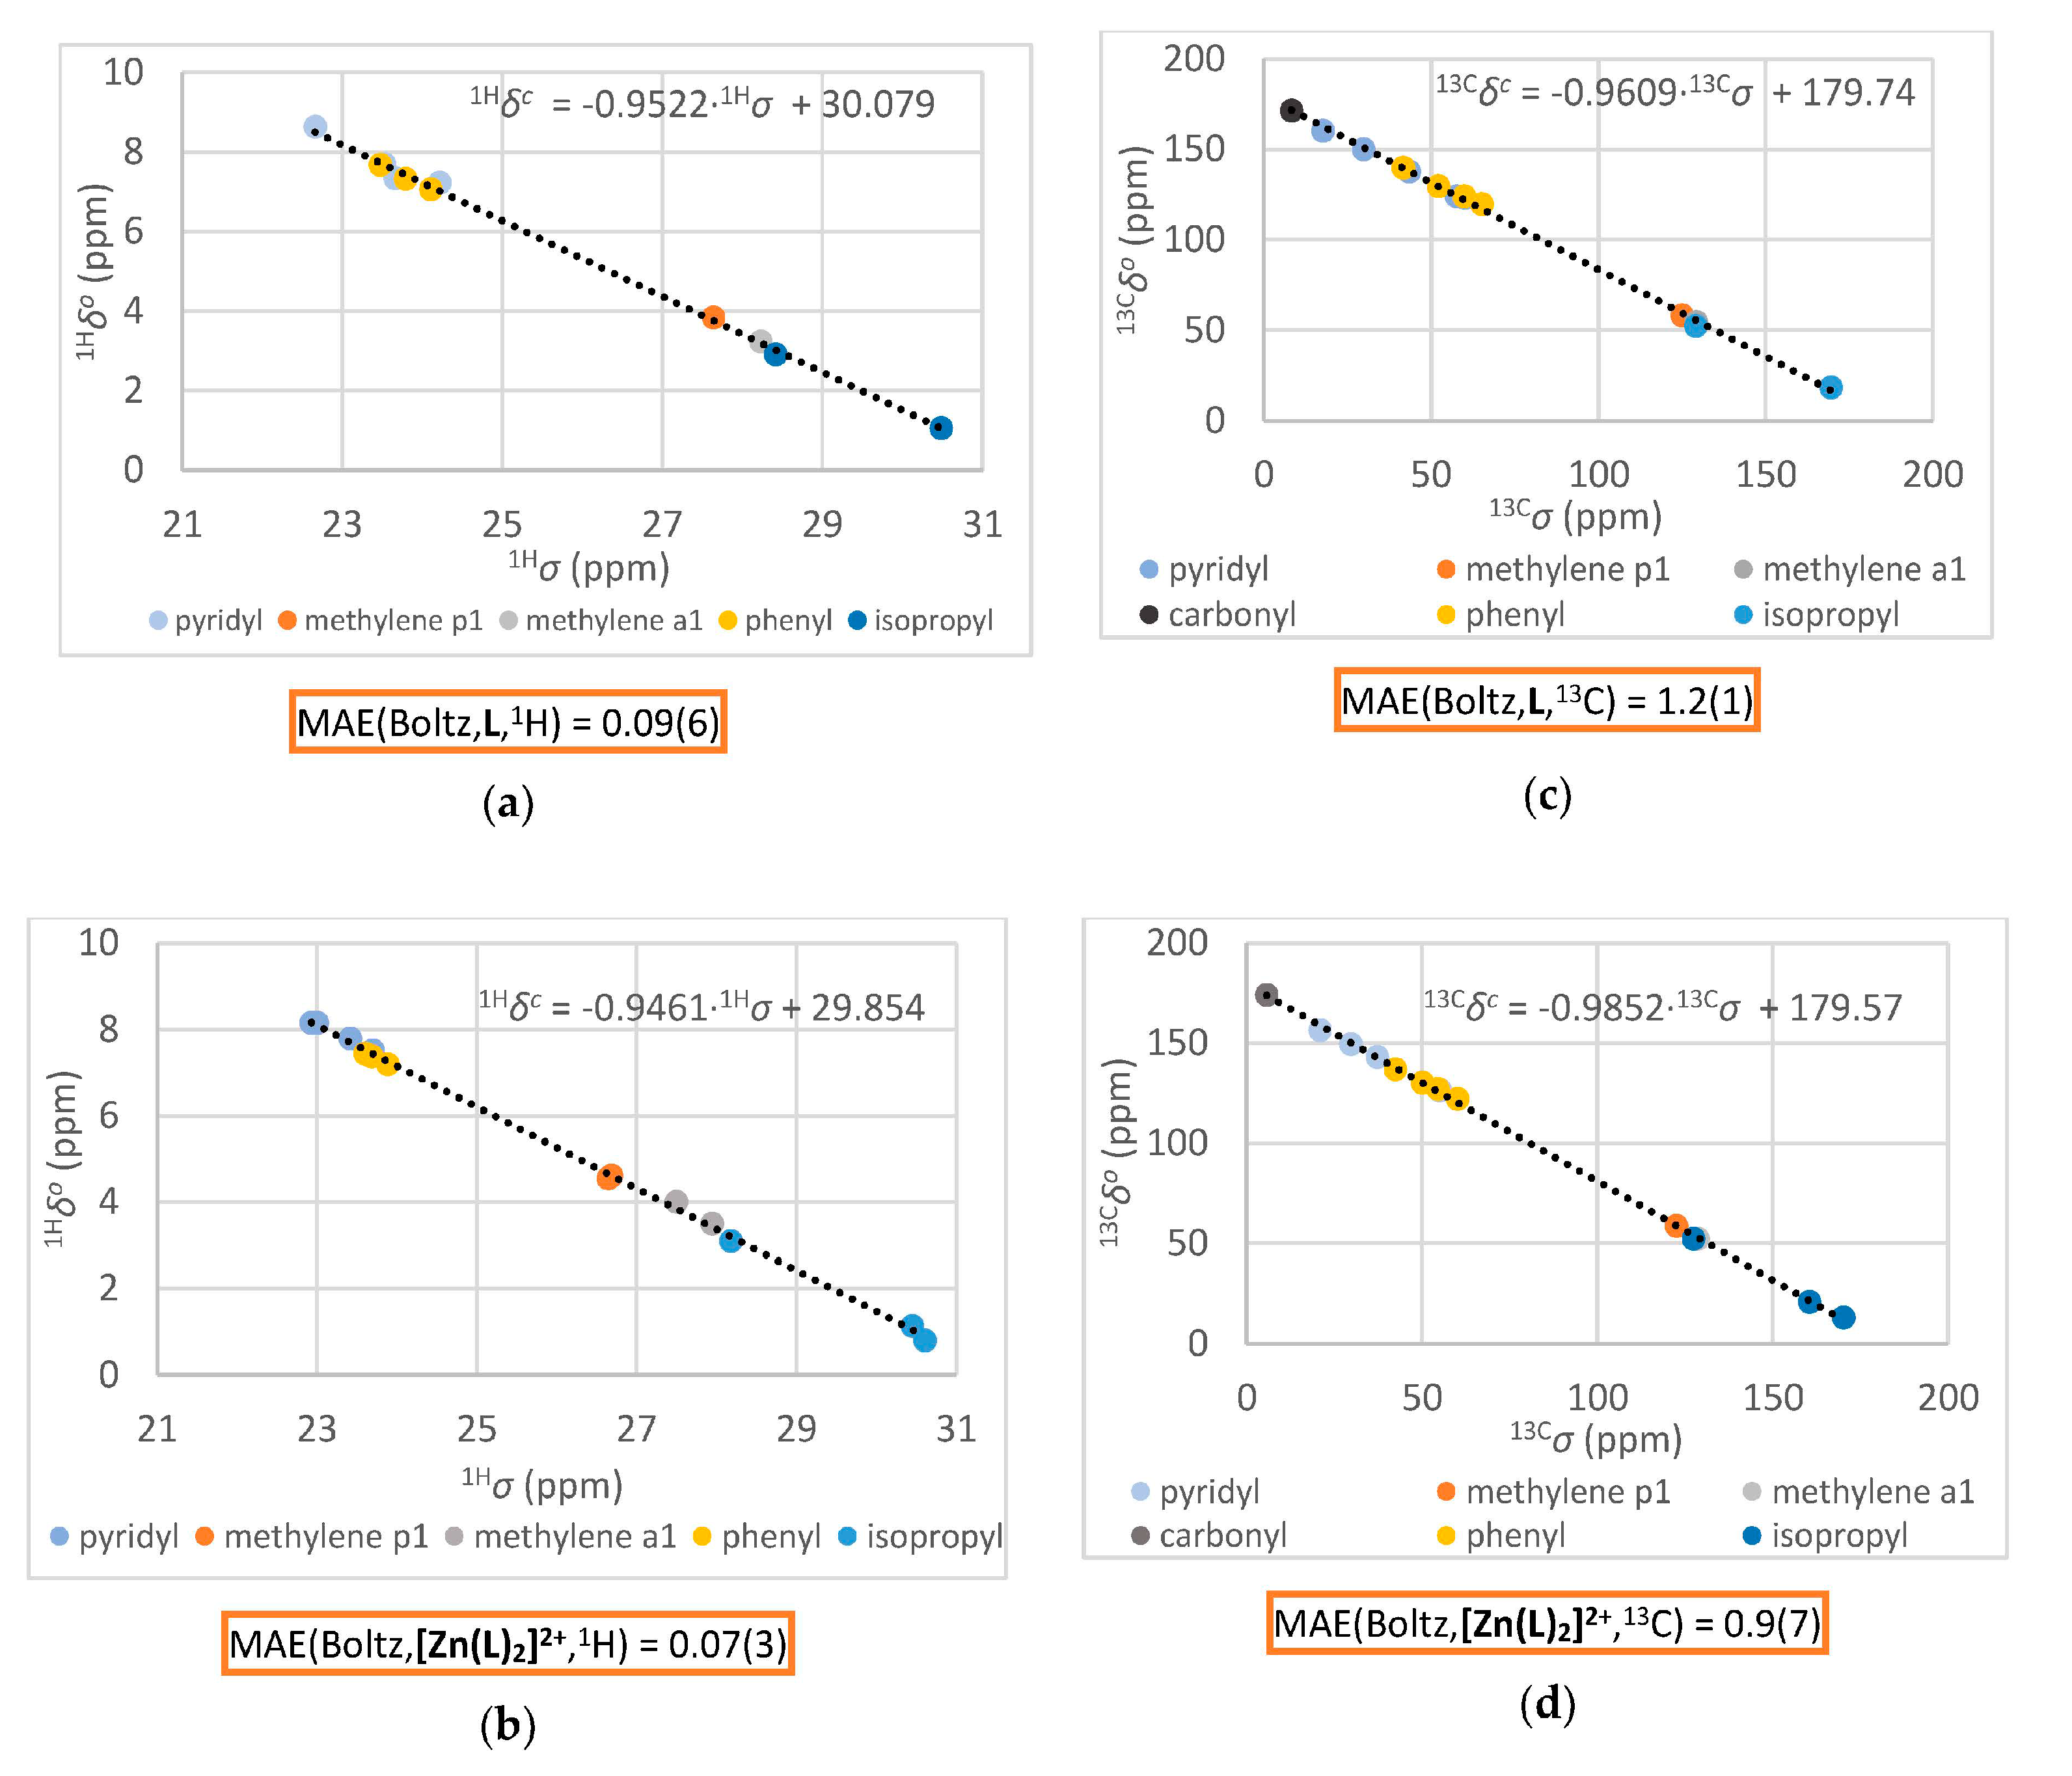
2.2.5. Computation of the Averaged NMR Parameters and MAE Values (Step 4)

The averaging of NMR calculated parameters for individual groups of nuclei was performed in view of the experimental result that two different sets of signals were obtained for L and for [Zn(L)2]2+. All definitions for averaged shieldings and J couplings, which were consequences of fast molecular motions leading to fast exchange of the nuclei in specific chemical groups, are given in Figures S27 and S28 of Supplementary material. These define the averaging over different rotamers for one conformer [8]. Additionally, the Boltzmann weighted parameters were calculated according to the equation:
param.w = Σconf. pi(T) · paramconf(i)
where pi(T) is the Boltzmann population at temperature T [Equation (3)] and paramconf(i) is the NMR parameter (1H or 13C shielding or 1H-1H J coupling) for conformer i. Summation in Equation (4) was performed over all significantly populated conformers. Calculated rotamer-averaged shieldings (σc) for each conformer were correlated with experimental shifts (δo), using linear regression calculations, in order to obtain parameters A and B, i.e., the intercept and the slope of the linear regression line [1]. Using these parameters, the calculated shifts δc were calculated by:
δc = A · σc + B,
These values were used for the calculation of MAE values by the Equation (1) for each conformer [MAE(conf) values], i.e., for each structural model of L and [Zn(L)2]2+. The correlation was also calculated for Boltzmann weighted parameters from which MAE(Bolz) parameters were obtained.
An exception from the above-described correlation procedure for calculation of δc was the amide 1H nucleus (N-H). Although NMR-DFT calculations included this nucleus, its shielding and J couplings values were not used in correlation with experimental data.

2.3. X-ray Diffraction

A translucent colorless block-like specimen of [Zn(L)2]2][SiF6][BF4]2, approximate dimensions 0.120 mm × 0.210 mm × 0.250 mm, was used for the X-ray crystallographic analysis. The X-ray intensity data were measured on a Bruker D8 VENTURE KAPPA diffractometer system equipped with an INCOATEC 3.0 microfocus sealed tube (Cu Kα, λ = 1.54178 Å), and a multilayer mirror monochromator. The frames were integrated with the Bruker SAINT software package using a narrow-frame algorithm [19]. The basic experimental data for the single-crystal X-ray diffraction measurement are given in Table 1. Data were corrected for absorption effects using the multi-Scan method (SADABS) [20]. The ratio of minimum to maximum apparent transmission was 0.829. The calculated minimum and maximum transmission coefficients (based on crystal size) were 0.7090 and 0.8430. The final unit cell parameters were based upon the refinement of the XYZ-centroids of 9237 reflections above 20σ(I) with 4.767° < 2θ < 148.8°. The reflections showed very high symmetry in reciprocal space, consistent with m 3 ¯ m Laue class. The structure was successfully solved by the SHELXT program [21] in the high symmetry space group P n 3 ¯ n (No. 222) and refined by the least-square procedure with the SHELXL program [22] (refinement of F2 on all data). The structure was also solved in all maximal cubic subgroups [23] of the space group P n 3 ¯ n [ P 4 ¯ 3 n (No. 218), P432 (No. 2017), P n 3 ¯ (201)], with identical structure, i.e., the models obtained in the lower space groups were always able to transfer into a higher symmetry structural model. In this model, all non-hydrogen atoms from the [Zn(L)2)]2+ cation were obtained, as well as atoms from the [SiF6]2− and two types of the [BF4] anions. The central Si atom of the [SiF6]2− anion was located on the crystallographic two-fold symmetry axis which did not coincides with any of the Si-F bonds, so additional symmetry equivalent F atoms were bonded to the same Si atom. For this reason, some of the F atoms had occupancies of 0.5, i.e., they were disordered over two positions. Two types of [BF4] anions differed by their crystallographic environment: one type lay on the crystallographic three-fold axis which coincided with one of the B-F bonds, i.e., it coincided with the internal three-fold symmetry of the [BF4] anion. There was no disorder for this type of [BF4] anions. The other type of the [BF4] anion lay near the crystallographic two-fold symmetry axis, so all atoms were disordered over two positions, with occupancies of 0.5. This anion type was modeled and refined as a rigid body model of an idealized [BF4] anion [24]. Despite the observation that all atoms from the [Zn(L)2)]2+ cation were obtained from the SHELXTL program, and despite the fact that their displacement parameters displayed regular behavior during refinements, the structure still contained two large solvent accessible areas of volume cca. 5026 Å3 located around highly symmetrical sites (0.25, 0.25, 0.25) and (0.75, 0.75, 0.75). From the difference electron density map it was not possible to recognize any structural motif, so it was assumed that solvent molecules and four additional [BF4] anions per void occupied this space. Electron density in these solvent accessible areas was accounted for in the refinements by the SQUEEZE procedure of program PLATON [25]. Positions and isotropic displacement parameters of hydrogen atoms bound to nitrogen atoms ([Zn(L)2)]2+ cation) were refined while those bonded to carbon atoms were included at the geometrically calculated positions using Uiso(H) = 1.2·Ueqiv(C) and Uiso(Hmetyl) = 1.5·Ueqiv(Cmethyl). The CCDC 2222947 refcode contained the supplementary crystallographic data for this paper. These data can be obtained free of charge from the Cambridge Crystallographic Data Centre via http://www.ccdc.cam.ac.uk/data_request/cif (accessed on 30 November 2022).

3. Results

3.1. Synthesis

The tridentate acetamide-pyridine (a-p) ligand L was synthesized in three steps. The precursor P1 was obtained by chloroacetylation of aniline [26]. In the next step, precursor P2 was obtained by nucleophilic substitution of isopropylamine with KI as the catalyst [27], and finally, ligand L was prepared in a nucleophilic substitution reaction of P2 and 2-(chloromethyl)pyridine hydrochloride (Scheme 3) [3].
For the complex [Zn(L)2)]2+ (Scheme 1) the NMR characterisation with Zn(CF3SO3)2 was performed in situ, while compound [Zn(L)2]2[SiF6][BF4]2 was prepared with Zn(BF4)2·H2O and structurally characterized by single-crystal X-ray diffraction. The [SiF6]2− anion was formed as a consequence of [BF4] decomposition to F, where the resulting F reacted with the glass reaction vessel, forming [SiF6]2− [28,29].

3.2. NMR Analysis

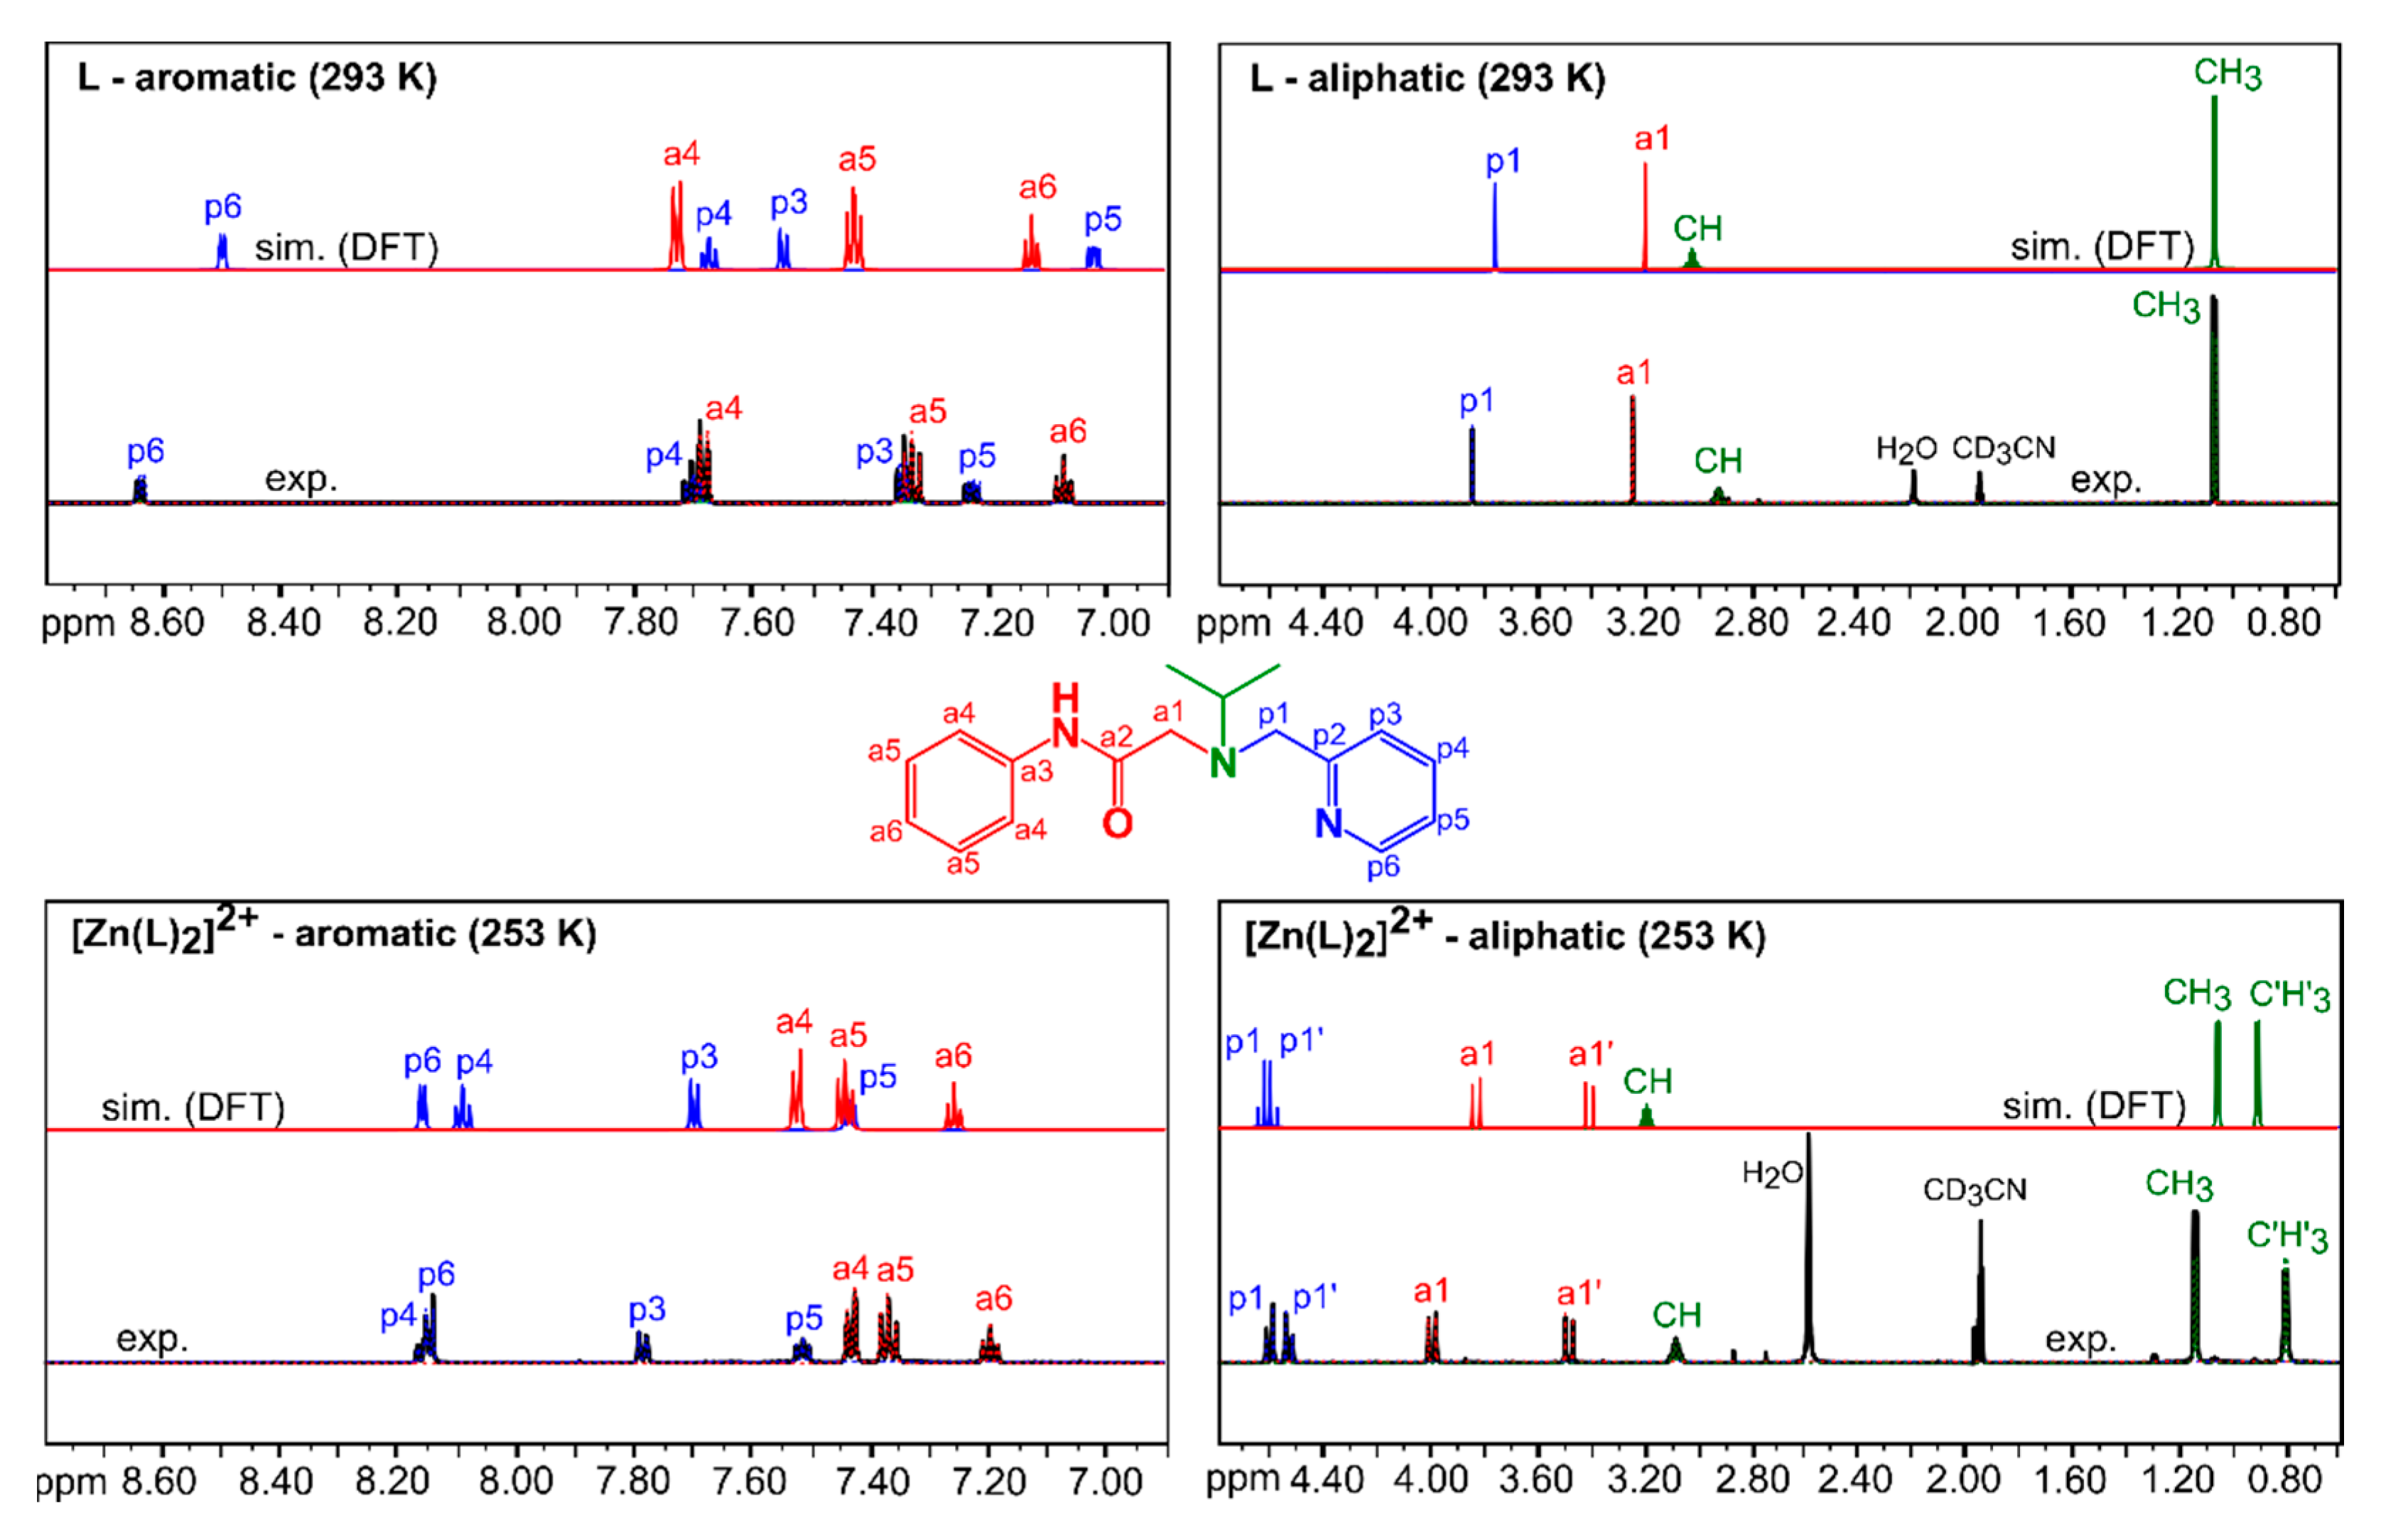
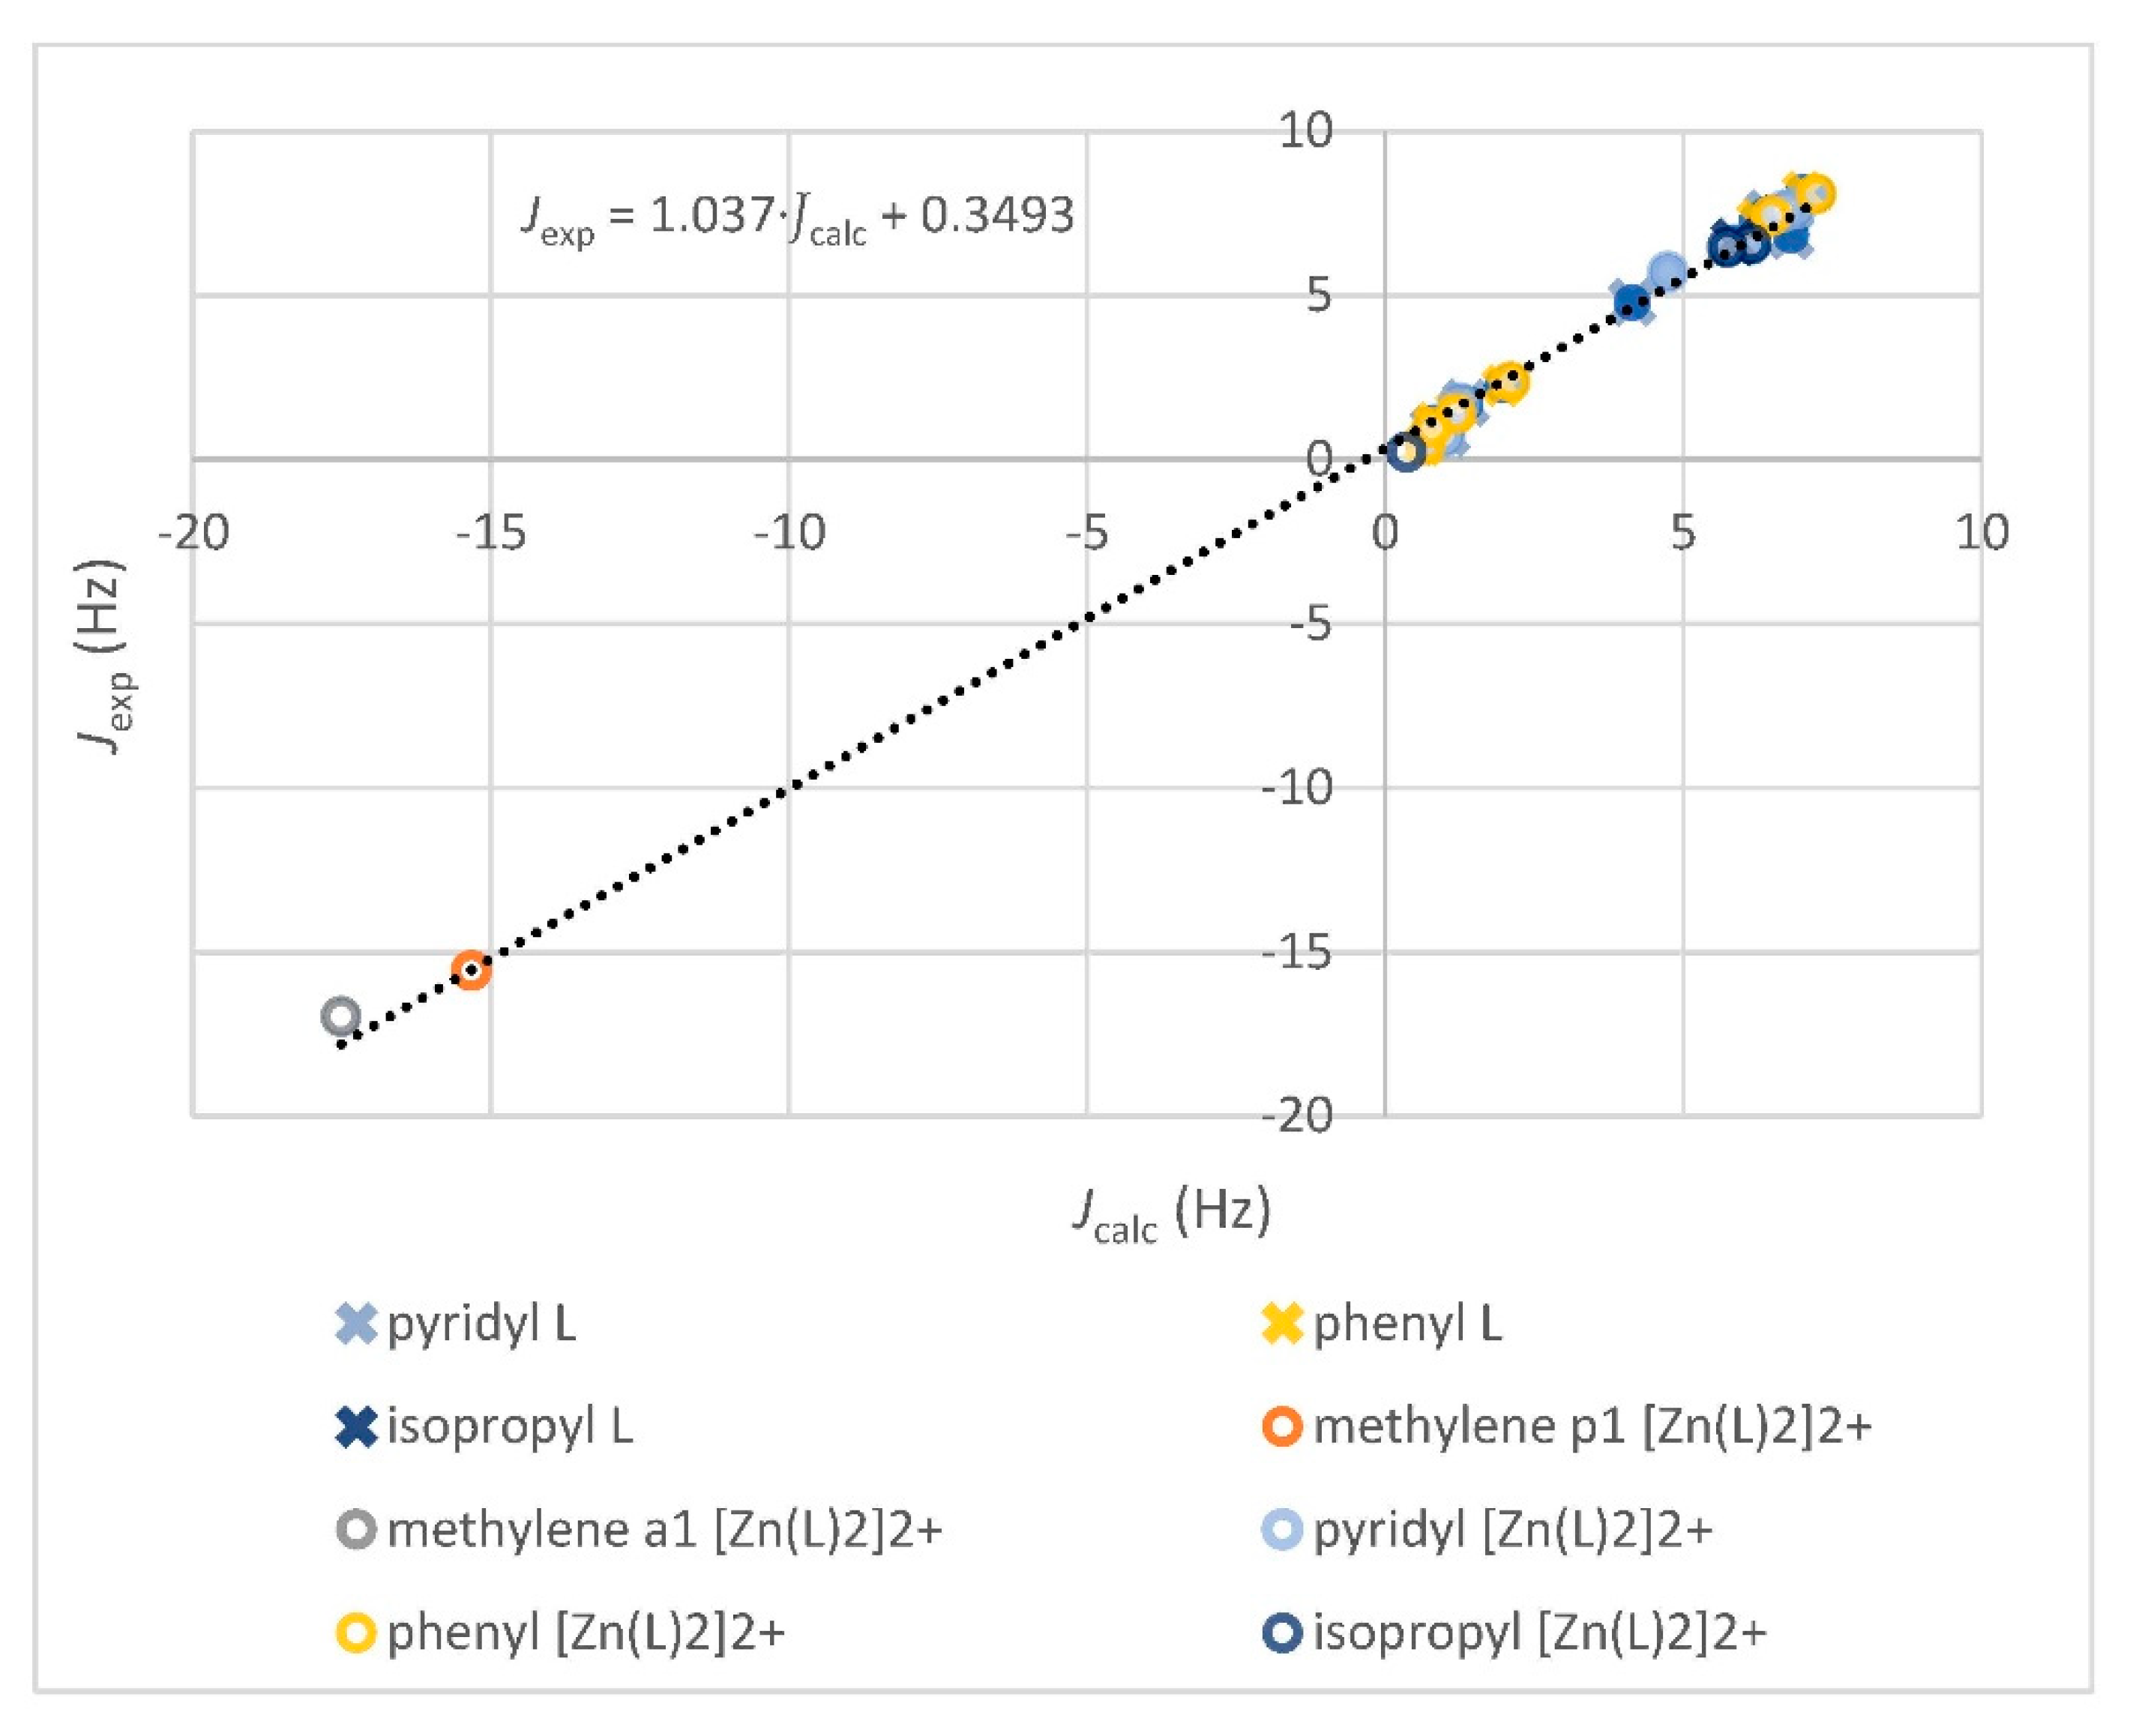
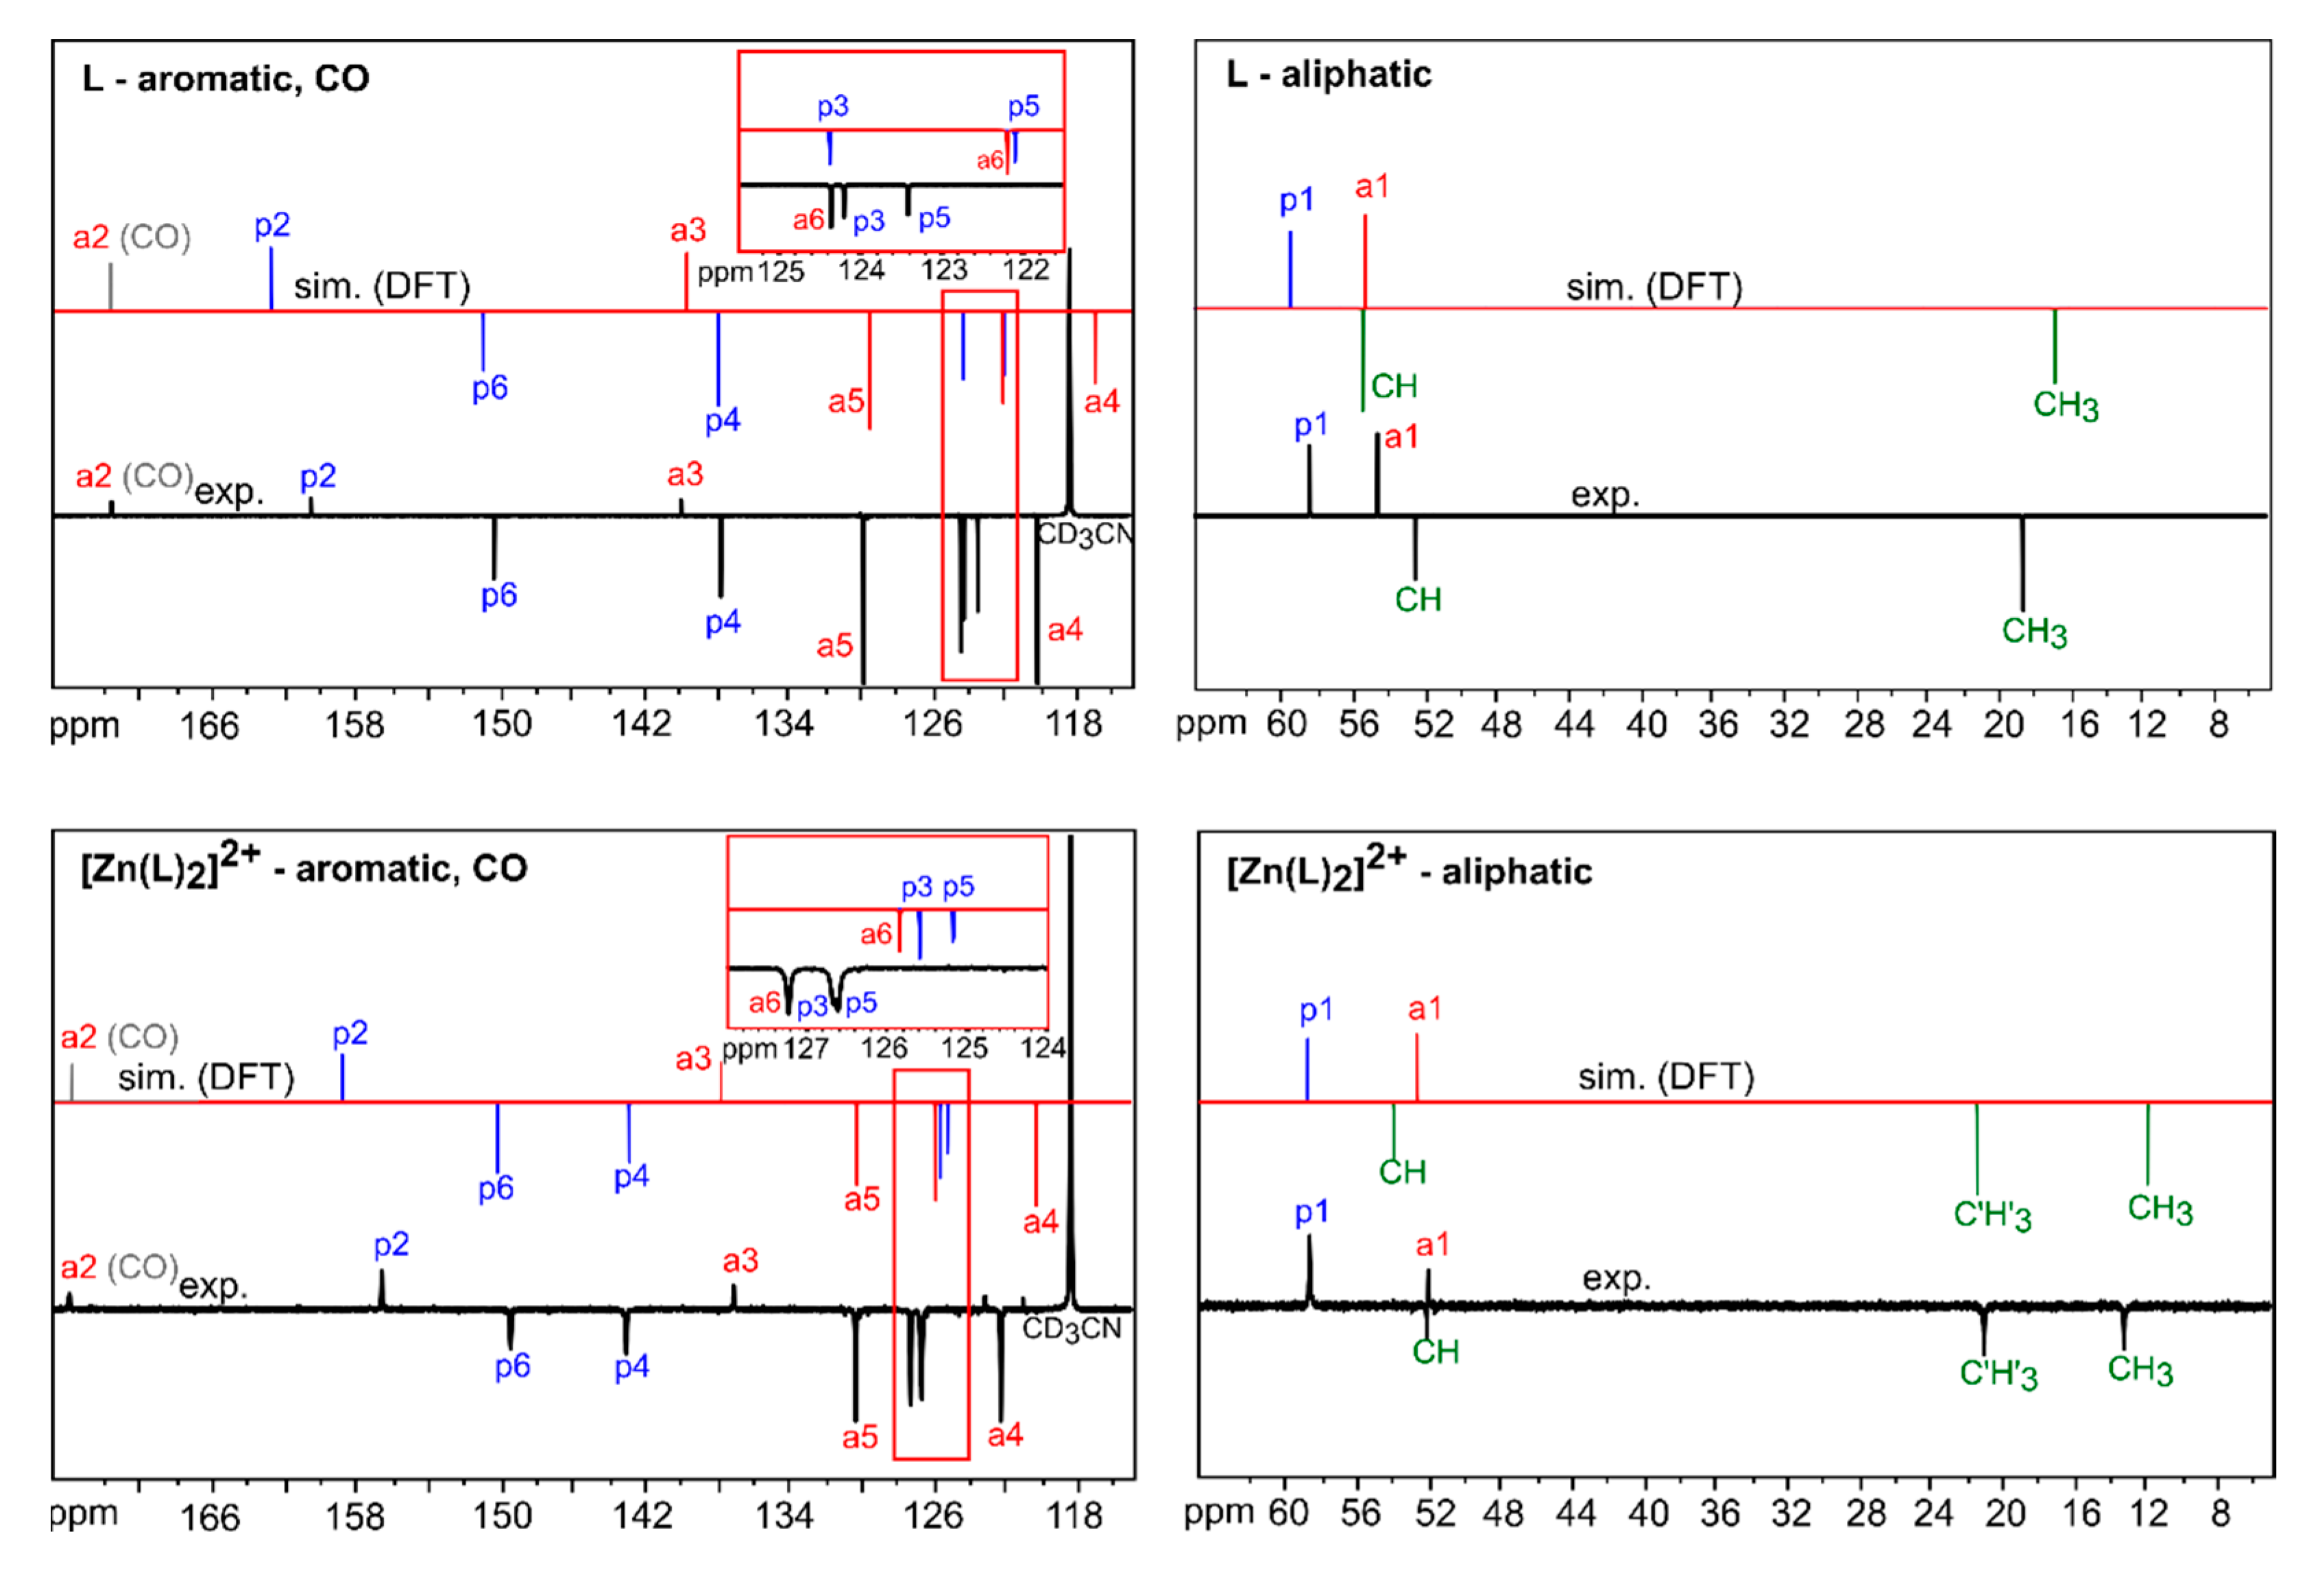
3.2.1. Comparison of Experimental and Simulated NMR Spectra

Experimental and simulated 1H NMR spectra of ligand L and complex [Zn(L)2]2+ in specific regions (aromatic and aliphatic) are given in Figure 1. Complete spectra of L and [Zn(L)2]2+ are given in Figures S6 and S10 (−40 °C), and Figure S14 (room temperature) of Supplementary material. The 1H NMR spectrum of [Zn(L)2)]2+ was recorded at −40 °C to gain better resolution. The spectra were similar for the two species; however, the most important difference was a larger number of signals for [Zn(L)2)]2+ in the aliphatic region. The signals of two magnetically equivalent 1H nuclei of methylene CH2 groups p1 and a1 in L became inequivalent in [Zn(L)2)]2+ and geminal J coupling between them became visible, generating four doublets. Additionally, magnetic equivalency of the six 1H nuclei from both methyl groups in L were divided into two sets of three mutually equivalent 1H nuclei in [Zn(L)2)]2+, generating two doublets (Figure 1, green lines in aliphatic region for [Zn(L)2)]2+). Doublets for methyl groups were formed by vicinal J couplings of the methyl 1H nuclei with tertiary isopropyl 1H nuclei (CH), generating a septet appearing around 3 ppm in both spectra (CH signal). Two methyl 13C nuclei in the isopropyl group of L were magnetically equivalent, generating only one signal in the 13C spectrum (Figure 2, aliphatic region of L); however, in the 13C spectrum of [Zn(L)2)]2+ they were not equivalent (Figure 2, aliphatic region of [Zn(L)2)]2+).
Magnetic equivalency of the NMR active nuclei could have arose from the symmetry of the molecule or from the fast motions that can exchange nuclei positions. Exchanges faster than characteristic spectral timescales of the spectrometer caused averaging of the NMR parameters [30]. Thus, from the experimental 1H and 13C spectra only, it is evident that motions which can exchange two 1H nuclei in the methylene CH2 groups were fast enough for L, but not for [Zn(L)2)]2+, i.e., the coordination to Zn2+ ion inhibited these motions. In addition, the rotations of the isopropyl groups around the N-CH bond appeared to be limited by coordination to the Zn2+ ion. It should be mentioned that there were two ligands in the [Zn(L)2)]2+ complex, but only one set of peaks in both NMR spectra (1H and 13C), indicating equivalence of the two ligands. This suggested a symmetric structure of the [Zn(L)2)]2+ complex in liquid state.
For both compounds, complete 1H signals (C-H) were simulated by defining five spin systems: pyridyl, phenyl, two methylene (p1 and a1), and isopropyl. Observed parameters of these spin systems, determined by their fitting to the experimental spectra, and calculated parameters (Boltzmann weighted parameters), are given in Table 2. Simulated 1H NMR spectra of these spin systems are given in Figure 1 (top lines). Observed and calculated shifts for 13C nuclei are given in Table 3 and simulated 13C NMR spectra for both compounds are given in Figure 2. Regression calculations defining linear relations between DFT calculated shifts and shieldings [Equation (5)] are given in Figure 3a–d. In this work we did not assume that coefficients A and B should be general parameters applicable to other substances/measurements. They depended on many other factors, such as theory level of the calculations (DFT) or inclusion of the rotational/vibrational corrections [31]. In order to examine, as much as possible, the agreement of the structural model with the experimentally observed shifts (i.e., to examine the structural quality), we treated these coefficients in the same sense as the scale factor K in the crystallographic R factor was treated in Equation (2), i.e., their role was just to fit calculated parameters (shieldings) on the same scale of the observed parameters (shifts) and we assumed that they could be different for different structural models, different calculation theory levels, and so on. For this reason, the linear regression coefficients were separately calculated for each conformer (i.e., for each structural model) of L and [Zn(L)2]2+ (Figures S29–S41 of Supplementary material) and additionally, for ensembles of L or [Zn(L)2]2+, by calculation of Boltzmann weighted 1H or 13C shieldings (Figure 3). As a consequence, MAE(conf) values calculated by Equation (1) became more sensitive to the quality of the structural model of conformers, but according to the idea that liquid samples should contain the Boltzmann weighted ensemble of conformers, we expected that the best fit (i.e., the lowest MAE) should be obtained using linear regression calculation between Boltzmann weighted and observed parameters. These MAE(Boltz) values for shifts are given in Figure 3. The same correlation analysis, individual for each conformer, was performed for calculated and observed 1H-1H J couplings and is shown in Figures S42–S54 of Supplementary material. However, because the DFT calculations directly provided these parameters, without the necessity to transform them on the scale of observed values, we did not use the linear regression coefficients for obtaining calculated J couplings (or some kind of “improved” couplings). Values obtained directly from DFT calculations (averaged according to definitions in Figure S27 and S28 of Supplementary Material) are listed in Table 2. In this respect, Figure 4 represents the overall agreement between calculated and observed 1H-1H J couplings for both compounds. It was visible that small values of long-range J couplings fit well with general correlation.
In both compounds and for both type of NMR spectra the agreement between calculated and observed parameters was very good and led to simulations very close to the observed spectra (Figure 1 and Figure 2). In the aliphatic region of the 1H spectra in both compounds, the ordering of calculated shifts corresponded with ordering of the observed shifts. For 13C in the aliphatic region, a small discrepancy in ordering of a4 and CH signals for L was observed. Individual ordering of pyridyl and phenyl signals was also very good, except for the reverse ordering of p4 and p6 signals in the pyridine system of [Zn(L)2]2+ (Figure 1), but, by comparing phenyl and pyridyl systems, we can see that theory predicted 1H signals p4 and p5 of L to be at lower frequencies than signals a4 and a6, respectively. However, in the experimental spectrum the ordering of these signals was reversed. Additionally, the 1H signal of p5 for [Zn(L)2]2+ should have been at lower frequencies than 1H signals a4 and a5, but in the experimental spectrum they were shifted to higher frequencies than a4 and a5 (Figure 1). Reverse ordering was also observed for 13C signals p3 and a6 in 13C spectrum of L (Figure 2). Despite these changes the overall agreement was good, the largest individual absolute error was observed for 1H signal of p5 in L (0.21 ppm, Figure 1) and for 13C signal of a4 in L (3.04 ppm, Figure 2), for [Zn(L)2]2+ data the agreement was even better. If geometry optimizations on r2SCAN-3c//def2-mTZVPP level of DFT theory [17] (as used in this work) give correct geometries of conformers, and if the free energies are correctly calculated within a good completeness of the conformer ensemble, then the discrepancies observed should be addressed to the deficiency of the DFT theory level by which the shieldings were calculated and to negligence of the rotational/vibrational corrections.

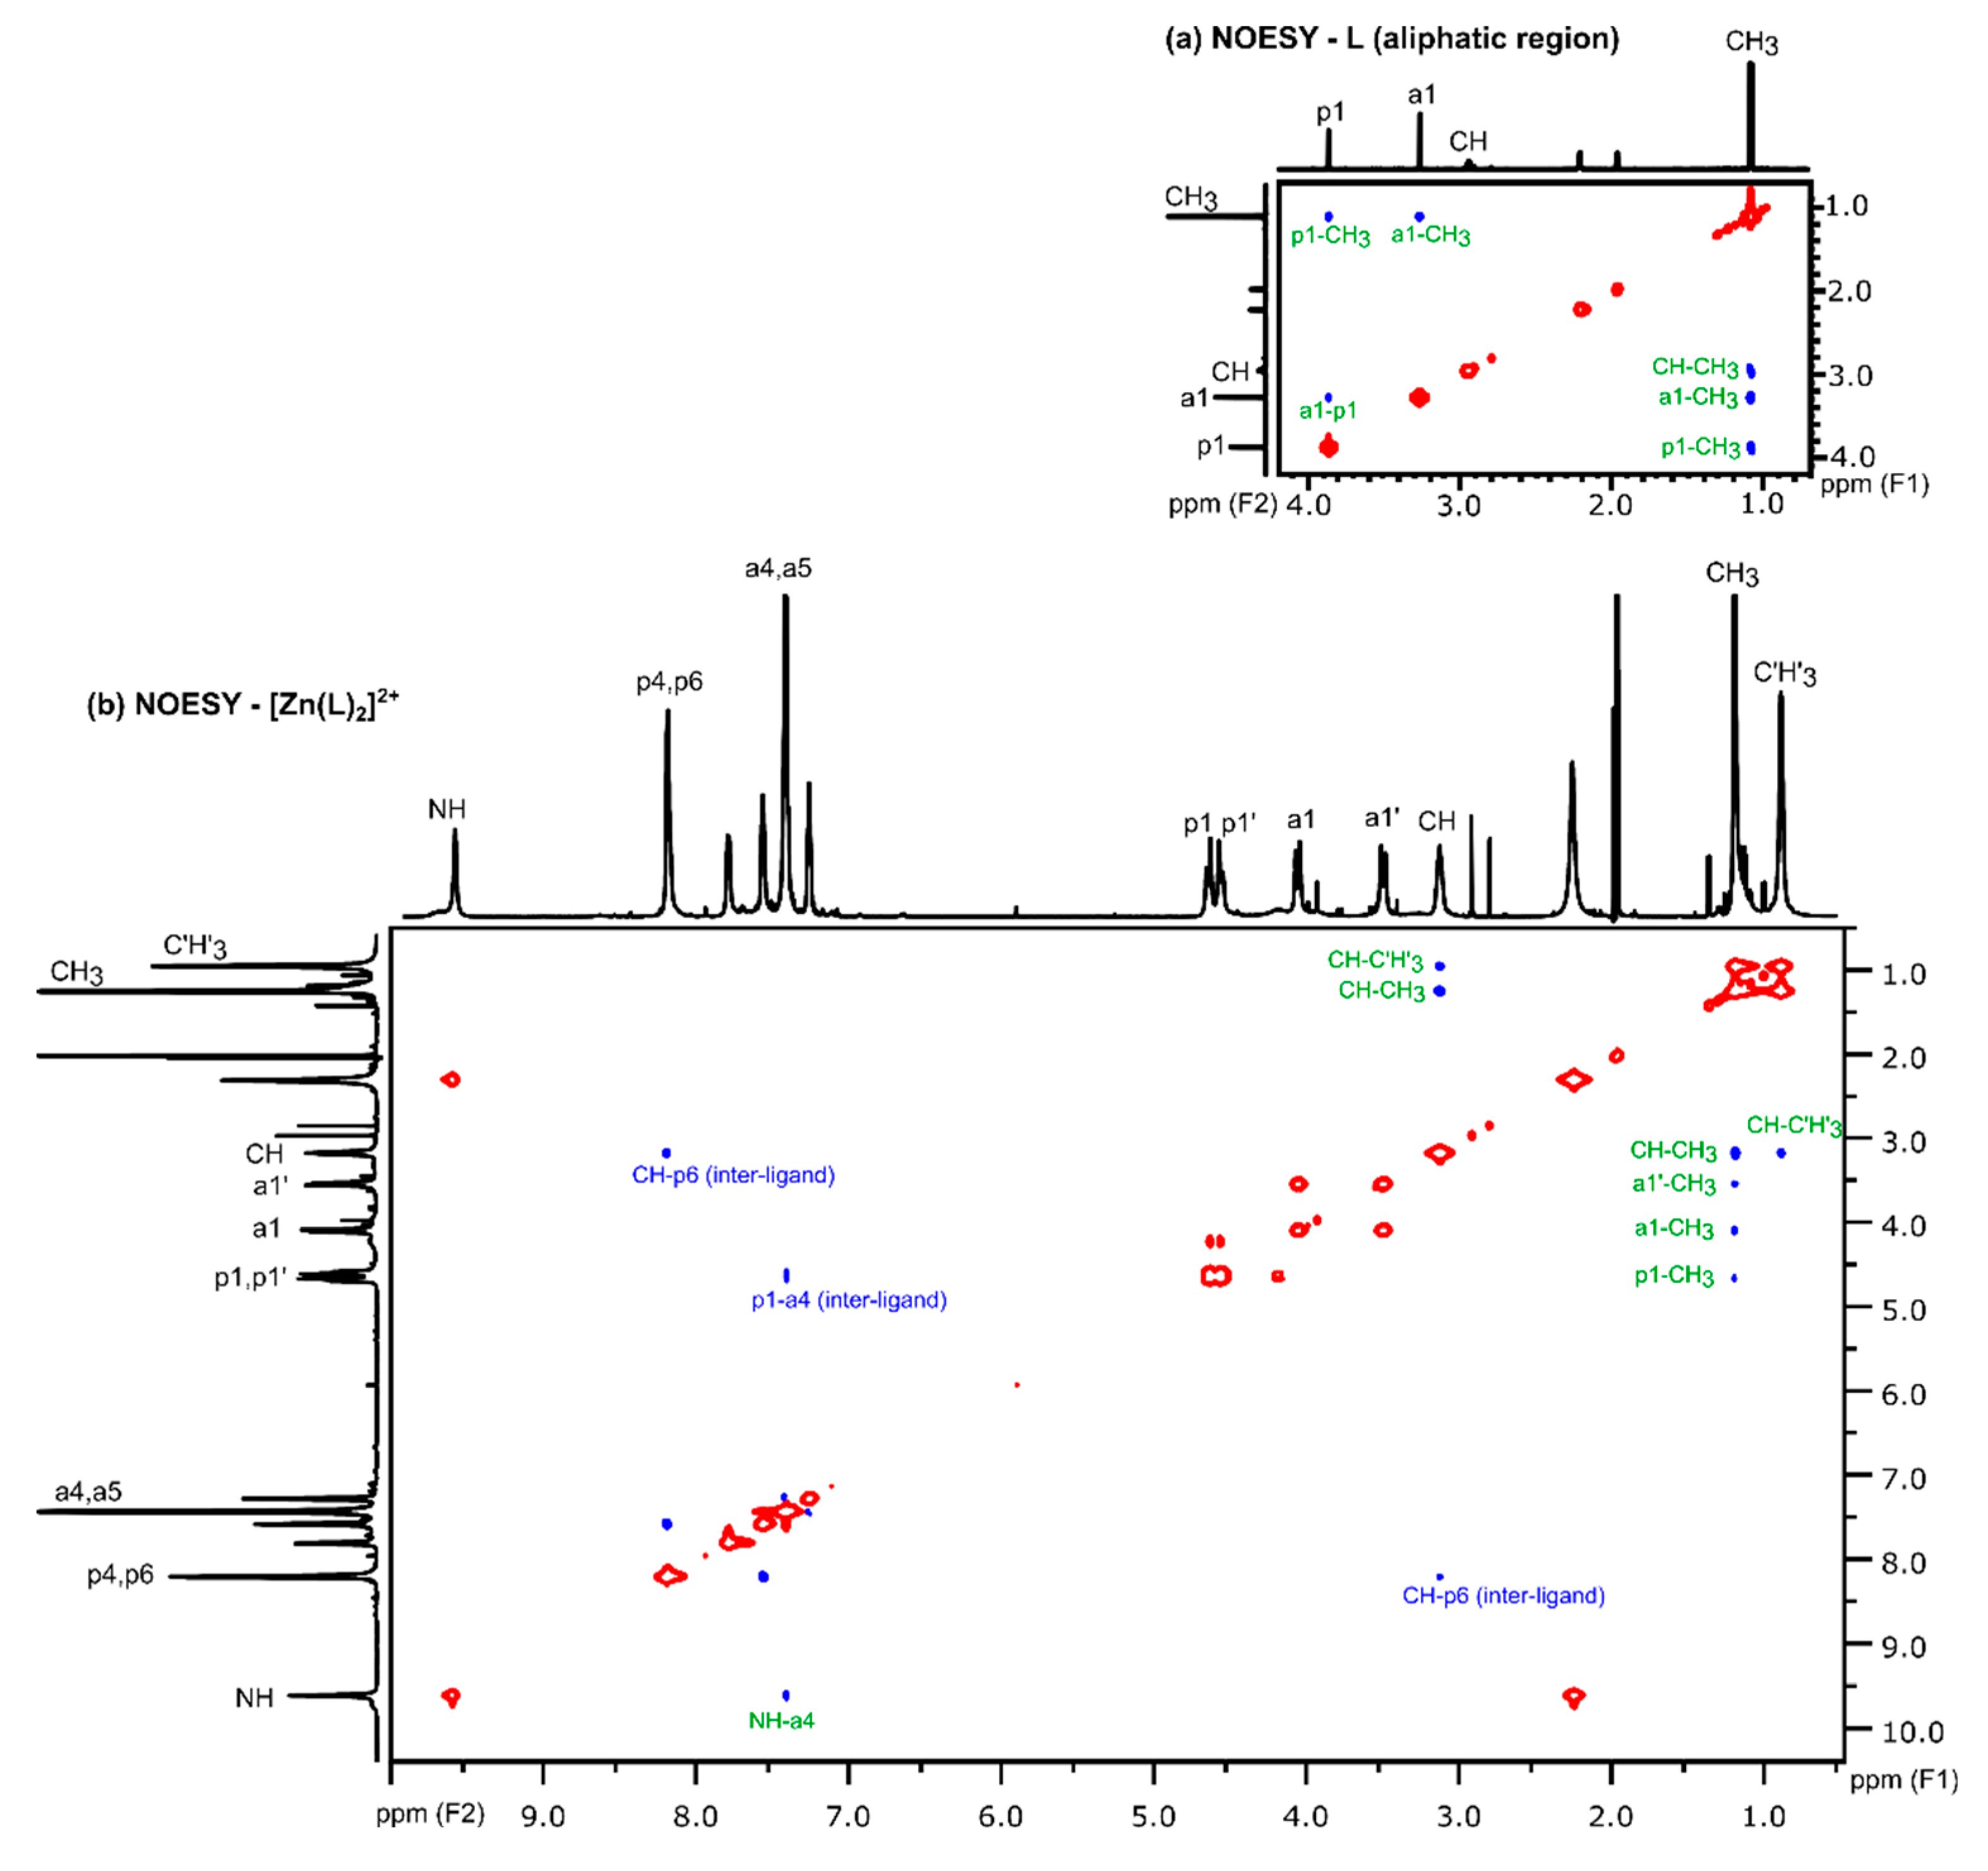
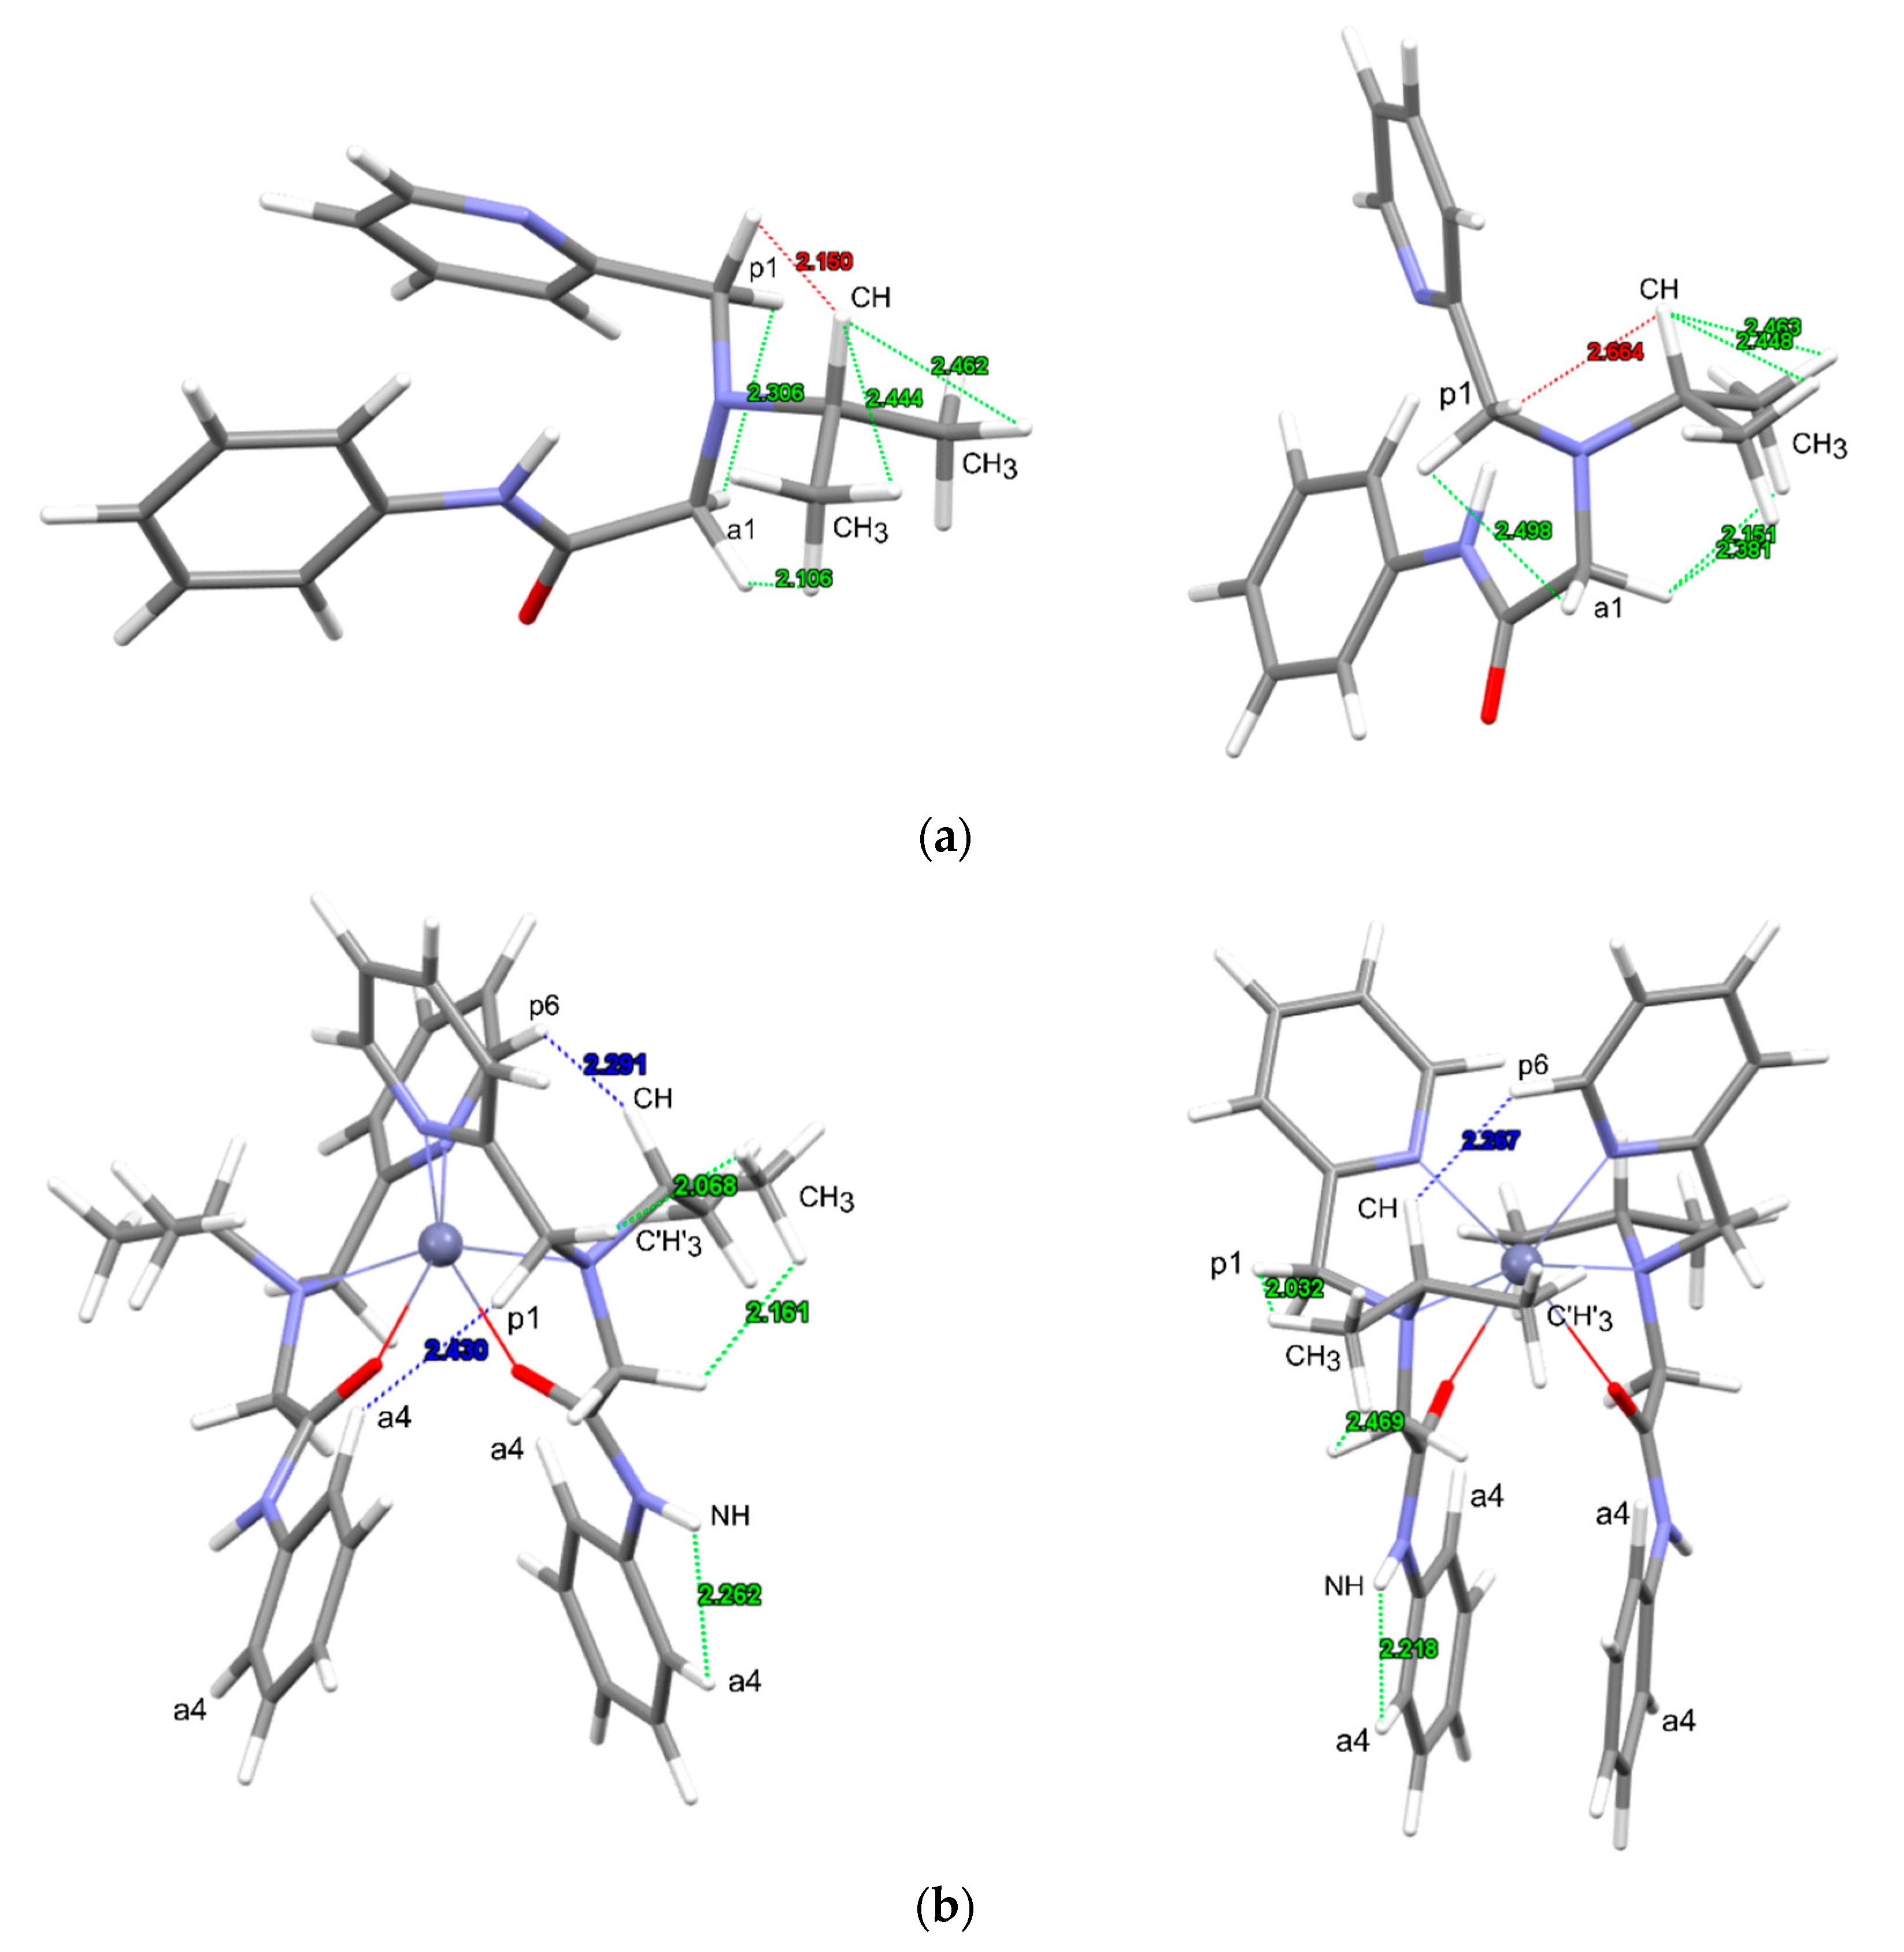
3.2.2. Analysis of NOESY Spectra

The prerequisite for calculating NMR parameters by DFT methods is a structural 3D model of the molecule of interest. In liquid state it is assumed that the whole ensemble of 3D structural models is present in the sample. One of the NMR techniques which gives useful information about spatial arrangement of the nuclei which are in close spatial proximity is the NOESY technique [30]. The NOESY spectrum of L (only the aliphatic region is shown in Figure 5a, the full NOESY spectrum of L is given in Figure S26 of Supplementary material) and NOESY spectrum of [Zn(L)2]2+ is given in Figure 5b. The two lowest energy-lying conformers/isomers of L or [Zn(L)2]2+, with emphasized several short contacts among 1H nuclei, are shown in Figure 6a,b. These contacts could explain the cross-peaks of the appropriate NOESY spectra. One of the closest 1H-1H distances, characteristic for conformer 1 of L was the distance between one of the p1 methylene 1H nuclei and CH- isopropyl 1H nuclei, emphasized in red color in Figure 6a, but the corresponding cross-peak in the NOESY spectrum is absent (Figure 5a). The other cross-peaks among isopropyl 1H nuclei and methylene p1 and a1 nuclei exist in the NOESY spectra, meaning that these chemical groups are indeed in close spatial proximity, as they should be, because they are bonded to the same nitrogen atom. For the L conformer 2, with free energy almost identical to the free energy of conformer 1, (Figure S30 of Supplementary Material), the p1 methylene and CH isopropyl 1H nuclei were separated further than the rest of the pairs formed by methylene and isopropyl 1H nuclei, so we expected that the appropriate NOESY signal should be weaker than those already existing. Although the molecule of L was flexible (otherwise the chemical/magnetic equivalency of p1, a1 and CH3 1H nuclei would not be present), and, although the NMR spectra of L should not be associated to a single conformer, the spatial arrangement of 1H nuclei in conformer 2 gave a better explanation for the observed NOESY spectrum.
From the NOESY spectrum of [Zn(L)2]2+, we can observe the following information: first, we can see that cross-peaks between methylene 1H nuclei and 1H nuclei from only one of the methyl groups (CH3) were observed. This is in accordance with both of the conformers given in Figure 6b, as the orientation of isopropyl group was “locked” when the ligand was coordinated to the metal, and the second methyl group (C’H’3) was further away. Second, the cross-peak involving amino hydrogen 1H nuclei (N-H group) was observed with 1H nuclei from the aromatic group, probably with a4, because of the small spatial distance between these two nuclei. Because this is an intra-ligand interaction, it could have been present in the NOESY spectrum of L, but it was absent (Figure S46 of Supplementary Material), probably due to higher flexibility of ligand molecules when they were not coordinated to the metal atom. The most informative new cross-peaks in the spectrum of [Zn(L)2]2+ were those appearing among the peaks of aliphatic and aromatic regions, because they could be interpreted as inter-ligand interactions, i.e., interactions between two ligands in the [Zn(L)2]2+ complex. In close proximity with the 1H nuclei from the isopropyl C-H group, was the p6 1H nuclei from the second ligand, and this was a feature of both conformers/isomers given in Figure 6b. However, there was also a cross-peak that could be interpreted as interaction of p4 1H nuclei from one ligand with a4 1H nuclei from the second ligand and, additionally, close distance between these two groups existed only for the more stable mer- isomer and not for the trans-fac-1 isomer.

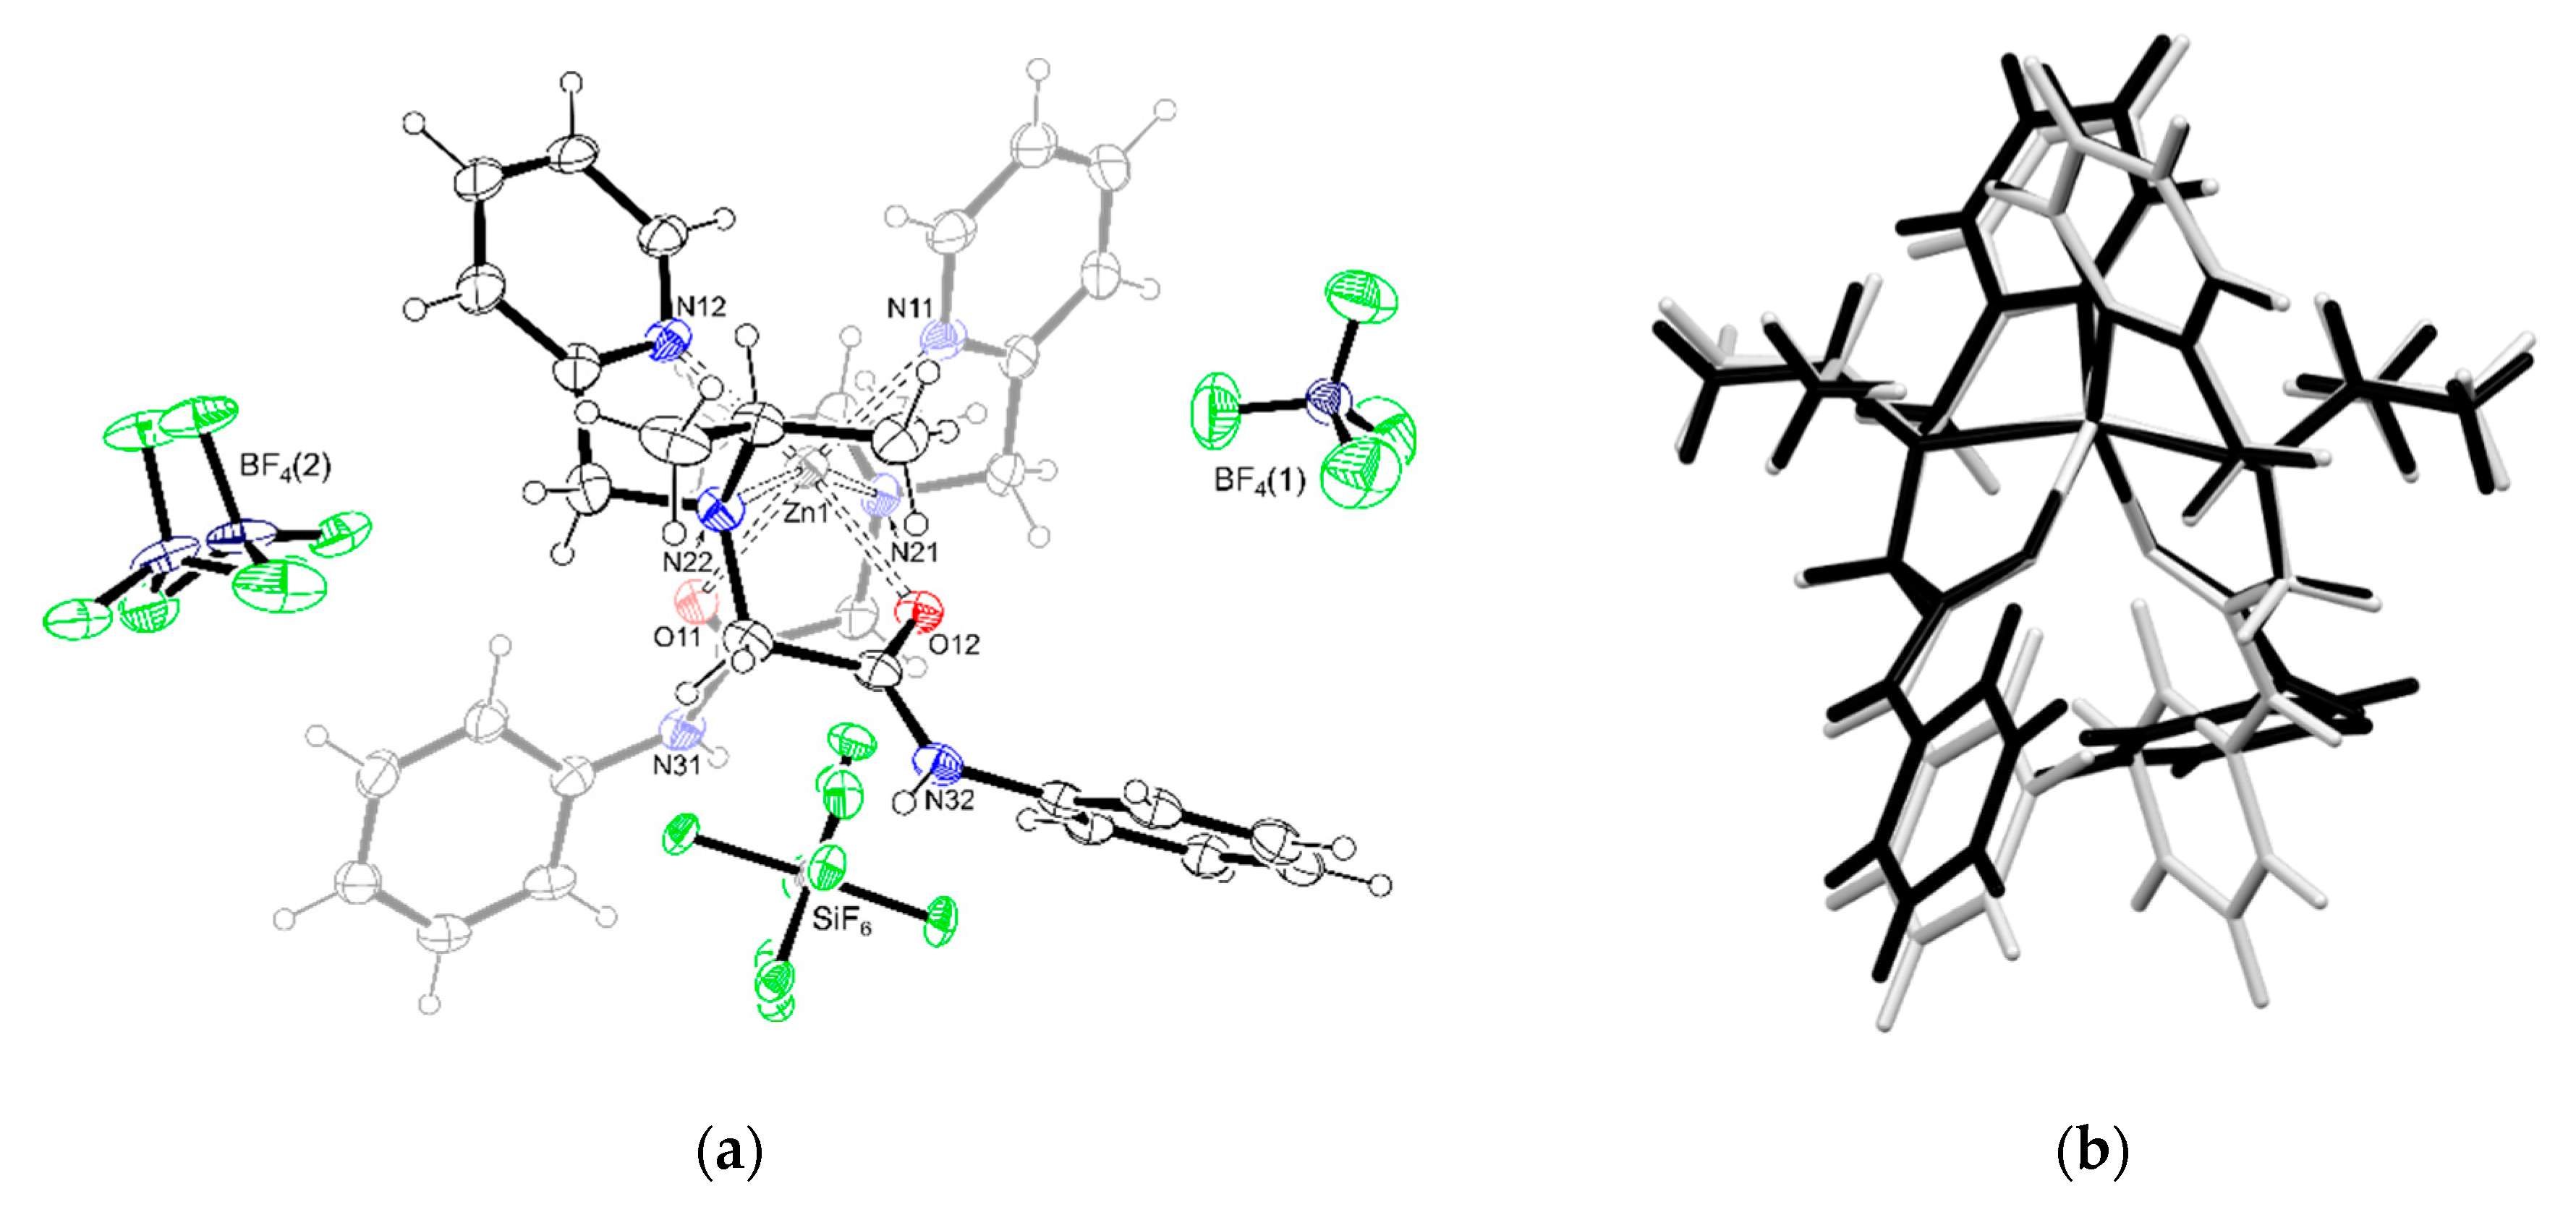
3.3. Crystal Structure of [Zn(L)2]2][SiF6][BF4]2

Crystals of [Zn(L)2]2][SiF6][BF4]2 were obtained from a mixture of methanol solutions of ligand L and Zn(BF4)2·H2O. The ORTEP-III [32] diagram of [Zn(L)2]2][SiF6][BF4]2, is presented in Figure 7a; a complete labelling scheme is given in Figure S55 of Supplementary Material. The structure contained the [Zn(L)2]2+ cation located at a general crystallographic position and the [SiF6]2− anion, located at the crystallographic two-fold symmetry axis. The axis passed only through the central Si atom, in the equatorial plane of the SiF6 octahedron, causing some fluorine atoms to be disordered over two orientations (see Section 2.3). In the structure, two types of [BF4] anions can also be recognized, one was located at the crystallographic three-fold symmetry axis passing through one of the B-F bonds (internal three-fold symmetry of the [BF4] anion), so this anion was not disordered [BF4(1) anion in Figure 7a]. The other [BF4] anion [BF4(2) in Figure 7a] was located near the crystallographic two-fold symmetry and it was disordered over two orientations. The high symmetry cubic space group P n 3 ¯ n (No. 222) with unit cell parameter a = 37.0820 (3) Å (Table 1) led to a large unit cell of volume V = 50990.5(12) Å3 containing 48 [Zn(L)2]2+ cations, 24 [SiF6]2− anions 16 [BF4] anions of type 1 and 24 [BF4] anions of type 2. For crystallographic packing pattern see Figure S56 of Supplementary Material. Interestingly, the structure still contained two large solvent accessible areas (Figure S56), most probably occupied by solvent molecules and additional 8 [BF4] anions. The electron density in the regions of the unit cell occupied by the [Zn(L)2]2+ cations was represented with high precision (the amide nitrogen atoms were recognized from difference electron density maps), thus it provided a reliable structural model of the cation.
The structural model of the [Zn(L)2]2+ cation from the crystallographic analysis coincided very nicely with the structural model of the most stable mer- isomer of the [Zn(L)2]2+ cation obtained from the procedure for calculation of NMR parameters (Figure 6b, left). The overlap of the two structures is presented in Figure 7b and comparison of characteristic structural data (bonds, selected bond and torsion angles) is given in Tables S1 and S2 of Supplementary Material. The largest deviation was observed for the orientation of one of the phenyl rings (torsion angle C82-N32-C92-C102, see Table S2 of Supplementary material), which broke the C2 symmetry of the NMR-solution model into the non-symmetrical model observed in the solid state. The explanation for such a deviation is probably in the specific intermolecular interactions which existed in the solid state, for example, the N-H···F hydrogen bonds between amide hydrogens from coordinated ligands and nearby [SiF6]2− anions located between neighboring [Zn(L)2]2+ cations (Figure S57 and Table S3 of Supplementary Material).

4. Discussion

Herein, the procedure for calculating NMR parameters (1H and 13C shifts, 1H-1H J couplings) and comparing them with the observed data on one organic molecule (ligand) and one complex cation where two such ligands are coordinated to the Zn2+ cation was tested. Because the calculation of NMR parameters was based on the DFT-GIAO calculation methods, for which the 3D structural model is prerequisite, the procedure can be considered as one form of a structural determination method. Measurable physical quantities, (chemical shifts and J couplings) were compared with computed values for different 3D models of a molecule. The comparison of the computed and calculated values resembled the classical crystallographic X-ray diffraction method, which is (in the vast majority of its usage) fitting of calculated structure factors to observed structure factors for a large number of measured reflections (the refinement procedure). In X-ray crystallography, the fitting is achieved by optimization of the molecules structure parameters, more precisely, by optimization of positions of the atoms in the crystallographic unit cell. Although a method for structural refinement against the experimental solid-state 13C chemical shifts has been proposed in the previous literature [33,34], it cannot be used within DFT-GIAO calculations, because, to the best of our knowledge, the necessary analytical gradients for DFT-GIAO calculated shifts or couplings (with respect to the nuclei coordinates) are not yet devolved; the proposed refinement method of Sternberg et al. is based on the semi-empirical Bond Polarization Theory [34,35].
As the DFT-GIAO calculation method is widely used, providing respectable results not only for 13C shifts, but also for 1H shifts and J couplings (Figure 3 and Figure 4), we calculated these NMR parameters on a set of geometry optimized structures using the energy criteria and recommendations from Grimme et al. [16,17], and compared their quality by the literature proposed error function MAE [1]. The results are presented in Figure 8. Therefore, the structural quality of the conformers of L or [Zn(L)2]2+ were mainly limited by the quality of the r2SCAN-3c//def2-mTZVPP level of DFT theory [17] and their free-energy values were limited by the quality of computational theory levels of each of the free-energy components that were calculated (electron energy, mRHHO contribution and solvation contribution). Perhaps the most important limitation defining the quality of the calculated NMR parameters was the quality of the DFT theory level by which these parameters were calculated (PBE0-d4/def2-TZVP level, see Section 2.2.3). Having in mind all these possible sources of errors in calculation, Figure 8 suggests that the most likely structurally correct models of L or [Zn(L)2]2+ have MAE(conf) values below cca 0.1 ppm for 1H and below cca 1 ppm for 13C shifts. As such small values were also obtained for Boltzmann weighted ensembles of L or [Zn(L)2]2+ (Figure 3), we can conclude that these numbers are the limitations of theory levels used in computation. For complex [Zn(L)2]2+, for which three low-lying energy conformers were obtained during generation of conformer ensembles (steps 1 and 2 of the computational procedure, see Section 2.2.2 and Section 2.2.3), the conformer with the lowest MAE(conf) value was the expected mer- C2 symmetric isomer, also in agreement with the 2D NOESY NMR measurement and with X-ray crystallography. On the other hand, for the more flexible ligand L, we obtained better MAE(conf) agreements with a conformer that was not ranged as the most stable one, but for one with almost identical calculated free energy value (conformer 2). The MAE(conf) values for this conformer were even lower than for the Boltzmann averaged values [MAE(Boltz], Figure 3). It is hard to rationalize whether this deviation came from limitations of the free-energy or of the NMR properties calculation procedures (DFT theory levels).
For a successful comparison with experimental values obtained from liquid-state NMR measurements it was mandatory that averaging of the calculated NMR parameters for fast-exchanging nuclei was performed. This comes from the nature of the NMR experiment, where rather long spectral timescales of the spectrometer [30] make the identification of the unique atoms (nuclei) in a molecule difficult, in contrast to X-ray diffraction, where the solid-state nature of the sample restricts the molecule in a specific geometry arrangement during the whole measurement time. Because conformers can also change from one form into another very fast, we can always expect a set of conformers from the presented liquid-state DFT-NMR structural determination procedure. In contrast, the structures of molecules obtained from X-ray crystallography are always under influence of interactions with neighboring molecules or other parts of the crystalline phase (like [SiF6]2− anions in the crystal structure presented in this work), so the geometry of molecules obtained from the X-ray crystallography method does not have to be the same as the one existing in the solution phase. Transitions between two isomers of the same compound are expected to be less favorable than transitions between two conformers or rotamers, and separate signals of two isomers can be obtained in liquid-state NMR spectroscopy. Indeed, in our previous work we observed distinct Z and E isomers of one organic compound in liquid 1H and 13C NMR spectra [36]. In that work, a similar calculation procedure was used and experimental observation of two set of signals agreed with the observation in calculation procedure that transitions between E and Z isomers were not detected during meta-dynamics runs used for the generation of an ensemble of conformers. On the other hand, during meta-dynamics runs used for the generation of an ensemble of [Zn(L)2]2+ conformers in this work, transitions between different isomers were observed. Using an energy window of 6 kcal/mol, above which all conformers with higher energy were rejected for usage in next-step calculations (free-energy refinement, NMR properties calculations), we obtained only three conformers (two isomers) of [Zn(L)2]2+: two mer- and one trans-fac-1. Thus, we suppose that other possible isomer types for [Zn(L)2]2+ (Scheme 2) lay in the energy scale so high that they were not populated at the temperatures used in the measurements (253 and 293 K), so their NMR properties were not calculated. The trans-fac-1 isomer (Figure 6b, left) was included in the calculation of Boltzmann weighted NMR properties, and we obtained slightly better MAE(conf) values than for the single conformer 1 of the mer- isomer (Figure 3 vs. Figure S39 from Supplementary material). The rate of transitions between two isomer types depends on the energy barrier between the minima of the two isomers and this condition should be connected with the number of signals in the NMR spectra (separate signals for each isomer or one averaged signal). In this work we assumed the second case, i.e., that transitions between mer- and trans-fac-1 were fast enough on the NMR timescale. Further investigations using calculations of the energy barrier and possible variable-temperature NMR measurements are planned for future research.

5. Conclusions

This paper presents a DFT-NMR procedure [1,8] from which an ensemble of structural models can be obtained and a quality comparison procedure among calculated and solution-state experimental NMR data. The quality comparison was achieved by definition of a MAE(conf) parameter (Mean Absolute Error) which had an analogous role as the R parameter in traditional X-ray diffraction structural determination procedures. It is demonstrated that, according to the DFT theory levels used in this work, the MAE(conf) values for correct structural models of molecules or complexes were cca 0.1 ppm for 1H and cca 1 ppm for 13C shifts. The calculated J couplings also coincided well with values obtained from the experiment. The procedure was used for the determination of candidate structural models for one asymmetric tridentate ligand L, having acetamide and pyridine groups on each side of the central amino- nitrogen atom, and one complex formed with the Zn2+ cation ([Zn(L)2]2+). Experimentally observed cancellation of the magnetic equivalence of some nuclei valid for free L, when it was coordinated to the Zn2+ cation, is theoretically explained by the correct averaging of NMR parameters in the calculation procedure. The structure of the [Zn(L)2]2+ cation obtained from NMR data by the proposed method and structure obtained by single-crystal X-ray diffraction method matched remarkably well.

Supplementary Materials

The following supporting information can be downloaded at: https://www.mdpi.com/article/10.3390/cryst13010016/s1, Figures S1–S5: analysis of isomers; Figures S6–S26: NMR spectroscopy, Figures S27–S54: DFT calculations; Figures S55–S57 and Tables S1–S3: X-ray crystallography; Figures S58–S61: additional characterizations. L_conformers.xyz and ZnL2_conformers,xyz: DFT structures of ligand and complex conformers in the XYZ Cartesian coordinates format.

Author Contributions

Conceptualization, B.P.; methodology, B.P., N.P.J. and S.I.K.; validation, B.P., Z.Š., N.P.J. and S.I.K.; formal analysis, B.P. and N.P.J.; investigation, B.P., N.P.J. and S.I.K.; resources, N.P.J. and Z.Š.; data curation, Z.Š.; writing—original draft preparation, B.P.; writing—review and editing, B.P., N.P.J., Z.Š. and S.I.K.; visualization, B.P. and N.P.J.; project administration, S.I.K.; funding acquisition, S.I.K. All authors have read and agreed to the published version of the manuscript.

Funding

This work was partially supported by Minimal Artificial Enzymes (IP-2014-09-1461), a project financed by the Croatian Science Foundation.

Data Availability Statement

Data is contained within the article or Supplementary Material.

Acknowledgments

The computations were performed using the resources of the computer cluster Isabella based in the University Computing centre SRCE—University of Zagreb.

Conflicts of Interest

The authors declare no conflict of interest.

References

  1. Willoughby, P.H.; Jansma, M.J.; Hoye, T.R. A guide to small-molecule structure assignment through computation of (1H and 13C) NMR chemical shifts. Nat. Protoc. 2014, 9, 643–660. [Google Scholar] [CrossRef] [PubMed]
  2. Viterbo, D. Solution and refinement of crystal structures. In Fundamentals of Crystallography, 2nd ed.; Giacovazzo, C., Ed.; Oxford University Press: Oxford, UK, 2002; p. 414. [Google Scholar]
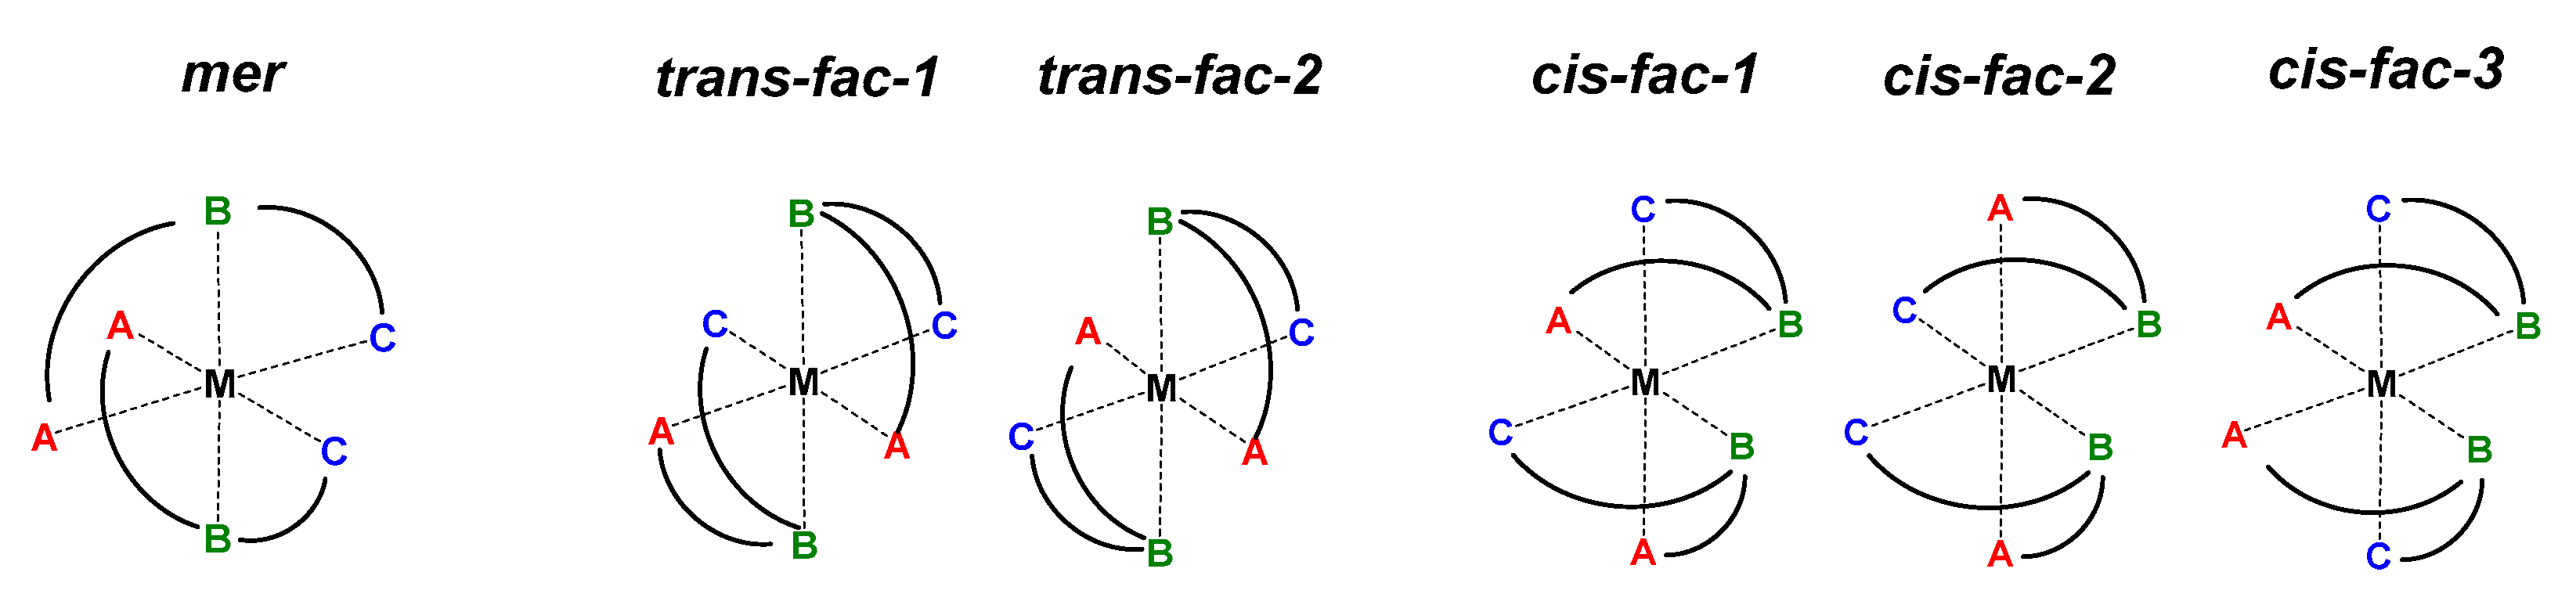
  3. Pantalon Juraj, N.; Kirin, S.I. Inorganic stereochemistry: Geometric isomerism in bis-tridentate ligand. Coord. Chem. Rev. 2021, 445, 214051. [Google Scholar] [CrossRef]
  4. Pantalon Juraj, N.; Krklec, M.; Novosel, T.; Perić, B.; Vianello, R.; Raić-Malić, S.; Kirin, S.I. Copper(II) and zinc(II) complexes of mono- and bis-1,2,3-triazole-substituted heterocyclic ligands. Dalton Trans. 2020, 49, 9002–9015. [Google Scholar] [CrossRef]
  5. Pantalon Juraj, N.; Miletić, G.I.; Perić, B.; Popović, Z.; Smrečki, N.; Vianello, R.; Kirin, S.I. Stereochemistry of Hexacoordinated Zn(II), Cu(II), Ni(II), and Co(II) Complexes with Iminodiacetamide Ligands. Inorg. Chem. 2019, 58, 16445–16457. [Google Scholar] [CrossRef] [PubMed]
  6. Pantalon Juraj, N.; Muratović, S.; Perić, B.; Šijaković Vujičić, N.; Vianello, R.; Žilić, D.; Jagličić, Z.; Kirin, S.I. Structural Variety of Isopropyl-bis(2-picolyl)amine Complexes with Zinc(II) and Copper(II). Cryst. Growth Des. 2020, 20, 2440–2453. [Google Scholar] [CrossRef]
  7. Pantalon Juraj, N.; Tandarić, T.; Tadić, V.; Perić, B.; Moreth, D.; Schatzschneider, U.; Brozovic, A.; Vianello, R.; Kirin, S.I. Tuning the coordination properties of chiral pseudopeptide bis(2-picolyl)amine and iminodiacetamide ligands in Zn(ii) and Cu(ii) complexes. Dalton Trans. 2022, 51, 17008–17021. [Google Scholar] [CrossRef]
  8. Grimme, S.; Bannwarth, C.; Dohm, S.; Hansen, A.; Pisarek, J.; Pracht, P.; Seibert, J.; Neese, F. Fully Automated Quantum-Chemistry-Based Computation of Spin–Spin-Coupled Nuclear Magnetic Resonance Spectra. Angew. Chem. Int. Ed. 2017, 56, 14763–14769. [Google Scholar] [CrossRef]
  9. Pantalon Juraj, N.; Le Pennec, J.; Perić, B.; Kirin, S.I. A Case Study of Supramolecular Organization: One Ferrocene Substituted Iminodiacetamide and Its Chloroform Solvate. Croat. Chem. Acta 2017, 90, 613–623. [Google Scholar]
  10. Fulmer, G.R.; Miller, A.J.M.; Sherden, N.H.; Gottlieb, H.E.; Nudelman, A.; Stoltz, B.M.; Bercaw, J.E.; Goldberg, K.I. NMR Chemical Shifts of Trace Impurities: Common Laboratory Solvents, Organics, and Gases in Deuterated Solvents Relevant to the Organometallic Chemist. Organometallics 2010, 29, 2176–2179. [Google Scholar] [CrossRef] [Green Version]
  11. Martin, J.S.; Quirt, A.R. NMR Spectra of Symmetric Molecules. I. The spin Hamiltonian for Twofold Symmetry. J. Magn. Reson. 1971, 5, 318–327. [Google Scholar]
  12. Neese, F. The ORCA program system. Wiley Interdiscip. Rev. Comput. Mol. Sci. 2012, 2, 73–78. [Google Scholar] [CrossRef]
  13. Grimme, S.; Hansen, A.; Ehlert, S.; Mewes, J.-M. r2SCAN-3c: A “Swiss army knife” composite electronic-structure method. J. Chem. Phys. 2021, 154, 064103. [Google Scholar] [CrossRef] [PubMed]
  14. Ditchfield, R. Self-consistent perturbation theory of diamagnetism. Mol. Phys. 1974, 27, 789–807. [Google Scholar] [CrossRef]
  15. Hanwell, M.D.; Curtis, D.E.; Lonie, D.C.; Vandermeersch, T.; Zurek, E.; Hutchison, G.R. Avogadro: An advanced semantic chemical editor, visualization, and analysis platform. J. Cheminform. 2012, 4, 17. [Google Scholar] [CrossRef] [Green Version]
  16. Grimme, S. Exploration of chemical compound, conformer, and reaction space with meta-dynamics simulations based on tight-binding quantum chemical calculations. J. Chem. Theory Comput. 2019, 15, 2847–2862. [Google Scholar] [CrossRef]
  17. Grimme, S.; Bannwarth, C.; Shushkov, P. A Robust and accurate tight-binding quantum chemical method for structures, vibrational frequencies, and noncovalent interactions of large molecular systems parametrized for all spd-block elements (Z = 1–86). J. Chem. Theory Comput. 2017, 13, 1989–2009. [Google Scholar] [CrossRef]
  18. Grimme, S.; Bohle, F.; Hansen, A.; Pracht, P.; Spicher, S.; Stahn, M. Efficient quantum chemical calculation of structure ensembles and free energies for nonrigid molecules. J. Phys. Chem. A 2021, 125, 4039–4054. [Google Scholar] [CrossRef]
  19. Bruker SAINT (v8.40A); Bruker AXS Inc.: Madison, WI, USA, 2019.
  20. Bruker SADABS (v2014/4); Bruker AXS Inc.: Madison, WI, USA, 2014.
  21. Sheldrick, G.M. SHELXT-Integrated space-group and crystal-structure determination. Acta Cryst. A 2015, 71, 3–8. [Google Scholar] [CrossRef] [Green Version]
  22. Sheldrick, G.M. Crystal structure refinement with SHELXL. Acta Cryst. C 2015, 71, 3–8. [Google Scholar] [CrossRef] [Green Version]
  23. Aroyo, M.I.; Perez-Mato, J.M.; Capillas, C.; Kroumova, E.; Ivantchev, S.; Madariaga, G.; Kirov, A.; Wondratschek, H. Bilbao Crystallographic Server I: Databases and crystallographic computing programs. Z. Krist. 2006, 221, 15–27. [Google Scholar] [CrossRef]
  24. Guzei, I.A. An idealized molecular geometry library for refinement of poorly behaved molecular fragments with constraints. J. Appl. Crystallogr. 2014, 47, 806–809. [Google Scholar] [CrossRef]
  25. Spek, A.L. PLATON SQUEEZE: A tool for the calculation of the disordered solvent contribution to the calculated structure factors. Acta Cryst. C 2015, 71, 9–18. [Google Scholar] [CrossRef] [PubMed]
  26. Müller, E.; Bayer, O.; Meerwein, H.; Ziegler, K. Band XI/2–Stickstoffverbindungen II Und III. In Methoden der Organischen Chemie (Houben Weyl), Band XI/2–Stickstoffverbindungen II und III; Georg Thieme Verlag: Stuttgart, Germany, 1958. [Google Scholar]
  27. Wen, Y.; Chen, X.; Wen, H.; Tang, X. Efficient Synthesis of Piperazinediones Using Potassium Iodide Catalysis in Aqueous Media. Lett. Org. Chem. 2011, 8, 732–736. [Google Scholar] [CrossRef]
  28. Saihara, K.; Yoshimura, Y.; Fujimoto, H.; Shimizu, A. Detrimental Effect of Glass Sample Tubes on Investigations of BF4--Based Room Temperature Ionic Liquid-Water Mixtures. J. Mol. Liq. 2016, 219, 493–496. [Google Scholar] [CrossRef]
  29. Casellas, H.; Pevec, A.; Kozlevcar, B.; Gamez, P.; Reedijk, J. An Unprecedented M4-SiF62−- Bridged Supramolecular Polymer Consisting of Bis-μ-F-Bridged Dinuclear Cu(II) Dications. Polyhedron 2005, 24, 1549–1554. [Google Scholar] [CrossRef]
  30. Levitt, M.H. Spin Dynamics: Basis of Nuclear Magnetic Resonance; John Wiley & Sons, Ltd.: Chichester, UK, 2001; pp. 479–511. [Google Scholar]
  31. Ruden, T.A.; Ruud, K. Ro-Vibrational Corrections to NMR Parameters. In Calculation of NMR and EPR Parameters, Theory and Applications; Kaupp, M., Bühl, M., Malkin, V.G., Eds.; WILEY-VCH: Weinheim, Germany, 2004; pp. 153–173. [Google Scholar]
  32. Faruggia, L.J. WinGX and ORTEP for Windows: An update. J. Appl. Cryst. 2012, 45, 849–854. [Google Scholar] [CrossRef]
  33. Sternberg, U.; Witter, R.; Ulrich, A.S. Crystal Structure Refinement Using Chemical Shifts. In Modern Magnetic Resonance; Webb, G.A., Ed.; Springer: Dordrecht, The Netherlands, 2008; pp. 71–78. [Google Scholar]
  34. Jakovkin, I.; Klipfel, M.; Muhle-Goll, C.; Ulrich, A.S.; Luy, B.; Sternberg, U. Rapid calculation of protein chemical shifts using bond polarization theory and its application to protein structure refinement. Phys. Chem. Chem. Phys. 2012, 14, 12263–12276. [Google Scholar] [CrossRef]
  35. Prieß, W.; Sternberg, U. Fast calculation of 13C NMR chemical shift tensors using the bond polarization model. J. Mol. Struct. 2001, 544, 181–190. [Google Scholar] [CrossRef]
  36. Opačak, S.; Perić, B.; Gojšić, T.; Čikoš, A.; Vikić-Topić, D.; Kirin, S.I. Tandem amide coupling and hydroamination: Unexpected benzotriazole oxide addition to the propiolic acid triple bond. New J. Chem. 2022, 46, 13275–13285. [Google Scholar] [CrossRef]
Scheme 1. Ligand L and metal complex cation [Zn(L)2]2+ discussed in this work.
Crystals 13 00016 sch001
Scheme 2. Possible isomers of [M(A-B-C)2] type of metal complexes. A = acetamide oxygen, B = amino- nitrogen and C = pyridine nitrogen.
Crystals 13 00016 sch002
Scheme 3. Synthesis of ligand L. Reaction conditions (a) KI, acetonitrile, microwave 50 W, reflux, 30 min; (b) KI, DIPEA, DMF, microwave 50 W, 100 °C, 1 h.
Crystals 13 00016 sch003
Figure 1. Experimental 1H NMR spectra and simulations with calculated (top lines) or observed (bottom dashed lines) NMR parameters for L and for [Zn(L)2)]2+. Experimental spectra are shown as black full lines overlapped by simulations with observed NMR parameters. In the aromatic region blue and red lines are simulations of pyridyl and phenyl spin systems, respectively. In the aliphatic region blue, red and green lines are simulations of methylene p1, methylene a1 and isopropyl spin systems (Table 2).
Crystals 13 00016 g001
Figure 2. Experimental 13C NMR spectra (black) and simulations using calculated 13C NMR shifts for L and [Zn(L)2)]2+ (Table 3). In the simulated spectra blue lines represents pyridyl and p1 methylene 13C signals, red lines represent phenyl and a1 methylene 13C signals, green lines are 13C isopropyl signals and gray is the carbonyl (CO) 13C signal.
Crystals 13 00016 g002
Figure 3. Correlation diagrams between Boltzmann weighted shieldings (σ) and observed chemical shifts (δo) with linear regression lines used for evaluation of the calculated chemical shifts (δc) by Equation (5) and Mean Absolute Errors [MAE(Boltz)] by Equation (1). Correlations are for 1H in L (a); 1H in [Zn(L)2]2+ (b); 13C in L (c); 13C in [Zn(L)2]2+ (d).
Crystals 13 00016 g003
Figure 4. Correlation between calculated and observed 1H-1H J couplings in both compounds, L and [Zn(L)2]2+ with the linear regression equation. Geminal J couplings are negative and grouped in lower left corner, vicinal are positive and grouped in upper right corner, while long-range J couplings are grouped around zero values.
Crystals 13 00016 g004
Figure 5. 1H NOESY spectrum of L, aliphatic region (a) 1H NOESY spectrum of [Zn(L)2]2+ (b). NOESY signals are blue, due to different phases from the signals on diagonal and from the exchange signals (red). Color of the assignations depends on if they came from intra-ligand contacts (green) or inter-ligand contacts (blue), in accordance with Figure 6.
Crystals 13 00016 g005
Figure 6. Two calculated conformers of L with lowest free energy (1—(left), 2—(right)) (a) Two calculated conformers (i.e., isomers) of [Zn(L)2]2+, with lowest free energy (1—mer- (left), 2—trans-fac-1- (right)) (b) Short spatial 1H-1H contacts used in the interpretation of experimental NOESY spectra are shown in green (intra-ligand) and blue (inter-ligand for [Zn(L)2]2+). The distance between CH and p4 1H nuclei in conformers of L, for which there is no corresponding signal in the NOESY spectrum (Figure 5a) is shown in red.
Crystals 13 00016 g006
Figure 7. The ORTEP-III [32] diagram of [Zn(L)2]2][SiF6][BF4]2 with labeled heteroatoms [Zn(L)2]2+, showing disorder of the [BF4] (2). (a) Overlap between structural model of the most stable mer- conformer of the [Zn(L)2]2+ cation obtained by the DFT-NMR procedure used in this work (white) and conformer of the [Zn(L)2]2+ cation from the crystallographic structure of [Zn(L)2]2][SiF6][BF4]2 (b).
Crystals 13 00016 g007
Figure 8. Comparison of calculated Free Energies (G), Mean Absolute Errors [MAE(conf)] for 1H and 13C calculated shifts from experimental shifts, respectively, for conformers of L (a) and [Zn(L)2]2+ (b).
Crystals 13 00016 g008
Table 1. Experimental data for the X-ray diffraction analysis.
Formula[Zn(L)2]2][SiF6][BrF4]2
Fw (g mol−1)1579.92
Crystal systemcubic
Space group P n 3 ¯ n (No. 222)
a (Å)37.0820(3)
b (Å)37.0820(3)
c (Å)37.0820(3)
α (o)90.0
β (o)90.0
γ (o)90.0
V3)50,990.5(12)
Z24
Dcalc (g cm−3)1.235
F(000)19632
Temperature (K)100
Reflections collected157629
Independent reflections8722
Rinit0.0304
Reflections observed [I > 2σ(I)]7823
Parameters501
R1 10.0599
wR2 (all data) 20.1833
Goof, S 31.061
Maximum/minimumelectron density (e Å3)1.090/−0.580
1 R1 = Σ||Fo|−|Fc||/Σ|Fo|. 2 wR2 = {Σ[w(Fo2−Fc2)2]/Σ[w(Fo2)2]}1/2. 3 S = {Σ[w(Fo2Fc2)2]/(np)}1/2 where n is number of reflections and p is the total number of parameters refined.
Table 2. Observed and calculated NMR parameters for 1H spin systems of L and [Zn(L)2)]2+.
Spin SystemParameter L Observed
(293 K)
L Calculated
(293 K) 1
[Zn(L)2]2+ Observed
(253 K)
[Zn(L)2]2+ Calculated
(253 K) 1
pyridyl1Hδ(p3)7.35(1)7.548 (23.6620) 7.79(1)7.698 (23.4181)
1Hδ(p4)7.70(1)7.674 (23.5292) 8.15(1)8.091 (23.0032)
1Hδ(p5)7.23(1)7.020 (24.2167)7.51(1)7.434 (23.6978)
1Hδ(p6)8.64(1)8.502 (22.6604)8.15(1)8.160 (22.9295)
3J(p3,p4)6.84(1)6.797.66(1)6.87
3J(p4,p5)7.50(1)6.417.57(1)6.67
3J(p5,p6)4.80(1)4.135.71(1)4.73
4J(p3,p5) 20.9(1)0.810.8(1)0.91
4J(p4,p6) 21.7(1)1.341.7(1)1.23
5J(p3,p6) 20.8(1)1.020.7(1)0.99
phenyl1Hδ(a4) 7.68(1)7.729 (23.4724) 7.43(1)7.526 (23.6005)
1Hδ(a5) 7.33(1)7.428 (23.7882)7.37(1)7.444 (23.6859)
1Hδ(a6)7.07(1)7.126 (24.1051)7.19(1)7.259 (23.8827)
3J(a4,a5) 8.16(1)7.008.10(1)7.23
3J(a5,a6) 7.31(1)6.237.43(1)6.47
4J(a4,a4) 22.3(1)1.962.4(1)2.10
4J(a5,a5) 21.5(1)1.191.4(1)1.19
4J(a4,a6) 21.1(1)0.811.0(1)0.78
5J(a4,a5) 20.5(1)0.640.4(1)0.66
methylene p11Hδ(p1)3.85(1)3.764 (27.6356)4.61(1)4.645 (26.6455)
1Hδ(p1′)4.54(1)4.605 (26.6874)
2J(p1,p1′) −15.56(1)−15.33
methylene a11Hδ(a1)3.25(1)3.200 (28.2281)4.00(1)3.836 (27.5006)
1Hδ(a1′)3.45(1)3.412 (27.9480)
2J(a1,a1′) −16.96(1)−17.51
isopropyl1Hδ(CH)2.92(1)3.023 (28.4140)3.08(1)3.191 (28.2825)
1Hδ(CH3)1.06(1)1.056 (30.4803)1.13(1)1.045 (30.4505)
1Hδ(C’H’3)0.79(1)0.895 (30.6087)
3J(CH,CH3)6.6(1)5.866.5(1)5.74
3J(CH,C’H’3)6.6(1)6.13
4J(CH3,C’H’3) 2 0.2(1)0.36
1 Calculated parameters are the Boltzmann weighted parameters over conformers of L (for 293 K) or of [Zn(L)2)]2+ (for 253 K). Numbers in parentheses are the Boltzmann weighted shielding (1Hσ) from which the calculated Boltzmann weighted shifts (1Hδc) were obtained by the correlation equations given in Figure 3a,b. 2 Long-range couplings mediating through more than three bonds. Observed values for these couplings were determined with lower precision than the values for geminal and vicinal couplings, but several of them in the aromatic systems were greater than 1 Hz. They caused the observed multiplets in the experimental 1H spectra and are included in the fitting of the spin system to the experimental transitions by the NUMMRIT procedure in the Spinworks program [11]. Quality of the fits is shown in Figures S8, S9, S12 and S13 of Supplementary Material.
Table 3. Observed and calculated 13C NMR chemical shifts for L and [Zn(L)2)]2+.
Atom/Signal L Observed
(13Cδo, ppm)
L Calculated
(13Cδc, ppm) 1
[Zn(L)2]2+ Observed
(13Cδo, ppm)
[Zn(L)2]2+ Calculated
(13Cδc, ppm) 1
p158.54(1)59.63 (124.997) 58.72(1) 58.88 (122.501)
p2160.54(1)162.81 (17.617) 156.61(1) 158.86 (21.019)
p3124.16(1)124.36 (57.628)126.61(1) 125.58 (54.801)
p4137.71(1)138.03 (43.408)143.00(1) 142.89 (37.234)
p5123.37(1)122.08 (60.005)126.55(1)125.16 (55.224)
p6150.33(1)151.13 (29.778)149.44(1)150.22 (29.792)
a1 54.72(1)55.49 (129.307) 52.07(1)52.83 (128.643)
a2 171.67(1)171.75 (8.317)173.99(1)173.92 (5.733)
a3139.91(1)139.75 (41.621)137.03(1)137.78 (42.419)
a4 120.07(1)117.03 (65.258)122.15(1)120.23 (60.231)
a5 129.76(1)129.57 (52.195)130.23(1)130.23 (50.083)
a6124.32(1)122.18 (59.901)127.17(1)125.83 (54.551)
CH52.59(1)55.60 (129.191)52.14(1)54.06 (127.395)
CH318.58(1)16.85 (169.517)13.10(1)11.83 (170.257)
C’H’320.94(1)21.39 (160.552)
1 Boltzmann weighted shifts over conformers of L or [Zn(L2)]2+, for 293 K. Numbers in parentheses are Boltzmann weighted shieldings (13Cσ) from which calculated shifts (13Cδc) are obtained by the correlation equation given in Figure 3c,d.
Disclaimer/Publisher’s Note: The statements, opinions and data contained in all publications are solely those of the individual author(s) and contributor(s) and not of MDPI and/or the editor(s). MDPI and/or the editor(s) disclaim responsibility for any injury to people or property resulting from any ideas, methods, instructions or products referred to in the content.

