Abstract
Elementary building blocks for the growth of KDP crystals were established. The solution of potassium dihydrogen phosphate (KH2PO4–KDP) has been experimentally studied by the small-angle X-ray scattering (SAXS) method. The analysis of SAXS data in the temperature range of 2.5–90 °C using a set of models of 3D fragments of the crystal structure showed that the saturated solution contains above K+, H2PO4− and KH2PO4 monomers, as well as mainly octamers. The 3D model of the octamer isolated from the crystal structure has dimensions of 17.443 Å along the [001] axis and 5.963 Å along the [100] and [010] axes. As the temperature is decreased, starting from the saturation temperature of the solution, the volume fraction of octamers sharply increases while the volume fraction of monomers decreases. The results indicate that the monomers and octamers represent major components in the solution with the presence of minor populations of other oligomers. The significant dominance of octamers in the supersaturated solution indicates that they are elementary building blocks for the growth of KDP crystals of tetragonal modification.
1. Introduction
Crystals play a key role as basic parts of electronics [1,2] and photonics [3], and so much attention is paid to the mechanisms of crystal growth [4,5,6,7,8]. The greatest success has been achieved at the stage of growing large crystals [9,10,11,12], but there is no generally accepted point of view in the description of the initial state of crystal growth—the nucleation [13].
Here, first of all, two models compete. According to one model, the initial formation of crystals occurs by the sequential connection of elements [14]. The second model assumes that crystallization occurs through the formation of an intermediate phase of clusters of precursors (Figure 1) [15,16].
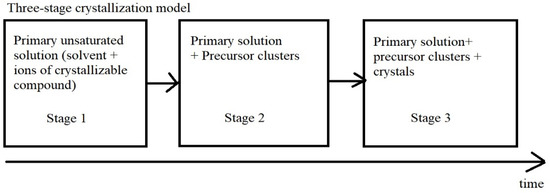
Figure 1.
Three-stage model of crystallization.
This model gained particular weight after the suggestion that the above precursor clusters represent 3D fragments of the crystal structure and the experimental confirmation of this hypothesis for lysozyme solutions using small-angle X-ray scattering (SAXS) and neutrons (SANS) [17,18,19,20], as well as the calculation of the stability of protein oligomers by molecular dynamics methods. Sometimes a two-step model of crystallization is distinguished. There is some research related to the realization of a two-step model of crystallization in proteins [21,22] or inorganic substances [23]. According to the review [24], a crystallization process consists of two steps: (1) a disordered precursor forms, and (2) a crystal nucleus forms inside precursor.
Recently, such precursor clusters have also been found in an inorganic (non-protein) solution of potassium dihydrogen phosphate [25]. Unfortunately, in this work the measurements were carried out in an insufficiently strong beam, and the low concentration of KDP made it possible to detect only the very fact of the appearance of oligomers by imposing sharp temperature changes. KDP is known as an excellent electro-optical nonlinear optical crystal with a large electro-optical nonlinear coefficient, high laser damage threshold, and a laser frequency doubling effect, electro-optical effect, piezoelectric effects and other special features. It is widely used in inertial confinement fusion engineering (ICF) and electro-optical switching devices [26]. Therefore, it is necessary to understand the process of the crystallization of KDP.
As a rule, crystallization processes begin to be considered from the stage of nucleation. However, this process can be significantly affected by the nature of the elementary building blocks of the crystals forming the overgrowth. This article is devoted to the experimental determination of such blocks in solutions of KDP.
In this work, systematic temperature SAXS measurements of KDP solutions were carried out, which revealed the regularities in the formation of precursor clusters simultaneously with crystal structure analysis. For the investigated solution, small KDP crystals were grown and changes in solution structure were measured in this solution.
2. Materials and Methods
To prepare the solutions, KDP crystals were used, which were dissolved in Millipore ultrapure water (water resistance 18 MΩ*cm). The sample concentration was 335 mg/mL, which corresponded to the saturation temperature of KDP 40 °C [27]. Solutions with crystals were initially heated in a thermostat up to 90 °C and kept at this temperature until the crystals were completely dissolved. Before measurements, quartz capillaries with an outer diameter of 2 mm were filled with the solutions. Since filling took place at room temperature, the capillaries were returned to the thermostat until visible crystals in the capillary were dissolved. After that, the capillaries were fixed on a sample holder, for which the temperature was controlled, and the temperature was set to 90 °C.
Any impurity, dust, interface, cuvette or surface can serve as a heterogeneous center of the formation of a nucleus [28,29], but it can only participate in the formation of the nucleus. The size of such a nucleus is much larger than KDP octamers, and it cannot affect the formation of precursor clusters. Extra pure K(H2PO4) without impurities, ultrapure water with final filtration (the content of particles ˃ 0.22 µm in water is 1 particle/mL), was used in the preparation of samples. At each stage, chemically clean disposable tubes were used, which also does not contain impurities and dust. Samples were also loaded into disposable quartz capillaries.
SAXS data for a KDP solution were collected on the “BioMUR” beamline of the Kurchatov Synchrotron Radiation Source (NRC Kurchatov Institute) [30,31]. The KDP solution (335 mg/mL) and corresponding matched solvent blank were enclosed in quartz capillaries with an external diameter of 2 mm. Monochromatic radiation with a wavelength of 0.1445 nm (photon energy 8.1 keV) was used. The sample–detector distance was 700 mm corresponding to the angular range of the scattering vector s = 0.8 ÷ 6.0 nm–1, where s = 4πsin(θ)/λ, 2θ is the scattering angle, and λ is the X-ray wavelength.
During the measurements, the temperature of the capillary was changed from 90 to 2.5 °C using a JULABOFP-89HL circulating thermostat in varying steps: from 90 to 10 °C the step was 10 °C, and from 10 to 5 °C step was 5 °C, from 5 to 2.5 °C step was 2.5 °C; at a rate of 0.5 deg/min, the exposure time was 10 min at each point, and the temperature accuracy was 0.01 °C. The signal was recorded using a PILATUS 1M two-dimensional pixel detector (Dectris, Baden, Switzerland). The powder of silver behenate was used for s-axis calibration. The two-dimensional scattering pattern was averaged over the radial direction using the program FIT2D [32]. Subtraction of the buffer scattering contributions was performed by using the program PRIMUS [33].
The radius of gyration Rg of solute was estimated using the Guinier approximation [34]:
The scattering intensity in a multicomponent system (case of diluted solution) can be presented as a linear combination of scattering components in the form:
where N is the number of components in the system, and νk and Ik(s) are the relative volume fraction and the intensity of the kth component, respectively. The program OLIGOMER [33] was used to determine the volume fractions of precursor clusters in the KDP solution using the non-negative linear least-squares algorithm. Crystallographic models of oligomeric KDP clusters were built by the program Diamond 3.0 [35] based on the tetragonal KDP atomic structure determined in [36]. The theoretical scattering curves of oligomeric KDP clusters were calculated using the program CRYSOL [37].
The program MIXTURE [33] that analyses multicomponent polydisperse systems in terms of mixture of simple geometric objects was used to independently verify the results of OLIGOMER modelling. The system was represented by a mixture of three components (spheres, ellipsoids, cylinders) with the sizes corresponding to monomeric, tetrameric and octameric KDP molecules.
The quality of the approximation was estimated by minimizing the discrepancy χ2 between the experimental and calculated scattering curves using the formulae:
where N is the number of experimental points, I(sj) and σ(sj) are the experimental scattering intensities and associated errors, c is the scaling factor and Icalc(sj) is the calculated intensity from the oligomeric mixture.
3. Results
The KDP structure is described by the tetragonal space group of symmetry I4 ̅2d (No. 122), unit cell parameters a = 7.4606(4) Å, c = 6.9800(4) Å [36]. Phosphorus, oxygen, potassium and hydrogen atoms occupy crystallographic positions 4a, 16e, 4b and 16e, respectively, in the structure. Phosphorus atoms are located in the H2PO4 tetrahedron. The six nearest tetrahedrons are at distances of ≈3.5–4.1 Å from the potassium atom, and the distances between the potassium atom and the other four nearest potassium atoms are ≈4.1 Å.
To analyze the SAXS data, we used models of precursor clusters (3D fragments), from which a KDP crystal can be formed in a saturated solution (Figure 2). Models of precursor clusters were determined by the results of combinatorial topological modeling: monomers, dimers, tetramers and octamers [24]. The 2K[H2PO4] cluster-dimer is formed from two bound monomers. Bonds exist between the vertex of the [H2PO4]− tetrahedron and the K+ ion from the neighboring monomer. The 4K[H2PO4] tetramers are formed from two dimers and also have two bonds between the vertices of the [H2PO4]− tetramer and K+ ions from neighboring dimers. The 8K[H2PO4] octamers are built from two tetramers (Figure 2).
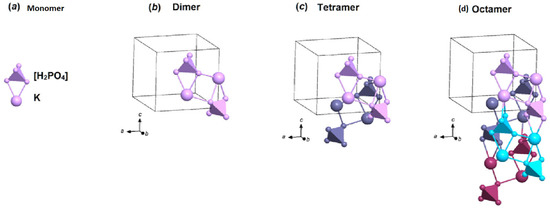
Figure 2.
Different colors of dimers show that a tetramer consists of two dimers. Different colors of the tetramers show that the octamer consists of four tetramers. 3D fragments of the KDP crystal structure. The figure was made with the help of the program Diamond 3.0 [35].
The experimental and theoretical SAXS curves calculated by the program OLIGOMER (using isolated oligomeric clusters) are shown in Figure 3. The results are presented in Table 1.
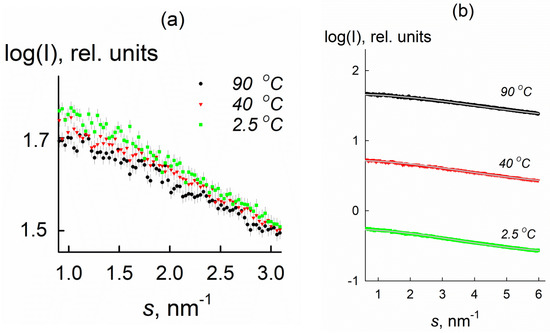
Figure 3.
(a) Experimental SAXS curves for 335 mg/mL KDP solution at temperatures of 2.5, 40, 90 °C (low angle range with s < 3.1 nm−1 is shown). (b) Fits to the SAXS data obtained by OLIGOMER (solid grey curves) and experimental curves (black, red and green) over the entire angular range. The experimental curves are shifted along the vertical axis for better visualization. Axis X—scattering vector, axis Y—scattering intensity in relative units.

Table 1.
The volume fractions of monomers, dimers, tetramers and octamers; the average radius of gyration Rg of the solute; and the fit quality values χ2 obtained by OLIGOMER for a KDP solution with a concentration of 335 mg/mL.
The slope of the SAXS curves becomes sharper as the temperature is decreased (Figure 3a). This behavior points to the formation of associates and/or an increase of their volume fractions compared to the initial state of the system. Indeed, for the initial state of the system at 90 °C, the average radius of gyration Rg was equal to (0.31 ± 0.01) nm, whereas it significantly increases to (0.37 ± 0.01) nm as the temperature decreases to 2.5 °C.
The calculated SAXS curves for oligomeric clusters for a supersaturated KDP solution coincide with the experimental data over the entire angular range (Figure 1b). The χ2 values do not exceed 1.4, which indicates a good fit quality. It was found that the solution contains only monomers and octamers, and the content of octamers increases with the temperature decrease from 30% (T = 80 °C) to 78% (T = 2.5 °C). It is in agreement with the singular value decomposition analysis of the scattering curves that found only two significant singular values corresponding to two nonrandomly oscillating singular vectors (Figure 4).
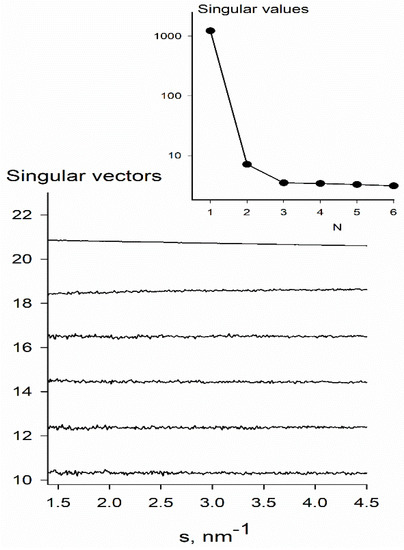
Figure 4.
Singular value decomposition of SAXS data on KDP crystallization solution (335 mg/mL) using temperature data set for T = 2.5 − 90 °C. Only two significant singular values (shown in the insert) corresponding to two non-randomly oscillating singular vectors were found. It suggests that the system can be described by two independent components, thus validating our choice of two oligomeric species (monomers and octamers) for SAXS data modelling.
According to the obtained data (Table 1), three stages of crystallization can be distinguished:
- (1)
- A major fraction of monomers and a minor fraction of octamers (90 °C < T< 50 °C).
- (2)
- A significant increase in the volume fraction of octamers (50 °C < T< 5 °C).
- (3)
- The appearance of crystals, which is also confirmed by a decrease in the radius of gyration, as well as a decrease in the volume fraction of octamers (at T = 2.5 °C measured the next day).
One can see from Figure 5 that the volume fraction of octamers is observed to increase as the temperature is decreased. It can be distinguished, based on Table 1 and Figure 5, that for the studied KDP solution, the crystallization point was between 50 and 40 °C, which slightly differs from the previously reported data [24] where the crystallization temperature is estimated as 40 °C for a given KDP concentration. On the other hand, looking at the Rg values in Table 1 and taking into account the associated errors, the crystallization temperature can be closer to 40 °C, where a significant increase of average Rg is observed.
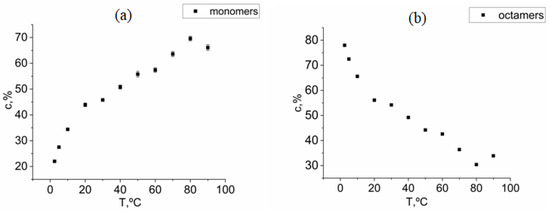
Figure 5.
(a) Temperature dependence of the volume fraction of monomers for a solution of KDP with a concentration of 335 mg/mL. (b) Temperature dependence of the volume fraction of octamers for a solution of KDP with a concentration of 335 mg/mL.
To verify the results, we have used an alternative approach where the system was approximated in term of simple geometric bodies (spheres, ellipsoids and cylinders) corresponding to the sizes of monomers, tetramers and octamers of KDP atomic structures, respectively. The volume fractions of the components obtained by the program MIXTURE are shown in Table 2. As can be seen, the obtained results are in a qualitive agreement with the OLIGOMER modelling—namely, the main components in the system are represented by spheres (monomers) and cylinders (octamers), whereas the volume fraction of the ellipsoids (tetramers) does not exceed 13% at all temperatures.
Table 2.
The volume fractions of spheres (with radius 2.0 Å), ellipsoids (with semiaxes 2.5 Å, 2.5 Å and 5.0 Å) and cylinders (with radius 2.25 Å and length 17 Å) corresponding to the sizes of monomers, tetramers and octamers, and the fit quality values χ2 obtained by the program MIXTURE for a KDP solution with a concentration of 335 mg/mL. A moderate polydispersity on the radius of the components was allowed during the modelling.
After the completion of measurements at 2.5 °C, the capillary with the solution was kept for 18 h in a thermostat at a constant temperature. As a result, crystals grew in the capillary (Figure 6), which reflects a transition to the third stage of crystallization (Figure 1). It is also in agreement with the data from Table 1, where a decrease in the radius of gyration and in the volume fraction of octamers is observed.
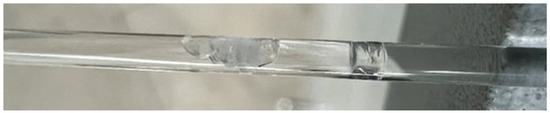
Figure 6.
Photo of a capillary with crystals in solution after exposure for 18 h at a temperature of 2.5 °C.
4. Discussion
SAXS is a powerful technique that provides structural information in nanoscale range and is actively used for studying time-dependent evolutions of macromolecules and precipitation reactions for inorganic substances [38].
As a result of SAXS data analysis, one can see from Figure 5 that, starting from a temperature of 80 °C (the temperature of formation of a saturated solution), the volume fraction of KDP monomers sharply decreases and the volume fraction of KDP octamers increases as the temperature is decreased. At the same time, other types of oligomers seem to represent minor components in solution. It clearly indicates the leading role of octamers in the formation of crystals. At the same time, one has to note that the octamers represent just one of the possible precursor cluster intermediates of the pre-crystallization phase of KDP solution. One cannot exclude the presence of octamers with different crystal lattice types that may nucleate faster than the tetragonal one.
Since octamers are precursor clusters [24], the results obtained by SAXS allow us to conclude that they are the 3D fragments from which the crystal was grown from a saturated KDP solution (Figure 7).
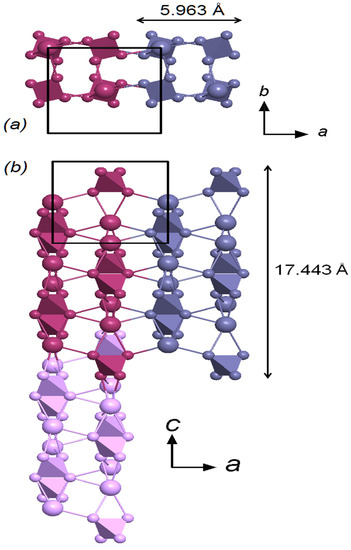
Figure 7.
Multiplication of the octamer in the direction of the a-axis and in the direction of the c-axis in two projections. Individual octamers are shown in different colors. Black rectangle-contours of the elementary cell. Different colors show different octamers. (a) Projection from axis b. (b) Projection from axis c. The arrows indicate the direction of the crystallographic axes. As can be seen from Figure 8, the size of the octamers is ≈17.443 Å along the [001] axis, and ≈5.963 Å along the [100] and [010] axes. A 3D framework can be formed by connecting octamers in the [001], [100] and [010] directions.
In general, it can be noted that this work confirms the three-stage growth model (Figure 8): namely, at high temperatures, the monomers represent the major fraction of the unsaturated solution and as the temperature is decreased, the volume fraction of octamers is significantly increased with increasing values of saturation. Finally, the measurement performed the next day at a temperature of 2.5 °C found that the third stage of crystallization began to be observed and is accompanied by the crystal formation (Figure 6).
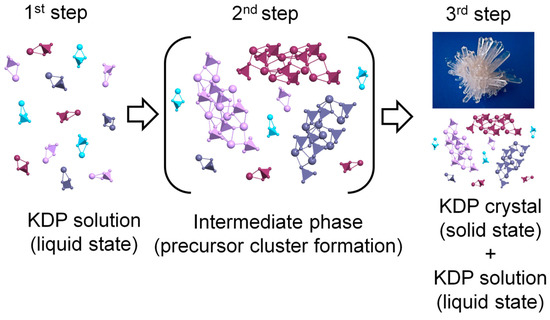
Figure 8.
Change in the state of the solution with increasing supersaturation. Different colors show different structure precursor clusters.
The present work shows that the monomers and octamers are the main components in pre-crystallization solution with possibly minor populations of other oligomers, and indicates that crystallization occurs on the basis of the formation of the intermediate phase of precursor clusters.
Thus, the present work confirms the concept of the formation of precursor clusters from 3D fragments of the crystal structure in the crystallized supersaturated solution of the intermediate phase. The formation of this phase precedes nucleation [39], which represents a separate process. Consideration of crystallization usually begins with the process of nucleation, which essentially depends on the structure of the ruler-precursor. The process of nucleation may be strongly spaced in time with the formation of clusters, but they are undoubtedly interconnected. Therefore, the procedure for determining precursor clusters described in this paper can significantly facilitate and speed up the search for optimal conditions for crystal growth.
Author Contributions
A.E.S., K.B.I., P.V.K., G.S.P., Y.V.P., E.S.S., O.A.A. and M.V.K. Conceptualization, M.V.K., Y.V.P. and O.A.A.; methodology, P.V.K. and K.B.I.; software, P.V.K.; validation, A.E.S. and P.V.K.; formal analysis, A.E.S. and P.V.K.; physical and computational experiment, G.S.P., Y.V.P., A.E.S., K.B.I. and P.V.K.; data curation, P.V.K. and K.B.I.; original draft preparation, A.E.S. and P.V.K.; writing—review, A.E.S., P.V.K., K.B.I., E.S.S., O.A.A. and Y.V.P.; editing, P.V.K., Y.V.P. and M.V.K.; results discussion, A.E.S., P.V.K., K.B.I., E.S.S., O.A.A., Y.V.P. and M.V.K.; visualization, E.S.S.; supervision, M.V.K. and O.A.A.; project administration, Y.V.P.; funding acquisition, O.A.A. All authors have read and agreed to the published version of the manuscript.
Funding
This research was funded by the Ministry of Science and Higher Education grant No. 075-15-2021-1362 and the Ministry of Science and Higher Education within the State assignment FSRC «Crystallography and Photonics» RAS.
Data Availability Statement
Not applicable.
Conflicts of Interest
The authors declare no conflict of interest.
References
- Sussmann, R.S. CVD Diamond for Electronic Devices and Sensors; John Wiley & Sons, Ltd.: Hoboken, NJ, USA, 2009; 571p. [Google Scholar]
- Ishihara, S.; Kobayashi, S.; Ukai, Y. High Quality Liquid Crystal Displays and Smart Devices. Volume 2: Surface Alignment, New Technologies and Smart Device Applications; The Institution of Engineering and Technology: London, UK, 2019; 383p. [Google Scholar]
- Kumar, N.; Suthar, B. Advances in Photonic Crystals and Devices; CRC Press: Boca Raton, FL, USA, 2019; 357p. [Google Scholar]
- Kolesnikov, N.; Borisenko, E. Modern Aspects of Bulk Crystal and Thin Film Preparation; InTech: London, UK, 2011; 618p. [Google Scholar]
- Dok, A.R.; Legat, T.; De Coene, Y.; Van der Veen, M.A. Nonlinear optical probes of nucleation and crystal growth: Recent progress and future prospects. J. Mater. Chem. C 2021, 9, 11553–11568. [Google Scholar] [CrossRef]
- Pina, C.M.; Becker, U.; Risthaus, P.; Bosbach, D.; Putnis, A. Molecular-scale mechanisms of crystal growth in barite. Nature 1998, 395, 483–486. [Google Scholar] [CrossRef]
- Velásquez-González, O.; Campos-Escamilla, C.; Flores-Ibarra, A.; Esturau-Escofet, N.; Arreguin-Espinosa, R.; Stojanoff, V.; Cuéllar-Cruz, M.; Moreno, A. Crystal Growth in Gels from the Mechanisms of Crystal Growth to Control of Polymorphism: New Trends on Theoretical and Experimental Aspects. Crystals 2019, 9, 443. [Google Scholar] [CrossRef]
- Ma, W.; Lutsko, J.F.; Rimer, J.D.; Vekilov, P.G. Antagonistic cooperativity between crystal growth modifiers. Nature 2020, 577, 497–501. [Google Scholar] [CrossRef] [PubMed]
- Mohamed, H.F.; Xia, C.; Sai, Q.; Cui, H.; Pan, M.; Qi, H. Growth and fundamentals of bulk β-Ga2O3 single crystals. J. Semicond. 2019, 40, 011801. [Google Scholar] [CrossRef]
- Chen, D.; Wang, B.; Wang, H.; Zheng, L.; Zhang, H.; Qi, H.; Shao, J. Rapid Growth of a Cuboid DKDP (KDxH2−XPO4) Crystal. Cryst. Growth Des. 2019, 19, 2746–2750. [Google Scholar] [CrossRef]
- Phelps, P.R.; Lee, C.-T.A.; Morton, D.M. Episodes of fast crystal growth in pegatites. Nat. Commun. 2020, 11, 1. [Google Scholar] [CrossRef]
- Sasaki, T.; Yokotani, A. Growth of large KDP crystals for laser fusion experiments. J. Cryst. Growth 1990, 99, 820–826. [Google Scholar] [CrossRef]
- Schreiber, R.E.; Houben, L.; Wolf, S.G.; Leitus, G.; Lang, Z.-L.; Carbó, J.J.; Poblet, J.M.; Neumann, R. Real-time molecular scale observation of crystal formation. Nat. Chem. 2017, 9, 369–373. [Google Scholar] [CrossRef]
- Ilyushin, G.D.; Blatov, V.A. Combinatorial and topological modeling of cluster self-assembly of the crystal structure of zeolites. Crystallogr. Rep. 2015, 60, 453–465. [Google Scholar] [CrossRef]
- Gebauer, D.; Kellermeier, M.; Gale, J.D.; Bergstro, L. Pre-nucleation clusters as solute precursors in crystallization. Chem. Soc. Rev. 2014, 43, 2348–2371. [Google Scholar] [CrossRef]
- Askhabov, A.M. Cluster (quatarone) self-organization of matter at the nanoscale level and the formation of crystalline and non-crystalline materials. Zap. Ross. Mineral. O-va 2004, 133, 108–123. [Google Scholar]
- Kovalchuk, M.V.; Blagov, A.E.; Dyakova, Y.A.; Gruzinov, A.Y.; Marchenkova, M.A.; Peters, G.S.; Pisarevsky, Y.V.; Timofeev, V.I.; Volkov, V.V. Investigation of the Initial Crystallization Stage in Lysozyme Solutions by Small-Angle X-ray Scattering. Cryst. Growth Des. 2016, 16, 1792–1797. [Google Scholar] [CrossRef]
- Boikova, A.S.; Dyakova, Y.A.; Ilina, K.B.; Konarev, P.V.; Kryukova, A.E.; Kuklin, A.I.; Marchenkova, M.A.; Nabatov, B.V.; Blagov, A.E.; Pisarevsky, Y.V.; et al. Octamer Formation in lysozyme solutions at the initial crystallization stage detected by small-angle neutron scattering. Acta Cryst. D 2017, 73, 591–599. [Google Scholar] [CrossRef]
- Dyakova, Y.A.; Ilina, K.B.; Konarev, P.V.; Kryukova, A.E.; Marchenkova, M.A.; Blagov, A.E.; Volkov, V.V.; Pisarevsky, Y.V.; Kovalchuk, M.V. Small-angle X-ray scattering study of conditions for the formation of growth units of protein crystals in lysozyme solutions. Crystallogr. Rep. 2017, 62, 364–369. [Google Scholar] [CrossRef]
- Marchenkova, M.A.; Volkov, V.V.; Blagov, A.E.; Dyakova, Y.A.; Ilina, K.B.; Tereschenko, E.Y.; Timofeev, V.I.; Pisarevsky, Y.V.; Kovalchuk, M.V. In situ study of the state of lysozyme molecules at the very early stage of the crystallization process by small-angle X-ray scattering. Crystallogr. Rep. 2016, 61, 5–10. [Google Scholar] [CrossRef]
- Ten Wolde, T.; Frenkel, D. Enhancement of protein crystal nucleation by critical density fluctuations. Science 1997, 77, 1975–1978. [Google Scholar] [CrossRef]
- Galkin, O.; Vekilov, P.G. Control of protein crystal nucleation around the metastable liquid–liquid phase boundary. Proc. Natl. Acad. Sci. USA 2000, 97, 6277–6281. [Google Scholar] [CrossRef]
- Vekilov, P.G. Nonclassical nucleation. ACS Symp. Ser. Am. Chem. Soc. 2020, 1358, 19–46. [Google Scholar]
- Kovalchuk, M.V.; Alekseeva, O.A.; Blagov, A.E.; Ilyushin, G.D.; Il’ina, K.B.; Konarev, P.V.; Lomonov, V.A.; Pisarevsky, Y.V.; Peters, G.S. Investigation of the Structure of Crystal-Forming Solutions of Potassium Dihydrogen Phosphate K(H2PO4) (KDP type) on the Basis of Modeling Precursor Clusters and According to Small-Angle X-Ray Scattering Data. Crystallogr. Rep. 2019, 64, 6–10. [Google Scholar] [CrossRef]
- Li, D.; Bai, R.; Huo, Z. EDTA and kKCI Doped KDP Solution and Thermodynamics Principle of Crystallization Process. Therm. Sci. Eng. 2018, 1, 361. [Google Scholar] [CrossRef][Green Version]
- Liu, G.; Wang, D.; Cui, D.; Shen, C.; Xu, M.; Meng, F.; Yao, S.; Wang, S. Influence of agitation intensity on solution stability for rapidly grown KDP crystal through theoretical and experimental research. Mater. Today Commun. 2020, 24, 101007. [Google Scholar] [CrossRef]
- Zhang, Y.; Dai, Y.; Tie, G.; Hu, H. Effects of temperature on the removal efficiency of KDP crystal during the process of magnetorheological water-dissolution polishing. Appl. Opt. 2016, 55, 8308–8315. [Google Scholar] [CrossRef] [PubMed]
- Joop, H.; Sefcik, J. The Handbook of Continuous Crystallization; The Royal Society of Chemistry: London, UK, 2020; pp. 1–50. [Google Scholar]
- Diao, Y.; Myerson, A.S.; Hatton, T.A.; Trout, B.L. Surface design for controlled crystallization: The role of surface chemistry and nanoscale pores in heterogeneous nucleation. Langmuir 2011, 27, 5324–5334. [Google Scholar] [CrossRef] [PubMed]
- Peters, G.S.; Zakharchenko, O.A.; Konarev, P.V.; Karmazikov, Y.V.; Smirnov, M.A.; Zabelin, A.V.; Mukhamedzhanov, E.H.; Veligzhanin, A.A.; Blagov, A.E.; Kovalchuk, M.V. The small-angle X-ray scattering beamline BioMUR at the Kurchatov synchrotron radiation source. Nucl. Instrum. Methods Phys. Res. Sect. A 2019, 945, 162–616. [Google Scholar] [CrossRef]
- Peters, G.S.; Gaponov, Y.A.; Konarev, P.V.; Marchenkova, M.A.; Ilina, K.B.; Volkov, V.V.; Pisarevsky, Y.V.; Kovalchuk, M.V. Upgrade of the BioMUR beamline at the Kurchatov synchrotron radiation source for serial small-angle X-ray scattering experiments in solutions. Nucl. Instrum. Methods Phys. Res. Sect. A 2022, 1025, 166–170. [Google Scholar] [CrossRef]
- Hammersley, A.P. FIT2D: An Introduction and Overview. European Synchrotron Radiation Facility Internal Report ESRF97HA02T 68 (1997). Available online: https://www.esrf.fr/computing/scientific/FIT2D/FIT2D_INTRO/fit2d.html (accessed on 23 November 2022).
- Konarev, P.V.; Volkov, V.V.; Sokolova, A.V.; Koch, M.H.J.; Svergun, D.I. A Windows PC-based system for small-angle scattering data analysis. J. Appl. Crystallogr. 2003, 36, 1277–1282. [Google Scholar] [CrossRef]
- Guinier, A. La diffraction des rayons X aux très petits angles: Application à l’étude de phénomènes ultramicroscopiques. Ann. Phys. 1939, 11, 161–237. [Google Scholar] [CrossRef]
- Bergerhoff, G.; Berndt, M.; Brandenburg, K. Evaluation of Crystallographic Data with the Program DIAMOND. J. Res. Natl. Inst. Stand. Technol. 1996, 101, 221–225. [Google Scholar] [CrossRef]
- Malakhova, L.F.; Furmanova, N.G.; Vilensky, A.I.; Grigorieva, M.S.; Simonov, V.I.; Rudneva, E.B.; Voloshin, A.E. Structural features of the KH2PO4: Cr single crystal. Crystallogr. Rep. 2009, 54, 211–218. [Google Scholar] [CrossRef]
- Svergun, D.; Barberato, C.; Koch, M.H. CRYSOL—A program to evaluate X-ray solution scattering of biological macromolecules from atomic coordinates. J. Appl. Crystallogr. 1995, 28, 768–773. [Google Scholar] [CrossRef]
- Stawski, T.M.; Benning, L.G. SAXS in inorganic and bioinspired research. Methods Enzymol. 2013, 532, 95–127. [Google Scholar]
- Zhou, R.-B.; Cao, H.-L.; Zhang, C.-Y.; Yin, D.-C. A review on recent advances for nucleants and nucleation in protein crystallization. CrystEngComm 2017, 19, 1143–1155. [Google Scholar] [CrossRef]
Disclaimer/Publisher’s Note: The statements, opinions and data contained in all publications are solely those of the individual author(s) and contributor(s) and not of MDPI and/or the editor(s). MDPI and/or the editor(s) disclaim responsibility for any injury to people or property resulting from any ideas, methods, instructions or products referred to in the content. |
© 2022 by the authors. Licensee MDPI, Basel, Switzerland. This article is an open access article distributed under the terms and conditions of the Creative Commons Attribution (CC BY) license (https://creativecommons.org/licenses/by/4.0/).