Article

Case Study on the Reproducibility of Characterizing the Electrocatalytic Activity of La1−xSrxMnO3 in ORR

School of Materials Science and Engineering, Hubei Polytechnic University, No. 16 Guilin North Road, Huangshi 435003, China
Crystals 2023, 13(1), 74; https://doi.org/10.3390/cryst13010074
Submission received: 25 November 2022 / Revised: 20 December 2022 / Accepted: 28 December 2022 / Published: 1 January 2023

Abstract

:
The electrocatalytic activity characterization of the oxygen reduction reaction (ORR) is commonly characterized using a rotating disk electrode (RDE) with linear sweep voltammetry (LSV) or cyclic voltammetry (CV) measurements. Despite the wide application of this method in the literature, its reproducibility and comparability are rarely mentioned in articles. LSV and CV are sensitive to experimental conditions, thus the reproducibility is a significant concern. In this article, the perovskite oxides La1−xSrxMnO3 (LSMOx, x = 0, 0.1, 0.2, 0.3, 0.4, 0.5) are chosen for the case study to measure their electroactivity using the RDE method. The main elements that influence the reproducibility of the experiment are presented and the corresponding explanations as well as the means for ensuring the reproducibility are given. Through the case study of LSMOx with variations in x and calcination temperatures, the values for the kinetic current of ORR on different catalysts are compared. It is found that doping ratios above 0.1 are associated with higher ORR electroactivity, with around a 50 mV difference in ORR onset potential between x > 0.1 and x = 0.1, which is in accordance with the results of reported works, whereas there is no significant difference when x = 0.2–0.5. Calcination temperature has little influence on the electroactivity of LSMOx, resulting in only a slight advantage at lower calcination temperatures, with an ORR onset potential that is around 10 mV more positive.

Graphical Abstract

1. Introduction

The oxygen reduction reaction (ORR) is one of the key reactions in the field of energy conversion and storage, featuring, e.g., in metal-air batteries and fuel cells, among other examples [1,2]. The electrocatalytic activity of the catalysts towards ORR is usually characterized through cyclic voltammetry (CV) or linear sweep voltammetry (LSV) polarization of a rotating disk electrode (RDE) or rotating ring-disk electrode (RRDE) [3,4]. When considering the attachment of a catalyst and electrode, the catalyst can be coated on an RDE in the form of an ink drop or grown directly on the RDE [5,6]. In the case of ink drop on RDE, the normal procedure in electrocatalytic characterization is to firstly prepare an ink containing active material, conductive additive and binder which are dispersed in a solvent or a mixture of solvents. Secondly, the ink is dropped onto the RDE, and a thin film with a thickness of around 100 nm forms after the evaporation of the solvent. The prepared film is then ready for the polarization test [7]. The electronic conductive additive is commonly carbon, and VXC-72 is usually adopted because of the good balance between its conductivity and surface area from the perspective of both its capacitive effect and performance in the catalysis of ORR [8,9]. The effect of carbon in ORR electrocatalysis has been studied, and it is believed that carbon preferentially reduces O2 to HO2 which is sequentially reduced to OH on the metal oxide catalyst [10,11]. Sometimes, the carbon material is indispensable in this method. La0.8Sr0.2CoO3 alone is reportedly inactive in ORR but active when carbon is present [12]. With the carbon addition, perovskite oxides/carbon composite electrodes may exhibit much higher activity than single perovskite oxide thin films [13]. The binder is for binding the powders and attaching them to the electrode surface, and Nafion is often used as binder material due to its good ionic conductivity [5,14].
Although the most mature electrocatalyst for ORR is Pt, its cost and longevity are unsatisfactory. Therefore, low-cost transitional metal-based oxides are becoming increasingly attractive. Abundant transitional metal oxides are shown to have desirable electrocatalytic activity for ORR through polarization characterization [15,16,17,18,19,20,21]. As far as we are aware, reproducibility is rarely mentioned in these articles, and the polarization curves are merely comprehensively explained. Perovskite oxides are typically used as catalysts of ORR [7,17,18]. Lanthanum manganese oxides doped with strontium (La1−xSrxMnO3) are the most reported active material for ORR electrocatalysis, owing to the similar atom size of lanthanum and strontium, meaning there are no large structural distortions after doping with strontium [22]. The substitution of trivalent La3+ with divalent Sr2+ induces vacancies in the electronic structure which improves the electron transfer and oxygen mobilization [23]. Pavone et al. [24] applied first-principle quantum mechanical calculations to analyze the electronic structure and formation of oxygen defects in La1−xSrxMnO3 (LSMO, x = 0, 0.25, 0.5). It was revealed that strontium doping in LSMO leads to the formation of holes in the electronic structure, and the material turns from insulator to metal. There is also a partial oxidation of Mn ions from a formal state of manganese Mn(3+) to Mn(4+), and the Mn4+ ion is smaller in size than Mn3+. This causes the LSMO unit cell volume to decrease with increasing strontium content. The oxygen defect formation energy also decreases with increased Sr doping. Tulloch et al. [25] synthesized La1−xSrxMnO3 (x = 0, 0.2, 0.4, 0.6, 0.8, 1) by co-precipitation, of which La0.4Sr0.6MnO3 showed the best performance among them, owing to its four-electron reduction process, minimal crystallite size and maximum surface area. The RDE voltammogram for each of the different studied catalysts are not explained very clearly, especially for the tiny but evident reductive plateaus under different rotating rates and with different catalysts. Zhao et al. [26] synthesized La1−xSrxMnO3 (x = 0, 0.2, 0.6), of which La0.4Sr0.6MnO3 showed the highest current density and exhibited excellent ORR activity. Oxygen vacancies on the oxide surface generated by Sr-doping were deemed the primary reason for the enhancement of ORR activity. Nevertheless, the difference in the capacitive effect between different catalysts was evident in their cyclic voltammograms, in which only the peak current density was discussed in the comparison of reductive electroactivity, neglecting the fact that the current density also includes the capacitive current. Xue et al. [27] studied the strontium doping ratio of (La1−xSrx)0.98MnO3 (x = 0.2–0.5) perovskites, where the (La0.7Sr0.3)0.98MnO3 perovskite exhibited the best ORR catalytic activity due to its excellent oxygen adsorption capacity. Likewise, the cyclic voltammograms exhibited a clear capacitive effect, although this was not taken into consideration.
Although there has been much research on the strontium doping effect on the ORR electrocatalysis of LSMO showing that strontium doping can produce oxygen vacancies on oxide surfaces, increasing the specific surface area of oxides, and allowing higher electronic conductivity from the chemical state change in Mn, there is little consensus on which strontium doping ratio will result in the best performance. This discrepancy is undoubtedly a result of the different routes for synthesis of LSMO. The methods used for comparing the electroactivity of LSMO perovskites is also another consideration. There may exist more appropriate methods for effectively comparing the intrinsic electroactivity of LSMO and other electrocatalysts for ORR, via which only the electrocatalyst exhibits electrocatalytic performance without disturbances from other additives or impurities; this is not the case for the RDE method. Therefore, delicate operations should be adopted when applying the RDE method for the electrocatalytic comparison of ORR.
Concerning the breadth of studies on La1−xSrxMnO3 (LSMOx), La1−xSrxMnO3 is also chosen for case study in this work with the aim of finding a clue to explain the discrepancy mentioned above. LSMOx is synthesized via a citrate solution method [28]. For the obtained oxides powders, the ORR electrocatalytic activity is assessed using the RDE method, which to date has almost exclusively been applied to the measurement of ORR electrocatalysis. The sensitivity of this method, from ink preparation to the CV or LSV test, is seldom emphasized [29]. In this work, the differences generated by the minor aforementioned or unnoticeable elements that influence the reproducibility of the characterization are presented. The importance of the manner of mixing ink and the drop volume coated on the disk have not been previously discussed. The procedure of ink preparation is only slightly referred to while vastly followed in articles. The polarization curves that appear to deviate from the standard curve are also explained in detail with the aim of being more informed regarding this characterization method.
Ideal cyclic voltammograms of RDE present a sigmoid shape composed of three parts, i.e., a kinetic-controlled region and a diffusion–controlled region located on the two ends of the curve, and a diffusion-kinetic region in between these regions [30]. Aside from the faradaic current of electron-transfer redox reactions in the bulk electrode, which is from the ORR, the non-faradaic current, also known as the capacitive current, from the double-layer effect, also contributes to the measured current. There is another component of faradaic charge from electron-transfer through the surface atoms, also called pseudo-capacitance [31]. If the cyclic voltammogram appears as a rectangular shape under inert circumstances, this is indicative of a capacitive effect. Pseudo-capacitance also has a similar effect, with dumpy bumps on the curve, which is from the electron transfer of surface atoms. Both the pseudo-capacitive and capacitive effect should be removed when comparing the electroactivity of different electrodes with the RDE method either by comparing the onset potential or via the Koutecký–Levich analysis. Normally, the more positive the onset potential of ORR, the higher the electroactivity in ORR. Koutecký–Levich analysis is usually used for calculating the number of electrons transferred during ORR, with a four-electron way preferred [32]. To the best of my knowledge, the pseudo-capacitive and capacitive currents have seldom been taken into consideration in the literature, which may introduce inaccuracies when comparing or characterizing the electroactivity of catalysts. To simplify the text, the term “capacitive” effect will hereafter include both pseudo-capacitive and capacitive effect.
Besides the CV test, LSV polarization is also widely applied in electroactivity measurements. On an LSV curve, capacitive current does not manifest as a rectangular shape but as a more negative current in the negative scan direction and a more positive current in the positive scan direction. The capacitive effect may lead to inaccuracy in the onset potential by causing a deviation from the real value. In this article, the capacitive current is deemed as the current measured under O2 bubbling, from which the current measured under N2 bubbling is subtracted to obtain the kinetic current of the ORR [27]. Taking this subtracted current as a function of potential, the modified polarization curve is used for the comparing of the electrocatalytic activity of the active materials in a relatively more accurate way.
In all, the RDE methodology for ORR electrocatalysis comparison is robust but needs more attention, especially the idea that the capacitive current should be removed to obtain the net kinetic current. This work may spare those who are beginners in applying this methodology from some invalid repetitions.

2. Materials and Methods

2.1. Synthesis of the LSMOx

La1−xSrxMnO3 (LSMOx) perovskite oxides were synthesized using a citrate solution process [27]. Lanthanum acetate sesquihydrate (Alfa Aesar, Haverhill, MA, USA, ≥99.0%), strontium acetate (Aldrich, St. Louis, MO, USA, ≥99.0%), manganese acetate tetrahydrate (Sigma-Aldrich, ≥99.0%) and citric acid (Sigma-Aldrich, ≥99.0%) were used for the preparation of the precursor solution. The acetates of the corresponding cations were stoichiometrically dissolved in deionized water to prepare a 40 mL solution with a concentration of 0.25 M Mn3+, (1−x) × 0.25 M La3+, and x × 0.25 M Sr2+. Another 10 mL of 2 M citric acid solution of equivalent moles of metal ions was prepared. Then, the citric acid solution was rapidly poured into the acetate solution, with the immediate appearance of a white precipitate. Afterwards, around 5 mL of ammonium hydroxide (25 wt.%) was progressively added into the precipitated suspension until the precipitate dissolved. The aqueous solution was then put in an oven at 80 °C for 24 h, when a transparent gel formed due to the evaporation of water. The temperature was then increased to 150 °C. The gel foamed and became a spongy beige solid. This solid was ground and calcined in flowing oxygen, with a heating rate of 150 °C h−1 up to the desired temperature, which was held for 4 h.

2.2. Physical Characterization of the LSMOx

The obtained powder samples were characterized by X-ray diffraction (XRD). The structure of the as-prepared perovskites was tested at 45 kV and 40 mA using a PANalytical powder diffractometer with Cu K (λ = 1.54056 Å) in the 2 theta (θ) range from 5° to 80° at a scan rate of 2.5° min−1. Le Bail refinements of the XRD patterns were carried out using the opensource software Fullprof During refinements, general parameters, such as the scale factor, background parameters, sample displacement and peak shape were optimized.

2.3. Preparation of the Ink

The electroactivity characterization of LSMOx for ORR was conducted on an RDE (Radiometer analytical) with a glassy carbon tip of 3 mm in diameter and a surface area of 0.07 cm2. Firstly, an ink containing active material (LSMOx), carbon black and Nafion solution dispersed in deionized water was prepared after mixing them homogeneously. To prepare the homogeneous ink, 75 mg catalyst material, 15 mg nitric acid-treated carbon black, and 15 mg Nafion (equivalent to 125 µL K+ exchanged Nafion solution) were thoroughly mixed in 6 mL deionized water. This was then sonicated for 2 min to achieve homogeneous mixing without solvent evaporation. After dropping a certain volume of the prepared ink on the RDE, and drying it in an oven at 80 °C for 5 min, the thin film could be formed and attached on the disk, ready for the electrochemical measurement.
The carbon black was not used as purchased. It was firstly treated with nitric acid to increase its hydrophilicity. The procedure is as follows: 2 g of carbon black (VXC-72) was mixed with 20 mL nitric acid (1 M from VWR) using an electronic mixer for 5 min before placing it in an oven at 80 °C for 4 h. This was followed by filtration of the mixture, collection of the carbon black, and drying overnight in the oven at 80 °C. Because the binder was delivered in its acidic form, there was a risk of partial dissolution of catalysts when they came into contact with this acidic environment. Thus, 3 mL of purchased Nafion solution (wt. 20%) was neutralized before use by mixing with 2 mL of 0.3 M KOH solution [7], with overnight shaking, and the obtained solution was suitable for direct use as the binder material, and the weight for calculation was on the basis of Nafion, i.e., dry mass.

2.4. Electrocatalytic Characterization of the LSMOx on ORR

A three-electrode system was applied in electrocatalytic characterization. RDE was the working electrode, a platinum electrode from Metrohm-Hach was used as the counter electrode, Ag/AgCl (3 M KCl) as the reference electrode (filled with a protective KCl to guard against corrosion), and 0.1 M KOH as the electrolyte. The scan of the potential ranged from −1 V to 0.5 V vs. Ag/AgCl (3 M KCl) at a scan rate of 10 mV s−1. The scans were firstly started from the OCV towards the negative potential under oxygen bubbling while detecting the ORR performance using a potentiostat (Bio-Logic, Seyssinet-Pariset, France). The sample showing the onset of a negative reduction current at the highest potential (most positive) should have the best catalytic activity for ORR.

3. Results and Discussion

In this part, the physical properties of the LSMOx are firstly presented and analyzed. The reproducibility of the characterization of the LSMOx electroactivity using the RDE method is discussed, with emphasis on the importance of accuracy in the characterization of ORR electrocatalysts. Finally, the capacitive effect, which is often presented when determining the electrochemical performance of catalysts but seldom discussed, is also taken into consideration with regard to the comparison of different ORR electrocatalysts.

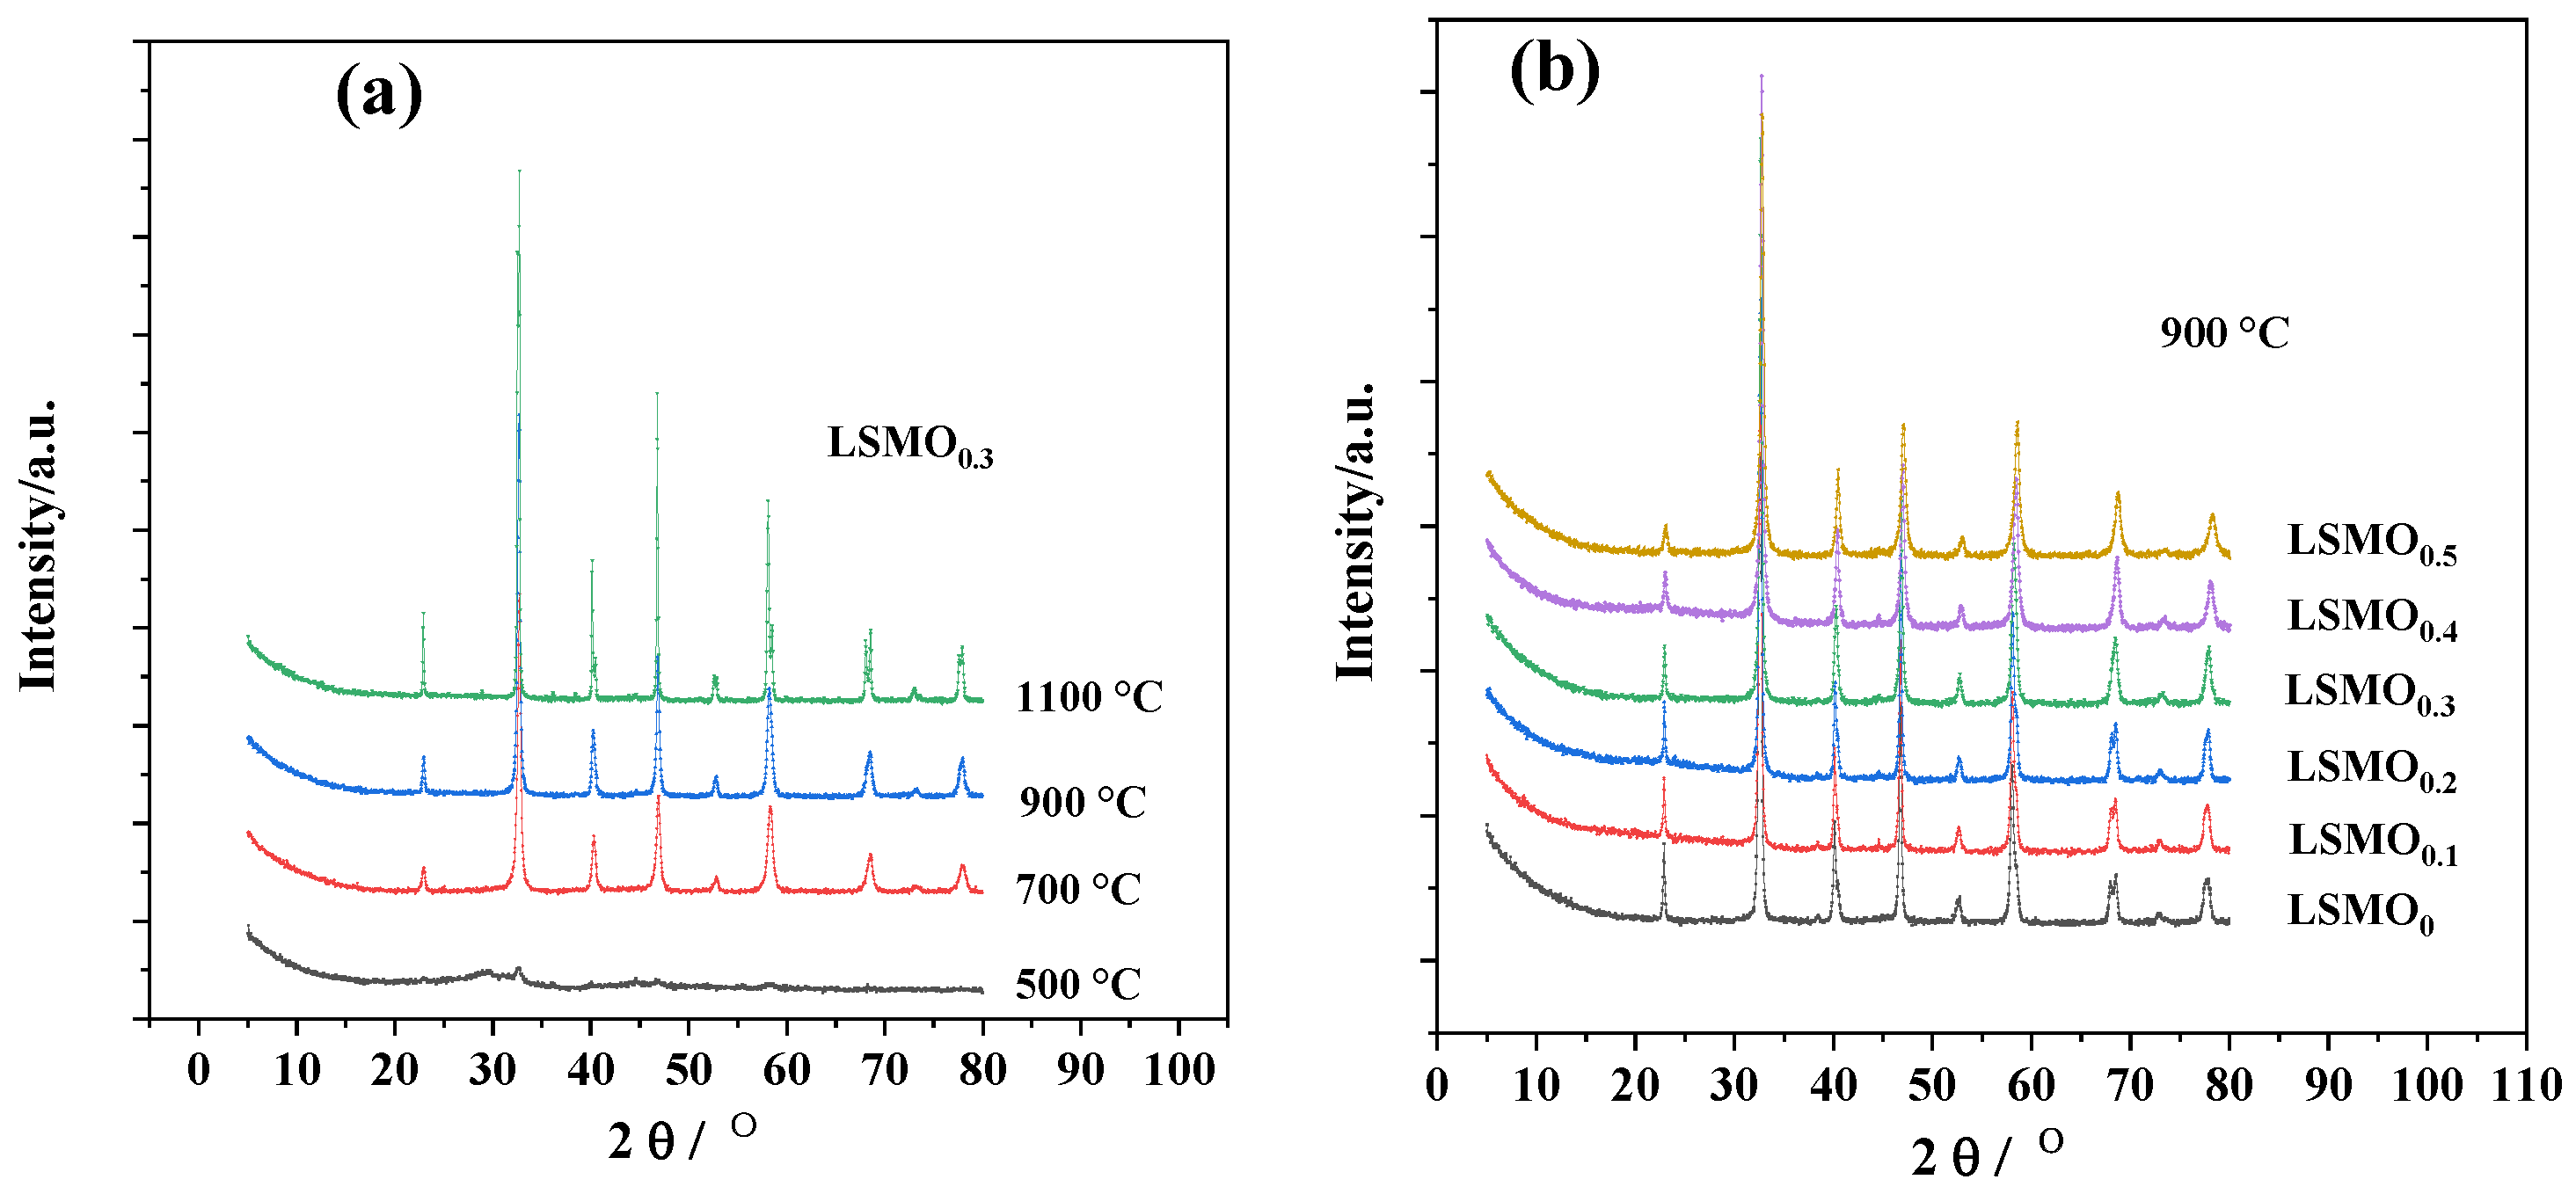
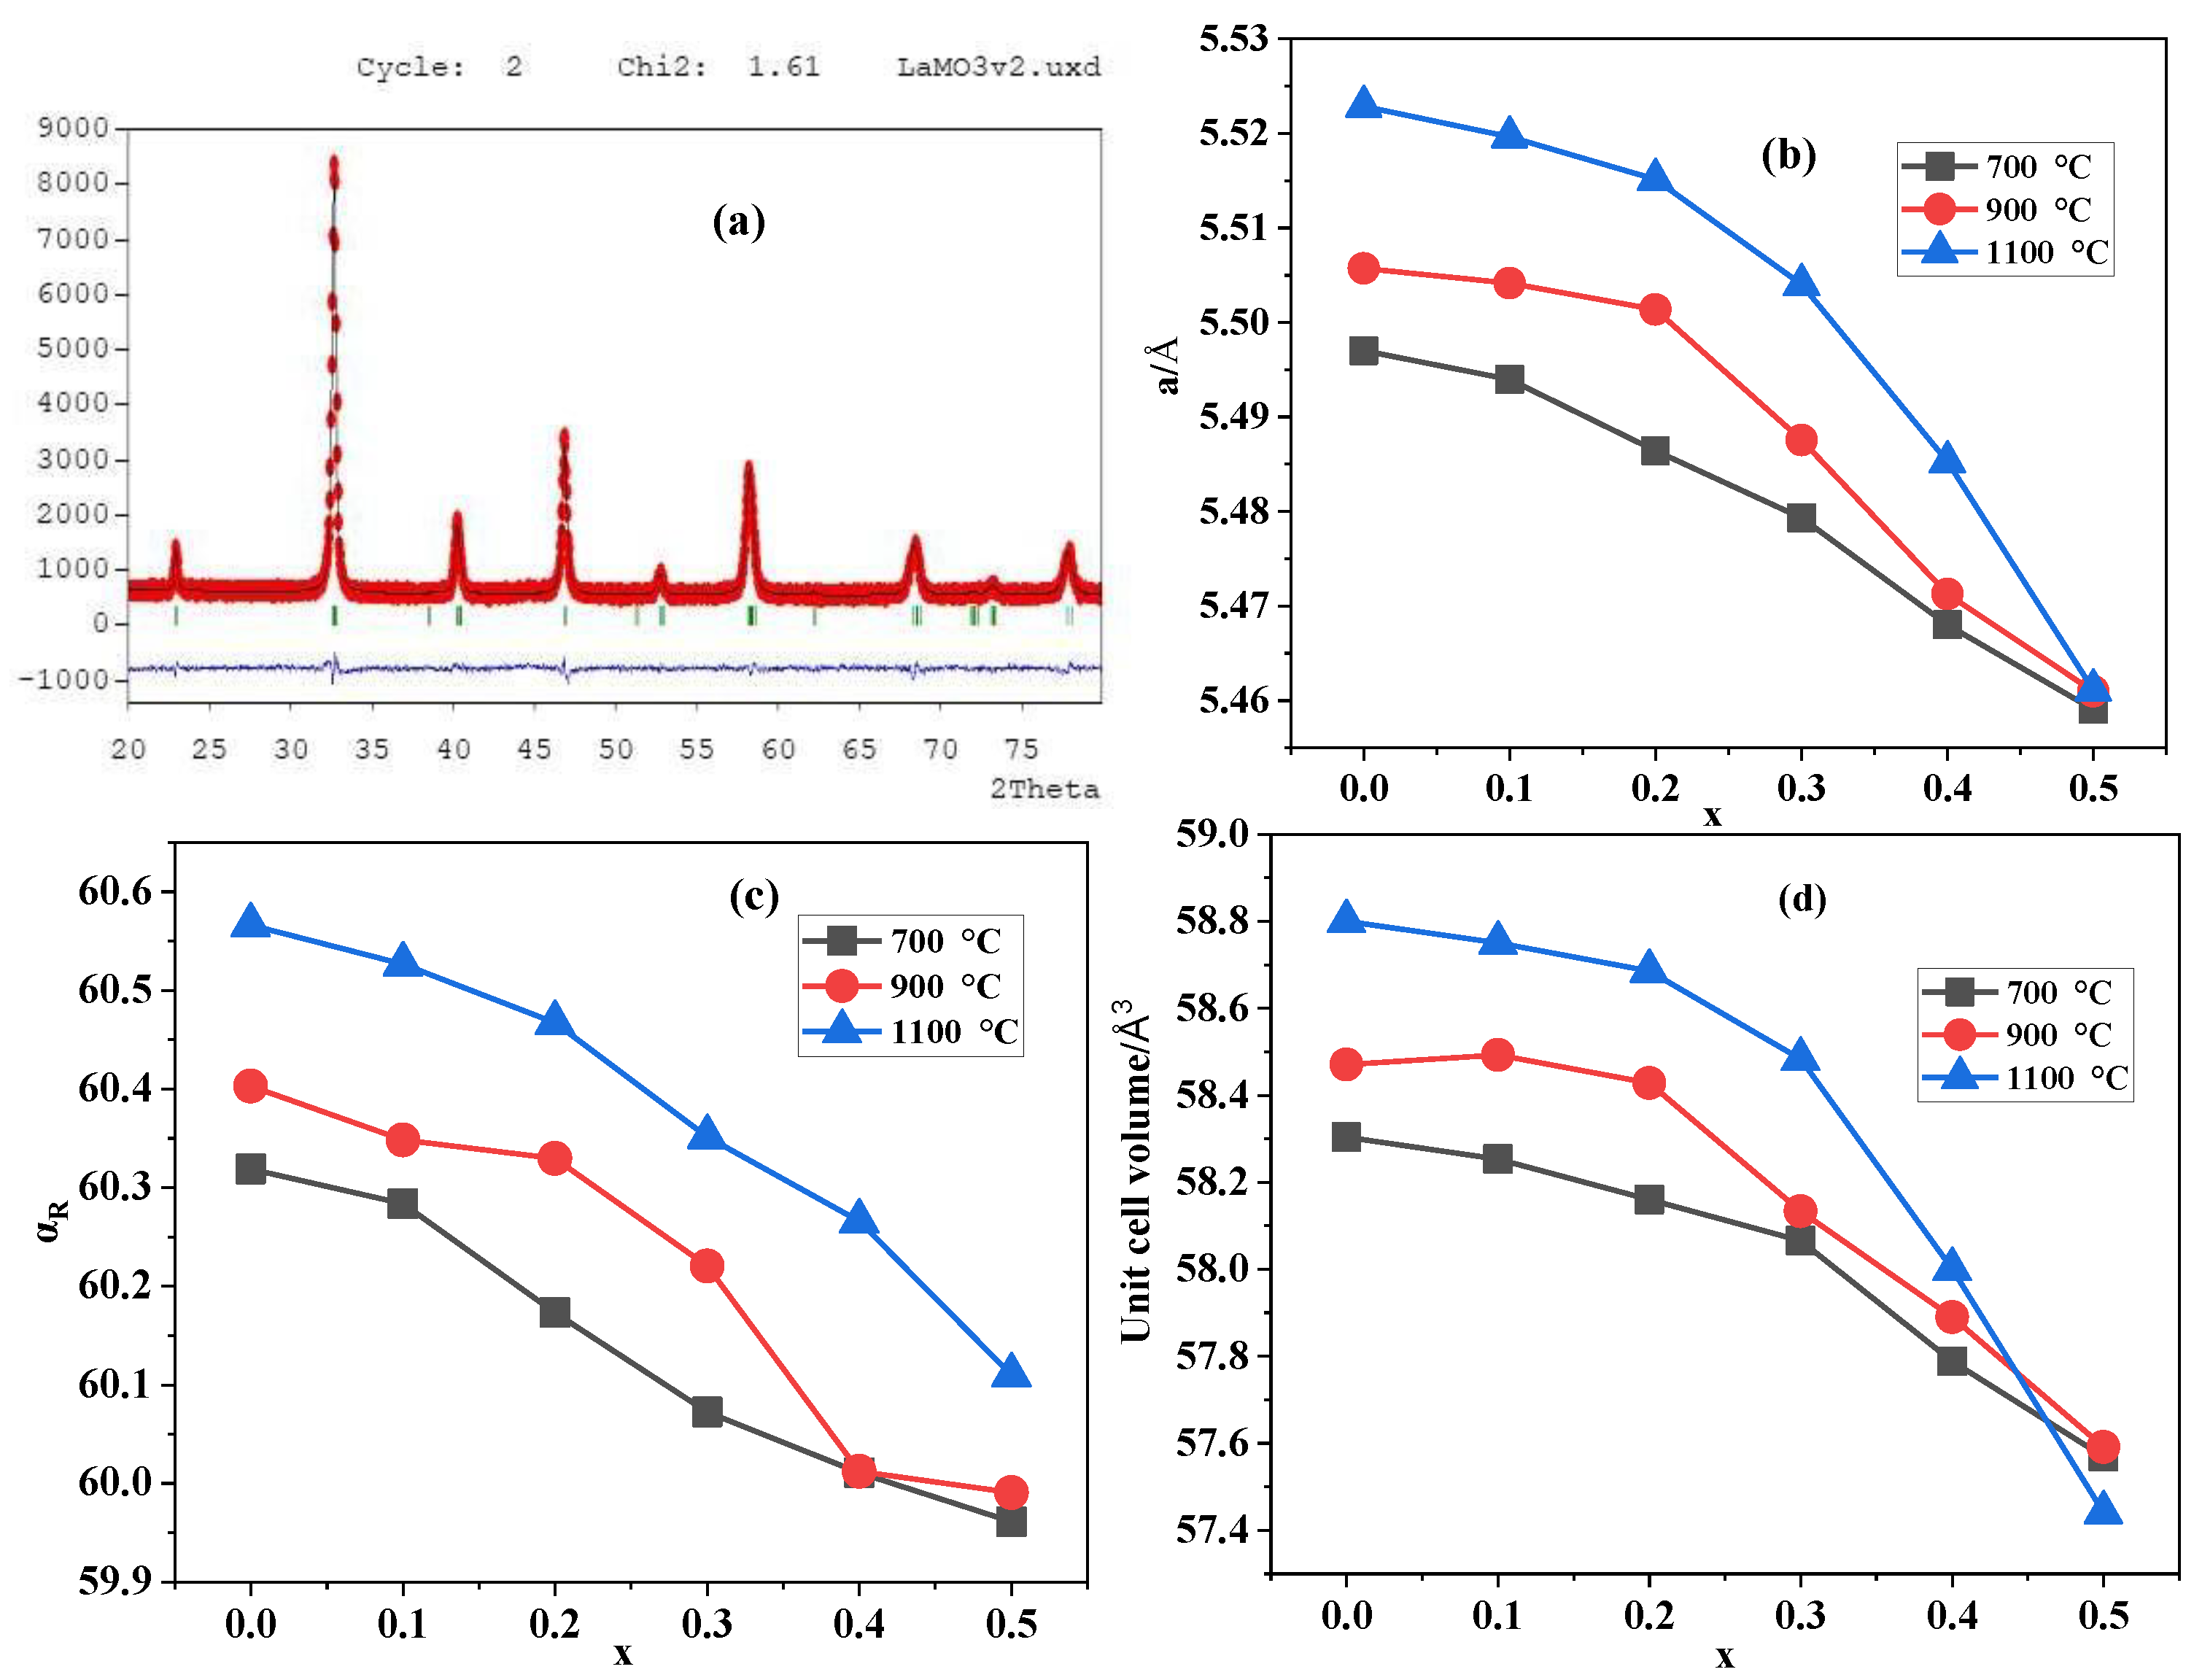
3.1. The Physical Characterization of the LSMOx

The precursors with different ratios of doped strontium were calcined at different temperatures. The XRD patterns of LSMO0.3 calcined at different temperatures are shown in Figure 1a. At 500 °C, the obtained powder had not sufficiently crystallized. The required pure crystal phases were all obtained at the other three calcination temperatures. This is consistent with the work reported before [33]. The peak position is the same, but the peak shape becomes sharper with the increasing temperature of calcination, which indicates the particles are more effectively crystallized with larger diffraction domains. As shown in Figure 1b, with the variation in strontium substitution ratio, the patterns change slightly in terms of the peak position and shape. The peak positions shift a little to the large angle with strontium doping, indicating a distortion of the crystal structure or new crystal formation [34]. The undoped stoichiometric LaMnO3 should adopt an orthorhombic structure, which transforms to rhombohedral with strontium doping [24,35]. This is due to the Jahn–Teller distortion of the Mn3+ (3d4) ion, which transforms to the regular Mn4+ (3d3) ion upon doping with strontium. In our case, a cubic structure appears at both low (x = 0) and high (x = 0.5) strontium doping ratios after calcination in oxygen. Thus, the difference with the literature may be related to the oxygen over-stoichiometry in LaMnO3+δ, which changes the oxidation state of Mn3+ to Mn4+ similarly to strontium doping.
To obtain more accurate information about the unit cell from the XRD patterns, the Le Bail refinement was adopted when verifying the unit cell parameters. The rhombohedral structure was used as a reference structure for the Le Bail refinement since a cubic structure would be a special case of rhombohedron with either α = 90° (cubic P) or 60° (cubic F). The diffraction profiles of LSMOx obtained from the citrate solution process and calcination in oxygen were subjected to the Le Bail refinement using the open-source software, FullProf. The unit cell parameters can be obtained from the refinement as shown in Figure 2a. The refinements are based on the rhombohedral structure, where the main unit cell parameters are a, b, c (a = b). Unit cell volume and αR were also calculated.
The angle tends towards 60° upon strontium doping, as shown in Figure 2b, indicating a tendency to form a cubic structure. The cell volume decreases with the strontium doping, although the Shannon and Prewitt ionic radius in XII coordination of La3+ and Sr2+ are 1.32 Å and 1.44 Å, respectively. This indicates there is likely a higher oxidation state of Mn, with the substitution of lanthanum by strontium. Indeed, the cell parameter “a” of the structure relates to the Mn-O-Mn distances because the tolerance factor of the perovskite is below 1, and it decreases with Sr-doping, as presented in Figure 2c. In computational works [24], the unit cell volume is predicted to decrease with the increase in strontium doping, which is in accordance with this work, as presented in Figure 2d. The synthesis temperature also influences the cell parameters, whereby lower synthesis temperatures lead to smaller cell volumes, as shown in Figure 2d. This may be explained by oxygen over-stoichiometry in LaMnO3+δ. Note that the oxygen excess is related to the presence of cation vacancies in the unit cell, and the true chemical formula should be written as La3/3+δMn3/3+δO3, equivalent to La1−yMn1−yO3, and oxygen over-stoichiometry thus decreases the unit cell density.

3.2. Reproducibility of the Electroactivity Characterization

Because the CV or LSV is a sensitive measurement, subtle changes may cause big differences in the results. To ensure that all the data for analysis and comparison are as accurate as possible, the effects of the imperceptible elements that may influence the reproducibility of the experiments, including the manner of mixing the ink components and the drop volume, are presented particularly. The explanations of elements that affect the CV shape are also presented in detail, e.g., other redox reaction peaks except those from ORR, the diffusion current, the capacitive current, etc., which are seldom referred to in articles though appear quite often during experiments.
While analyzing ORR from the cyclic voltammograms of RDE, the primary aim is to anchor the current peak from ORR. By changing the atmosphere in the electrolyte from N2 to O2, and turning back to N2 again, the peak position for ORR can be located. As shown in Figure 3a, when bubbling O2 into the electrolyte, a reductive current is exhibited. Then, changing N2 to O2, the reductive current vastly decreases, and with more scans under N2 bubbling, the reductive current decreases further. Once the atmosphere is turned back to O2, the reductive current appears again immediately, and with more scans, it approaches the first scan. Thus, it is certain that the reductive peak is from ORR.
Besides deionized water, 2-propanol (from Sigma-Aldrich) was also selected for use as a solvent in preparing ink due to its wide application, and Figure 3b shows the comparison between the cyclic voltammograms of water and 2-propanol as solvents. As can be seen, the deionized water has a similar effect to 2-propanol, indicated by the closely matched curves. In particular, the ink prepared using deionized water exhibits a slightly more positive onset potential. Thus, the deionized water was chosen as the solvent in this series of experiments.
The mature electrocatalyst for ORR Pt was also tested and compared with LSMOx. Instead of adding 75 mg LSMOx to the mixture, 75 mg Pt/C (10 wt. % loading, matrix activated carbon support, from Sigma-Aldrich) was used as the active component in ink. Their cyclic voltammograms are presented in Figure 3c. Considering the electrocatalytic activity of Pt and LSMO0.3 individually, Pt is still more effective although the difference is only slight in view of the onset potential. When taking cost into account, Pt is not appealing, being almost 10 times higher in cost than LSMO. Therefore, LSMOx is selected for the case study and is appropriate and reliable.

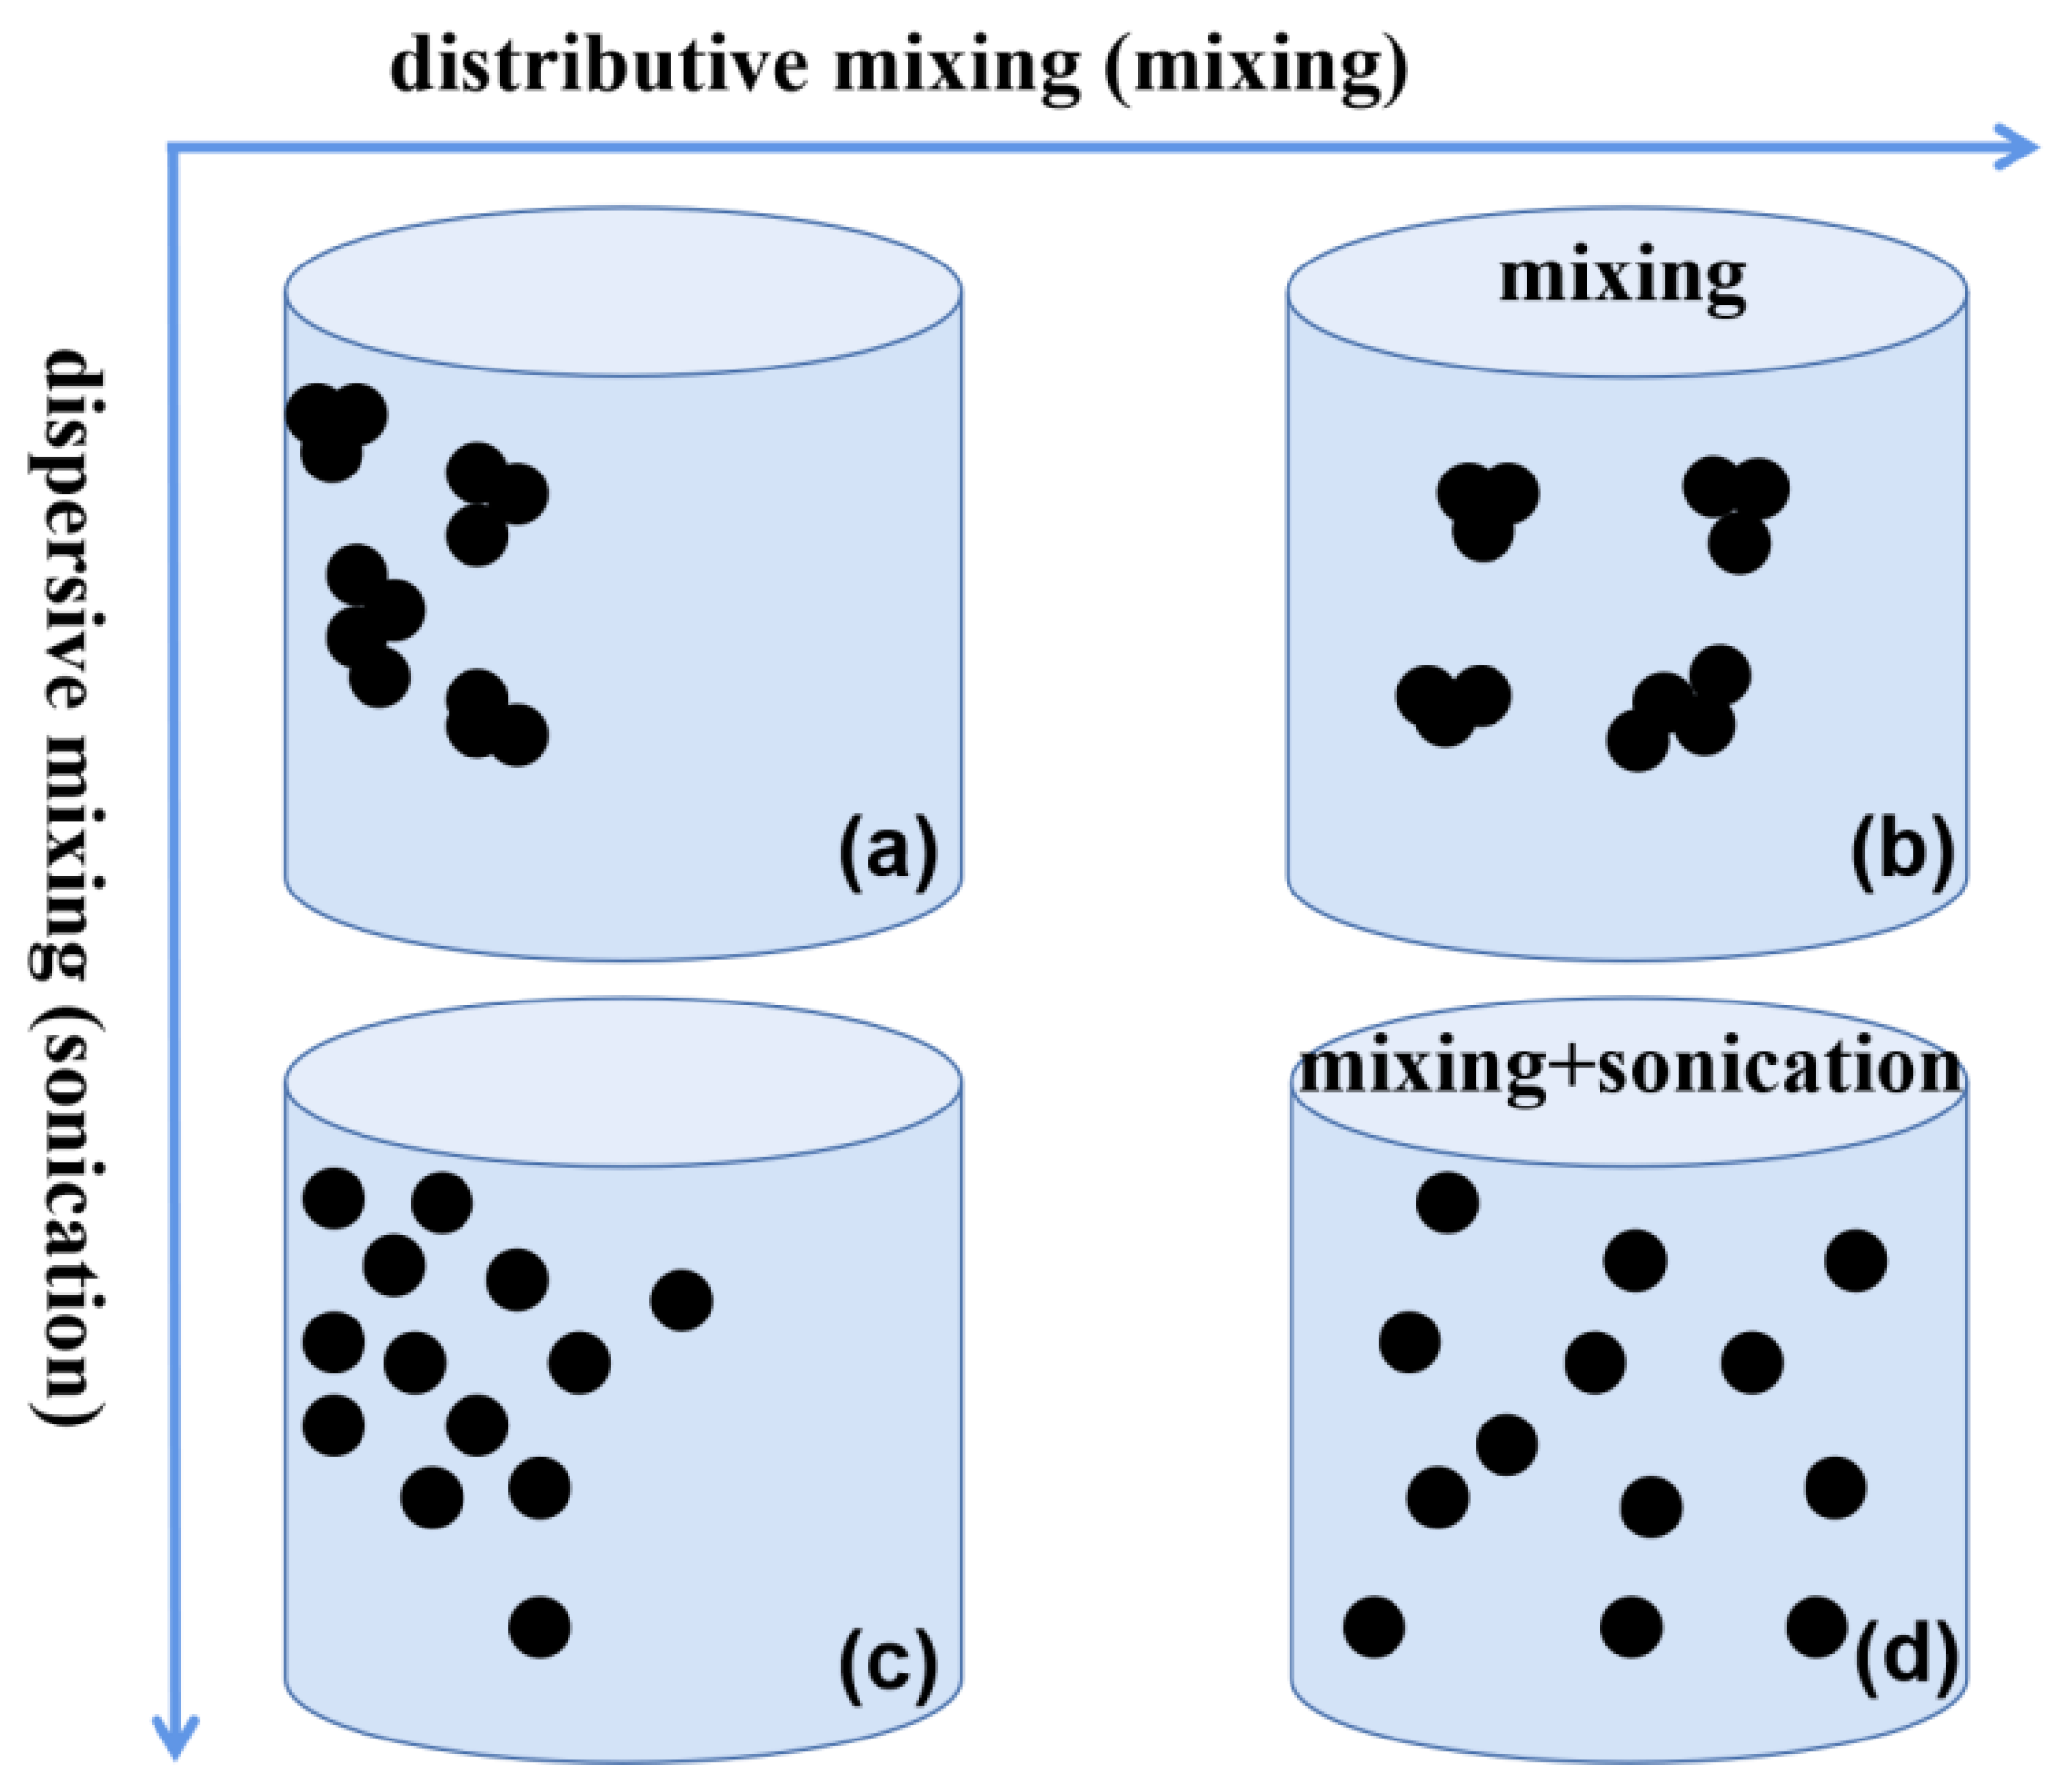
3.2.1. The Effect of the Manner of Mixing Ink

In this case, homogeneous mixing was conducted using a motor ultraturrax (XENOX MHX/E, IKA, Staufen, Germany) and sonication with an ultrasonic processor UP100H (100 W, 30 kHz from Hielscher, Teltow, Germany). The duration of rotor ultraturax mixing needed to obtain a homogeneous state was 5 min, and sonication lasted for 2 min, after which the particles in the ink were well-broken and the solvent was not so hot that it evaporated. The ink was immediately dropped onto the disk electrode after the sonication to avoid heterogeneity caused by further settlement.
To demonstrate the effect of sonication on the dispersion of the catalyst in the water, Figure 3d shows the cyclic voltammograms obtained using 5 µL of the same ink without and with sonication for 2 min. We can observe that the ink obtained from simple mixing shows a much larger capacitive effect than that after sonication. This shows the importance of the two types of distributive mixing (homogeneous mixture of carbon, polymer binder and catalyst) obtained by the ultraturrax and dispersive mixing (breaking the catalysts into smaller grains) obtained by sonication.
To illuminate the difference generated by the mixing manner, a simple illustration is presented in Figure 4. The horizontal direction represents mixing and the vertical direction represents sonication. With only mixing, the particles could be distributed as in Figure 4b. Under both mixing and sonication, the particles would be further dispersed as in Figure 4d. If the particles are aggregated, they may form many micro local capacitors created by close but not contacted particles during film formation. In this case, the capacitance would be great.

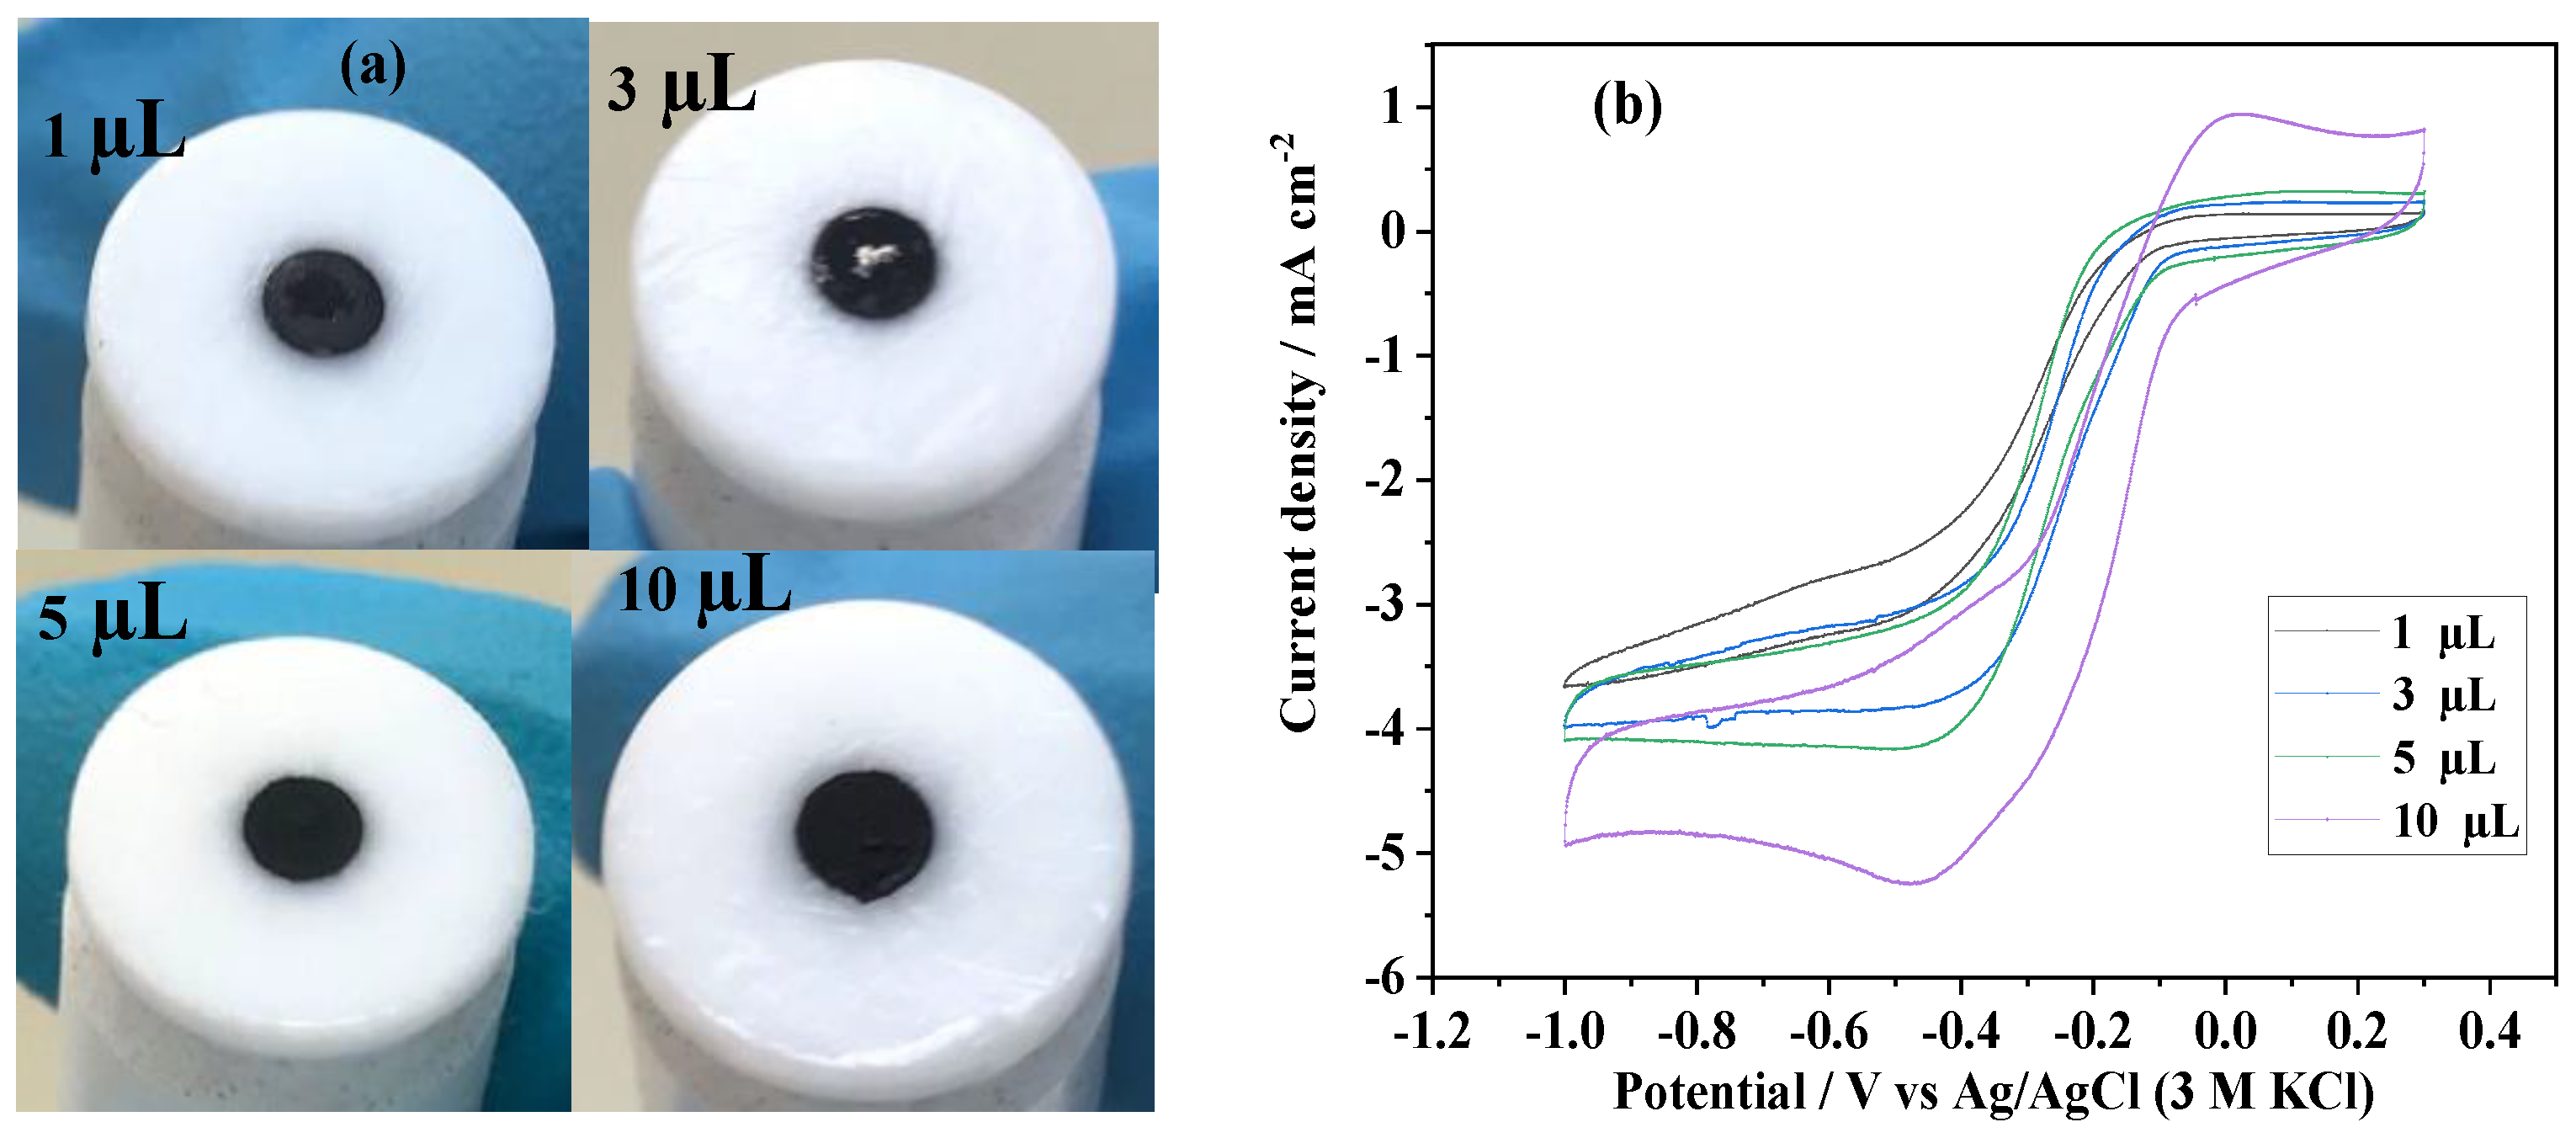
3.2.2. The Effect of Ink Drop Volume on RDE

It was found that drop volume has a big influence on the cyclic voltammogram, especially for the limiting current plateau and the onset potential of ORR. The ink containing 75 mg LSMO0.3, 15 mg VXC-72, and 15 mg Nafion dispersed in 6 mL deionized water was used in the study. Drop volumes between 1 µL and 10 µL were tested. The corresponding pictures of the electrodes with different drop volumes of the well-mixed ink are shown in Figure 5a. As can be seen from the pictures, the surface of the RDE could not be fully covered by the 1 µL drop, and the cyclic voltammogram presents the effect of glassy carbon on ORR, and the diffusion current plateau is not obtained because of the direct exposure of glassy carbon to the electrolyte, which exhibits electroactivity for ORR [10], and is also demonstrated in the following experiments. The coverage increased with a 3 µL drop of ink but was still not complete. The limiting current plateau was more closely approached while a slight decreasing tendency is still observed, which is attributed to the exposed glassy carbon. Further increasing the drop volume to 5 µL seems to have had the most appropriate result concerning both full electrode coverage and the diffusion thickness. When the drop volume increased to 10 µL, the glassy carbon tip was totally covered and the film was so thick that the oxygen diffusion rate was not adequate in supporting sufficient oxygen transfer to the glassy carbon, which resulted in less current with more negative potential, as seen in Figure 5b, with the curve showing a tendency to increase. In addition, these different loadings of ink on the disk show different capacitive effects exhibited in potential range of 0–0.3 V, as presented in Figure 5b. Generally, the higher the loading, the higher the capacitive current. They exhibit nearly the same limiting current within 5 µL loading. Therefore, a drop volume of 5 µL is a good choice for the electrochemical measurements in this study.

3.2.3. The First Scan of CV Test

In cyclic voltammetric experiments, the first scans are observed to be quite different from the subsequent scans, although this has been barely discussed in articles. LSMO0.3 synthesized from a citrate solution process under calcination at 900 °C in oxygen was used for the scans. The ink was composed of 75 mg LSMO0.3, 15 mg VXC-72, and 15 mg Nafion in 6 mL deionized water (5:1:1 in mass ratio) that had been mixed for 5 min and sonicated for 2 min. Before re-utilization of the same ink for other CV tests, mixing for 3 min was applied every time. The voltammetry was performed without rotation as seen in Figure 6a,b. In every scan, there are two clear cathodic peaks during the scan toward the negative potential, and two anodic peaks during the first positive scan in O2 saturated electrolyte. Moreover, there is big difference between the first cathodic peaks in the first and the second scan (and following scans), as seen in Figure 6b. The sharp reduction peak slowly disappears in the second and following scans. The first cathodic peak disappears in N2 saturated electrolyte, as observed in both Figure 6a,b, which indicates that the first cathodic peak is associated with the oxygen reduction reaction. This transitory peak is probably linked to pre-adsorbed species on the dry ink.
The second cathodic peak is also different between the first scan and the others, either in N2 or O2 saturated electrolyte. Generally, after the first scan, the second cathodic peak is in a more positive location, whereas with subsequent scans, the potential location barely changes. The second cathodic peak is reported to correspond to the first anodic peak during the positive scan [36]; they are Mn3+ reduction to Mn2+ and Mn2+ oxidation to Mn3+, respectively. It may also be attributed to the high oxygen coverage on the surface of the dry ink, which needs more overpotential for reduction. The second anodic peak does not seem to be affected by the gas atmosphere in the electrolyte; its position moves towards positive potentials with a change in atmosphere when using the same electrode. This may be due to OH being oxidized to HO2. When the atmosphere is changed either from O2 to N2 or from N2 to O2, there is progressive OH desorption from the electrode surface to the electrolyte. In the meantime, OH in the electrolyte is also transported near to the surface of the electrode, which results in higher overpotential as well as a slightly higher current. The first cathodic peak is related to oxygen reduction, as rationalized above, due to the necessary presence of oxygen bubbling. Concerning which component in the ink plays this role, other inks containing different components have been also studied, as shown in Figure 6c,d. The corresponding components and results are as below:
-
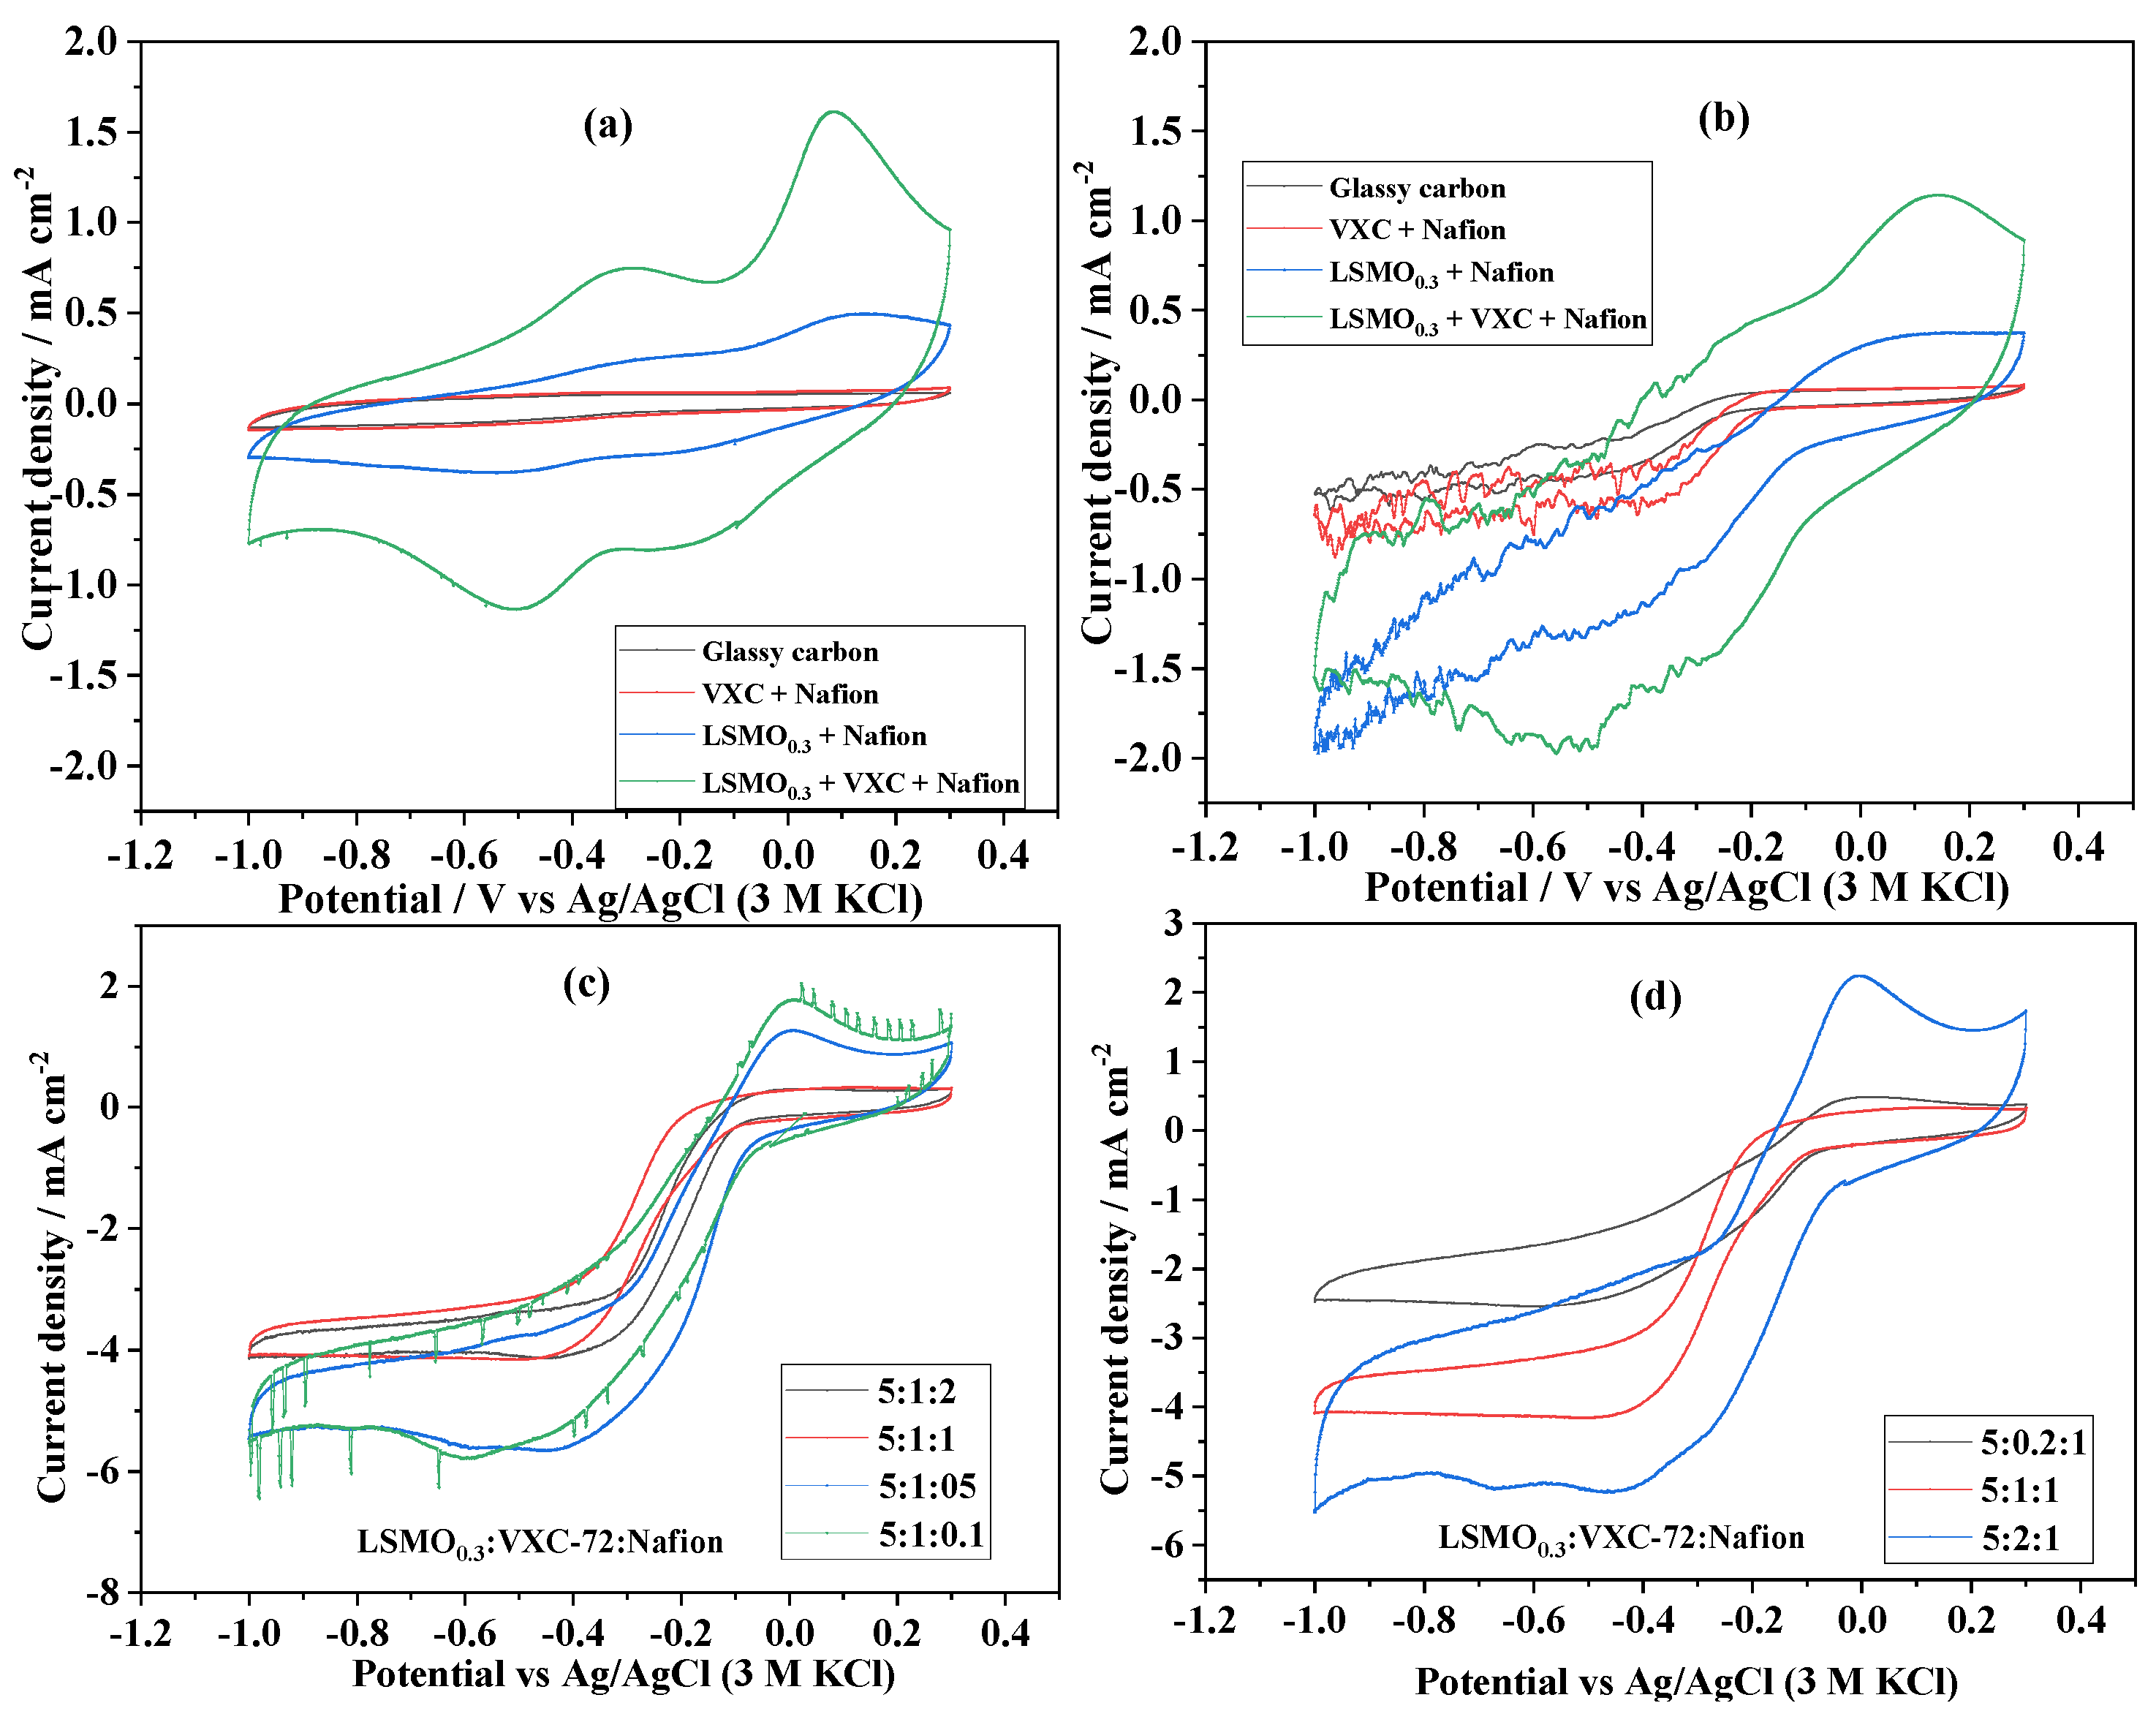
Without VXC-72 in the ink, the first and second cathodic peak seem to integrate into one broad peak. The onset potential is slightly more negative than for VXC-72 in the ink.
-
Without LSMO0.3 in the ink, there is only one sharp cathodic peak corresponding to the first cathodic peak in the case of LSMO0.3 in the ink. The onset potential is more negative, namely there is more overpotential, which also demonstrates that the VXC-72 alone has catalytic activity for oxygen reduction, though lower than that of LSMO0.3.
-
The situation is similar for bare glassy carbon which also has a weak oxygen reduction activity.
As for the two anodic peaks, they are undoubtedly associated with LSMO0.3 because they are not observed when it is not present. Hence, the sharp reduction in peak does not seem to be specific to the LSMO catalysts because it is observed with the carbon alone. However, it changes in the presence of LSMO and there is a synergic effect due to both carbon and LSMO, as also evidenced in former works [10,11,13,20].
To avoid this transitory effect, the data from the second scan were exclusively used. It is worth mentioning that the corresponding peaks on cyclic voltammograms would be visually different when the RDE is under a rotating state. The peak current obtained from ORR far outweighs the peak currents indexed to other reactions mentioned above, owing to the enhancement of the mass transport of oxygen via rotation. This may make peaks disappear visually, although the reactions should still exist.

3.3. The Comparison of the Electroactivity of the LSMOx

3.3.1. Effect of the Ink Composition and Formulation

The effects of carbon and catalyst were separately tested with the CV measurement. Three inks were prepared:
-
75 mg LSMO0.3 + 15 mg VXC-72 + 15 mg Nafion, i.e., the complete formulation
-
75 mg LSMO0.3 + 15 mg Nafion, i.e., no carbon
-
15 mg VXC-72 + 15 mg Nafion, i.e., no catalyst
Figure 7a,b show the three electrodes using the above-mentioned inks and the bare glassy carbon under N2 and O2 bubbling, respectively. The fluctuations are sometimes caused by the oxygen bubbling when the RDE is in a static station shown in Figure 7b. Under N2 bubbling, it is observed that glassy carbon and VXC-72 show a slight capacitive effect. LSMO0.3 exhibits a large capacitive effect, which is further enhanced by the presence of VXC-72, probably due to its high conductivity. We may speak of the pseudo-capacitive effect because it is superimposed with oxidation and reduction peaks. When VXC-72 is added, all the redox reactions on LSMO0.3 are also sharper, with evident redox peaks, which is owing to the conductivity increased due to VXC-72. Under O2 bubbling, all samples show a reductive current below −0.2 V vs. Ag/AgCl but the reductive current is much higher (more negative) with the catalyst alone and maximal with the catalyst–carbon mixture.
Varying the content of Nafion or VXC-72 in the ink also generates an enormous difference, as shown in Figure 7c,d. High loading of VXC-72 or low loading of Nafion causes the cyclic voltammograms to become much broader, which is indicative of a higher capacitive effect. Less VXC-72 content may contribute to lower electronic conductivity, which results in a lower limiting current density and lower oxygen reduction activity. When there is insufficient Nafion to allow the materials to bind well to the disk, the result is seen as fluctuations in the cyclic voltammograms.

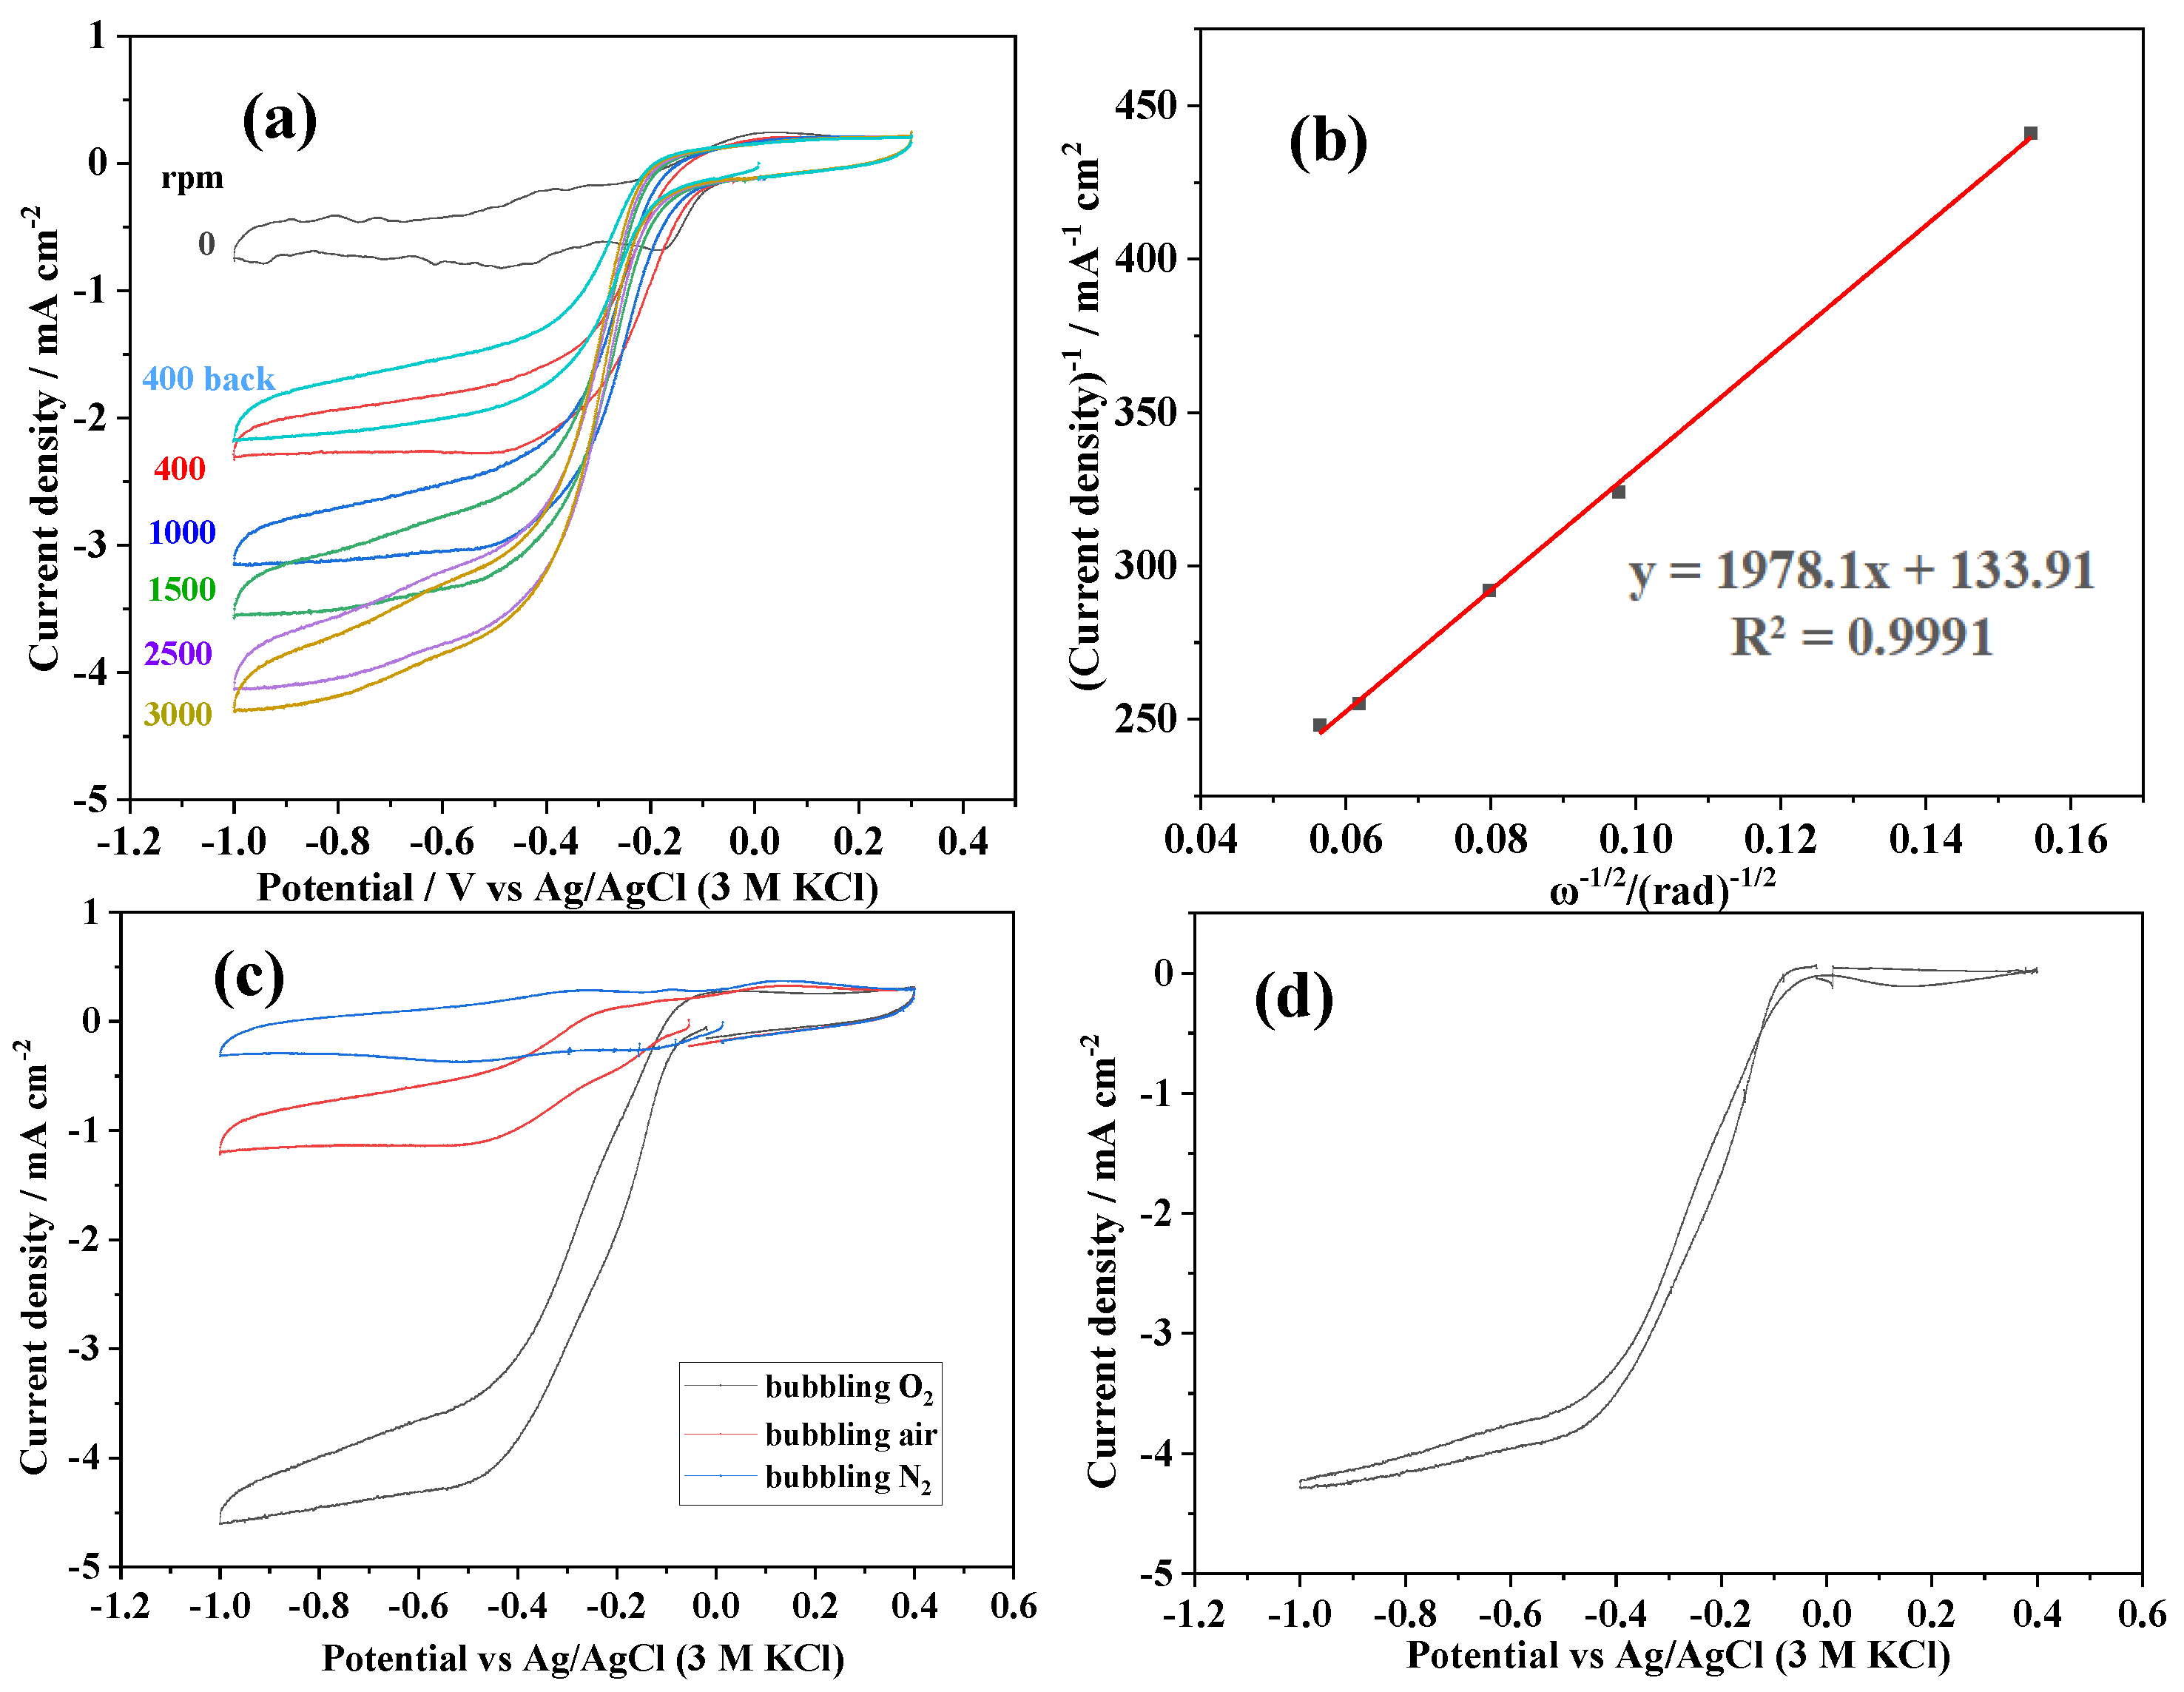
3.3.2. Koutecký–Levich Analysis

The rotating rates were increased from 0 to 3000 rpm, and back to 400 rpm to check the reversibility and the loss of powder, as shown in Figure 8a. Indeed, a high rotation rate may result in the loss of powder from the ink deposit. If the current returns to its original value, however, this is proof that material loss did not occur. Indeed, there is always a loss of reactivity with progressive cycles, as seen from the change in the onset potential of ORR. The ORR reduction curves show an expected increase in the reduction current as a function of the rotation of the disk electrode, as shown in Figure 8a. There is a plateau below −0.6 V, which is related to the limiting current by the convection of oxygen species. The limiting current plateau is barely achieved, and this may be due to diffusion of the species in the thickness of the electrode as well as some other redox reactions appearing at lower potentials. In addition, if the rotating rate is too high, there may be material loss, resulting in glassy carbon being exposed to the electrolyte, which also generates a continuous decrease in current with potential. This phenomenon is also seen when the rotating rate returns to 400 rpm, where not only the onset potential changes, but also the limiting current changes. With the first scan at 400 rpm, the limiting current plateau is achieved, whereas, when scanning back to 400 rpm, the current continuously decreases with potential.
The current density at −0.7 V vs. Ag/AgCl as a function of ω1/2 (ω is the rotating rate in unit of rad) is plotted in Figure 8b. A very good linear relationship is observed between i−1 and ω−1/2 based on the Koutecký–Levich analysis; the slope is as below [5,37], and the electron transfer number can be calculated:
Slope = (0.62nFADo2/3ν−1/6Co)−1
where F is the faradaic constant 96,485 C mol−1, Do is the oxygen diffusion coefficient and is 2.1 × 10⁻⁵ cm2 s−1, ν is the kinetic viscosity of electrolyte and is 0.01 cm2 s−1, and Co is the concentration of oxygen in electrolyte and is 1.3 × 10⁻⁶ mol cm−3), such that the electron transfer number n is calculated as 3.96. Thus, the ORR should follow a four-electron route:
O2 + H2O + 4 e → 4 OH
By bubbling pure oxygen (1 atm of O2) or air (0.2 atm of O2) into the electrolyte, we should expect a ratio of 1/5 in the limiting current. Figure 8c further demonstrates that the limiting current density is clearly related to oxygen pressure. It is −4.5 mA cm−2 for oxygen gas and −1 mA cm−2 for air bubbling. This again shows that the reductive current peak is from ORR.

3.3.3. Proposition of Net Electroactivity Comparison

If there is only an electric double layer capacitive effect, there should only be a rectangle shape without bumps on the curves. In our case, small bumps on the curve can be seen around 0 V vs. Ag/AgCl (3 M KCl) even under N2 bubbling, as shown in Figure 8a, which indicates the existence of redox reactions resulting in the presence of a pseudo-capacitive current. Under N2 bubbling, the current measured on RDE is from the non-faradaic current and surface redox reaction without ORR. While bubbling O2, the current from ORR is also added. It is plausible that the net electroactivity of the LSMOx towards ORR could be obtained via the difference in the current measured under O2 vs. under N2 bubbling, with an example shown in Figure 8d, where the current obtained under N2 bubbling is subtracted from that under O2 bubbling in the case of Figure 8c. The LSMOx calcined at different temperatures and those with different Sr doping ratios are compared in this way, as shown in Figure 9a,b, which are taken from the negative scan part of the cyclic voltammograms (the original cyclic voltammograms of LSMOx are presented in Figure 9c with varying x and Figure 9d with varying calcination temperatures). It can be seen that lower Sr doping ratios (LSMO0 and LSMO0.1) result in lower electroactivity of ORR catalysis, and there is similar activity when x = 0.2–0.5. Concerning LSMO0.3 calcined at different temperatures, the similarity of the electroactivity toward ORR is also noted with a slight advantage (an onset potential that is ~10 mV more positive) in the case of 700 °C. Table 1 lists the experimental conditions and the corresponding results of RDE tests of La1−xSrxMnO3 on ORR. Due to the inconsistent experimental conditions and comparative methods, the results vary. However, concerning the onset potential, this work is in between references [27,38], though closer to [38] with a difference of near 30 mV. In addition, all the work claimed the four-electron ORR route.

4. Conclusions

The reproducibility of the electroactivity measurement of LSMOx is so sensitive that care should be taken in every step, since it may result in big differences. Even imperceivable differences in the mixing manner during ink preparation and the drop volume on the tip of the RDE could generate completely different cyclic voltammograms far away from those reported in references. Their importance to the results is presented in this article, and the corresponding explanations are provided. An electronic mixer is not sufficient to break and homogeneously disperse solid powders in the solvent water such that they gather unevenly on the surface of RDE and loosely contact each other, generating a significant capacitive effect and appearing in the cyclic voltammogram as a broad shape rather than a sigmoid. Additionally, the drop volume on the tip likely plays a role in the capacitive effect. Too little volume of drop results in a bare surface of glassy carbon in the electrolyte, which also has an electrocatalytic effect in ORR, and because there is no mass transport resistance between the O2 and the glassy carbon surface, the limiting current part on its cyclic voltammograms are usually not a plateau but have a decreasing tendency at a more negative potential, indicating that there is direct contact between the reactants, namely O2 and glassy carbon. On the other hand, an excessive drop on the tip may entirely cover the surface of the RDE, and the film may nevertheless be too thick, resulting in excessive resistance for O2 to transport to the surface, as well as a significant capacitive effect, which manifests as a big rectangle shape in cyclic voltammograms. With the appropriate volume on the tip, the limiting current plateau is clearly seen, and the capacitive effect is not too evident, and a 5 μL drop was found to be the optimal choice in this work.
The different capacitive effect of perovskite oxides with different strontium doping ratios or calcination temperatures makes it difficult to compare their electrocatalytic activity, and directly comparing the onset potential of ORR results in inaccuracies. This phenomenon is seldom addressed in the literature. The capacitive effect is little emphasized in articles, and even exists in the case of the most reported perovskite catalysts. In this work, a simple way to compare the net electroactivity is proposed, with the case study conducted on LSMOx perovskite oxides. It is shown that lower calcination temperatures may result in a slightly increased electroactivity, and when x = 0 and x = 0.1, the electrocatalytic activity is evidently lower than that when x = 0.2 to 0.5, and it increases with x. However, it remains similar when x is above 0.2, which is different from previous reports. Calcination temperature has little influence on the electroactivity of LSMO0.3 toward ORR. Therefore, the importance of ensuring the cyclic voltammogram is capable of comparing different electrocatalysts for ORR depends on the reproducibility of the experiments and comparative approach using the RDE measurement. This work shed light on the individuality of each electrocatalyst system on ORR while adopting the RDE method for comparing their electrocatalytic activity. Polarization curves should not be compared as obtained before removing the pseudo-capacitive current. This is especially highlighted for those who are new to the field of ORR to spare them from becoming lost in the enormous volume of studies.

Funding

The author wishes to express gratitude for the financial support from Hubei Polytechnic University (Grant 22xjz04R).

Conflicts of Interest

The authors declare no conflict of interest.

Abbreviations

ORRoxygen reduction reaction
RDErotating disk electrode
LSVlinear sweep voltammetry
CVcyclic voltammetry
LSMOxLa1−xSrxMnO3

References

  1. Dai, Y.; Yu, J.; Cheng, C.; Tan, P. Ni, Mini-review of perovskite oxides as oxygen electrocatalysts for rechargeable zinc–air batteries. Chem. Eng. J. 2020, 397, 125516. [Google Scholar] [CrossRef]
  2. Chu, W.; Higgins, D.; Chen, Z.; Cai, R. Non-precious Metal Oxides and Metal Carbides for ORR in Alkaline-Based Fuel Cells. In Non-Noble Metal Fuel Cell Catalysts; Chen, Z., Dodelet, J., Zhang, J., Eds.; Wiley: Hoboken, NJ, USA, 2014; pp. 357–388. [Google Scholar]
  3. Schmidt, T.J.; Gasteiger, H.A.; Stäb, G.D.; Urban, P.M.; Kolb, D.M.; Behm, R.J. Characterization of high-surface-area electrocatalysts using a rotating disk electrode configuration. J. Electrochem. Soc. 1998, 145, 2354. [Google Scholar] [CrossRef]
  4. Paulus, U.A.; Schmidt, T.J.; Gasteiger, H.A.; Behm, R.J. Oxygen reduction on a high-surface area Pt/Vulcan carbon catalyst: A thin-film rotating ring-disk electrode study. J. Electroanal. Chem. 2001, 495, 2134–2145. [Google Scholar] [CrossRef]
  5. Suntivich, J.; Gasteiger, H.; Yabuuchi, N.; Shao-Horn, Y. Electrocatalytic Measurement Methodology of Oxide Catalysts Using a Thin-Film Rotating Disk Electrode. J. Electrochem. Soc. 2010, 157, B1263–B1268. [Google Scholar] [CrossRef]
  6. Stoerzinger, K.; Lü, W.; Li, C.; Ariando; Venkatesan, T.; Shao-Horn, Y. Highly Active Epitaxial La(1–x)SrxMnO3 Surfaces for the Oxygen Reduction Reaction: Role of Charge Transfer. J. Phys. Chem. Lett. 2015, 6, 1435–1440. [Google Scholar] [CrossRef] [PubMed]
  7. Suntivich, J.; Gasteiger, H.; Yabuuchi, N.; Nakanishi, H.; Goodenough, J.; Shao-Horn, Y. Design principles for oxygen-reduction activity on perovskite oxide catalysts for fuel cells and metal–air batteries. Nat. Chem. 2011, 3, 546–550. [Google Scholar] [CrossRef] [PubMed]
  8. Imaizumi, S.; Shimanoe, K.; Teraoka, Y.; Yamazoe, N. Oxygen Reduction Property of Ultrafine LaMnO3 Dispersed on Carbon Support. Electrochem. Solid-State Lett. 2005, 8, A270. [Google Scholar] [CrossRef]
  9. Kéranguéven, G.; Royer, S.; Savinova, E. Synthesis of efficient Vulcan–LaMnO3 perovskite nanocomposite for the oxygen reduction reaction. Electrochem. Commun. 2015, 50, 28–31. [Google Scholar] [CrossRef]
  10. Poux, T.; Napolskiy, F.; Dintzer, T.; Kéranguéven, G.; Istomin, S.; Tsirlina, G.; Antipov, E.; Savinova, E. Dual role of carbon in the catalytic layers of perovskite/carbon composites for the electrocatalytic oxygen reduction reaction. Catal. Today 2012, 189, 83–92. [Google Scholar] [CrossRef]
  11. Ge, X.; Du, Y.; Li, B.; Hor, T.; Sindoro, M.; Zong, Y.; Zhang, H.; Liu, Z. Intrinsically conductive perovskite oxides with enhanced stability and electrocatalytic activity for oxygen reduction reactions. ACS Catal. 2016, 6, 7865–7871. [Google Scholar] [CrossRef]
  12. Miyahara, Y.; Miyazaki, K.; Fukutsuka, T.; Abe, T. Influence of Surface Orientation on the Catalytic Activities of La0.8Sr0.2CoO3 Crystal Electrodes for Oxygen Reduction and Evolution Reactions. ChemElectroChem 2016, 3, 214–217. [Google Scholar] [CrossRef]
  13. Miyahara, Y.; Miyazaki, K.; Fukutsuka, T.; Abe, T. Catalytic roles of perovskite oxides in electrochemical oxygen reactions in alkaline media. J. Electrochem. Soc. 2014, 161, F694. [Google Scholar] [CrossRef]
  14. Elumeeva, K.; Masa, J.; Sierau, J.; Tietz, F.; Muhler, M.; Schuhmann, W. Perovskite-based bifunctional electrocatalysts for oxygen evolution and oxygen reduction in alkaline electrolytes. Electrochim. Acta 2016, 208, 25–32. [Google Scholar] [CrossRef]
  15. Athayde, D.; Souza, D.; Silva, A.; Vasconcelos, D.; Nunes, E.; da Costa, J.D.; Vasconcelos, W. Review of perovskite ceramic synthesis and membrane preparation methods. Ceram. Int. 2016, 42, 6555–6571. [Google Scholar] [CrossRef] [Green Version]
  16. Sun, C.; Alonso, J.; Bian, J. Recent Advances in Perovskite-Type Oxides for Energy Conversion and Storage Applications. Adv. Energy Mater. 2021, 11, 2000459. [Google Scholar] [CrossRef]
  17. Xu, X.; Wang, W.; Zhou, W.; Shao, Z. Recent advances in novel nanostructuring methods of perovskite electrocatalysts for energy-related applications. Small Methods 2018, 2, 1800071. [Google Scholar] [CrossRef]
  18. Xu, X.; Su, C.; Shao, Z. Fundamental Understanding and Application of Ba(0.5)Sr(0.5)Co(0.8)Fe(0.2)O(3-δ) Perovskite in Energy Storage and Conversion: Past, Present, and Future. Energ. Fuel 2021, 35, 13585–13609. [Google Scholar] [CrossRef]
  19. Zhang, X.; Xu, X.; Yao, S.; Hao, C.; Pan, C.; Xiang, X.; Tian, Z.; Shen, P.; Shao, Z.; Jiang, S. Boosting Electrocatalytic Activity of Single Atom Catalysts Supported on Nitrogen-Doped Carbon through N Coordination Environment Engineering. Small 2022, 18, 2105329. [Google Scholar] [CrossRef]
  20. Beall, C.E.; Fabbri, E.; Schmidt, T.J. Perovskite Oxide Based Electrodes for the Oxygen Reduction and Evolution Reactions: The Underlying Mechanism. ACS Catal. 2021, 11, 3094–3114. [Google Scholar] [CrossRef]
  21. Zhu, Y.; Zhou, W.; Chen, Y.; Yu, J.; Xu, X.; Su, C.; Tadé, M.O.; Shao, Z. Boosting oxygen reduction reaction activity of palladium by stabilizing its unusual oxidation states in perovskite. Chem. Mater. 2015, 27, 3048–3054. [Google Scholar] [CrossRef]
  22. Xue, Y.; Sun, S.; Wang, Q.; Dong, Z.; Liu, Z. Transition metal oxide-based oxygen reduction reaction electrocatalysts for energy conversion systems with aqueous electrolytes. J. Mater. Chem. A 2018, 6, 10595–10626. [Google Scholar] [CrossRef]
  23. Zhu, H.; Zhang, P.; Dai, S. Recent Advances of Lanthanum-Based Perovskite Oxides for Catalysis. ACS Catal. 2015, 5, 6370–6385. [Google Scholar] [CrossRef]
  24. Pavone, M.; Muñoz-García, A.; Ritzmann, A.; Carter, E. First-Principles Study of Lanthanum Strontium Manganite: Insights into Electronic Structure and Oxygen Vacancy Formation. J. Phys. Chem. C 2014, 118, 13346–13356. [Google Scholar] [CrossRef]
  25. Tulloch, J.; Donne, S. Activity of perovskite La1−xSrxMnO3 catalysts towards oxygen reduction in alkaline electrolytes. J. Power Sources 2009, 188, 359–366. [Google Scholar] [CrossRef]
  26. Zhao, Y.; Hang, Y.; Zhang, Y.; Wang, Z.; Yao, Y.; He, X.; Zhang, C.; Zhang, D. Strontium-doped perovskite oxide La1−xSrxMnO3 (x = 0, 0.2, 0.6) as a highly efficient electrocatalyst for nonaqueous Li-O2 batteries. Electrochim. Acta 2017, 232, 296–302. [Google Scholar] [CrossRef]
  27. Xue, Y.; Miao, H.; Sun, S.; Wang, Q.; Li, S.; Liu, Z. (La1−xSrx)0.98MnO3 perovskite with A-site deficiencies toward oxygen reduction reaction in aluminum-air batteries. J. Power Sources 2017, 342, 192–201. [Google Scholar] [CrossRef]
  28. Deganello, F.; Marcì, G.; Deganello, G. Citrate–nitrate auto-combustion synthesis of perovskite-type nanopowders: A systematic approach. J. Eur. Ceram. Soc. 2009, 29, 439–450. [Google Scholar] [CrossRef]
  29. Garsany, Y.; Singer, I.L.; Swider-Lyons, K.E. Impact of film drying procedures on RDE characterization of Pt/VC electrocatalysts. J. Electroanal. Chem. 2011, 662, 396–406. [Google Scholar] [CrossRef]
  30. Xia, W.; Mahmood, A.; Liang, Z.; Zou, R.; Guo, S. Earth-Abundant Nanomaterials for Oxygen Reduction. Angew. Chem. Int. Ed. 2016, 55, 650–2676. [Google Scholar] [CrossRef]
  31. Brezesinski, T.; Wang, J.; Poiieux, J.; Dunn, B.; Tolbert, S. Templated Nanócrystal-Based Porous TiO2 Films for Next-Generation Electrochemical Capacitors. J. Am. Chem. Soc. 2009, 131, 1802–1809. [Google Scholar] [CrossRef]
  32. Zhang, Y.; Feng, F.; Zhang, C.; Zheng, Q.; Wang, C.; Hu, H.; Wu, M.; Guo, Y. Enhanced Catalytic Activity of LaMnO3 by A-Site Substitution as Air Electrode of Zn–Air Batteries with Attractive Durability. Energy Fuels 2020, 34, 10170–10177. [Google Scholar] [CrossRef]
  33. Luo, F.; Huang, Y.; Yan, C.; Jiang, S.; Li, X.; Wang, Z.; Liao, C. Molten alkali metal nitrate flux to well-crystallized and homogeneous La0. 7Sr0. 3MnO3 nanocrystallites. J. Magn. Magn. Mater. 2003, 260, 173–180. [Google Scholar] [CrossRef]
  34. Guo, J.; Jing, Y.; Shen, T.; Luo, H.; Liang, J.; Yuan, S. Effect of doped strontium on catalytic properties of La1–xSrxMnO3 for rhodamine B degradation. J. Rare Earth. 2021, 39, 1362–1369. [Google Scholar] [CrossRef]
  35. Jiang, S. Development of lanthanum strontium manganite perovskite cathode materials of solid oxide fuel cells: A review. J. Mater. Sci. 2008, 43, 6799–6833. [Google Scholar] [CrossRef]
  36. Chen, X.; Khor, K.; Chan, S. Electrochemical behavior of La(Sr)MnO3 electrode under cathodic and anodic polarization. Solid State Ionics 2004, 167, 379–387. [Google Scholar] [CrossRef]
  37. Chen, S.; Sheng, W.; Yabuuchi, N.; Ferreira, P.; Allard, L.; Shao-Horn, Y. Origin of Oxygen Reduction Reaction Activity on “Pt3Co” Nanoparticles: Atomically Resolved Chemical Compositions and Structures. J. Phys. Chem. C 2009, 113, 1109–1125. [Google Scholar] [CrossRef] [Green Version]
  38. Wang, G.; Xu, T.; Wen, S.; Pan, M. Structure-dependent electrocatalytic activity of La1−xSrxMnO3 for oxygen reduction reaction. Sci China Chem. 2015, 58, 871–878. [Google Scholar] [CrossRef]
Figure 1. XRD patterns of (a) LSMO0.3 calcined at different temperatures and (b) LSMOx calcined at 900 °C.
Crystals 13 00074 g001
Figure 2. (a) Le Bail refinement of LSMOx; (b) a, (c) αR, and (d) unit cell volume of LSMOx obtained from Le Bail refinement.
Crystals 13 00074 g002
Figure 3. Cyclic voltammograms of (a) LSMO0.3/VXC-72/Nafion (5:1:1 in mass ratio, 5 μL drop) in 0.1 M KOH with scan rate of 10 mV s−1 at 1500 rpm under O2 or N2 bubbling; (b) LSMO0.3/VXC-72/Nafion (5:1:1 in mass ratio, 1 μL drop from ink with deionized water or 2-propanol as solvent) in 0.1 M KOH with scan rate of 10 mV s−1 at 1500 rpm under O2 bubbling; (c) catalyst(LSMO0.3 or Pt)/VXC-72/Nafion (5:1:1 in mass ratio, 5 μL drop) in 0.1 M KOH with scan rate of 10 mV s−1 at 1500 rpm under O2 bubbling; (d) LSMO0.3/VXC-72/Nafion (5:1:1 in mass ratio, 10 μL drop) treated with different dispersion manners in 0.1 M KOH with scan rate of 20 mV s−1 at 1500 rpm under O2 bubbling.
Crystals 13 00074 g003
Figure 4. Illustration of the two types of mixing of particles, (a) aggregated particles; (b) particles distributed by mixing; (c) particles dispersed by sonication; (d) particles distributed and dispersed.
Crystals 13 00074 g004
Figure 5. (a) Pictures of the tip deposited with different drop volumes of ink; (b) Cyclic voltammograms of LSMO0.3/VXC-72/Nafion (5:1:1 in mass ratio) of different drop volumes in 0.1 M KOH with scan rate of 10 mV s−1 at 1500 rpm under O2 bubbling.
Crystals 13 00074 g005
Figure 6. Cyclic voltammograms of LSMO0.3/VXC-72/Nafion (5:1:1 in mass ratio, 5 μL drop) in 0.1 M KOH with scan rate of 10 mV s−1 at 0 rpm under O2 or N2 bubbling (a) (sequence in N2-O2); (b) (sequence in O2-N2); (c) First, and (d) second scan of the cyclic voltammograms of LSMO0.3/VXC-72/Nafion (5:1:1 in mass ratio, 5 μL drop) in 0.1 M KOH with scan rate of 10 mV s−1 at 0 rpm under O2 bubbling.
Crystals 13 00074 g006
Figure 7. Cyclic voltammograms of RDE deposited with different combinations of LSMO0.3/VXC-72/Nafion (5:1:1 in mass ratio, 5 μL drop) in 0.1 M KOH with scan rate of 10 mV s−1 at 0 rpm under (a) N2, and (b) O2 bubbling; Cyclic voltammograms of RDE deposited with different compositions of LSMO0.3/VXC-72/Nafion (5 μL drop) in 0.1 M KOH with scan rate of 10 mV s−1 at 1500 rpm under O2 bubbling with varying mass ratio of (c) Nafion and (d) VXC-72.
Crystals 13 00074 g007
Figure 8. (a) Cyclic voltammograms of LSMO0.3/VXC-72/Nafion (5:1:1 in mass ratio, 5 μL drop) in 0.1 M KOH with scan rate of 10 mV s−1 at different rotation rates under O2 bubbling; (b) Koutecký–Levich analyses for cyclic voltammograms from (a); (c) Cyclic voltammograms of LSMO0.3/VXC-72/Nafion (5:1:1 in mass ratio, 5 μL drop) in 0.1 M KOH with scan rate of 10 mV s−1 at 1500 rpm under bubbling of different gases; (d) The modified cyclic voltammogram with a function of potential and the subtracted current (current under O2 bubbling minus current under N2 bubbling in (c)).
Crystals 13 00074 g008
Figure 9. Negative scans of the modified cyclic voltammograms of (a) LSMOx/VXC-72/Nafion and (b) LSMO0.3 (under different calcination temperatures)/VXC-72/Nafion (5:1:1 in mass ratio, 5 μL drop) in 0.1 M KOH with scan rate of 10 mV s−1 at 1500 rpm under O2 bubbling. The original complete cyclic voltammograms of (c) LSMOx/VXC-72/Nafion and (d) LSMO0.3 (under different calcination temperatures)/VXC-72/Nafion (5:1:1 in mass ratio, 5 μL drop) in 0.1 M KOH with scan rate of 10 mV s−1 at 1500 rpm under O2 bubbling.
Crystals 13 00074 g009
Table 1. Summary of the conditions and results of RDE tests of La1−xSrxMnO3 on ORR.
Reference [25][26][27][38]This Work
CatalystsLa0.6Sr0.4MnO3La0.4Sr0.6MnO3(La1−
xSrx)0.98MnO3
La1−xSrxMnO3La0.7Sr0.3MnO3
Synthesis methodco-precipitationSol-gel methodsolid–liquid
method
modified polymer complex methodCitrate solution method
Catalyst loading21.3 ± 0.4 μg on 5 mm diameter GC electrode0.5 ± 0.1 mg cm−20.125 mg cm −20.5102 mg cm−20.893 mg cm−2
ElectrolyteO2-saturated 1.0 M KOHO2-saturated 0.1 M KOHO2-saturated 0.1 M KOH O2-staturated 1 M KOHO2-staturated 1 M KOH
Scan rate5 mV s−110 mV s−15 mV s −15 mV s−110 mV s−1
Rotation rate1500 rpm1600 rpm 1600 rpm 1600 rpm1500 rpm
Transferred electron numberclose to 43.693.86 close to 4 3.96
Half-wave potential--0.588 V vs. RHE−0.127 V vs. Hg/HgO−0.237 V vs. Ag/AgCl
Onset potential-−0.274 V vs. SCE0.903 V vs. RHE0.147 V vs. Hg/HgO−0.096 V vs. Ag/AgCl
Note: the transformations of potential between different reference electrodes are as below: SCE = RHE − 0.059pH − 0.241, Hg/HgO = RHE − 0.059pH − 0.098, Ag/AgCl = RHE − 0.059pH − 0.197.
Disclaimer/Publisher’s Note: The statements, opinions and data contained in all publications are solely those of the individual author(s) and contributor(s) and not of MDPI and/or the editor(s). MDPI and/or the editor(s) disclaim responsibility for any injury to people or property resulting from any ideas, methods, instructions or products referred to in the content.

