Article

Density Testing Method for Undercooling Solidification of High-Temperature Metal Melts

1
School of Materials and Chemical Engineering, Xi’an Technological University, Xi’an 710021, China
2
Otto Schott Institute of Materials Research, Friedrich Schiller University Jena, 07743 Jena, Germany
*
Authors to whom correspondence should be addressed.
Crystals 2023, 13(10), 1502; https://doi.org/10.3390/cryst13101502
Submission received: 19 September 2023 / Revised: 27 September 2023 / Accepted: 12 October 2023 / Published: 16 October 2023
(This article belongs to the Special Issue Phase Transition in External Fields (2nd Edition))

Abstract

:
There are numerous methods used for measuring the coefficient of thermal expansion of alloys and density change at low temperatures, but it is difficult to accurately measure the volume and density of high-temperature melts, particularly during the process of rapid volume change during material phase transformation. This article proposes a method for measuring and analysing the volume and density changes in high-temperature alloy melts using high-speed photography and computer MATLAB program image analysis technology, which includes the ordinary image threshold segmentation method, the elliptical fitting method, and the local dynamic threshold segmentation method. The ordinary image threshold segmentation method is best suited to samples with clear boundaries; the elliptical fitting method is the simplest and can be used to analyse samples with unclear boundaries; and the local dynamic threshold segmentation method is the most accurate and best suited to samples with unclear boundaries. These techniques will aid in understanding the variations in the volume and density of high-temperature melt samples during the phase transition process.

1. Introduction

The volume and density changes in alloys have a significant impact on defects and stresses during the material forming process [1,2,3]. At present, it is relatively easy to measure the volume and density of alloys at room temperature using classical Archimedes methods. However, it is difficult to measure the volume and density of liquid metals at high temperatures, especially the changes in the volume and density of alloys during solidification [4,5]. Some researchers studied the maximum bubble pressure method [6,7,8,9] for measuring the density of high-temperature melts and successfully obtained the density data of Fe-Ni, Co-W, and Sn-Zn alloys at specific temperature points using this method [10,11]. Other researchers used electromagnetic levitation optical measurement techniques to measure the density and volume of high-temperature melts [10,11,12,13,14]. Electromagnetic levitation technology can provide rapid levitation, heating, and melting of metal materials in a short time, which can make the metals of alloy reach a high undercooling so that density and volume in a larger temperature range can be measured [15,16,17,18]. For example, Saitoet al. tested the volume change in pure iron, cobalt, and nickel in the molten state in the temperature range of approximately 1800 °C to 2200 °C using a levitation furnace by estimating the volume of the metal drop from its photographs (horizontal and vertical views) and relating it to the weight of the same drop [19]. However, this technique has some problems such as the metallic droplets levitated unstable and the image of the sample lacking the required symmetry, which seriously affect the success and accuracy of density measurement [20,21]. Another significant problem is the sample image analysis algorithm [22,23,24]. Matson and Torovopa et al. studied the temperature dependence of density with changes in crystallisation on onboard the International Space Station, which can obtain stable levitated melts [25,26]. Another technique to obtain a stable sample image is using the high-frequency-induced melt–flux method. This method is easy to make the sample solidify at very high undercooling and can make the metal melt shape stable in a large temperature range, which is helpful to study the density and volume change in alloy solidification at high undercooling [27,28,29,30].
In this study, the measurement and analysis of the volume and density changes in high-temperature alloy melts will be performed using high-speed photography and computer MATLAB program image analysis technology. The experimental data are derived from the electromagnetic levitation (noncontact) technique and the high-frequency-induced melt–flux technique. Three algorithms, including the image segmentation method, the elliptical fitting method, and the local dynamic threshold segmentation method, will be shown.

2. Experiment

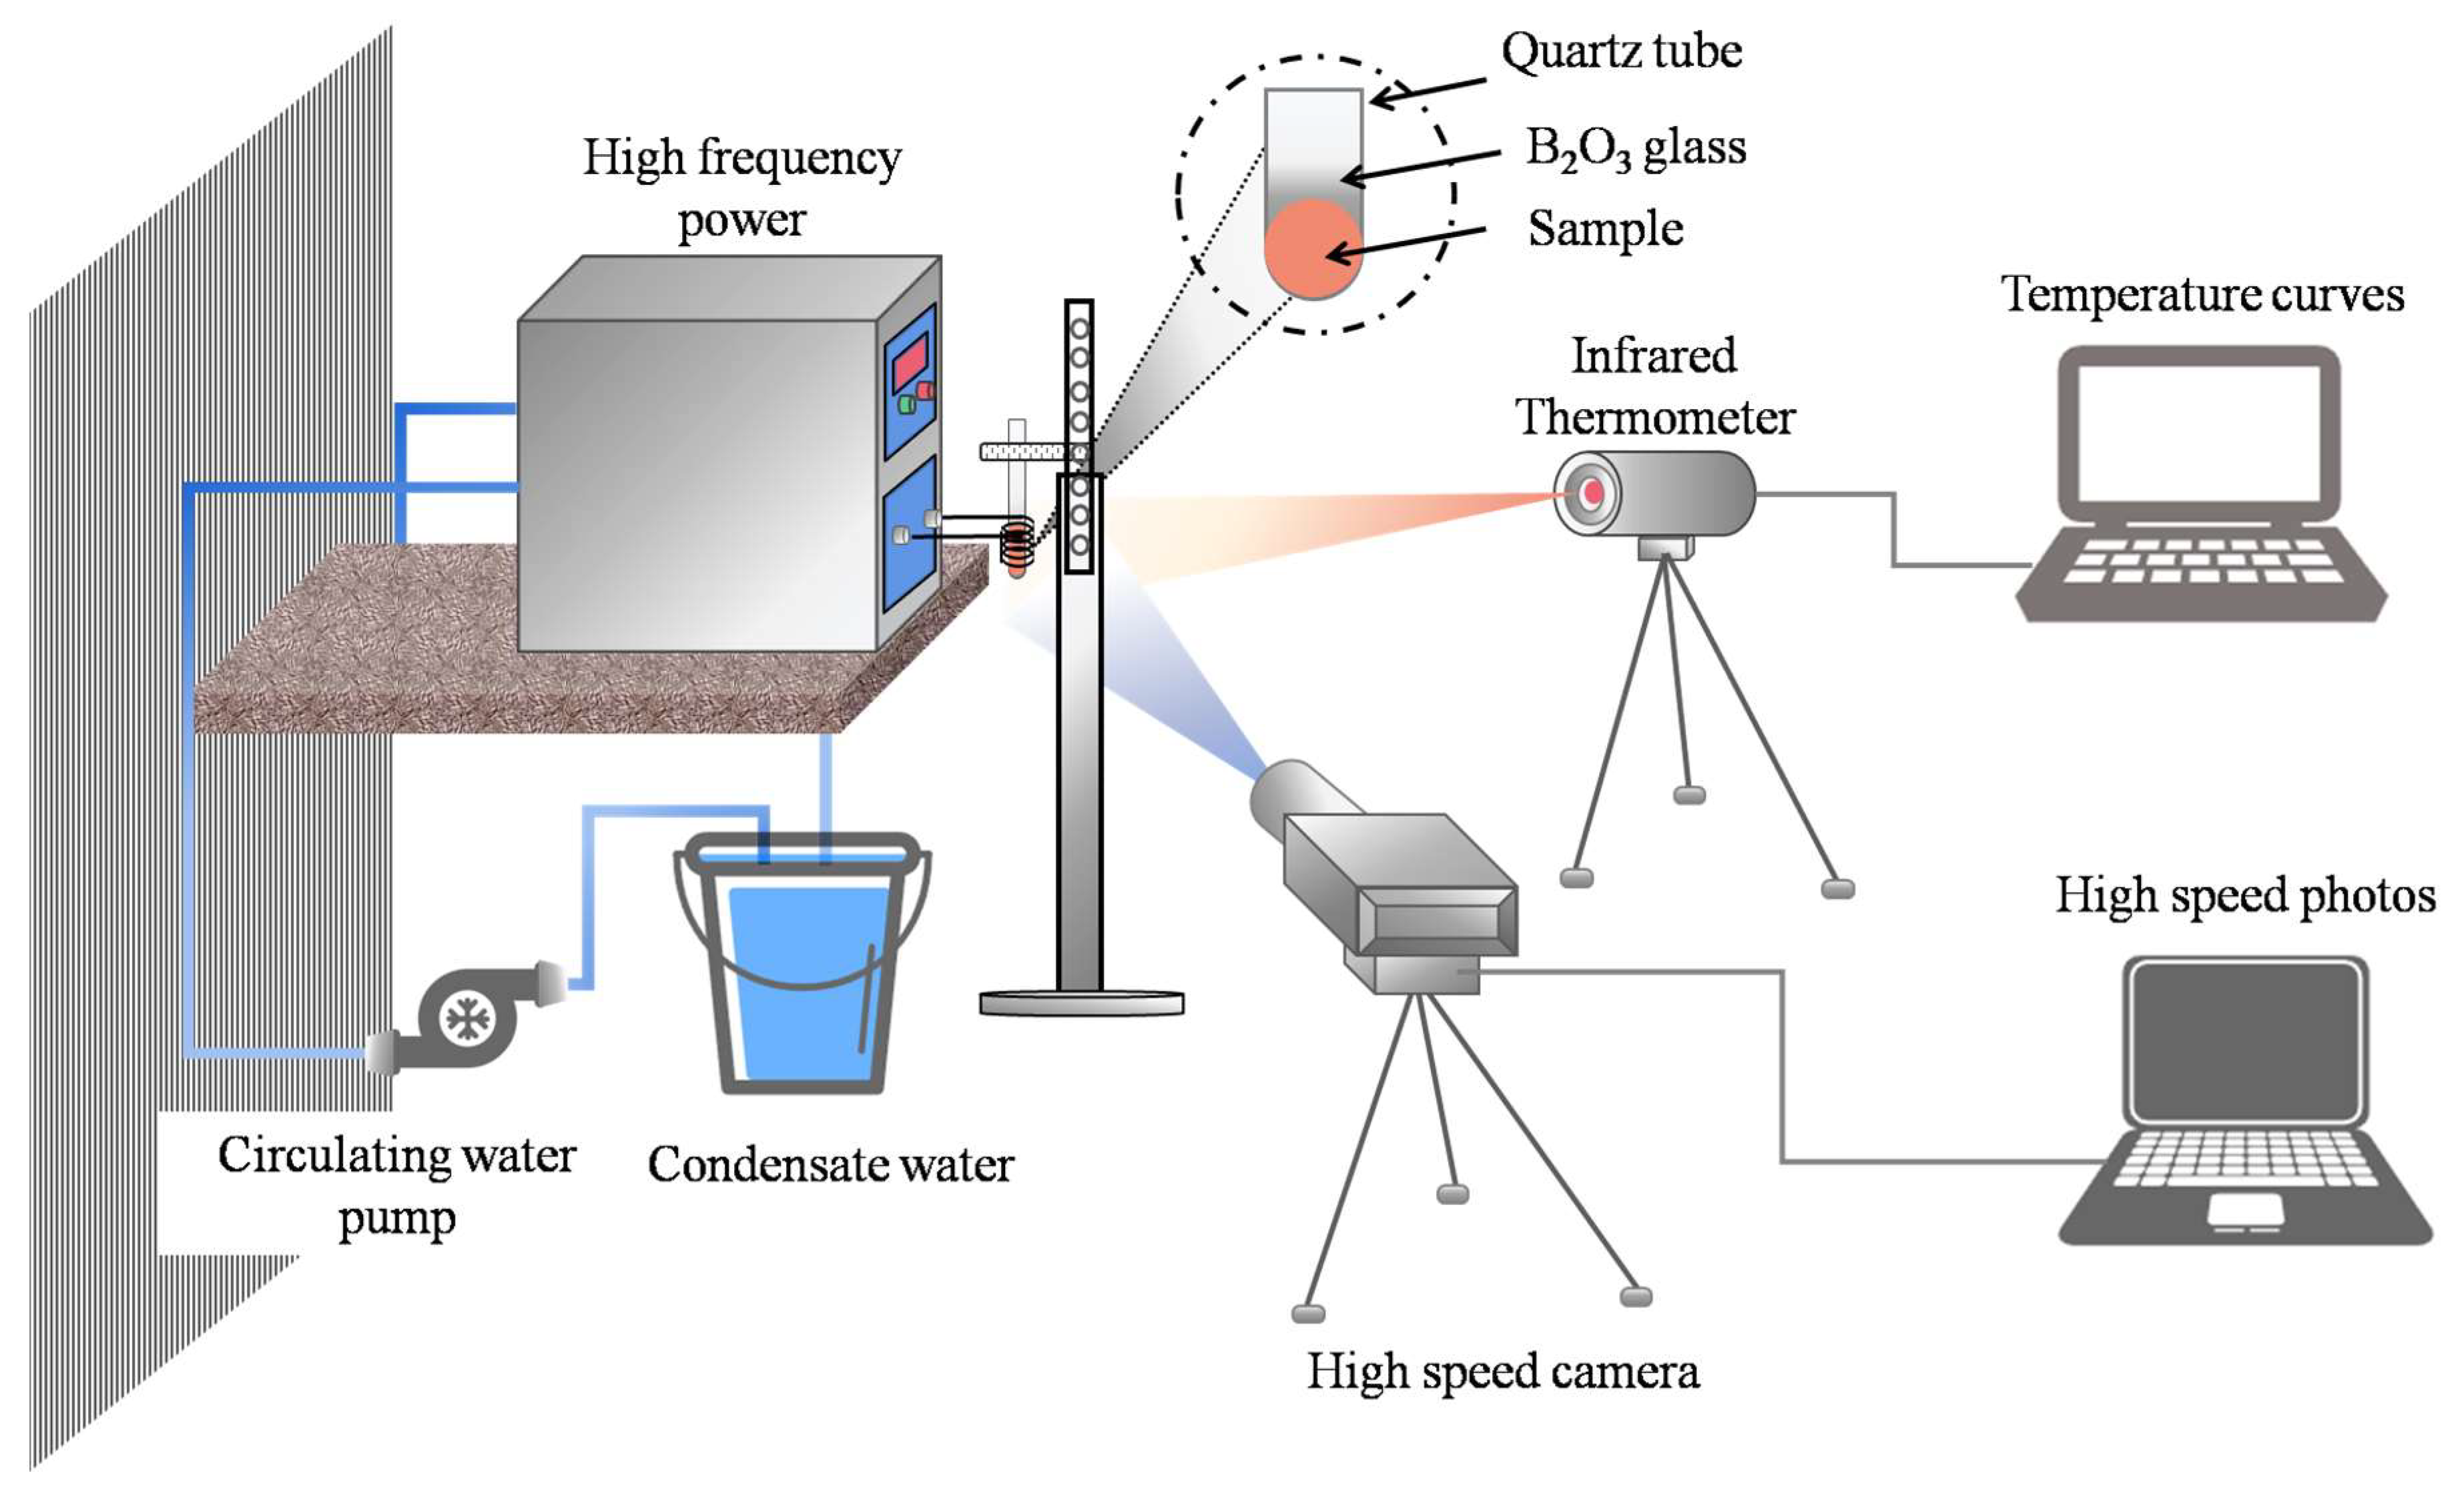
To measure the alloy sample volume with temperature for relatively low-density alloys or those that react with quartz tubes, this electromagnetic levitation (noncontact) technique can be used. Taking the Al-Si alloy as an example, the experimental technique is shown in Figure 1. The alloy, weighing approximately 2 g, was placed in the centre of the induction coil, and the sample was levitated using a high-frequency induction power. This experiment uses a CGP-10 high-frequency induction heating power(Shenyang Kejing Auto-instrument Co., Ltd., Shenyang, China) supply with a power of 10 kW and a frequency of 300–700 kHz. The cooling water system adopts an industrial freezer AC-2, with a compressor power of 1.73 kW. The vacuum system adopts a two-stage pumping system consisting of an FF160/620 molecular pump and a TRP-36 mechanical pump, with a vacuum degree of up to 6 × 10⁻⁵ Pa. A laser was aimed at the sample to melt it. This experiment uses the F201 CO2 laser (SYNRAD Company, Mukilteo WA USA). The temperature changes in the alloy were measured using an infrared thermometer (Raytek-MM2MH, Santa Cruz, CA, USA), and a high-speed camera (RDTplus, USA) with a high resolution of 1600 × 1600 pixels was used to record the sample images, which were analysed using a MATLAB program. The high-speed camera was equipped with a 10 bit CMOS sensor and a built-in capacity of 4 GB, with a maximum shooting speed of 100,000 frames/second and a maximum resolution of 512 for captured images × 512 pixels. The computer software that comes with high-speed cameras is MIDAS 2.0 (USA), which is mainly used for controlling cameras and processing data.
For high-density metal alloys or those that do not react with quartz test tubes, the high-frequency-induced melt–flux technique can be used. Taking the Ni-B alloy as an example, the experimental method is shown in Figure 2. A sample was put into a quartz crucible covered by small amounts of B2O3 glass, and then the crucible was placed in the induction coils of a high-frequency induction. Then, the sample was subjected to cyclic heating and cooling until the required undercooling was achieved. A high-speed camera (OLYMPUS I-Speed 3 MONO, Japan) with a high resolution of 1280 × 1024 pixels and a pyrometer (PYROSPOT DG 54 N, Germany) with a 10 ms delay time were then used to record the cooling process.

3. Results

3.1. Sample Images

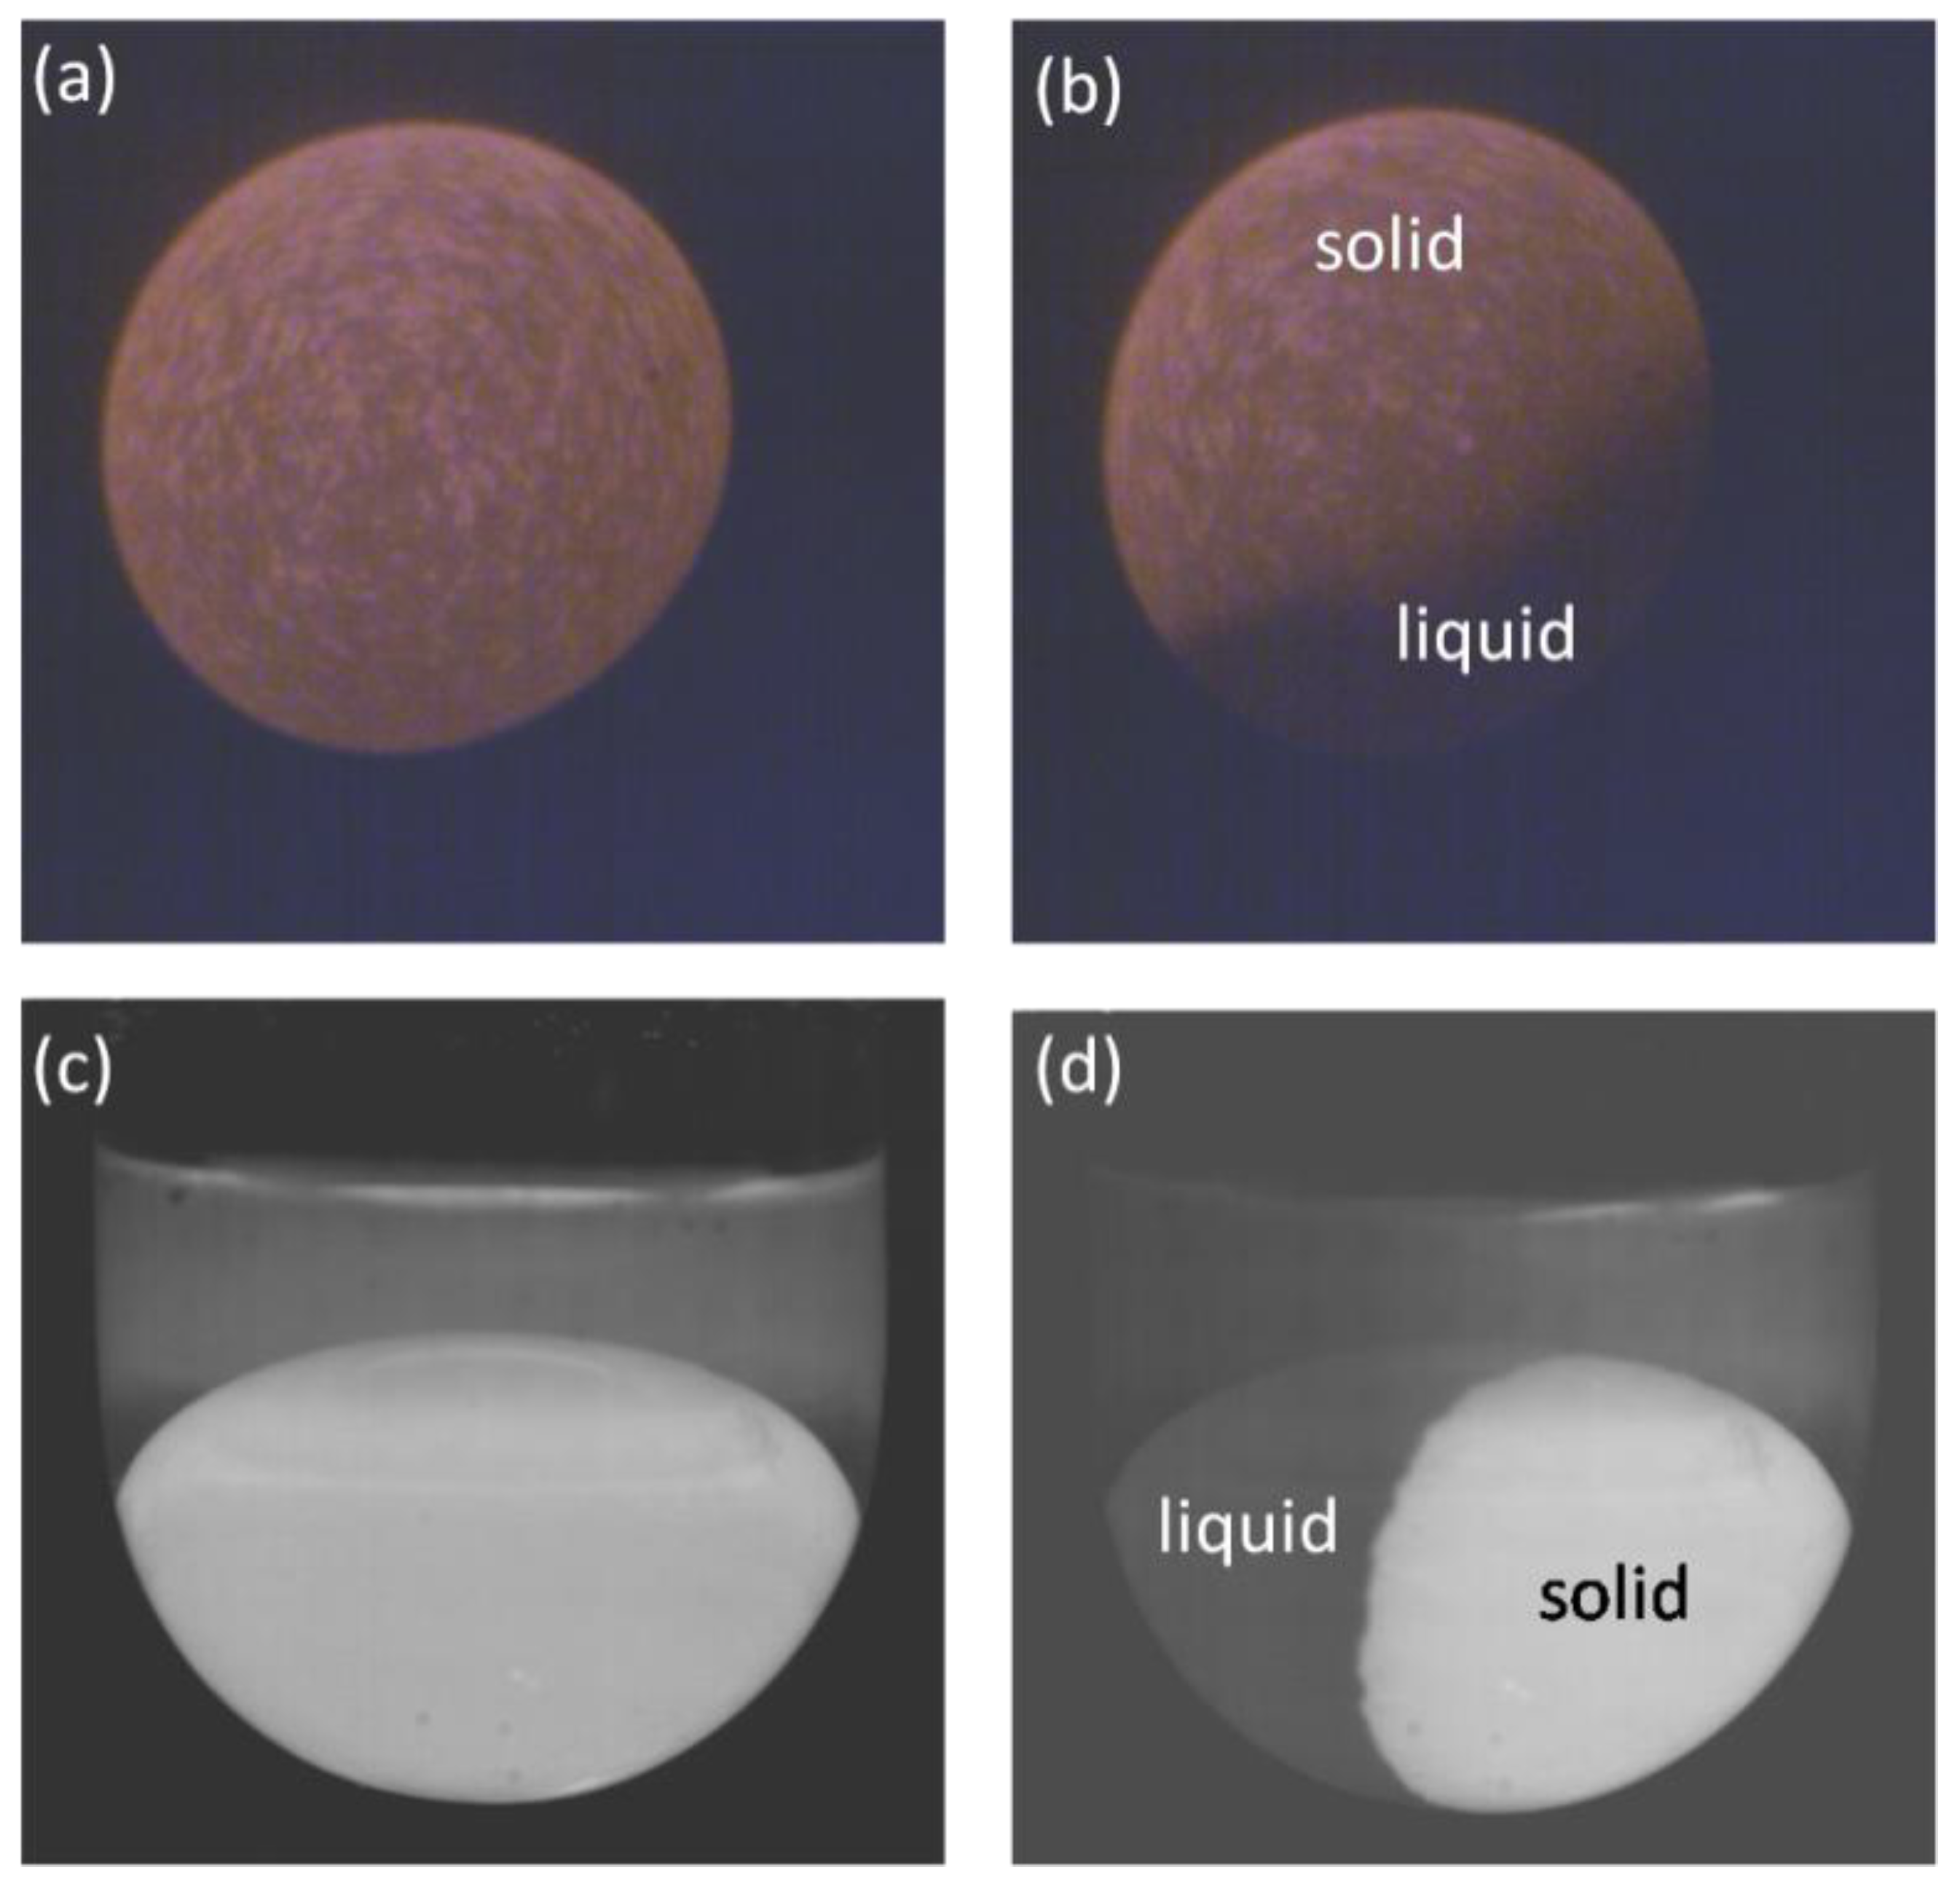
Figure 3a is an image of the Al-Si alloy sample under levitation conditions which had just solidified. The boundary between the sample and the background is clear, and the sample contour can be directly separated from the background. Figure 3b is an image of the sample during solidification. The sample boundary in the lower-right part of this image is not clear, so the volume of the sample cannot be analysed from the contour. Figure 3c is a sample image obtained by the glass fluxing method for a Ni-B alloy with high density at the end of solidification. Similar to Figure 3a, the sample boundary is very clear, and it is easy to determine the sample contour to calculate the volume. However, if the sample is in a semisolid state, as shown in Figure 3d, the liquid area and background boundary of the left sample are not clear, making it difficult to directly determine the sample contour line.

3.2. Ordinary Image Threshold Segmentation Method

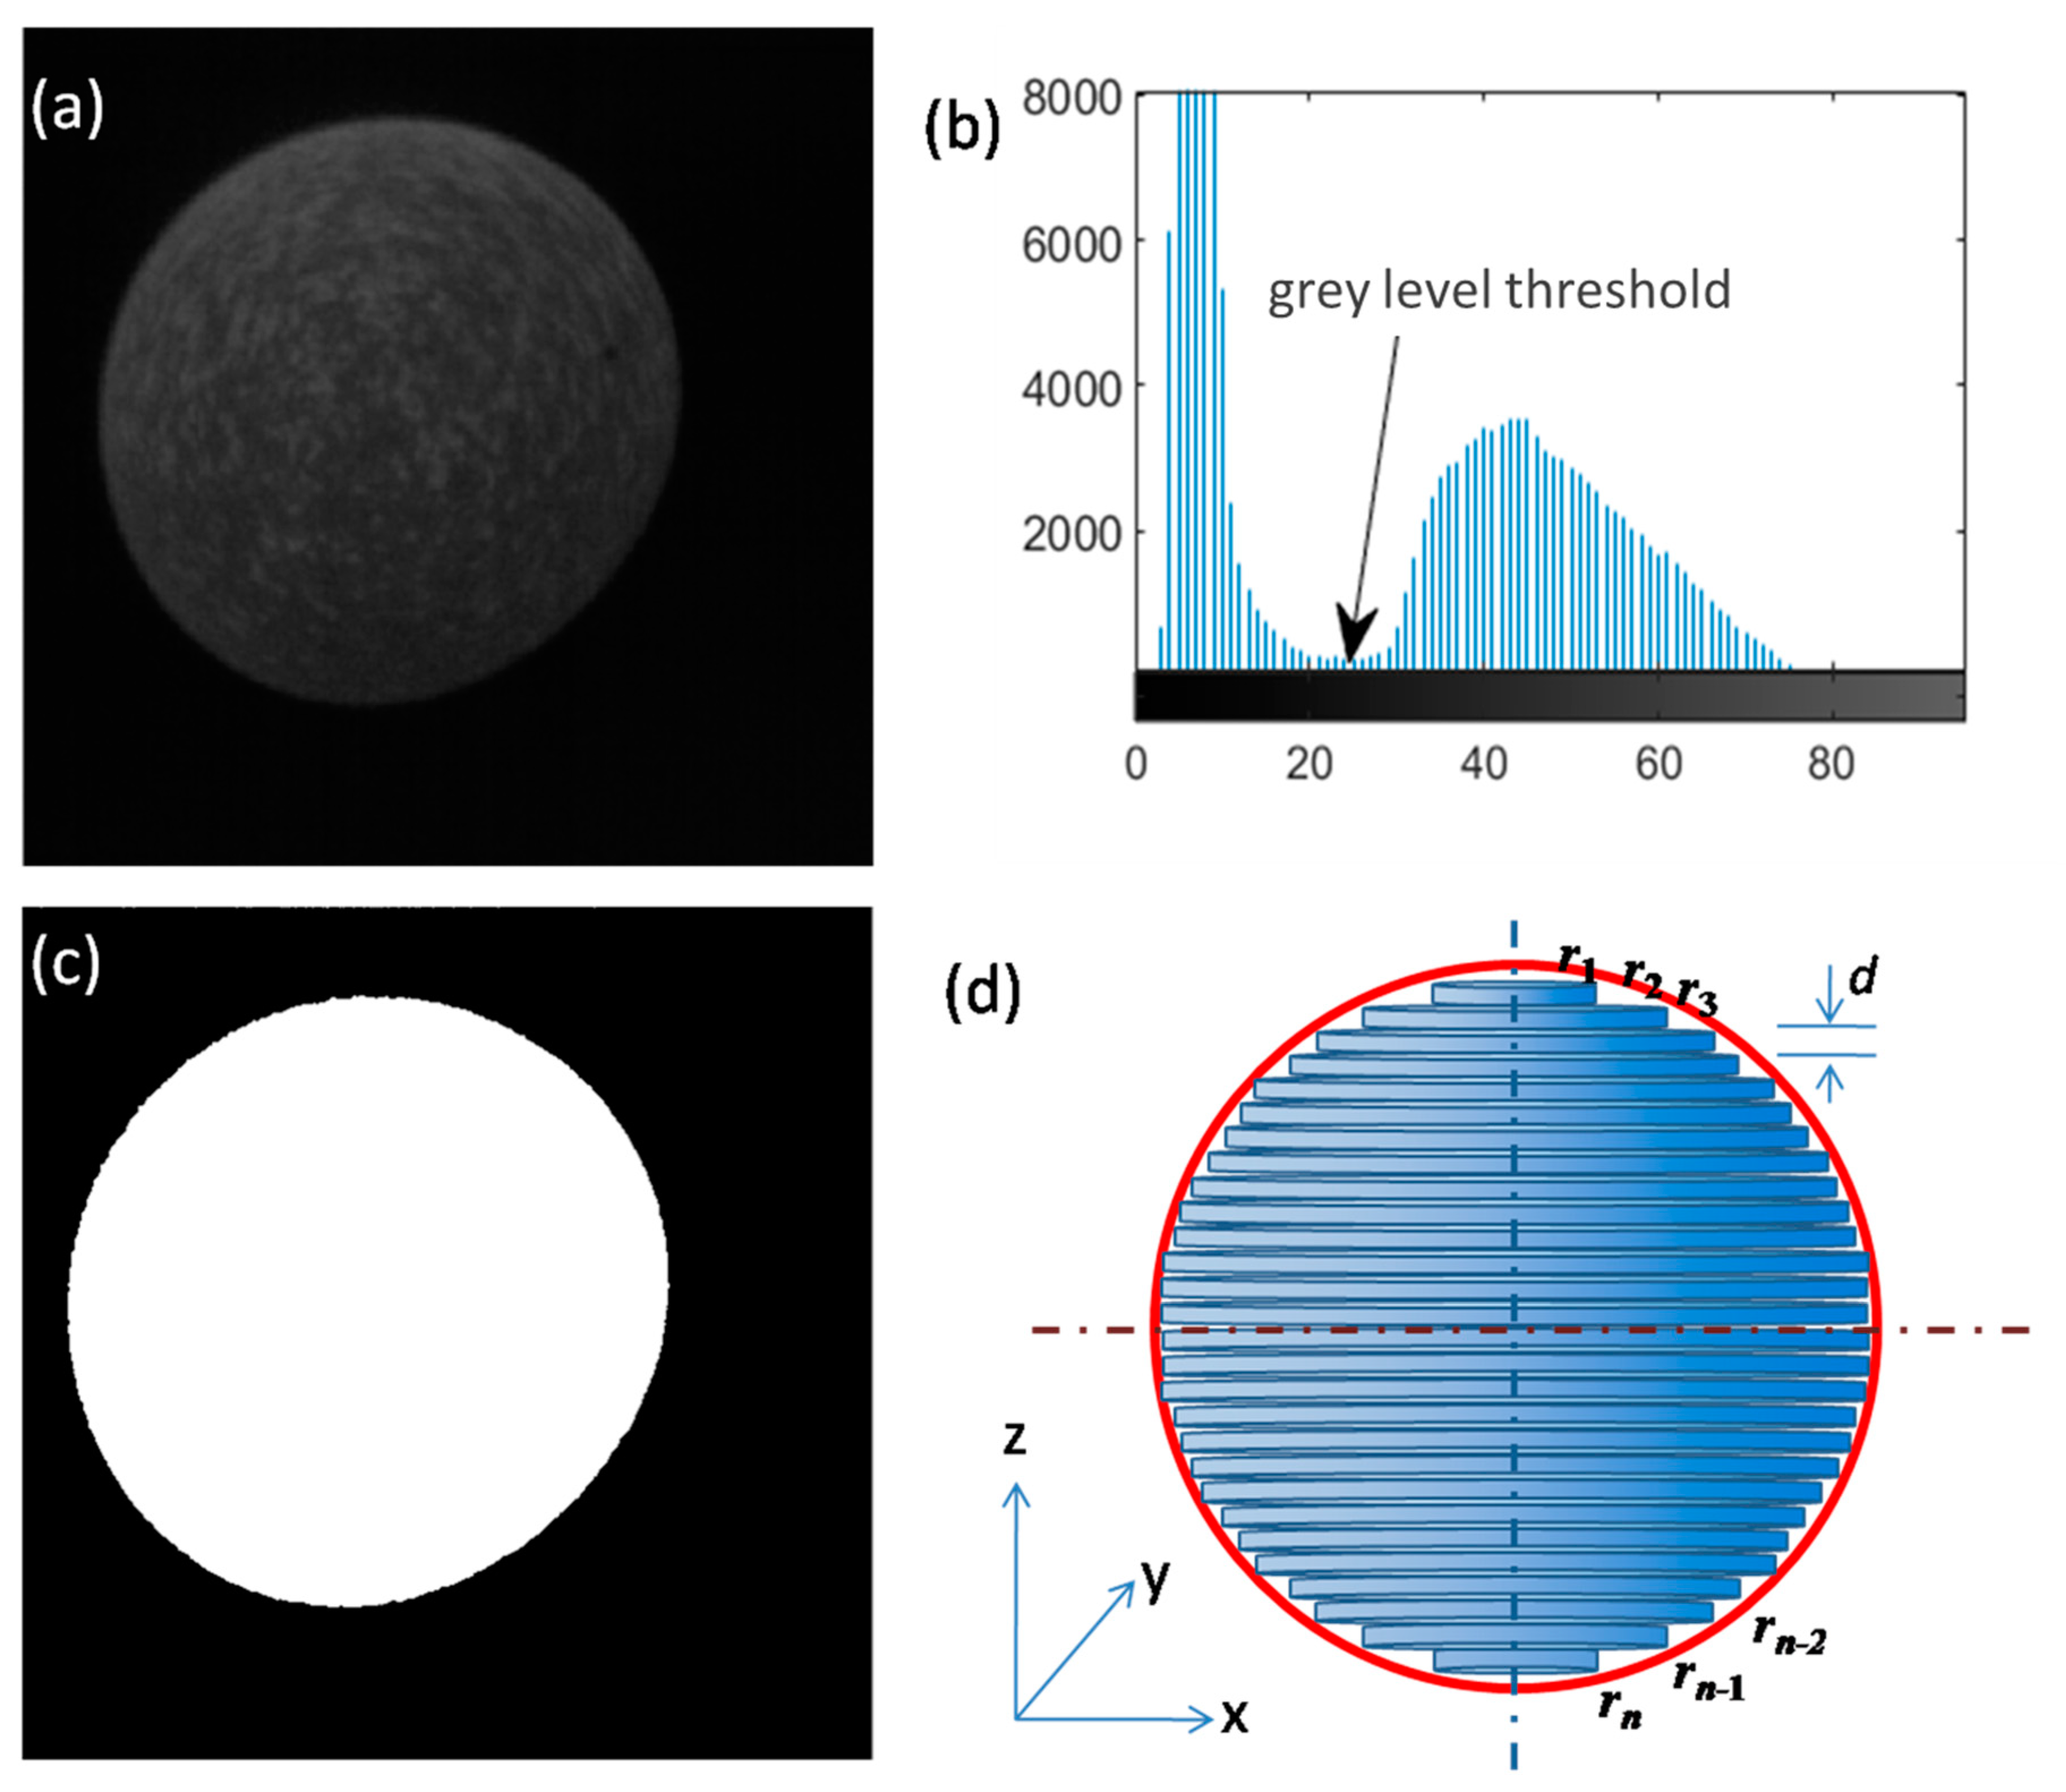
Theordinary image threshold segmentation method is used to distinguish the sample from the background by setting a critical grey level threshold on the high-speed photography image. The first step of this method is to use the “rgb2gray” function in MATLAB software to greyscale the colour image, as shown in Figure 4a. Then, the image is binarized (Figure 4b), and the area of the binary image is calculated layer-by-layer to accumulate the volume of the sample. The radius of each layer of an ellipsoid is related to the size of longitudinal z, that is, r = r (z). In this way, the volume formula of an ellipsoid can be expressed as:
V = π r 1 2 Δ z + π r 2 2 Δ z + + π r n 2 Δ z = π i = 1 n r i 2 Δ z
In MATLAB software, Equation (1) is performed by the function “sum”, i.e., V = π sum(r2)*Δz. The real volume of the sample can be obtained through the relationship between the pixel and the actual unit.
This method is suitable for samples with clear sample boundaries, where the volume of the sample before and after solidification can be measured.
However, for the samples in solidification, as shown in Figure 3b, where some are in the solid phase and some are in the liquid phase, using the ordinary image threshold segmentation method is difficult. As shown in Figure 5a, it is difficult to find an appropriate threshold to segment the complete sample in the greyscale image. If the grey level threshold used is too small, a binary image, as shown in Figure 5b, will be obtained, indicating that the sample area is expanded. If the selected grey level threshold is too large, as shown in Figure 5c, the sample area will be reduced. Therefore, for this image, the ordinary image threshold segmentation method cannot be used for sample volume calculation. Thus, new methods need to be developed.

3.3. Ellipse Fitting Method

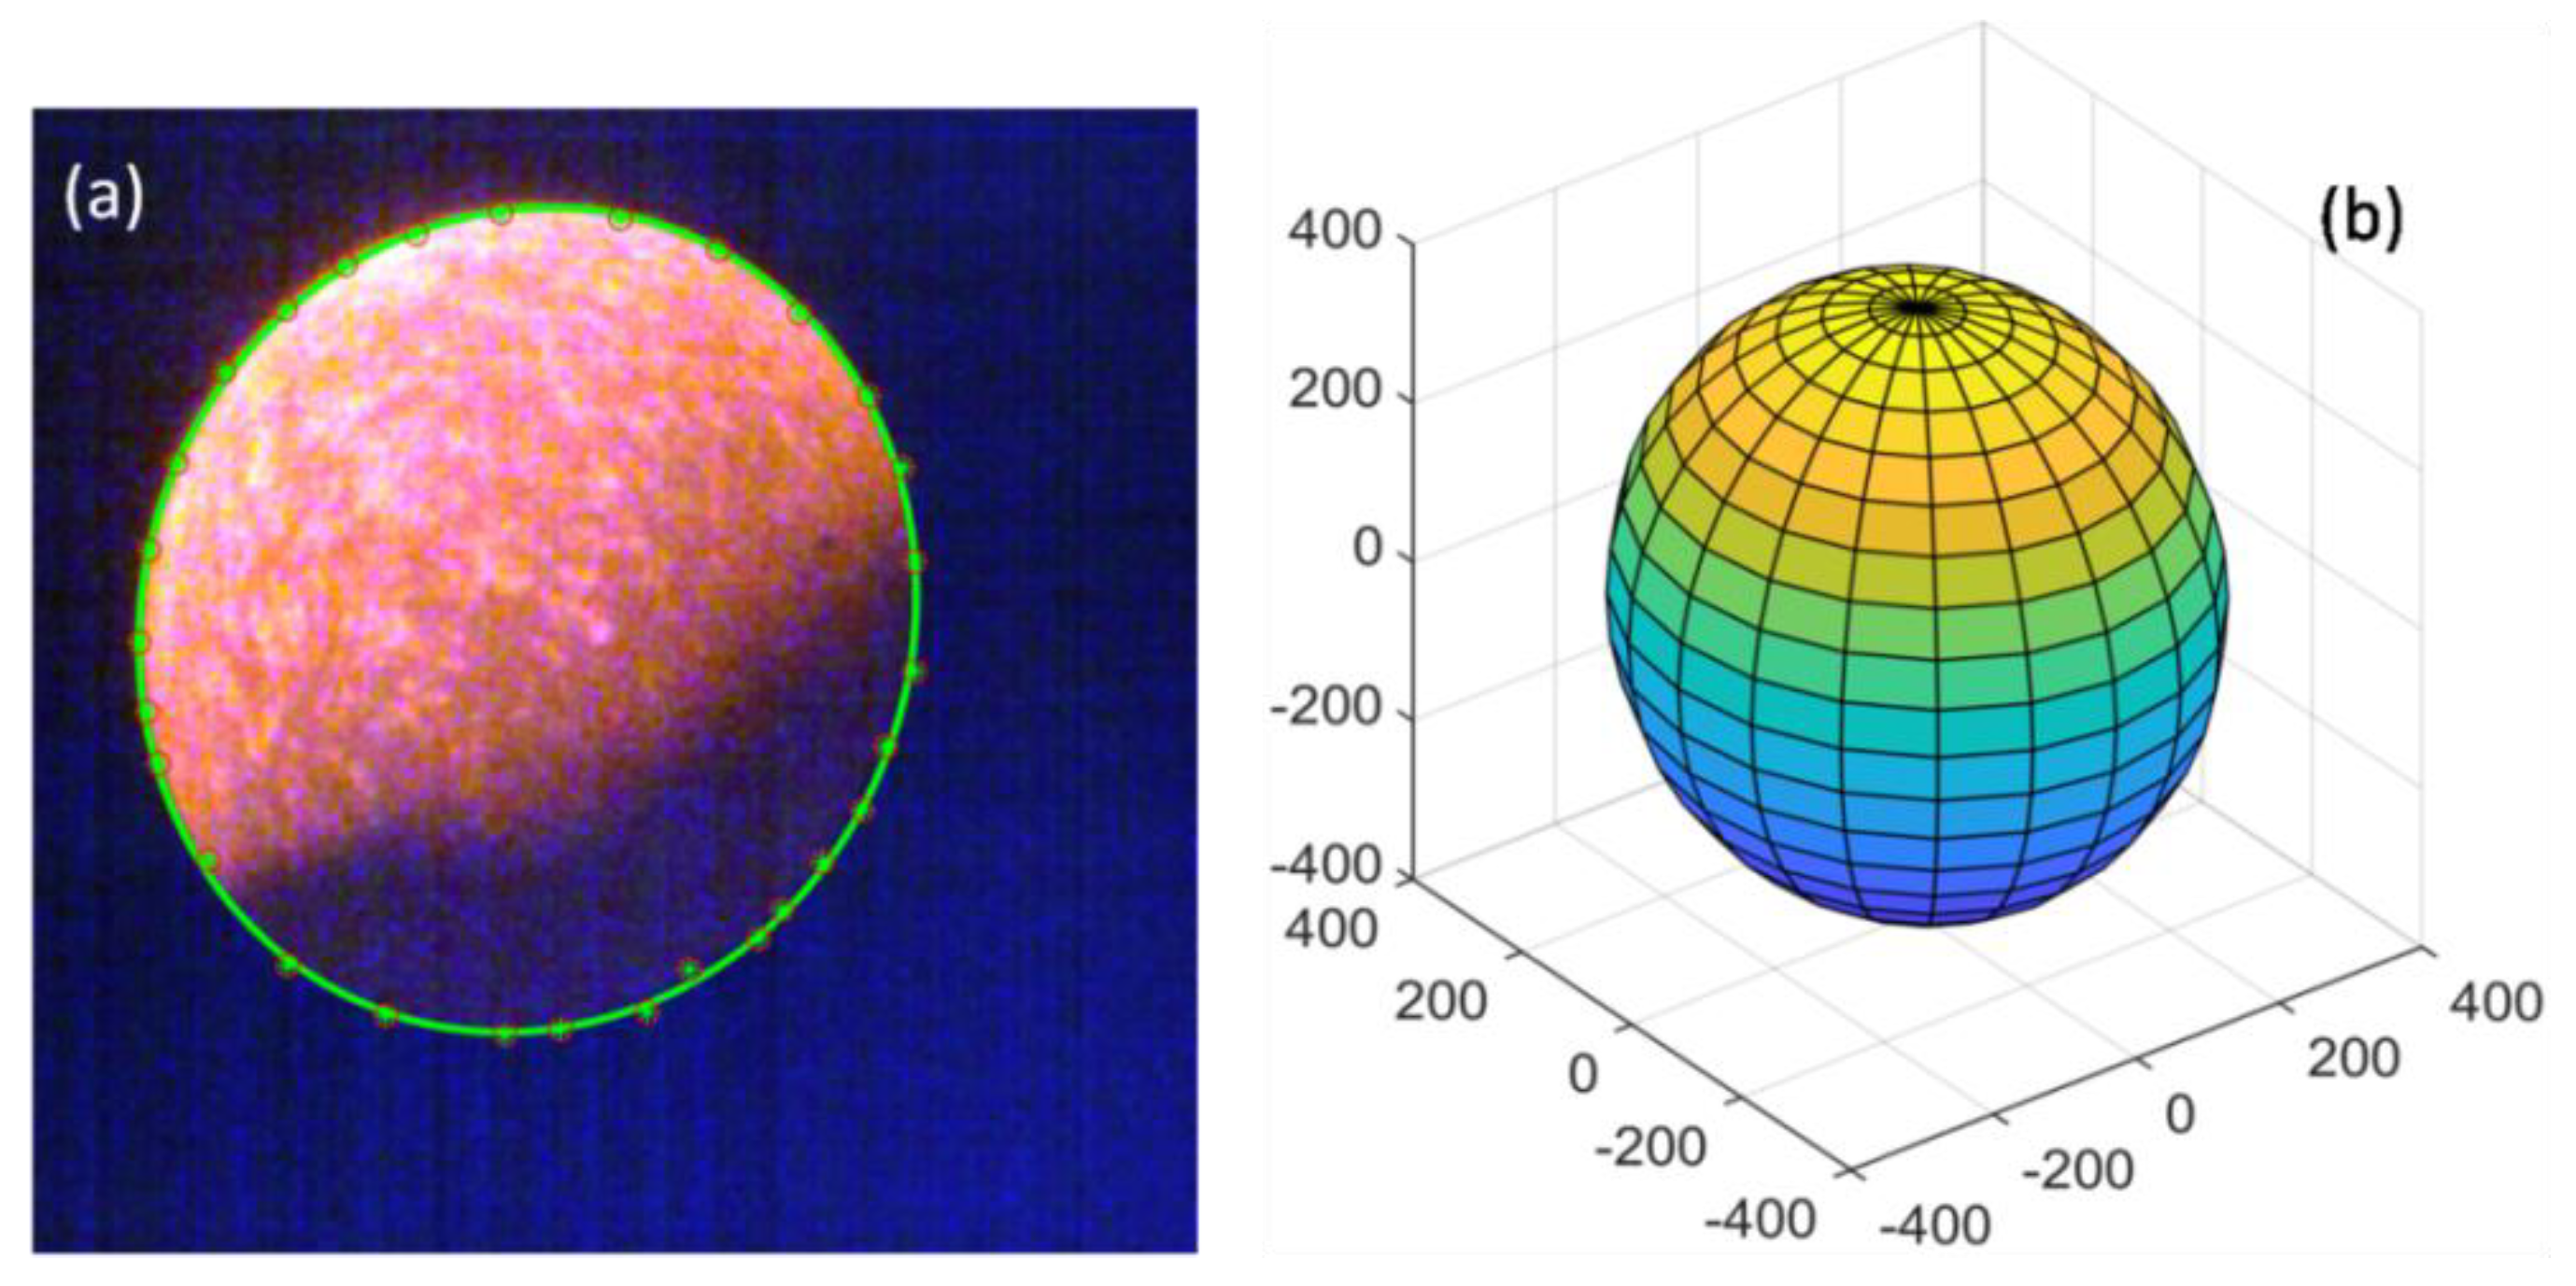
For levitation melting techniques, the samples are always levitated (Figure 3b), so they are roughly spherical or, more accurately, ellipsoidal. Thus, we can select coordinates on the contour and then use the least squares method to fit the elliptical curve. To determine the contour, we can find the boundary of the sample image by hand, as shown in Figure 6a. Of course, determining the point directly by hand is more convenient, and then fitting the points on the sample boundary with an elliptical equation, Equation (1), can be obtained. From the coefficients, the values of the long and short half axes of the ellipsoid can be known; a three-dimensional image of the sample based on the ellipse equation can also be obtianed (Figure 6b), thus, the volume can be calculated. The details can be described as follows:
For a general ellipsoid, the equation is expressed as:
A x 2 + B x y + C y 2 + D x + E y + 1 = 0
Among them, A, B, C, D, and E are the parameters that can be fitted by the least squares method. From Equation (2), the long axis inclination is:
θ = 1 2 arctan B A C or tan ( 2 θ ) = B A C
The elliptical geometric centre is:
X c = B E 2 C D 4 A C B 2 a n d Y c = B D 2 A E 4 A C B 2
The long and short half axes are:
a 2 = 2 A X c 2 + C Y c 2 + B X c Y c 1 A + C + ( A C ) 2 + B 2
b 2 = 2 A X c 2 + C Y c 2 + B X c Y c 1 A + C ( A C ) 2 + B 2
If the brightness of the original image is too low, as shown in Figure 3b, we can first multiply the image matrix by a coefficient to increase its brightness, which will be beneficial for determining the sample boundary (Figure 6a). This method is relatively convenient, but it requires manual point finding, so the efficiency is lower.

3.4. Local Dynamic Threshold Segmentation Method

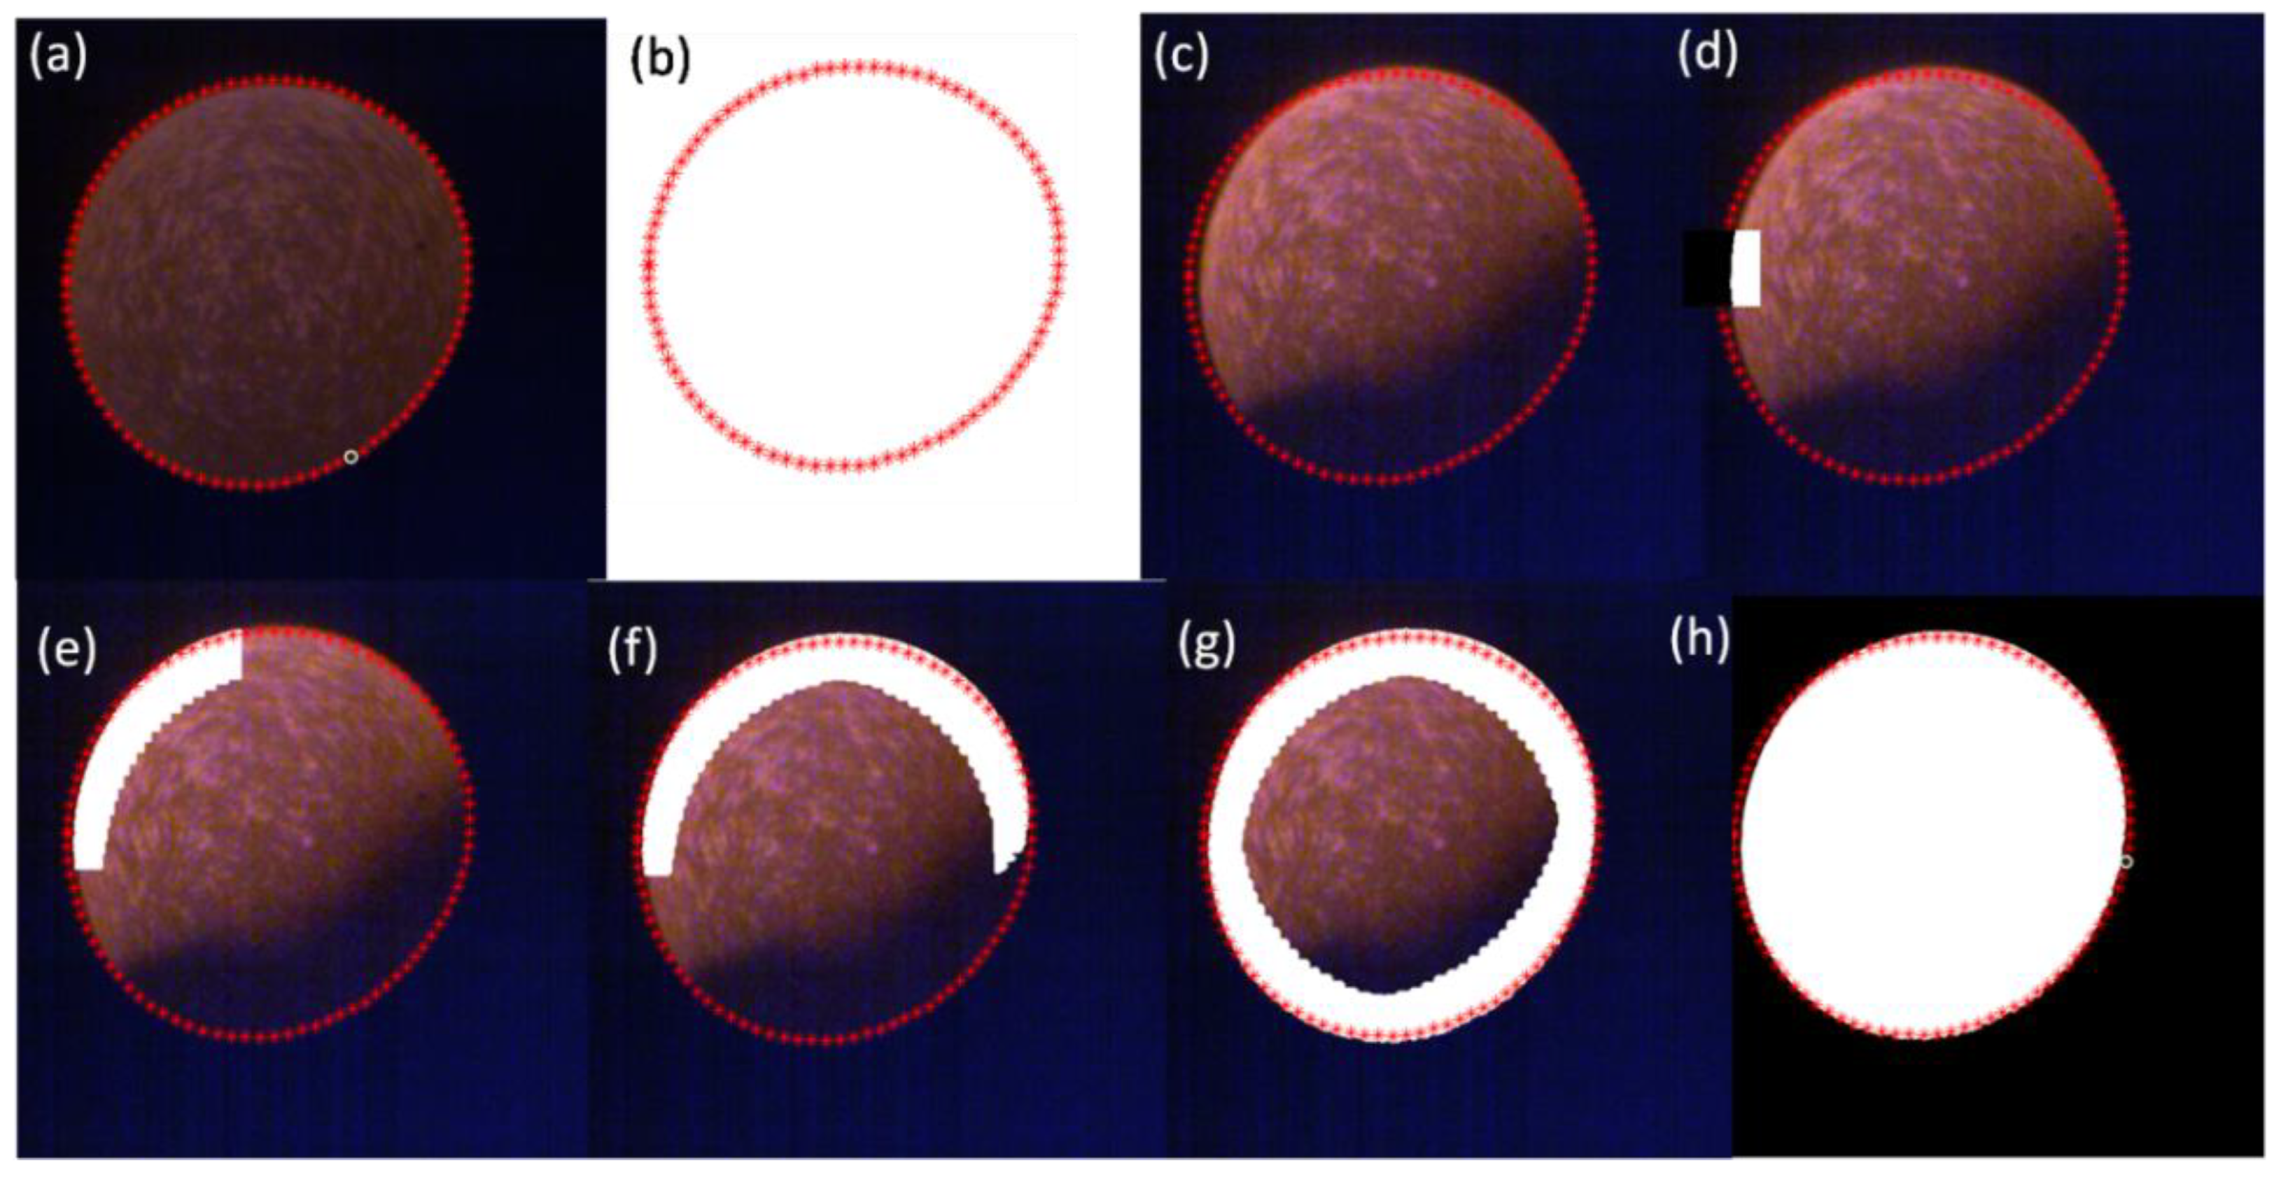
For problem images in which it is difficult to distinguish the sample from the background (Figure 3b–d), we propose a local dynamic threshold segmentation method. It does not require analysing every local area of the entire image but only the vicinity of the sample and background boundaries and then combining multiple local threshold segmentation results to the contour of the entire sample. The process is as follows: (1) First, find image A of the sample before or after solidification that shows clear boundary and determines the boundary contour line (x, y), as shown in Figure 7a,b. (2) Divide the contour line into several points using polar coordinates, which serve as the centre of the local threshold segmentation region. (3) Load in image B the sample with an unclear interface during the solidification process or before solidification to be studied (Figure 7c), determine the position of the contour points of image A just before image B, and extend left and right up and down with each contour point position as the centre to establish the analysis area, as shown in Figure 7d. This is to cut out a local range image B’s circumference with each special point on the contour line as the centre, perform critical greyscale calculation and threshold segmentation on this local image, and obtain the interface between the sample and background (Figure 7d). (4) Synthesise the calculated results of each local area segmentation on the sample circumference into a complete sample contour (Figure 7e–g). By refilling the central part of image B (Figure 7h), the shape and contour of the entire sample B can be obtained. Finally, the commonly used layered calculation method (Figure 4d and Equation (1)) is used to calculate the volume of the sample on image B. From Figure 4, this method can effectively segment background and samples for the unclear boundary image. It is worth noting that the elliptic outline in image B is slightly larger than the red outline of image A (Figure 7h). That is, the sample in image B is slightly larger than the sample in image A. Because the selected image A, Figure 7a, shows the end of solidification of the Al-Si alloy, the corresponding temperature is relatively low. Image B, Figure 7c, is a photo of the solidification process, and the corresponding temperature is relatively high. This indicates that the volume of the sample during solidification is greater than that at the end of solidification. This result demonstrates the accuracy of this method.
It is worth noting that the contour of the solid sample is used here to calculate the contour of the solid-liquid sample. Although there are significant differences in density or volume between the solid and liquid phases, this theoretically does not lead to significant errors. The steps of the algorithm are shown in Figure 8. The solid sample contour is used to determine the approximate contour location region for the solid-liquid sample. This approach can narrow the range of areas that need to be analysed in the image, improve computational efficiency, and, more importantly, select locally appropriate thresholds to avoid errors caused by using a unified threshold for segmentation of the entire image. Local dynamic threshold segmentation is more accurate because the range of grey level changes in the local image is small, the threshold is easier to determine, and the sample and background areas are more easily segmented successfully.
For the sample photos obtained by the high-frequency-induced melt-flux technique, a similar method can be used, as shown in Figure 9. First, choose a sample image that has solidified and learn its contour line (Figure 9a,b). Then, in another image from the solidification process, the basic contour line is used as the centre to perform local threshold segmentation. As shown in Figure 9c, the threshold segmentation results of the samples are merged into a complete contour area, and the unanalysed areas are filled to obtain the shape of the sample and contour (Figure 9d). Finally, the volume change is calculated according to the method in Figure 4d.
This method has relatively low computational efficiency, but it can segment most images that are difficult to distinguish between samples and backgrounds, and the calculation results are relatively accurate.

4. Discussion

In the previous section, we presented the application of the general threshold segmentation method, the ellipsoidal fitting segmentation method, and the local threshold segmentation method to measure volume changes during the high-temperature melt solidification process. For method 1, the general threshold segmentation method is the most commonly used and easiest to operate. However, it is only applicable to images with clear boundaries between the sample and background. Images with unclear boundaries cannot be used.
For method 2, the elliptic fitting method has the simplest principles, the clearest thinking, and the fastest analysis speed. It requires the manual identification of contour points for the sample and background boundaries and then fitting into an elliptical equation. The premise is that the shape of the sample interface is elliptical, and, in reality, in most cases, the levitated melting sample is indeed elliptical. The elliptical formula can be used to describe it well. Using the ellipse fitting method is simple and fast for images with unclear boundaries. After fitting the obtained ellipse equation, other calculations in various three-dimensional spaces can be performed, and the volume can also be quickly obtained. The disadvantage is that the accuracy is slightly lower because sometimes the samples produced by levitated melting and solidification have vibrations, and the samples no longer exhibit a standard elliptical shape.
Method 1 (ordinary image threshold segmentation) cannot obtain the complete boundary of the sample, and Method 2 ellipse fitting is not accurate enough in describing the contour because sometimes the contour may deviate from the ellipse. For method 3, the local dynamic threshold segmentation method is an accurate method. If a common local threshold segmentation method is used, which cuts the photo into several blocks and performs grey level threshold segmentation on a large number of local photos, although it is accurate, the computational efficiency is low. For method 3, the program first learns the contour line area of a complete sample image and then analyses the contours of other sample images based on this contour line. This greatly reduces the search area and solves the segmentation problem of unclear local and background boundaries in the sample. This not only accurately obtains the volume and shape information of the sample but also improves efficiency. To obtain more accurate results, Method 2 and Method 3 can also be mixed and used. For example, more accurate sample profile information and volume can be obtained by first quickly manually finding points on the sample profile to synthesise a rough ellipse and then performing a local threshold segmentation of the solidified semisolid sample photo based on the points in this ellipse. Even multiple threshold segmentation can be performed, which can accurately calculate the volume of samples of any shape and is much more accurate than the elliptical fitting method.

5. Conclusions

The volume and density variation information is very important for studying the alloy solidification process. The measurement and analysis of the volume and density changes in high-temperature alloys were performed using high-speed photography and computer MATLAB program image analysis technology. Three analysis methods are presented and evaluated, including the ordinary image threshold segmentation method, the elliptical fitting method, and the local dynamic threshold segmentation method. The ordinary image threshold segmentation method is most convenient for samples with clear boundaries. The ellipse fitting method can be used to analyse the sample image with an unclear boundary, which is convenient and fast, but its accuracy is low when the sample has imperfect ellipse shape. The local dynamic threshold segmentation method is the most accurate and best suited to samples with unclear boundaries. These techniques will allow us to also analyse the variations in the volume and density of high-temperature melt samples during the phase transition process.

Author Contributions

Conceptualization, T.N. and J.X.; methodology, J.X.; software, T.N. and Z.Y.; validation, J.X. and Z.Y.; formal analysis, Z.Y.; investigation, J.X. and T.N.; resources, J.X.; data curation, J.X. and Z.Y.; writing—original draft preparation, J.X. and T.N.; writing—review and editing, J.X., Z.Y. and P.K.G.; visualization, J.X.; supervision, J.X.; funding acquisition, J.X., Z.J. and P.K.G. All authors have read and agreed to the published version of the manuscript.

Funding

The authors gratefully acknowledge financial support from the National Natural Science Foundation of China (No. 51971166), the German Space Center Space Management (No. 50 WM1941) and the Science and Technology Program of Shaanxi Province (No. 2016KJXX-87).

Data Availability Statement

Not applicable.

Acknowledgments

The authors especially thank WW Fan, JT Cao and XL Xu for their help in this work.

Conflicts of Interest

The authors declare no conflict of interest.

References

  1. Ushakov, S.V.; Niessen, J.; Quirinale, D.G.; Prieler, R.; Navrotsky, A.; Telle, R. Measurements of Density of Liquid Oxides with an Aero-Acoustic Levitator. Materials 2021, 14, 822. [Google Scholar] [CrossRef]
  2. Watanabe, M.; Adachi, M.; Fukuyama, H. Densities of Au-X (X = Cu, Ni and Pd) binary melts and thermodynamic correlations. J. Mol. Liq. 2022, 348, 118050. [Google Scholar] [CrossRef]
  3. Naeem, M.; He, H.; Harjo, S.; Kawasaki, T.; Lin, W.; Kai, J.J.; Wu, Z.; Lan, S.; Wang, X.L. Temperature-dependent hardening contributions in CrFeCoNi high-entropy alloy. Acta Mater. 2021, 221, 117371. [Google Scholar] [CrossRef]
  4. Dogan, A.; Arslan, H. Thermophysical properties of Cu-In-Sn liquid Pb-free alloys: Viscosity and surface tension. Philos. Mag. 2018, 98, 37–53. [Google Scholar] [CrossRef]
  5. Xu, J.F.; Sun, G.Z.; Liu, Z.T.; Wang, Y.L.; Jian, Z.Y. Preparation and properties of Ge4Se96 glass. Infrared Phys. Technol. 2018, 89, 59–63. [Google Scholar] [CrossRef]
  6. Korobeinikov, A.I.; Endo, R.; Seetharaman, S.; Volkova, O. Density of Liquid Manganese Measured Using the Maximum Bubble Pressure Method. Metall. Mater. Trans. B 2021, 52, 571–575. [Google Scholar] [CrossRef]
  7. Fukuta, M.; Sumiyama, J.; Motozawa, M.; Yanagisawa, T. Surface tension measurement of oil/refrigerant mixture by maximum bubble pressure method. Int. J. Refrig. 2017, 73, 125–133. [Google Scholar] [CrossRef]
  8. Leitner, T.; Werkovits, A.; Kleber, S.; Pottlacher, G. Surface Tension and Density of Liquid Hot Work Tool Steel W360 by voestalpine BÖHLER Edelstahl GmbH & Co KG Measured with an Electromagnetic Levitation Apparatus. Int. J. Thermophys. 2021, 42, 16. [Google Scholar] [CrossRef]
  9. Jiang, Q.; Zhang, G.; Qi, X.; McLean, A. Modeling and Characterization of Surface Deformation and Current Distribution of Molten Droplets Under Electromagnetic Levitation. Metall. Mater. Trans. B 2023, 54, 1798–1806. [Google Scholar] [CrossRef]
  10. Watanabe, S.; Amatatu, M.; Saito, T. Densities of Fe-Ni, Co-Ni, Co-Mo and Co-W alloys in liquid State. Trans. Jpn. Inst. Met. 1971, 12, 337–342. [Google Scholar] [CrossRef]
  11. Pstruś, J.; Moser, Z.; Gąsior, W.; Dębski, A. Surface tension and density measurements of liquid Sn-Zn alloys. Experiment vs. SURDAT database of Pb-free solders. Arch. Metall. Mater. 2006, 51, 335–343. [Google Scholar] [CrossRef]
  12. Shiraishi, S.Y.; Ward, R.G. The density of nickel in the superheated and supercooled liquid states. Can. Metall. Q. 1964, 3, 117–122. [Google Scholar] [CrossRef]
  13. Saito, T.; Sakuma, Y. Densities of Pure Iron, Cobalt and Nickel in the molten state. Sci. Rep. Res. Ins. 1970, 22, 57–65. [Google Scholar]
  14. Reiplinger, B.; Brillo, J. Density and excess volume of the liquid Ti–V system measured in electromagnetic levitation. J. Mater. Sci. 2022, 57, 7954–7964. [Google Scholar] [CrossRef]
  15. Lohöfer, G. High-resolution inductive measurement of electrical resistivity and density of electromagnetically levitated liquid metal droplets. Rev. Sci. Instrum. 2018, 89, 124709. [Google Scholar] [CrossRef]
  16. Racz, L.M.; Egry, I. Advances in the measurement of density and thermal expansion of undercooled liquid metals. Rev. Sci. Instrum. 1995, 66, 4254–4258. [Google Scholar] [CrossRef]
  17. Brillo, J.; Egry, I. Density determination of liquid copper, nickel, and their alloys. Int. J. Thermophys. 2003, 24, 1155–1170. [Google Scholar] [CrossRef]
  18. Yan, P.; Zhang, G.; Yi, B.; Barati, M. Electromagnetic Levitation and Solidification of Ferrosilicon Alloy and Resulting Microstructural Evolution Mechanisms. J. Mater. Res. Technol. 2023, 24, 8296–8306. [Google Scholar] [CrossRef]
  19. Saito, T.; Shiraishi, Y.; Sakuma, Y. Density measurement of molten metals by levitation technique at temperatures between 1800 °C and 2200 °C. Trans. Iron. Steel. Inst. Jpn. 1969, 9, 118–126. [Google Scholar] [CrossRef]
  20. Brillo, J.; Egry, I.; Matsushita, T. Density and surface tension of liquid ternary Ni-Cu-Fe alloys. Int. J. Mater. Res. 2006, 97, 28–34. [Google Scholar] [CrossRef]
  21. Schmon, A.; Azizand, K.; Pottlacher, G. Density determination of liquid copper and liquid nickel by means of fast resistive pulse heating and electromagnetic levitation. Metall. Mater. Trans. A 2015, 46, 2674–2679. [Google Scholar] [CrossRef]
  22. Bradshaw, R.C.; Schmidt, D.P.; Rogers, J.R.; Kelton, K.F.; Hyers, R.W. Machine vision for high-precision volume measurement applied to levitated containerless material processing. Rev. Sci. Instrum. 2005, 76, 125108. [Google Scholar] [CrossRef]
  23. Chung, S.K.; Thiessen, D.B.; Rhim, W.K. A noncontact measurement technique for the density and thermal expansion coefficient of solid and liquid materials. Rev. Sci. Instrum. 1996, 67, 3175–3181. [Google Scholar] [CrossRef]
  24. Watanabe, M.; Takahashi, Y.; Imaizumi, S.; Zhao, Y.; Adachi, M.; Ohtsuka, M.; Chiba, A.; Koizumi, Y.; Fukuyama, H. Thermophysical properties of liquid Co–Cr–Mo alloys measured by electromagnetic levitation in a static magnetic field. Thermochim. Acta 2022, 708, 179119. [Google Scholar] [CrossRef]
  25. Matson, D.M.; Battezzati, L.; Galenko, P.K.; Gandin, C.-A.; Gangopadhyay, A.K.; Henein, H.; Kelton, K.F.; Kolbe, M.; Valloton, J.; Vogel, S.C.; et al. Electromagnetic levitation containerless processing of metallic materials in microgravity: Rapid solidification. Npj Microgravity 2023, 9, 65. [Google Scholar] [CrossRef]
  26. Toropova, L.V.; Alexandrov, D.V.; Kao, A.; Rettenmayr, M.; Galenko, P.K. Electromagnetic levitation method as a containerless experimental technique. Phys. Usp. 2023, 66, 722–733. [Google Scholar] [CrossRef]
  27. Rodriguez, J.E.; Kreischer, C.; Volkmann, T.; Matson, D.M. Solidification velocity of undercooled Fe–Co alloys. Acta Mater. 2017, 122, 431–437. [Google Scholar] [CrossRef]
  28. Liu, L.; Yang, L.; Li, J. Solidification Pathways in Highly Undercooled Co79.3B20.7 Alloy. Metall. Mater. Trans. A 2021, 52, 4324–4330. [Google Scholar] [CrossRef]
  29. An, H.; Xu, X. Study of non-equilibrium dendrite growth in an undercooled alloy. Mater. Sci. Technol. 2020, 36, 1720–1727. [Google Scholar] [CrossRef]
  30. Rahul, M.R.; Phanikumar, G. Solidification behaviour of undercooled equiatomic FeCuNi alloy. J. Alloys Compd. 2020, 815, 152334. [Google Scholar] [CrossRef]
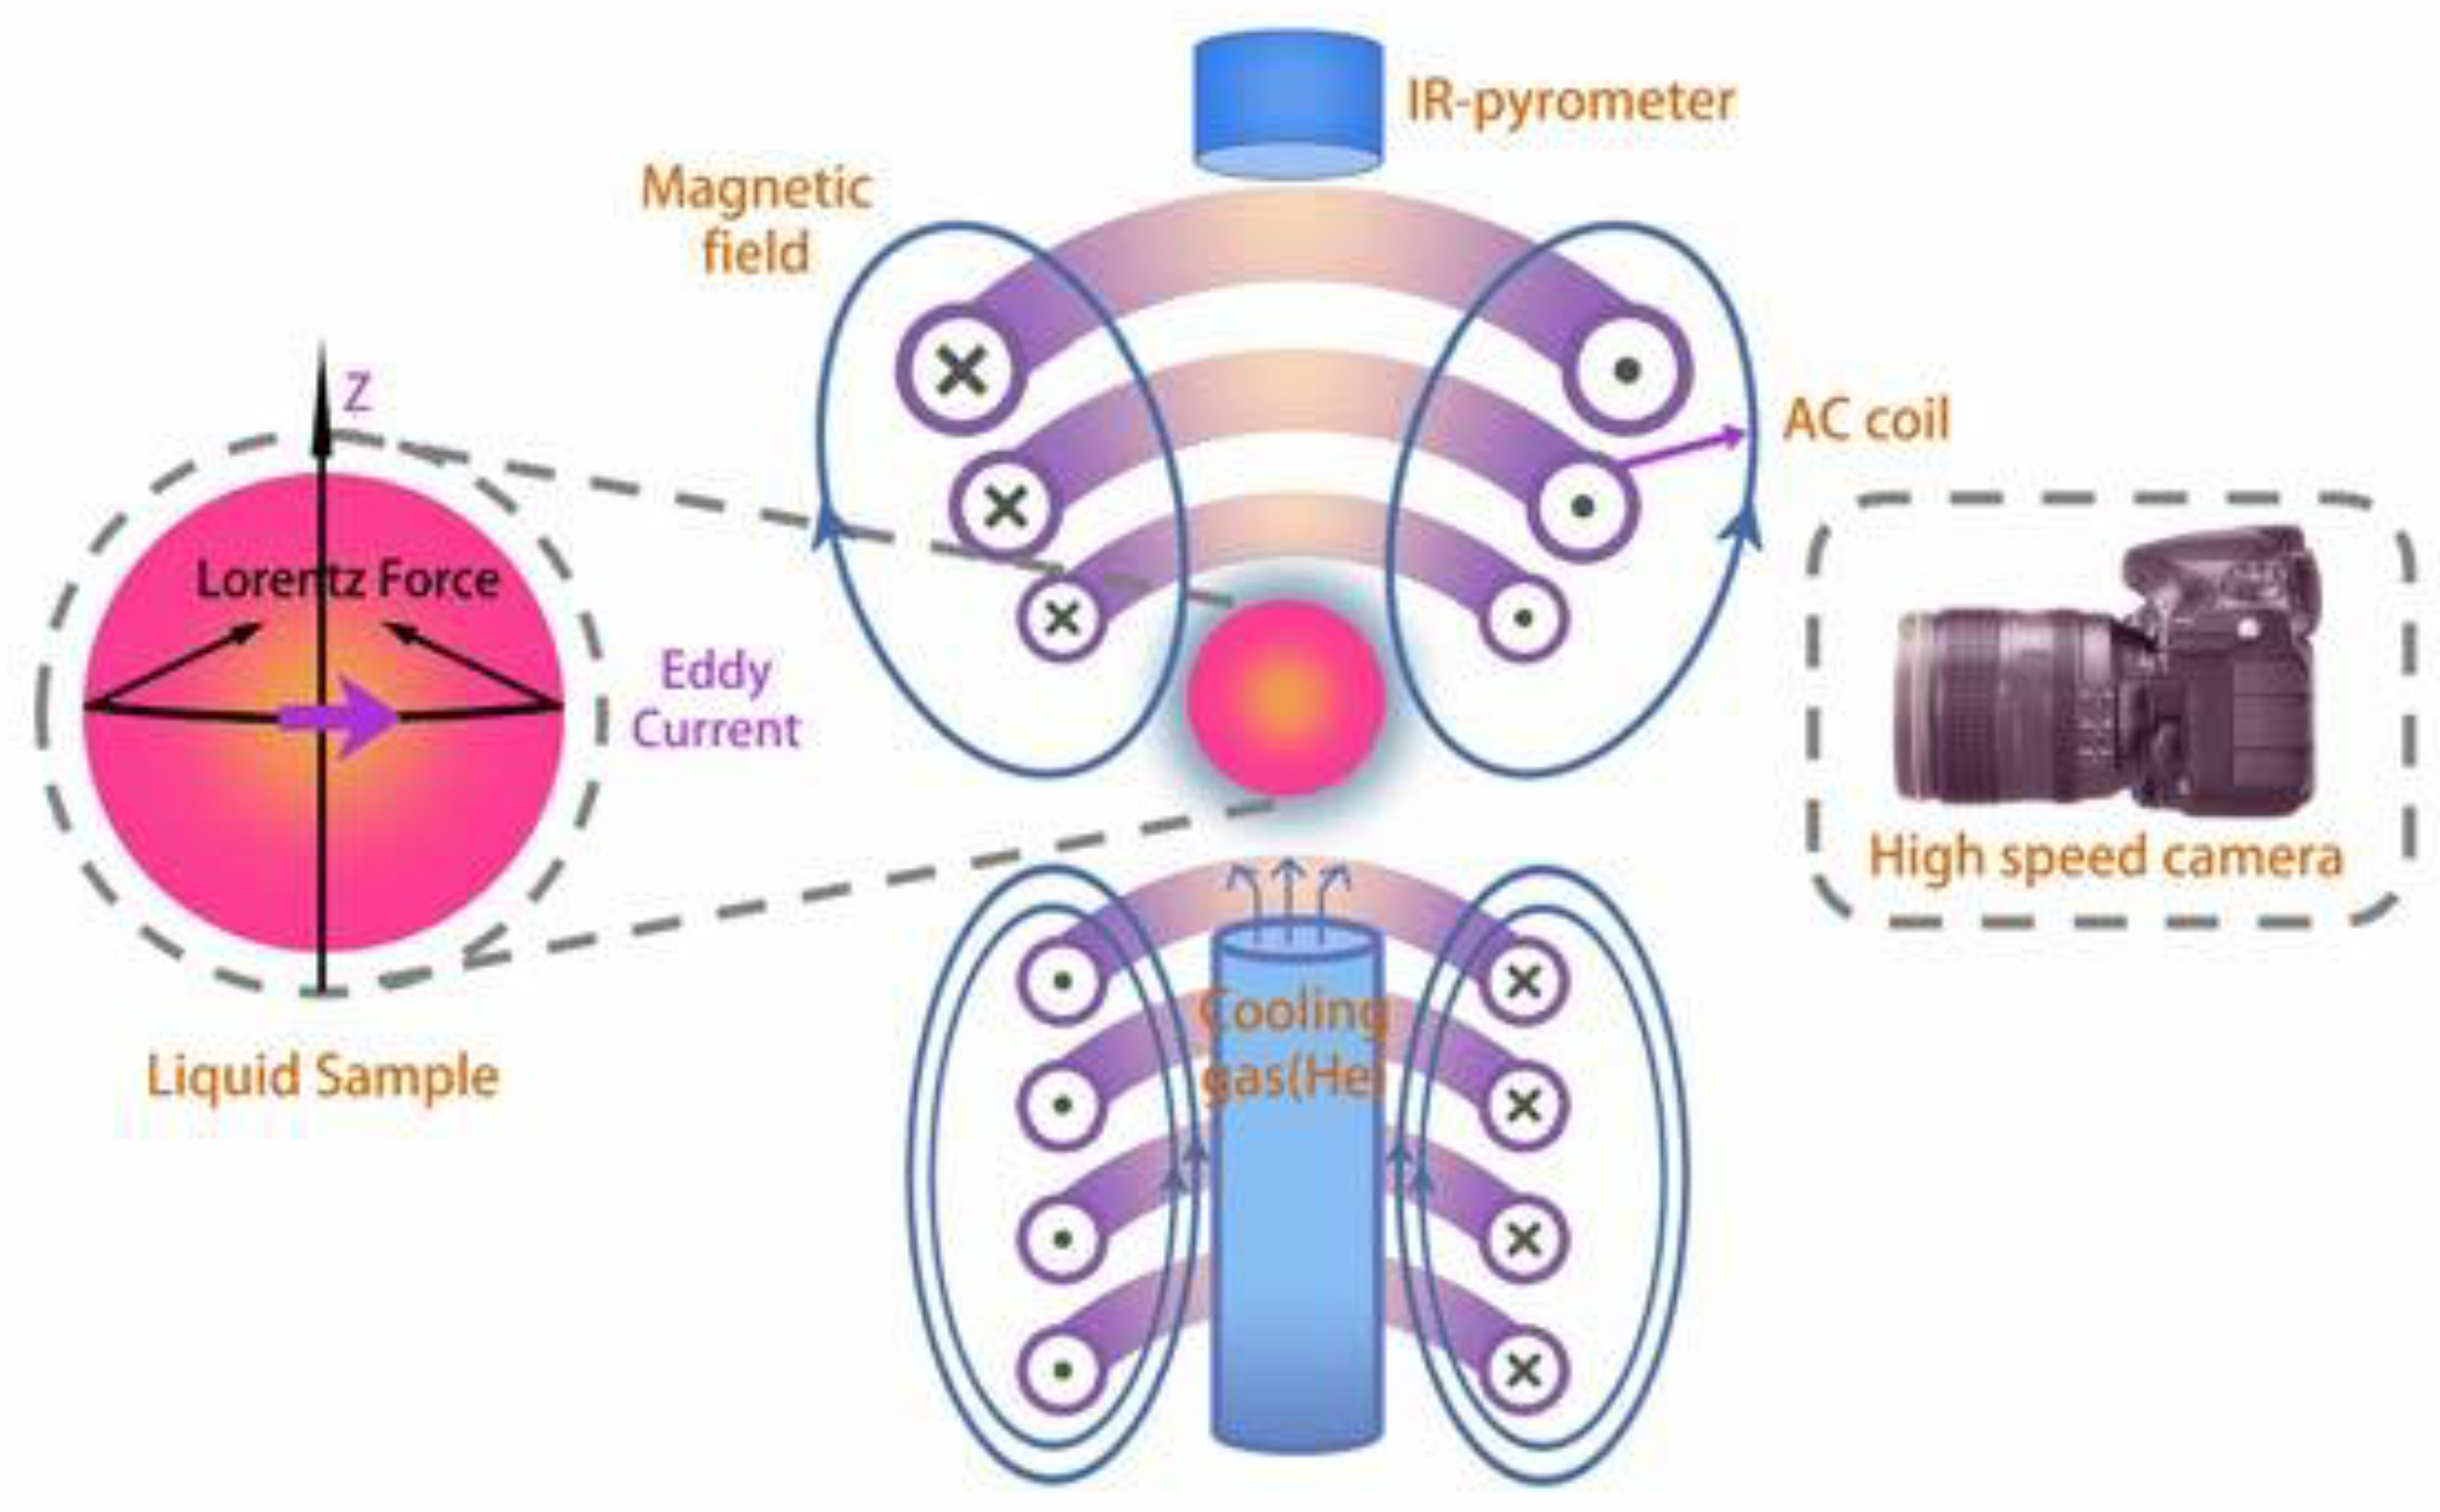
Figure 1. Schematic diagram of the electromagnetic levitation (noncontact) technique for measuring volume.
Crystals 13 01502 g001
Figure 2. Schematic diagram of the device for the melt flux technique.
Crystals 13 01502 g002
Figure 3. The solidification process images of two alloys: (a) the levitation sample of Al-Si alloy after solidification; (b) the levitation sample of Al-Si alloy in solidification; (c) the Ni-B alloy sample after solidification using the glass fluxing method; (d) the Ni-B sample in solidification by the glass fluxing method.
Crystals 13 01502 g003
Figure 4. Sample volume measurement in solidification: (a) greyscale image, (b) grey threshold histogram, (c) binarized image, (d) volume calculation by layer accumulation.
Crystals 13 01502 g004
Figure 5. The ordinaryimage threshold segmentation results on photos of partially solidified samples: (a) grey image of the sample photo; (b) small threshold (0.04); (c) large threshold (0.15).
Crystals 13 01502 g005
Figure 6. Elliptic fitting method: (a) manual point selection, least squares ellipse fitting method; (b) obtain a three-dimensional image of the sample based on the ellipse equation, and then perform volume calculation.
Crystals 13 01502 g006
Figure 7. The local dynamic threshold segmentation method for levitation melting samples: (a) image for the sample after solidification; (b) the contour line of the sample image after solidification; (c) the contour line of the sample after solidification and an analysed sample image during solidification; (dg) local region threshold segmentation on the contour line; and (h) filling the unanalysed area to obtain the contour of the sample during solidification.
Crystals 13 01502 g007
Figure 8. The analysis process for the local dynamic threshold segmentation method.
Crystals 13 01502 g008
Figure 9. The local dynamic threshold segmentation method for photos in Figure 3d: (a) referring to sample A and the contour line; (b) the contour line of sample A; (c) performing local threshold segmentation based contour of sample A for analysing sample B; (d) the analysed result of sample B.
Crystals 13 01502 g009
Disclaimer/Publisher’s Note: The statements, opinions and data contained in all publications are solely those of the individual author(s) and contributor(s) and not of MDPI and/or the editor(s). MDPI and/or the editor(s) disclaim responsibility for any injury to people or property resulting from any ideas, methods, instructions or products referred to in the content.