
New Organic Crystalline Material Close to Nodal-Line Materials: α′-STF2IBr2

1
Graduate School of Science and Engineering, Ehime University, Matsuyama 790-8577, Japan
2
Department of Physics, Toho University, Funabashi 274-8510, Japan
3
Research Unit for Materials Development for Efficient Utilization and Storage of Energy (E-USE), Ehime University, Matsuyama 790-8577, Japan
4
Geodynamics Research Center (GRC), Ehime University, Matsuyama 790-8577, Japan
*
Author to whom correspondence should be addressed.
Crystals 2023, 13(11), 1606; https://doi.org/10.3390/cryst13111606
Submission received: 27 October 2023
/
Revised: 14 November 2023
/
Accepted: 17 November 2023
/
Published: 20 November 2023
(This article belongs to the Special Issue Charge-Transfer Complexes (CTCs) and Related Interactions)
Abstract
:Recently, topological materials (TMs) have attracted attention from various scientists. Their electronic properties are governed by relativistic particles called Dirac fermions which, in some cases, possess no masses and move in solids with the speed of light. In addition to the unique particles, such materials exhibit unprecedented electronic properties because of the quantum effects (interference between wavefunctions). Examples include nodal-line materials (NLMs), where metallic or even superconducting properties may appear only at the surface of the single crystals of insulators. Thus far, whether they be organic or inorganic compounds, TMs have hardly been discovered except for the zero-gap conductors (ZGCs), because there is no guideline on how to develop such unusual materials. In this work, we prepared a new organic charge–transfer complex, α′-STF2IBr2 (STF = bis(ethylenedithio)diselenadithiafulvalene), which measured the electrical and magnetic properties and calculated the band structure and intermolecular interactions. A close comparison with those of α-STF2I3, being established as a ZGC at p > 12–15 kbar, revealed that α′-STF2IBr2 is also closely related to it, but belongs to a different type of TMs, namely NLMs. This finding will accelerate the successive findings of NLMs to elucidate the mechanism of their unique electronic properties.
1. Introduction
Recently, the Dirac electron systems (DESs), or more generally topological materials (TMs), have been paid increasing attention [1,2,3,4,5,6,7,8]. In organic or molecular materials, the charge–transfer (CT) complexes/salts containing DESs called zero-gap conductors (ZGCs) have been intensively studied for nearly two decades [9,10,11,12,13,14,15,16,17,18,19,20,21,22,23,24,25,26,27,28]. This is not only because of their unique physical properties, but also because of their advantage for research on basic electronic properties and the mechanism of production of DESs owing to the well-defined structures and stoichiometries. The DESs are characterized by linearly dispersive bands in contrast with cosine or parabolic bands of standard electron systems (SESs). For example, the ZGCs are distinguished from other materials by a pair of cone-shaped band structures in contact with each other at their apexes at the Fermi levels (Figure 1). Unlike SESs, they exhibit neither metallic nor nonmetallic behavior. Examples include temperature (T)-independent resistivity [29,30], wavenumber-independent optical conductivity [31,32], and the unprecedented behavior of magnetoresistance [9,19,20,21,25]. Additionally, the wide variety of organic ZGCs based on finely controllable syntheses add an advantage for systematic studies. Since the discovery of the ZGC in organic compounds, α-ET2I3 under high pressure (p > 12–15 kbar) (ET = bis(ethylenedithio)tetrathiafulvalene, Figure 1) [9], many kinds of molecular crystalline materials have also been reported to exhibit electronic properties and band structures characteristic to the ZGCs [10,11,12,13,14,15,16,17,18,19,20,21,22,23,24,25,26,27,28]. In this way, our understanding of organic ZGCs has made substantial progress over the last 10–15 years, regarding band structures and electrical and magnetic properties. However, there are no reports on other types of organic/molecular TMs apart from the ZGCs. Most of the organic/molecular materials require high p to become ZGCs, and they share few structural features for comparative study. Additionally, it is generally demanding to analyze crystal structures at high p. These drawbacks have prevented researchers from conducting systematic studies on the TMs. Thus, it is important to develop a closely related series of organic ambient-p TMs different from ZGCs.
During such material development, we synthesized the title compound, α′-STF2IBr2 (STF = bis(ethylenedithio)diselenadithiafulvalene). This new material possesses a closely related crystal structure to α-STF2I3, which is reported to be a DES [23,24,25]. They share the same space group (P1) and similar lattice constants. Yet, a closer examination of the molecular arrangement indicated significant differences in the electronic structure and physical properties of α′-STF2IBr2 compared to α-STF2I3. In this article, we compare the molecular arrangements, band structures, and electronic properties of the two complexes to reveal the uniqueness of α′-STF2IBr2 as an organic, bulk DES.
2. Materials and Methods
The neutral STF [33] and (n-C4H9)4NIBr2 [34] were synthesized as reported. The single crystals of α′-STF2IBr2 were obtained by a standard electrochemical method, where STF (7–10 mg, ~0.015–0.020 mmoL) and (n-C4H9)4NIBr2 (55–65 mg, ~0.10–0.12 mmoL) in a dry tetrahydrofuran solution (10 mL) were electrolyzed with a constant current (4.0 μA) at 35 °C under an N2 atmosphere. Platinum wire electrodes (1 mm in thickness) were used.
The electrical resistivity of the single crystals of α′-STF2IBr2 was measured using a variable-temperature cryostat (Cryogenic Ltd., London, UK), a four- or six-probe method, and a clump type high-pressure cell made of Cu-Be/NiCrAl alloy (High Pressure Cell CTF-HHPC60, C&T Factory Co., Ltd., Tokyo, Japan). The single crystals were sealed in a Teflon capsule with a pressure medium (Daphne oil 7373, Idemitsu Kosan Co., Ltd., Tokyo, Japan), which was set in the high-pressure cell. The temperature was controlled by a Model 62 (Cryogenic Control Systems Inc. (Cryo-con), Rancho Santa Fe, CA, USA) and was monitored using a Cernox thermometer (Lake Shore Cryotronics Inc., Westerville, OH, USA). A Keithley 6221 AC and DC Current Source (Tektronix, Inc., Tokyo, Japan) and a Keithley 2182A Nanovoltmeter (Tektronix, Inc., Tokyo, Japan) were used as a power source and a voltmeter, respectively.
As the electrical leads, gold wires (0.015 mm in thickness; The Nilaco Corp., Tokyo, Japan) were attached on the ab plane along the (110)-direction (most conductive and developed direction) of each crystal with electrically conductive carbon paste (DuPont Japan, Tokyo, Japan). The cooling rate was approximately −0.1 K/min for avoiding the disorder of the ethylene groups, which was confirmed by the X-ray structural analyses, as described below.
The single-crystal X-ray structural analyses were performed using VariMax SaturnCCD724α (Rigaku, Tokyo, Japan) with a temperature controller of a continuous-flow-type liquid nitrogen cryostat. The Ts of analyses were 300, 150, and 90 K. The effects of the cooling rate on the structures were examined using rapid (−1.0 K/min) and slow (−0.1 K/min) cooling processes from 300 to 90 K. After the slow cooling from 300 to 90 K, followed by the structural data collection at 90 K, the structural data at 150 K were collected after warming the crystal from 90 to 150 K (+1.0 K/min). As the slow cooling did not yield disordered structures, the slow cooling-rate (−0.1 K/min) was also used in the resistivity measurements. The collected data were processed using CrysAlisPro ver. 171.41_64.93a (Rigaku, Tokyo, Japan) prior to the structure solving and refinement using Olex 21.5. The hydrogen atoms on the ethylene groups of the STF molecules were located at the calculated positions when the ethylene groups were not disordered; otherwise, they were located using difference Fourier syntheses. Further details of the data collection and analyses are described in the .cif files deposited to the Cambridge Crystallographic Data Centre (CCDC). The CCDC deposit numbers of the .cif files are as follows: 2,298,691 (296 K), 2,299,346 (150 K), and 2,261,968 (90 K).
The magnetic susceptibility was measured for the polycrystalline samples using the DC mode of a SQUID susceptometer (a magnetic property measurement system, MPMS-XL7 with a recirculating system EverCool; Quantum Design Japan, Inc., Tokyo, Japan). Every piece of the single crystals used in the measurements was briefly analyzed by X-ray oscillation photographs to confirm the polymorphs and crystal qualities. Small and/or low-quality crystals were not used to avoid possible Curie tail originating from adsorbed oxygen and lattice defects at low Ts. The selected single crystals (~3.6 mg, 3 × 10⁻³ mmol) were set in a gelatin capsule with ventilation holes, which was set in polystyrene straw for magnetic measurements fixed with small pieces of the same straw (Quantum Design Japan, Inc.). Prior to the sample measurements, the background, namely the diamagnetic susceptibility of the capsule and straw, was measured (300–2 K) using the same procedure of measurement as that of the sample to correct the observed values of the sample. The sample exchange room was evacuated and purged fifty times by He gas before the sample was inserted into the main chamber. The applied magnetic field was 1 T, which was confirmed to be in the linear range of the magnetization curve. Field- (FC) and zero-field-cooling (ZFC) processes were both examined and confirmed to yield identical results. The cooling rate did not affect the magnetic behavior as obviously as the resistivity measurements, including the data scatterings. Slower cooling rates (<−0.5 K/min) did not improve the data scatterings in the susceptibility, perhaps because the T fluctuation during the cooling processes became comparable to the lower cooling rates. The diamagnetic contribution of neutral STF (−1.55 × 10⁻⁴ emu moL−1) was cited from previous work [24]. The diamagnetic contribution of IBr2 (−1.02 × 10⁻⁴ emu mol−1) was estimated using the observed values of (n-C4H9)4NIBr2 (−2.95 × 10⁻⁴ emu moL−1) measured in this work, and the published data for (n-C4H9)4NI (−2.44 × 10⁻⁴ emu moL−1) and the I− ions (−5.06 × 10⁻⁵ emu moL−1) [24] based on Pascal’s additive law.
The extended Hückel tight-binding band calculation was performed based on the disorder-free structure (except for the STF sites) at 90 K using CAESAR (Crystal and electronic structure analyzer, PrimeColor Software, Inc., Raleigh, NC, USA) [35]. The disordered S and Se atoms of the STF molecules were treated as if they were intermediate atoms between S and Se, as in the previous work [23,36,37]. Double-zeta Slater-type orbitals, χμ, were used to describe the outermost orbitals (Equation (1)).
where (r, θ, ϕ), n, ζ, and Y(θ, ϕ) are the coordinates in a spheric coordinate system, the principal quantum number, the exponent, and the spherical harmonics, respectively. As there are many kinds of extended Hückel parameters thus far known, we examined different parameters and selected the most appropriate parameters for α′-STF2IBr2 (Table 1), which accounted for the observed physical properties better than other parameters.
3. Results
3.1. Stuructural Properties
Figure 2 shows the crystal structures of α′-STF2IBr2 at 296 K and 90 K (−0.1 K/min). The lattice constants and other details are summarized in Table 2. Since the α′-type structures are closely related to the α-type structures, the latter is also shown in Figure 2b for comparison. At all temperatures, the asymmetric unit of α′-STF2IBr2 contains two whole STF species and one whole IBr2 species, and none of them are on the special positions with high symmetries. This type of donor molecular arrangement is called α′-type, and has been previously found in some ET (ET = bis(ethylenedithio)-tetrathiafulvalene) complexes with trihalide and related anions [38,39,40,41,42,43,44,45,46]. The asymmetric unit of α′-STF2IBr2 contrasts with that of the α-STF2I3, where two halves and one whole STF species and two halves of I3 species are crystallographically independent. Accordingly, two STF and two I3 species are on the special positions (the inversion centers) in α-STF2I3. The remaining one STF species is related to the facing STF species with an inversion center in α-STF2I3.
Owing to the feature that two halves of the I3 anions are contained in the unit cell, it appears as if the α-type structure should contain the anions that are practically double of those in the α′-type structure (Figure 2a,b). As a result, the STF–STF, STF–anion, and anion–anion interactions are closer and more isotropic in α-STF2I3 than α′-STF2IBr2, as discussed in the following sections, although the densities are practically the same (~2.5–2.6 g cm−3 at 296 K) and the space groups are identical (P1) between the two complexes. The packing motif of the trihalide anions also affects the donor-anion (CH—X) contacts and the disorder of the ethylene groups of the STF molecules, which creates differences in the electronic structures and properties between α- and α′-type complexes, as discussed below.
As is often observed with this type of material, there are two-dimensional (2D) arrangements of the STF radical cations in the ab planes and 2D sheets of the IBr2 anions in the adjacent ab planes (Figure 2d). The STF and IBr2 sheets alternate with each other along the c-axis (Figure 2d, the upper figure). The STF cations stack along the a-axis with a twofold period (Figure 2d, the lower figure). There are intermolecular interactions between the STF columns suggested by S—S short contacts (<3.70 Å).
In the α′-type complexes, all the IBr2 anions are parallel to each other, which contrasts with the zigzag anion arrangement in the α-type complexes. The distance between neighboring Br atoms in independent IBr2 anions (4.3834(10) Å) is longer than the van der Waals distance of Br—Br (3.70–3.90 Å) [47,48,49], suggesting negligible interactions between the IBr2 anions. This contrasts with the shorter I—I distance (for example, 3.8817(13) and 3.8847(5) Å at 296 and 93 K, respectively) [24] than the van der Waals distance (3.96–4.30 Å) in α-STF2I3 at ambient pressure [47,48,49]. Recently, it has been clarified that the I3 anions are also involved in the conduction pathway of α-D2I3 (D = ET, STF, BETS) at ambient pressure and a wide range of temperatures [50]. The intermolecular interactions (STF–STF, STF–IBr2, IBr2–IBr2) are quantitatively estimated by the extended Hückel calculation of overlap integrals below, which shows that the abovementioned structural features are consistent with the extent of interactions.
The Se and S atoms in the inner chalcogen atoms of STF were disordered with the probability of S:Se = 50%:50% at all the temperatures of measurement independent of the cooling rates. One of the ethylene groups of STF is disordered at 296 K (Figure 2c). At 90 K, there is no disorder at the ethylene groups, when the sample was cooled by −0.1 K/min. When the sample was cooled by −1 K/min down to 90 K, the structure was not solved, presumably because of the heavy disorder. Based on the space group (P1) and the lattice constants, there is no phase transition at 296–90 K.
The shortest STF(ethylene group)–IBr2 distances are 3.2515(6) (Br—H), 3.3782(6) (Br—H), and 3.4060(4) (I—H) Å for the ordered ethylene groups, and 2.8803(6) (Br—H), 2.8987(8) (Br—H), 3.2107(6) Å (Br—H), and 3.3874(4) (I—H) for the disordered ethylene groups. As the van der Waals distances are 2.94–3.15 Å (Br—H) and 3.09–3.35 Å (I—H) [47,48,49], the STF–IBr2 interactions are suggested to be negligible based on the distances.
3.2. Electronic Properties
Figure 3 shows the T- and P-dependences of the electrical resistivity ρ(T, P) of α′-STF2IBr2. The value of ρ(300 K, 0 GPa) = 0.001–0.010 Ω cm, which gradually increased with decreasing T. The observed ρ(T, 0 GPa) is semiconducting, being approximately reproduced by a thermally activated model, which yields an activation energy Ea(0 GPa) of 0.055 eV. The monotonic behavior indicates no phase transitions at 0–2.0 GPa, although the values of Ea decrease with increasing P. Despite the thermodynamically stable nonmetallic behavior, α′-STF2IBr2 exhibited rather low resistivity and rather small activation energy.
Figure 4a shows the T dependencies of the magnetic susceptibility χ(T) of α′-STF2IBr2 with that of α-STF2I3 [24] for comparison. A closer examination reveals that the T dependence of χ(T) is better described by a downward convex curve exhibiting a broad minimum at T ~ 100–150 K (Figure 4b). The value of χ(300 K) is ~6.8 × 10⁻⁴ emu moL−1. Within experimental error, the behavior is identical between the FC and ZFC processes. The almost T-independent χ(T) of α′-STF2IBr2 without hysteresis makes a sharp contrast with that of α-STF2I3. However, the ρ(T, 2.0 GPa) of α′-STF2IBr2 is closely related to the ρ(T, 0 GPa) of α-STF2I3 (Figure 3b), which suggests a similarity of the band structures between the two complexes at respective pressures. The inconsistency in the T-dependences between the ρ(T) and χ(T) of α′-STF2IBr2 suggests that the activation energy of ρ(T) should not be associated with an energy gap between the valence and conduction bands. The different samples and runs of measurements often produced varied resistivity behavior (Figure A1). Additionally, hysteresis was often observed between the cooling and heating processes, where the hysteretic T ranges were irreproducible and sometimes complicated. As it is difficult to control dT/dt (K/s) in ρ(T) measurements to be constant and accurate within ca. ±0.5 K, the observed variation in ρ(T) behavior suggests that the ρ(T) of α′-STF2IBr2 is sensitive to strain to the crystals or the disorder of the ethylene groups, which may frequently be caused during cooling processes by electrical leads and T-fluctuation, respectively. This probably accounts for the inconsistency between semiconducting ρ(T) and metallic χ(T).
3.3. Calculated Band Structure
Figure 5a shows the tight-binding band structure of α′-STF2IBr2 based on an extended Hückel approximation and the crystal structure at 90 K. All the STF cations and IBr2 anions in the unit cell were considered in the calculation. Based on the same calculation and the observed molecular structure in α′-STF2IBr2, the HOMO-LUMO gap of the isolated STF molecules was 3.60 eV (344 nm), which quantitatively agrees with the observed solution spectra of neutral STF molecules (λmax = 326 nm, logε = 4.18 in C6H5Cl at 20 °C [50]). Thus, the calculation results below are reliable. The obtained band structure is a 3/4-filled semimetallic band, indicating that the average charges on the STF and IBr2 species are +0.5 and −1, respectively. Therefore, there is practically no CT interaction between STF and IBr2, which is consistent with the crystal structure (Figure 2) and the overlap integrals shown below.
3.4. Calculated Intermolecular Interactions
3.4.1. STF–STF Interactions
Figure 6 and Table 3 show the calculated STF(SOMO)–STF(SOMO) interactions based on an extended Hückel approximation and the crystal structure at 90 K. As suggested by the structural analyses, the STF–STF interactions are described by two kinds of dimers (the molecular pairs connected with the arrows B and D in Figure 6) weakly connected with each other via the S—S network, forming the conducting sheets.
3.4.2. IBr2–IBr2 and STF–IBr2 Interactions
The IBr2–IBr2 interactions between the HOMOs were calculated based on an extended Hückel approximation and the crystal structure at 90 K. As suggested by the structural analyses, all the IBr2–IBr2 interactions are negligible (S < 10−4).
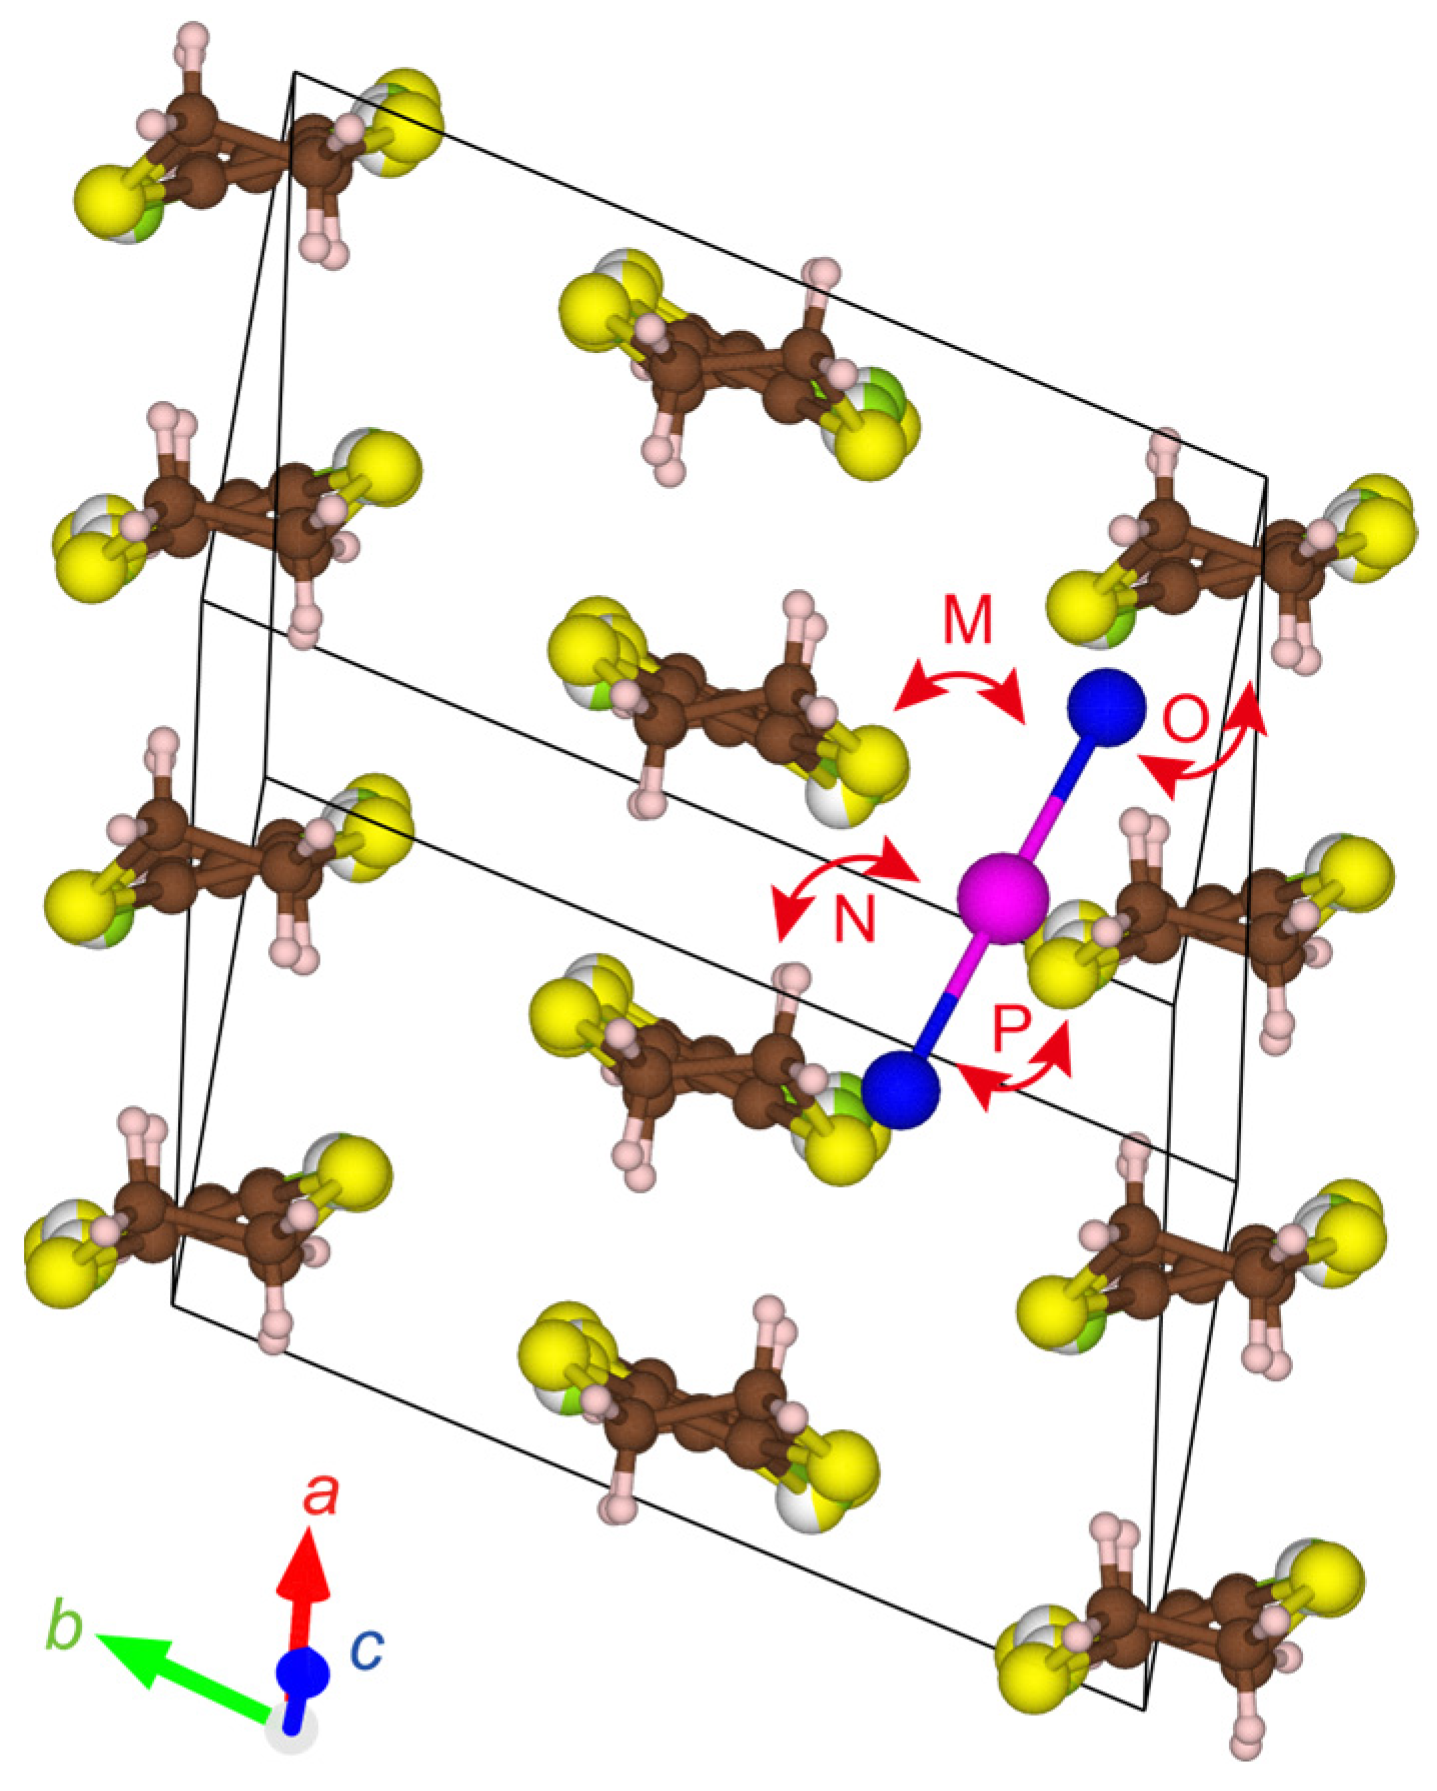
Figure 7 and Table 4 show the calculated STF(SOMO)–IBr2(HOMO) interactions based on an extended Hückel approximation and the crystal structure at 90 K. Based on Table 4, it is difficult to estimate how strong the net STF–IBr2 interaction is. However, the observed Br—I bond lengths (2.6991(3) and 2.7031(3) Å) and I—Br—I bond angles (179.759(14)°) agree well with those of (n-C4H9)4NIBr2 (2.687(2) and 2.704(2) Å, and 176.27(4)°, respectively), where isolated IBr2− species were identified based on a single crystal X-ray structural analysis and X-ray photoelectron, infrared, and Raman spectra [51].
The discussion thus far indicates that the IBr2 anions are closed-shell and monovalent, forming the insulating sheets; if the IBr2 anions are not in a monovalent state with the closed-shell structure, they must interact with each other or with STF to delocalize and stabilize the unpaired electrons. In other words, α′-STF2IBr2 forms an ideal 2D conduction system in contrast with the three-dimensional (3D) conduction system of related materials [50,52].
4. Discussion
Although both α-STF2I3 and α′-STF2IBr2 belong to the same space group, P1, the differences in the anion arrangements relate to differences in CH—X contacts and the disorder in the ethylene groups, which affected the electronic properties of each complex. Such structural differences resulted in 2D (α′-STF2IBr2) vs. 3D (α-STF2I3) conduction systems. The most interesting feature of α′-STF2IBr2 is the band structure, as shown in Figure 5a: a small and nearly constant energy separation (~0.08 eV) occurs in a broad range between the X(0.5, 0, 0) and Y(0, 0.5, 0) points, where linear band dispersion [1,2,3,4,5,6,7,8] is observed. Note that both X and Y points are special positions with a high symmetry (an inversion center), while the remaining points along the X—Y line are of low symmetries. Such a characteristic band structure suggests that α′-STF2IBr2 should be close to nodal-line-type semimetals (NLSMs) [1,2,3,4,5,6,7,8]. In fact, the nodal lines (two-fold degeneracy) disappeared by the interaction between the two bands to produce the energy separation because of the low symmetry at the reciprocal points. The band structure of α′-STF2IBr2 contrasts that of α-STF2I3, known as a DES (Figure 5b) [23,24,25,36,37], proving that α′-STF2IBr2 is a different type of DES-related material from the known organic DESs. Despite the extensive research for years, the NLSMs and related materials are scarcely reported; a limited number of inorganic compounds are established as NLSMs, while there are no organic NLSMs. The band structures of NLSMs are characterized by the extended band touching along certain curves in k space, which requires extra symmetries besides translation to topologically protect the degeneracy of the two bands. Although molecular crystals generally do not exhibit high symmetries unlike some inorganic compounds, the well-defined stoichiometries, varieties, and high quality of single crystals are a unique advantage over other types of materials. Because of the lack of such samples, the studies on NLSMs are mainly of theoretical work except for the experimental identification of NLSMs using angle-resolved photoelectron spectroscopy (ARPES) [1,2,3,4,5,6,7,8], and experimental investigation on the various bulk properties remain to be performed. The electrical and magnetic properties of α′-STF2Ibr2 and related materials will pave the way for such studies.
Author Contributions
Conceptualization, T.N.; methodology, T.N.; software, T.N.; validation, R.O., K.F. and N.T.; formal analysis, T.N., R.O., K.F. and N.T.; investigation, K.F., R.O. and N.T.; resources, T.N. and N.T.; data curation, T.N.; writing—original draft preparation, T.N.; writing—review and editing, T.N.; visualization, R.O., K.F., N.T. and T.N.; supervision, T.N.; project administration, T.N.; funding acquisition, T.N. and N.T. All authors have read and agreed to the published version of the manuscript.
Funding
This work was partially funded by a Grant-in-Aid for Challenging Exploratory Research (18K19061) and a Grant-in-Aid for Scientific Research (B) (22H02034) of JSPS, the Iketani Science and Technology Foundation (ISTF; 0331005-A), the Research Grant Program of the Futaba Foundation, CASIO Science Promotion Foundation, an Ehime University Grant for Project for the Promotion of Industry/University Cooperation, and the Canon Foundation (Science and Technology that Achieve a Good Future).
Data Availability Statement
The data presented in this study are available in this article.
Acknowledgments
We would like to acknowledge the assistance provided by K. Konishi (Graduate School of Science and Engineering, Ehime University; in the SQUID measurements) and S. Mori and R. Konishi (ADRES, Ehime University; in the X-ray structural analyses).
Conflicts of Interest
The authors declare no conflict of interest. The funders had no role in the design of the study; in the collection, analyses, or interpretation of data; in the writing of the manuscript; or in the decision to publish the results.
Appendix A
Figure A1.
Observed differences of ρ(T) of α′-STF2IBr2 at 1bar in independent samples (single crystals) and measurements, where the measurement conditions were practically identical within experimental error: (a) ρ vs. T; (b) Arrhenius plot of the data shown in Figure A1a. In Figure A1b, the data at T ≤ 50 K (plateau) were omitted for clearly showing the differences and hysteretic behavior at higher T. The data of Sample #1 (cooling process data only) in Figure A1a,b are the same with those in Figure 3a (0 GPa).

References
- Yang, S.-Y.; Yang, H.; Derunova, E.; Parkin, S.S.P.; Yan, B.; Ali, M.N. Symmetry demanded topological nodal-line materials. Adv. Phys. X 2018, 3, 1414631. [Google Scholar] [CrossRef]
- Armitage, N.P.; Mele, E.J.; Vishwanath, A. Weyl and Dirac semimetals in three-dimensional solids. Rev. Mod. Phys. 2018, 90, 015001. [Google Scholar] [CrossRef]
- Hosen, M.M.; Dimitri, K.; Belopolski, I.; Maldonado, P.; Sanker, R.; Dhakal, N.; Dhakal, G.; Cole, T.; Oppeneer, P.M.; Kaczorowski, D.; et al. Tunability of the topological nodal-line semimetal phase in ZrSiX-type materials (X = S, Se, Te). Phys. Rev. B 2017, 95, 161101. [Google Scholar] [CrossRef]
- Bian, G.; Chang, T.-R.; Sanker, R.; Xu, S.-Y.; Zheng, H.; Neupert, T.; Chiu, C.-K.; Huang, S.-M.; Chang, G.; Belopolski, I.; et al. Topological nodal-line fermions in spin-orbit metal PbTaSe2. Nat. Commun. 2016, 7, 10556. [Google Scholar] [CrossRef]
- Schoop, L.M.; Ali, M.N.; Straβer, C.; Topp, A.; Varykhalov, A.; Marchenko, D.; Duppel, V.; Parkin, S.S.P.; Lotsch, B.V.; Ast, C.R. Dirac cone protected by non-symmorphic symmetry and three-dimensional Dirac line node in ZrSiS. Nat. Commun. 2016, 7, 11696. [Google Scholar] [CrossRef]
- Neupane, M.; Belopolski, I.; Hosen, M.M.; Sanchez, D.S.; Sanker, R.; Szlawska, M.; Xu, S.-Y.; Dimitri, K.; Dhakal, N.; Maldonado, P.; et al. Observation of topological nodal fermion semimetal phase in ZrSiS. Phys. Rev. B 2016, 93, 201104. [Google Scholar] [CrossRef]
- Takane, D.; Wang, Z.; Souma, S.; Nakayama, K.; Trang, C.X.; Sato, T.; Takahashi, T.; Ando, Y. Dirac-node arc in the topological line-node semimetal HfSiS. Phys. Rev. B 2016, 94, 121108. [Google Scholar] [CrossRef]
- Hu, J.; Tang, Z.; Liu, J.; Liu, X.; Zhu, Y.; Graf, D.; Myhro, K.; Tran, S.; Lau, C.N.; Wei, J.; et al. Evidence of topological nodal-line fermions in ZrSiSe and ZrSiTe. Phys. Rev. Lett. 2016, 117, 016602. [Google Scholar] [CrossRef]
- Kobayashi, A.; Suzumura, Y.; Fukuyama, H. Hall effect and orbital diamagnetism in zerogap state of molecular conductor α-(BEDT-TTF)2I3. J. Phys. Soc. Jpn. 2008, 77, 064718. [Google Scholar] [CrossRef]
- Kato, R.; Suzumura, Y. Novel Dirac electron in single-component molecular conductor [Pd(dddt)2] (dddt = 5,6-dihydro-1,4-dithiin-2,3-dithiolate). J. Phys. Soc. Jpn. 2017, 86, 064705. [Google Scholar] [CrossRef]
- Kato, R.; Cui, H.-B.; Tsumuraya, T.; Miyazaki, T.; Suzumura, Y. Emergence of the Dirac electron system in a single-component molecular conductor under high pressure. J. Am. Chem. Soc. 2017, 139, 1770–1773. [Google Scholar] [CrossRef] [PubMed]
- Suzumura, Y.; Kato, R. Magnetic susceptibility of Dirac electrons in single-component molecular conductor [Pd(dddt)2] under pressure. Jpn. J. Appl. Phys. 2017, 56, 05FB02. [Google Scholar] [CrossRef]
- Suzumura, Y. Anisotropic conductivity of nodal line semimetal in single-component molecular conductor [Pd(dddt)2]. J. Phys. Soc. Jpn. 2017, 86, 124710. [Google Scholar] [CrossRef]
- Tsumuraya, T.; Kato, R.; Suzumura, Y. Effective hamiltonian of topological nodal line semimetal in single-component molecular conductor [Pd(dddt)2] from first-principles. J. Phys. Soc. Jpn. 2018, 87, 113701. [Google Scholar] [CrossRef]
- Suzumura, Y.; Cui, H.; Kato, R. Conductivity and resistivity of Dirac electrons in single-component molecular conductor [Pd(dddt)2]. J. Phys. Soc. Jpn. 2018, 87, 084702. [Google Scholar] [CrossRef]
- Zhou, B.; Ishibashi, S.; Ishii, T.; Sekine, T.; Takehara, R.; Miyagawa, K.; Kanoda, K.; Nishibori, E.; Kobayashi, A. Single-component molecular conductor [Pt(dmdt)2]—A three-dimensional ambient-pressure molecular Dirac electron system. Chem. Commun. 2019, 55, 3327–3330. [Google Scholar] [CrossRef]
- Suzumura, Y.; Kato, R.; Ogata, M. Electric transport of nodal line semimetals in single-component molecular conductors. Crystals 2020, 10, 862. [Google Scholar] [CrossRef]
- Kato, R.; Cui, H.; Minamidate, T.; Yeung, H.H.-M.; Suzumura, Y. Electronic structure of a single-component molecular conductor [Pd(dddt)2] (dddt = 5,6-dihydro-1,4-dithiin-2,3-dithiolate) under high pressure. J. Phys. Soc. Jpn. 2020, 89, 124706. [Google Scholar] [CrossRef]
- Cui, H.; Yeung, H.H.-M.; Kawasugi, Y.; Minamidate, T.; Saunders, L.K.; Kato, R. High-pressure crystal structure and unusual magnetoresistance of a single-component molecular conductor [Pd(dddt)2] (dddt = 5,6-dihydro-1,4-dithiin-2,3-dithiolate). Crystals 2021, 11, 534. [Google Scholar] [CrossRef]
- Matsuno, G.; Omori, Y.; Eguchi, T.; Kobayashi, A. Topological domain wall and valley Hall effect in charge ordered phase of molecular Dirac Fermion system α-(BEDT-TTF)2I3. J. Phys. Soc. Jpn. 2016, 85, 094710. [Google Scholar] [CrossRef]
- Tani, T.; Tajima, N.; Kobayashi, A. Field-angle dependence of interlayer magnetoresistance in organic Dirac electron system α-(BEDT-TTF)2I3. Crystals 2019, 9, 212. [Google Scholar] [CrossRef]
- Li, W.; Uykur, E.; Kuntscher, C.A.; Dressel, M. Optical signatures of energy gap in correlated Dirac fermions. Npj Quantum Mater. 2019, 4, 19. [Google Scholar] [CrossRef]
- Naito, T.; Doi, R.; Suzumura, Y. Exotic Dirac Cones on the Band Structure of α-STF2I3 at Ambient Temperature and Pressure. J. Phys. Soc. Jpn. 2020, 89, 023701. [Google Scholar] [CrossRef]
- Naito, T.; Doi, R. Band Structure and Physical Properties of α-STF2I3: Dirac Electrons in Disordered Conduction Sheets. Crystals 2020, 10, 270. [Google Scholar] [CrossRef]
- Kobara, R.; Igarashi, S.; Kawasugi, Y.; Doi, R.; Naito, T.; Tamura, M.; Kato, R.; Nishio, Y.; Kajita, K.; Tajima, N. Universal Behavior of Magnetoresistance in Organic Dirac Electron Systems. J. Phys. Soc. Jpn. 2020, 89, 113703. [Google Scholar] [CrossRef]
- Ohki, D.; Yoshimi, K.; Kobayashi, A. Transport properties of the organic Dirac electron system α-(BEDT-TSeF)2I3. Phys. Rev. B 2020, 102, 235116. [Google Scholar] [CrossRef]
- Tsumuraya, T.; Suzumura, Y. First-principles study of the effective Hamiltonian for Dirac fermions with spin-orbit coupling in two-dimensional molecular conductor α-(BETS)2I3. Eur. Phys. J. B 2021, 94, 17. [Google Scholar] [CrossRef]
- Kitou, S.; Tsumuraya, T.; Sawahata, H.; Ishii, F.; Hiraki, K.-I.; Nakamura, T.; Katayama, N.; Sawa, H. Ambient-pressure Dirac electron system in the quasi-two-dimensional molecular conductor α-(BETS)2I3. Phys. Rev. B 2021, 103, 035135. [Google Scholar] [CrossRef]
- Castro Neto, A.H.; Guinea, F.; Peres, N.M.R.; Novoselov, K.S.; Geim, A.K. The electronic properties of graphene. Rev. Mod. Phys. 2009, 81, 109–162. [Google Scholar] [CrossRef]
- Hosur, P.; Parameswaran, S.A.; Vishwanash, A. Charge transport in Weyl semimetals. Phys. Rev. Lett. 2012, 108, 046602. [Google Scholar] [CrossRef]
- Bácsi, Á.; Virosztek, A. Low-frequency optical conductivity in graphene and in other scale-invariant two-band systems. Phys. Rev. B 2013, 87, 125425. [Google Scholar] [CrossRef]
- Timusk, T.; Carbotte, J.P.; Homes, C.C.; Bosov, D.N.; Sharapov, S.G. Three-dimensional Dirac fermions in quasicrystals seen via optical conductivity. Phys. Rev. B 2013, 87, 235121. [Google Scholar] [CrossRef]
- Naito, T.; Kobayashi, H.; Kobayashi, A. The Electrical Behavior of Charge-Transfer Salts Based on an Unsymmetrical Donor Bis(ethylenedithio)diselenadithiafulvalene (STF): Disorder Effect on the Transport Properties. Bull. Chem. Soc. Jpn. 1997, 70, 107–114. [Google Scholar] [CrossRef]
- Wang, H.H.; Rust, P.R.; Mertzenich, C.; Firestone, M.A.; Webb, K.S.; Williams, J.M. Tetrabutylammonium dibromoiodide and superconducting bis(bisethylenedithiotetrathiafulvalenium) dibromoiodide. In Inorganic Syntheses; Grimes, R.N., Ed.; Wiley: New York, NY, USA, 1992; Volume 29, pp. 44–46. [Google Scholar]
- Ren, J.; Liang, W.; Whangbo, M.-H. Crystal and Electronic Structure Analysis Using CAESAR; PrimeColor Software, Inc.: Cary, NC, USA, 1998. [Google Scholar]
- Naito, T.; Suzumura, Y. Theoretical model for novel electronic state in a Dirac electron system close to merging: An imaginary element between sulfur and selenium. Crystals 2022, 12, 346. [Google Scholar] [CrossRef]
- Suzumura, Y.; Naito, T. Conductivity of two-dimensional Dirac electrons close to merging in organic conductor α-STF2I3 at ambient pressure. J. Phys. Soc. Jpn. 2022, 91, 064701. [Google Scholar] [CrossRef]
- Williams, J.M.; Wang, H.H.; Beno, M.A.; Emge, T.J.; Sowa, L.M.; Copps, P.T.; Behroozi, F.; Hall, L.N.; Carlson, K.D.; Crabtree, G.W. Ambient-pressure superconductivity at 2.7 K and higher temperatures in derivatives of (BEDT-TTF)2IBr2: Synthesis, structure, and detection of superconductivity. Inorg. Chem. 1984, 23, 3839–3841. [Google Scholar] [CrossRef]
- Yagubskiĭ, É.B.; Shchegolev, I.F.; Shibaeva, R.P.; Fedutin, D.N.; Rozenberg, L.P.; Sogomonyan, E.M.; Lobkovskaya, R.M.; Laukhin, V.N.; Ignat’ev, A.A.; Zvarykina, A.V.; et al. Organic conductors and superconductors: Mixed (IBr2−) polyhalides BEDT-TTF. JETP Lett. 1985, 42, 206–208. [Google Scholar]
- Beno, M.A.; Firestone, M.A.; Leung, P.C.W.; Sowa, L.M.; Wang, H.H.; Williams, J.M.; Whangbo, M.-H. Crystal and band structures of a new class of 2:1 organic conducting salts α′-(BEDT-TTF)2X, X− = Ag(CN)2−, Au(CN)2− and AuBr2−. Solid State Commun. 1986, 57, 735–739. [Google Scholar] [CrossRef]
- Kobayashi, H.; Kato, R.; Kobayashi, A.; Saito, G.; Tokumoto, M.; Anzai, H.; Ishiguro, T. Crystal structure of α′-(BEDT-TTF)2BrICl. Chem. Lett. 1986, 15, 93–96. [Google Scholar] [CrossRef]
- Tokumoto, M.; Anzai, H.; Ishiguro, T.; Saito, G.; Kobayashi, H.; Kato, R.; Kobayashi, A. Electrical and magnetic properties of organic semiconductors, (BEDT-TTF)2X (X = IBr2, IBrCl, and ICl2. Synth. Met. 1987, 19, 215–220. [Google Scholar] [CrossRef]
- Kurmoo, M.; Talham, D.R.; Day, P.; Howard, J.A.K.; Stringer, A.M.; Obertelli, D.S.; Friend, R.H. (BEDT-TTF)2CuCl2, a new conducting charge transfer salt. Synth. Met. 1988, 22, 415–418. [Google Scholar] [CrossRef]
- Ugawa, A.; Yakushi, K.; Kuroda, H.; Kawamoto, A.; Tanaka, J. Crystal structure and polarized reflectance spectra of α′-(bis(ethylenedithio)-tetrathiafulvalenium)2-bromoiodoaurate, α′-(BEDT-TTF)2IAuBr. Synth. Met. 1988, 22, 305–315. [Google Scholar] [CrossRef]
- Yue, Y.; Nakano, C.; Yamamoto, K.; Uruichi, M.; Wojciechowski, R.; Inokuchi, M.; Yakushi, K.; Kawamoto, A. Charge order-disorder phase transition in α′-[bis(ethylenedithio) tetrathiafulvalene]2IBr2 [α′-(BEDT-TTF)2IBr2]. J. Phys. Soc. Jpn. 2009, 78, 044701. [Google Scholar] [CrossRef]
- Hirose, S.; Kawamoto, A. 13C NMR study on the charge-ordering salt α′-(BEDT-TTF)2IBr2. Phys. Rev. B 2009, 80, 165103. [Google Scholar] [CrossRef]
- Pauling, L. The Nature of the Chemical Bond, 3rd ed.; Cornell University Press: Ithaca, NY, USA, 1960; p. 260. [Google Scholar]
- Bondi, A. van der Waals volumes and radii. J. Phys. Chem. 1964, 68, 441–451. [Google Scholar] [CrossRef]
- Rowland, R.S.; Taylor, R. Intermolecular Nonbonded Contact Distances in Organic Crystal Structures: Comparison with Distances Expected from van der Waals Radii. J. Phys. Chem. 1996, 100, 7384–7391. [Google Scholar] [CrossRef]
- Oka, R.; Ohara, K.; Konishi, K.; Yamane, I.; Shimada, T.; Naito, T. Band structure evolution during reversible interconversion between Dirac and standard fermions in organic charge-transfer salts. Magnetochemistry 2023, 9, 153. [Google Scholar] [CrossRef]
- Ferraro, J.R.; Beno, M.A.; Thorn, R.J.; Wang, H.H.; Webb, K.S.; Williams, J.M. Spectroscopic and structural characterization of tetrabutylammonium trihalides: N-Bu4NI3, n-Bu4NI2Br, n-Bu4NIBr2, and n-Bu4NAuI2; precursors to organic conducting salts. J. Phys. Chem. Solids 1986, 47, 301–308. [Google Scholar] [CrossRef]
- Tajima, N.; Kawasugi, Y.; Morinari, T.; Oka, R.; Naito, T.; Kato, R. Coherent interlayer coupling in quasi-two-dimension Dirac fermions in α-(BEDT-TTF)2I3. J. Phys. Soc. Jpn. 2022, 92, 013702. [Google Scholar] [CrossRef]
Figure 1.
Characteristic band feature of zero-gap conductors around the Dirac/Weyl point. The Fermi level (EF ≡ 0 eV) is shown by the arrow, which coincides with the Dirac/Weyl points at the apexes of the Dirac cones. Reproduced from [23] (Copyright, The Physical Society of Japan, 2020).
Figure 1.
Characteristic band feature of zero-gap conductors around the Dirac/Weyl point. The Fermi level (EF ≡ 0 eV) is shown by the arrow, which coincides with the Dirac/Weyl points at the apexes of the Dirac cones. Reproduced from [23] (Copyright, The Physical Society of Japan, 2020).
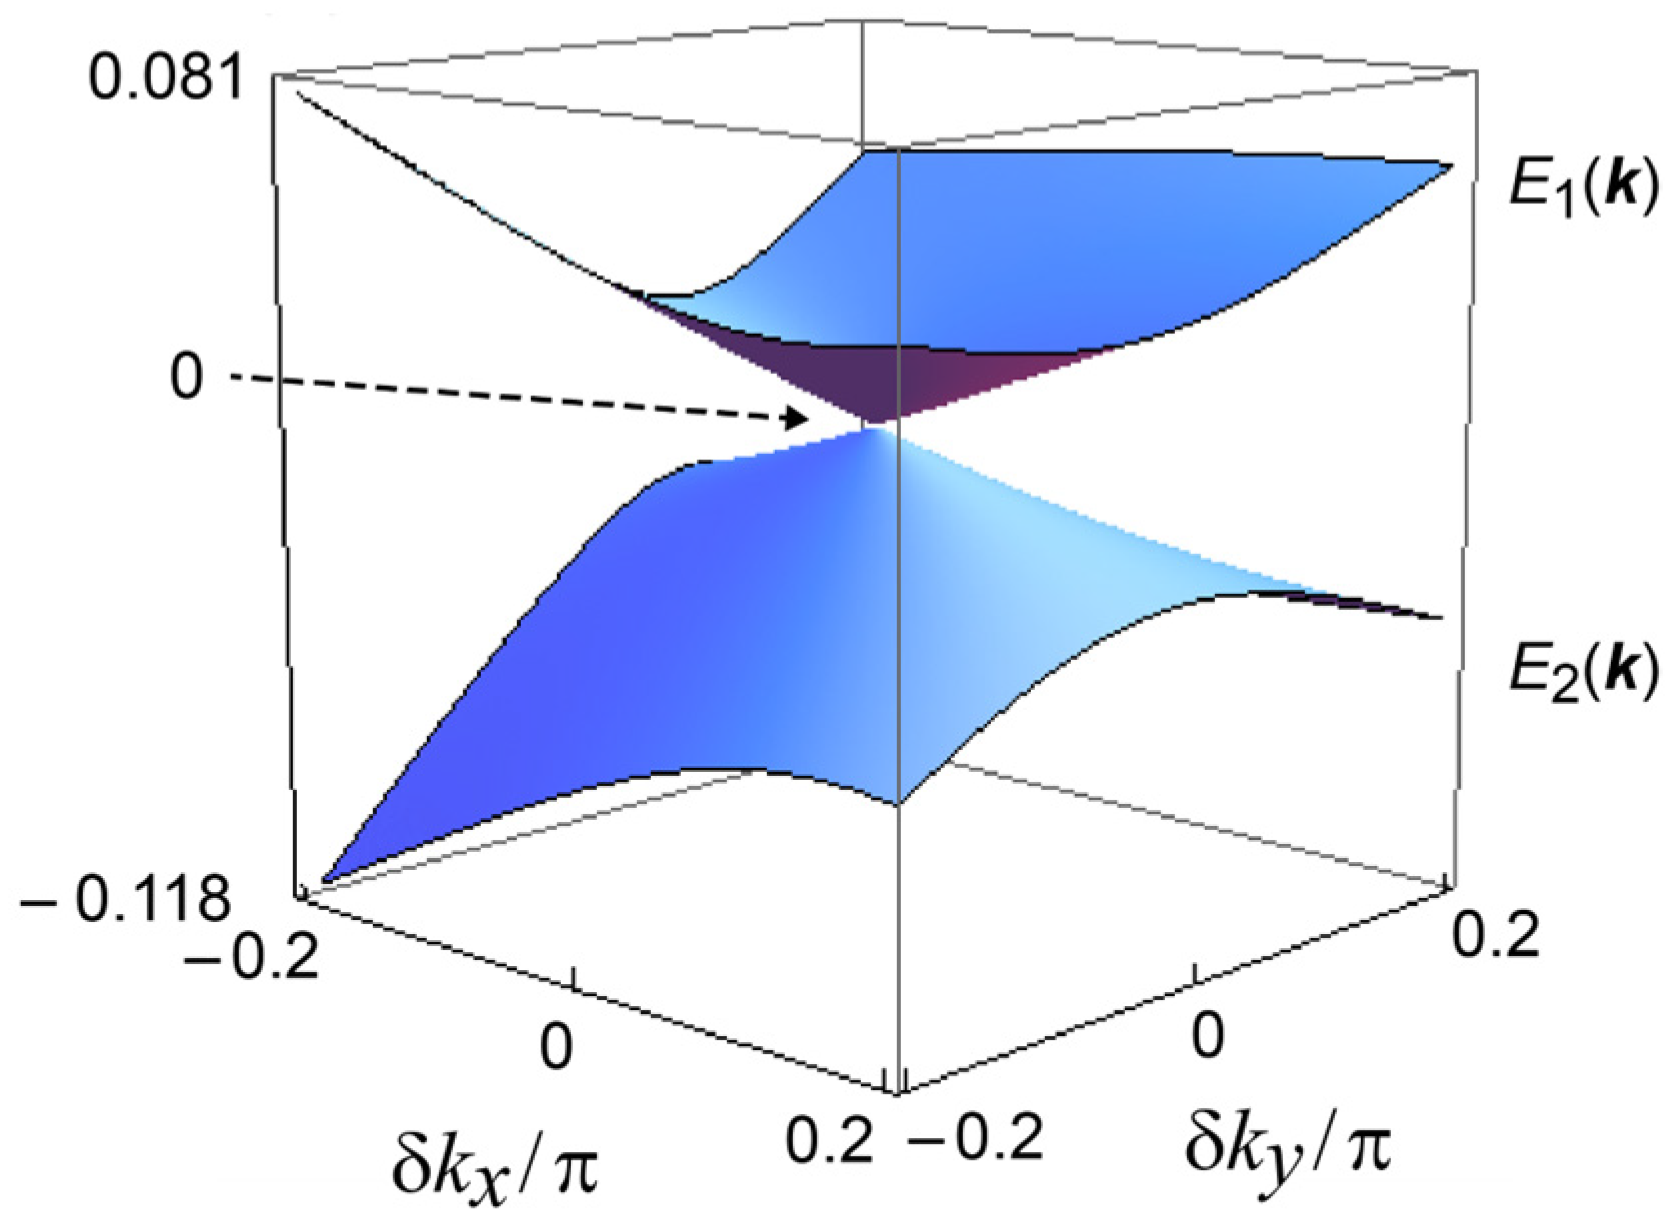
Figure 2.
Crystal structures of: (a) α′-STF2IBr2 (90 K, no disorder); (b) α-STF2I3 (93 K) [24]; (c) α′-STF2IBr2 (296 K, the ethylene groups indicated by arrows are disordered in 56.4%:43.6% each); (d) α′-STF2IBr2 (296 K, a two-fold period STF stacking structure //a-axis), where the STF-stacking column without the ethylene-group-disorder is selected. The brown, pale pink, yellow, green, purple, and blue spheres indicate C, H, S, Se, I, and Br atoms, respectively. The red, green, and blue arrows in (a,b,d) commonly indicate the directions of the crystallographic a-, b-, and c-axes, respectively.
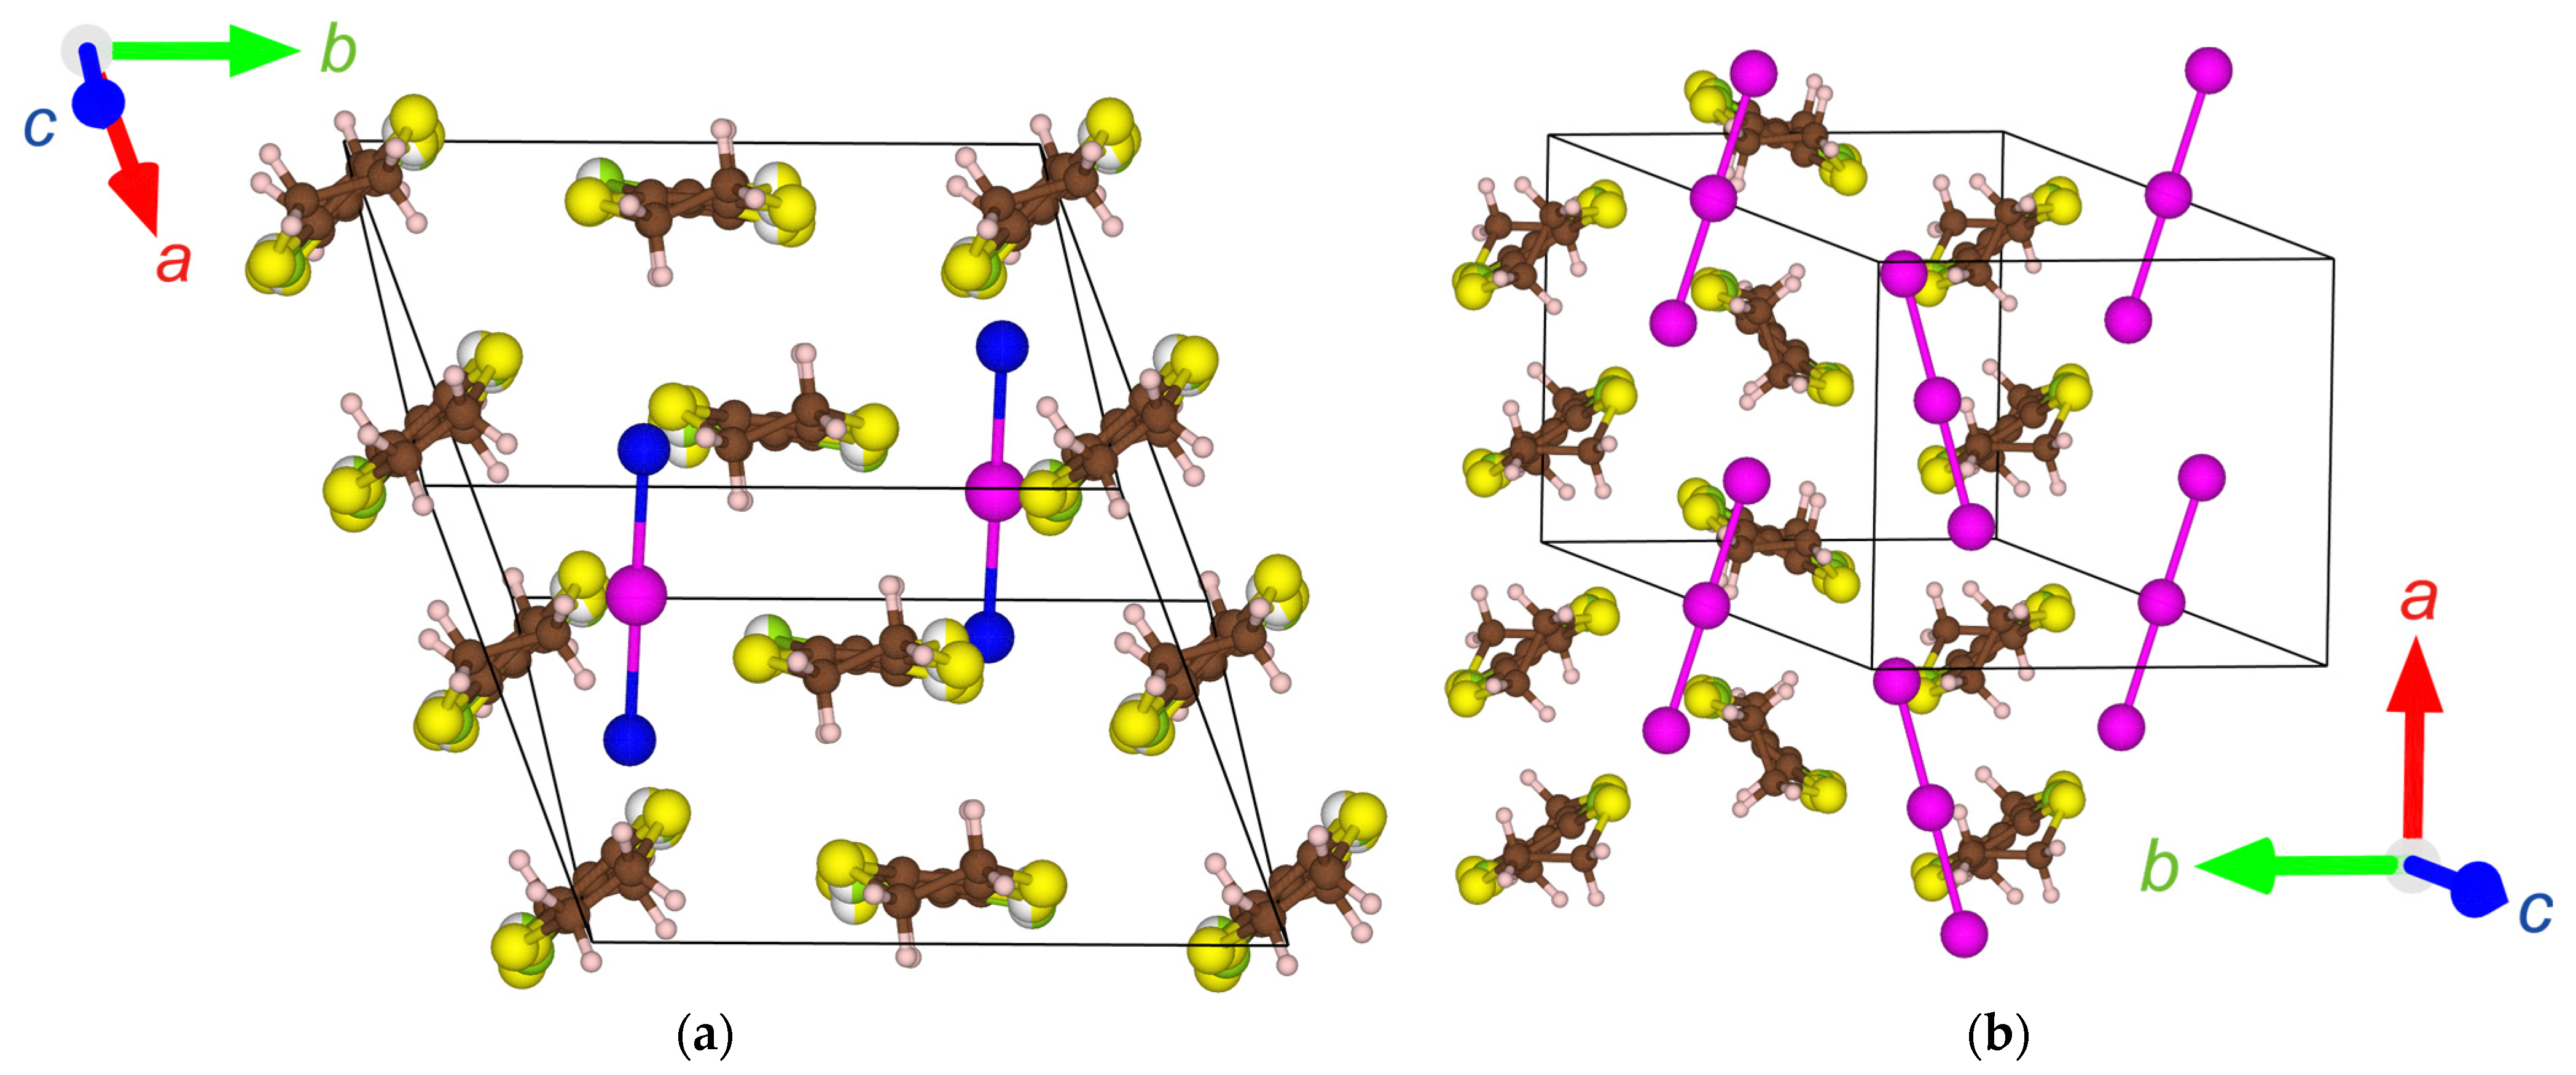
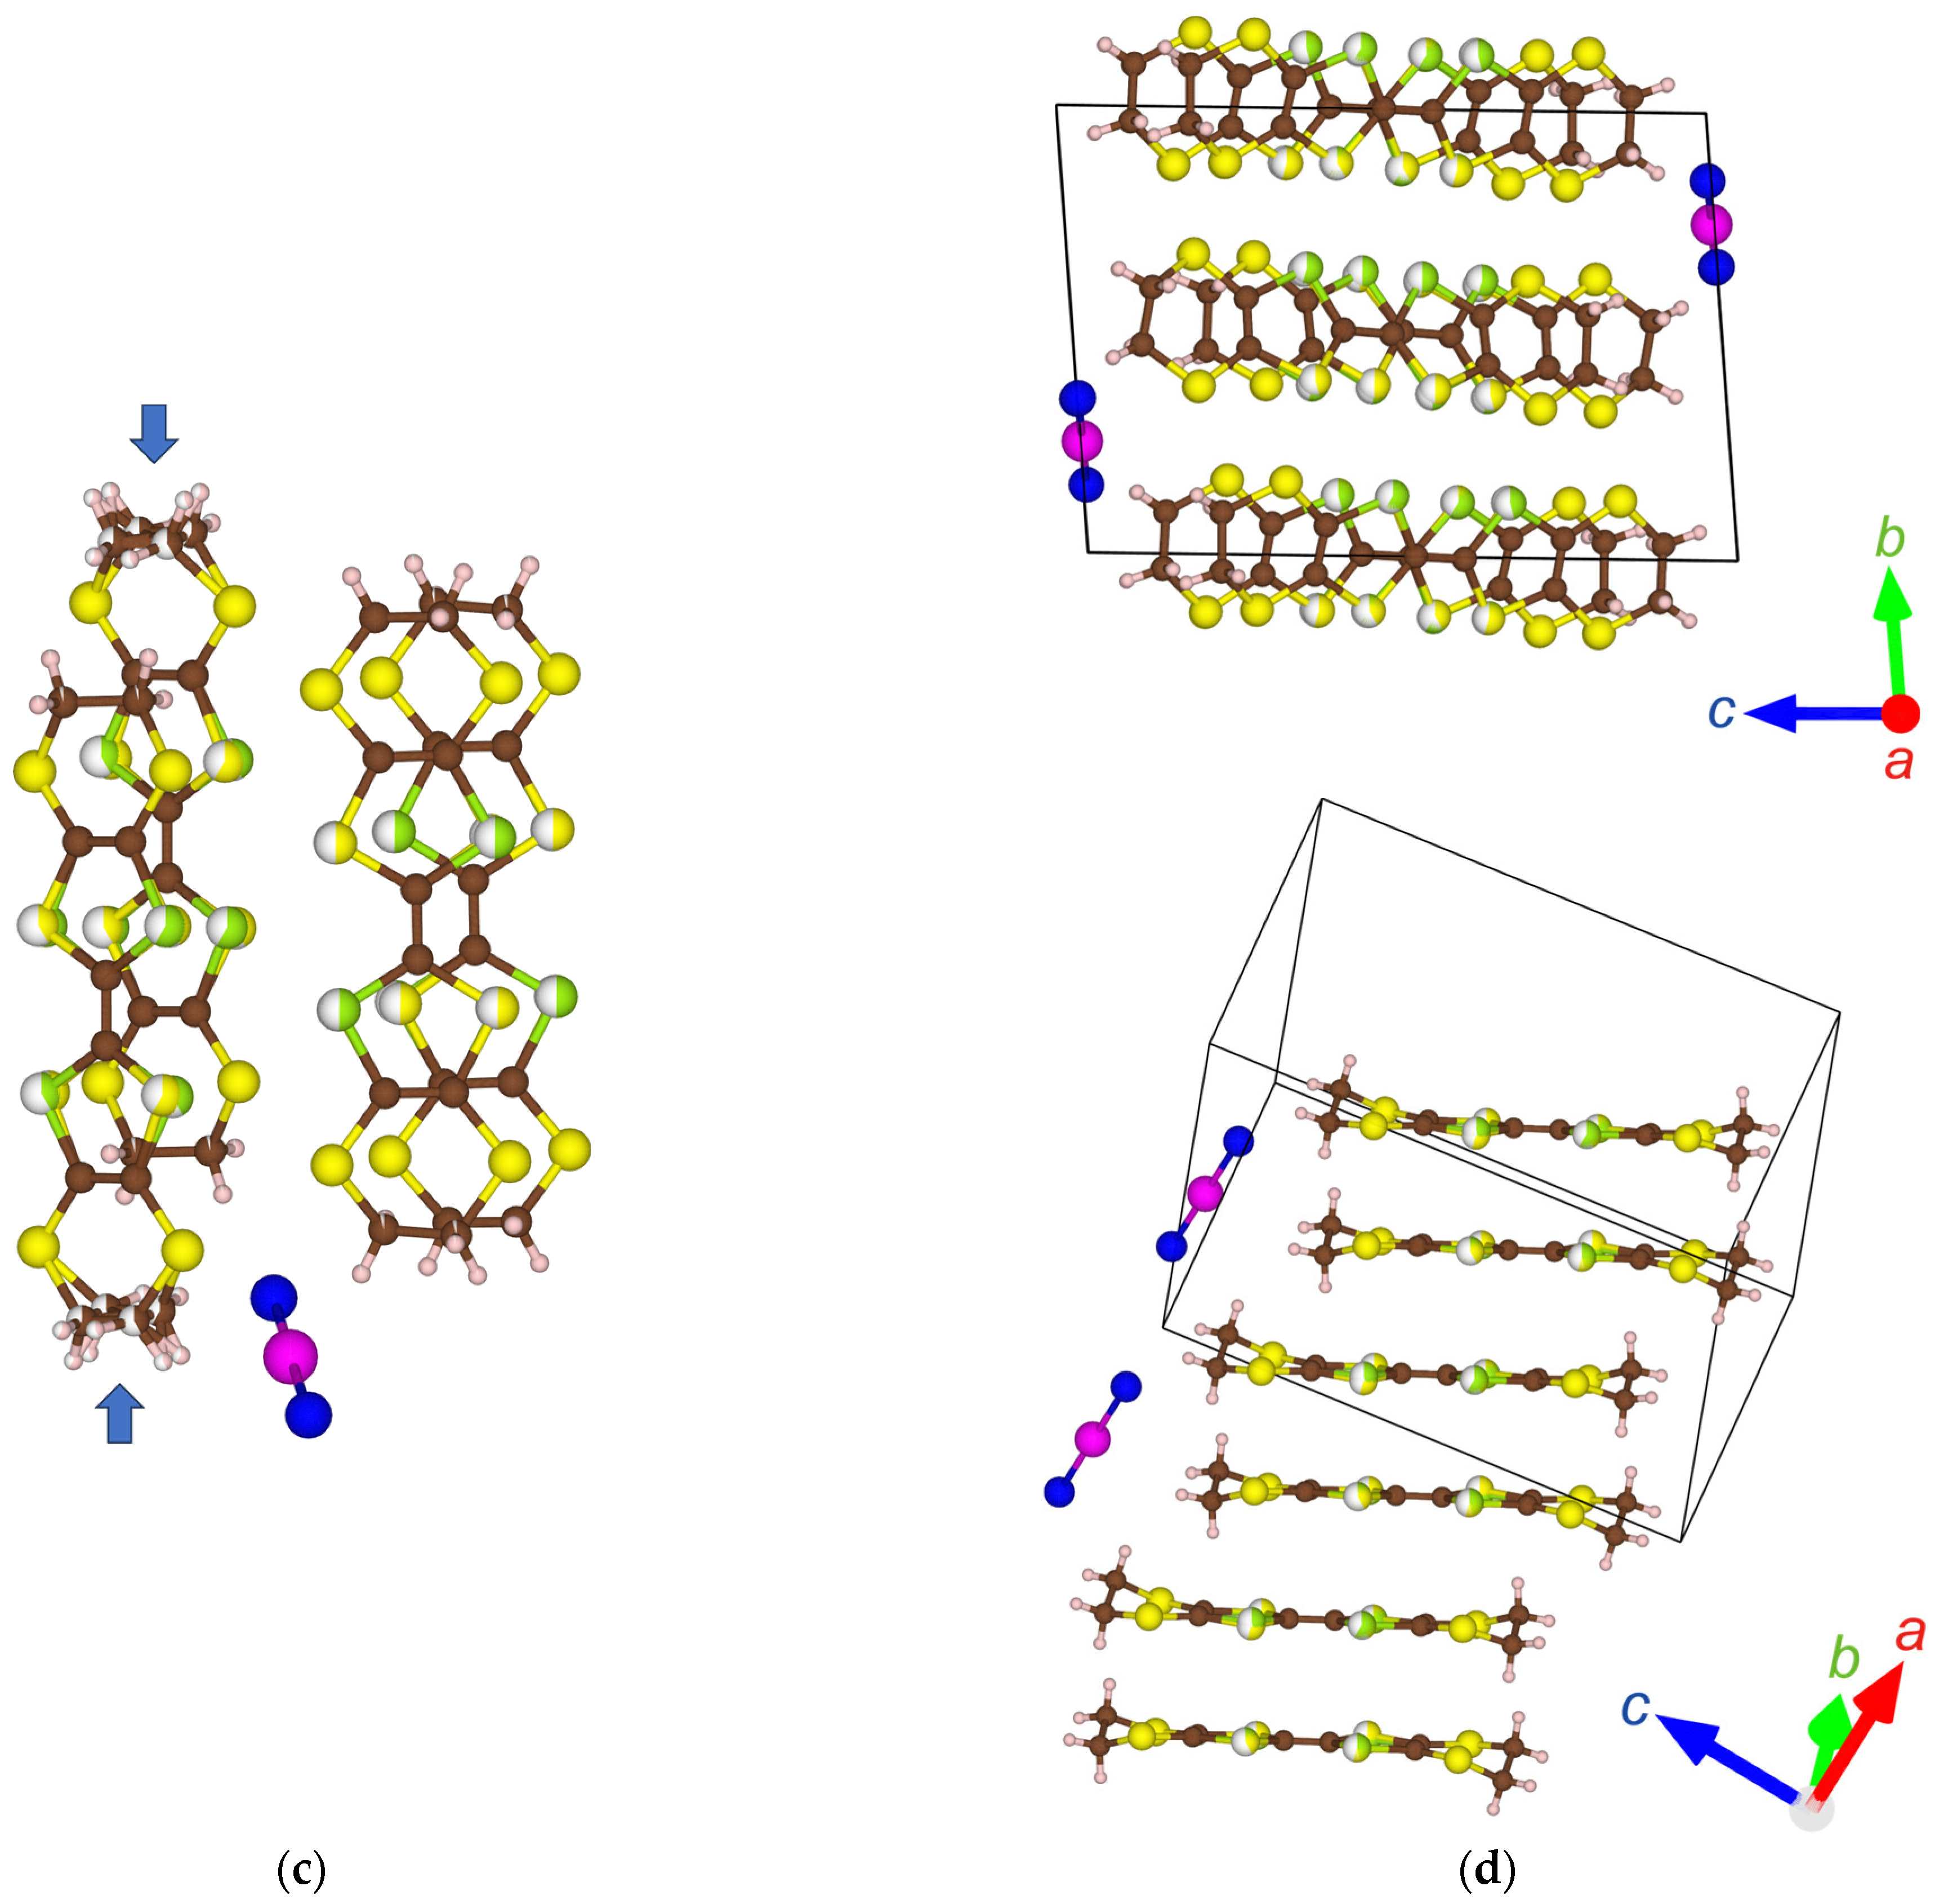
Figure 3.
Temperature (T)- and pressure (P)-dependences of electrical resistivities ρ(T, P) of: (a) α′-STF2IBr2 at 0–2.0 GPa, measured using the single crystal in the (110)-direction (cooling process data); (b) comparison of ρ(T, P) between α-STF2I3 (I3) at 0 GPa and α′-STF2IBr2 (IBr2) at 2.0 GPa. The data of α-STF2I3 at 0 GPa are reproduced from [24].

Figure 4.
Temperature dependencies of magnetic susceptibility χ(T) of: (a) α-STF2I3 (α-I3) and α′-STF2IBr2 (α′-IBr2); (b) α′-STF2IBr2 (α′-IBr2) as an enlarged view. The data of α-STF2I3 (α-I3) are reproduced from [24] with permission.
Figure 4.
Temperature dependencies of magnetic susceptibility χ(T) of: (a) α-STF2I3 (α-I3) and α′-STF2IBr2 (α′-IBr2); (b) α′-STF2IBr2 (α′-IBr2) as an enlarged view. The data of α-STF2I3 (α-I3) are reproduced from [24] with permission.
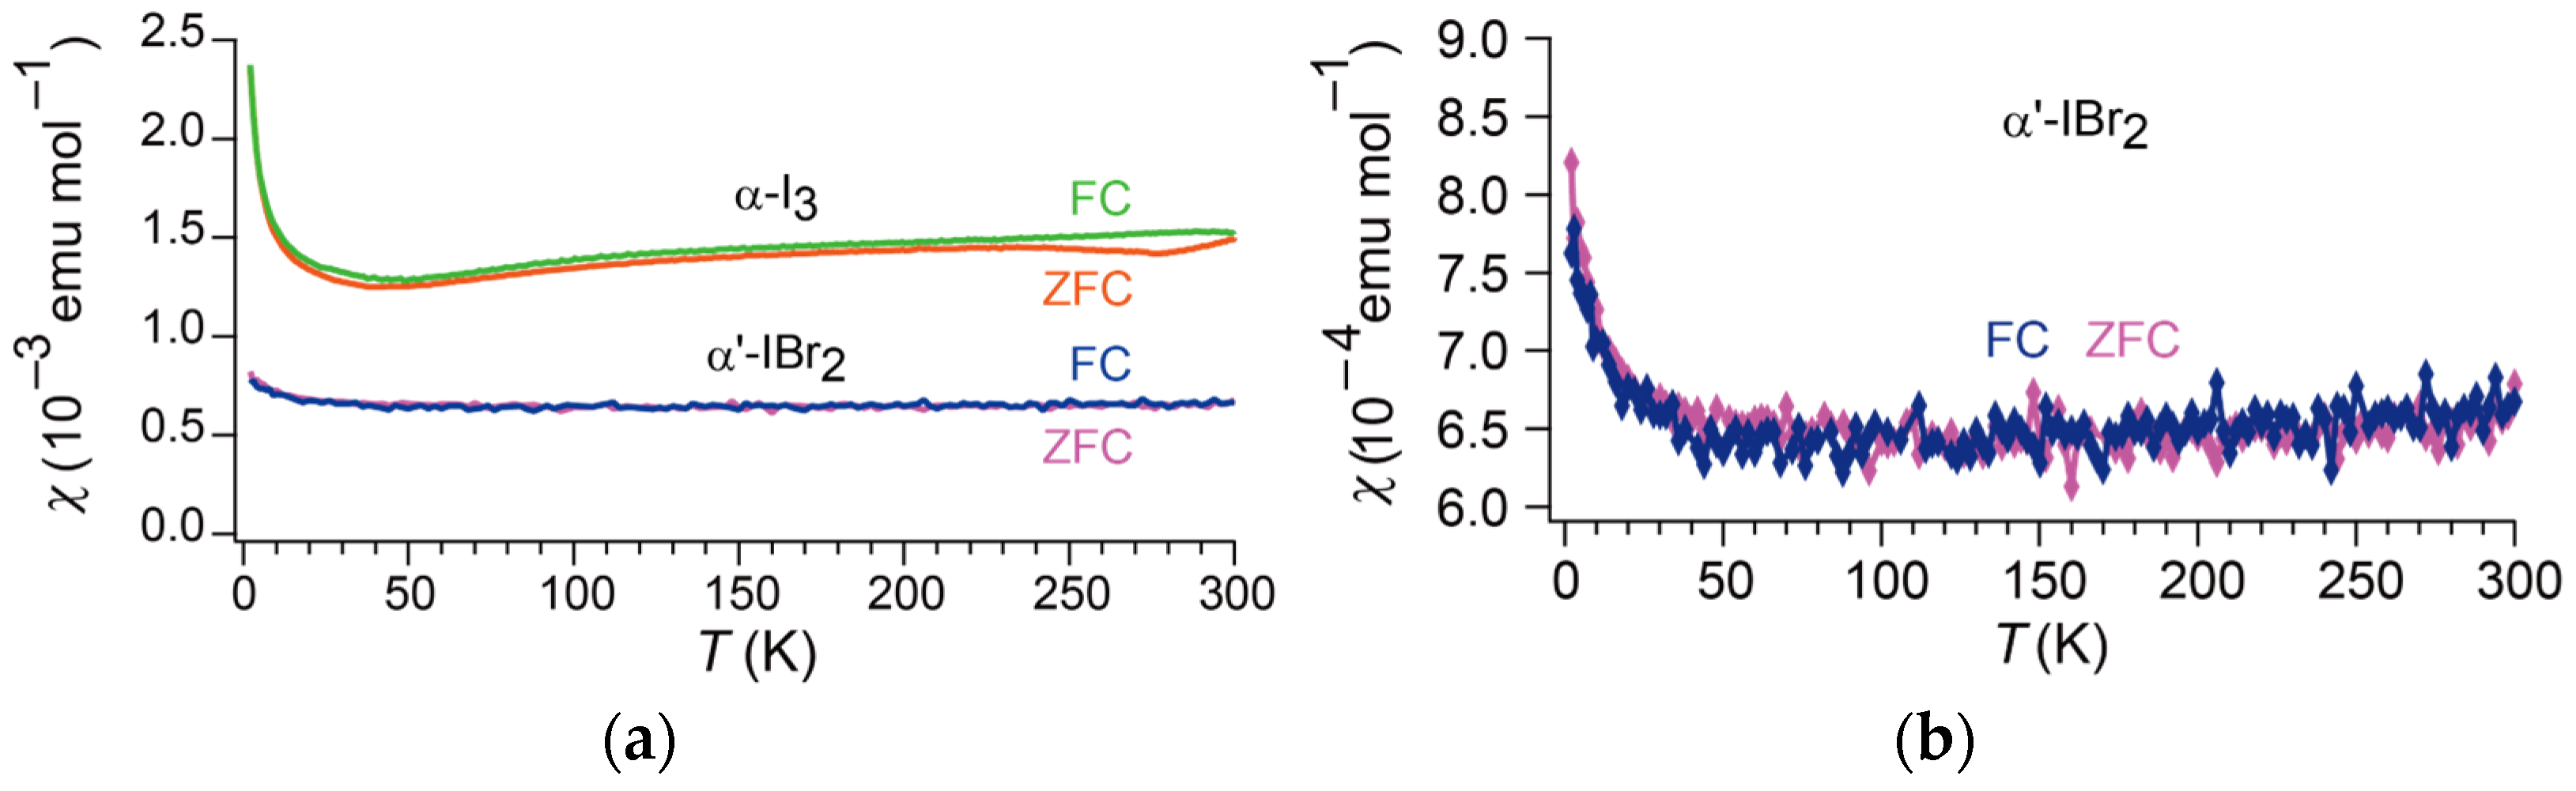
Figure 5.
Band structures near the Fermi levels of α′-STF2IBr2 and α-STF2I3: (a) Band dispersion (left) and Fermi surface (right) of α′-STF2IBr2 in the kakb plane. In the left figure, the blue/red curved surfaces and the dark grey plane indicate the top/second HOMO bands of STF and the Fermi level EF, respectively. In the right figure, the blue and red dots indicate the Fermi surfaces of electrons and holes, respectively; (b) the calculated top (E1) and the second (E2) STF HOMO band dispersions of α-STF2I3. The Fermi level (EF ≡ 0 eV) is shown by the arrow, which coincides with the Dirac/Weyl points at the apexes of the Dirac cones. Reproduced from [25] (Copyright, The Physical Society of Japan, 2020).

Figure 6.
STF(SOMO)–STF(SOMO) interactions in α′-STF2IBr2. The alphabets designating the interacting pairs (A—H) correspond to those in Table 3. The red, green, and blue arrows indicate the directions of the crystallographic a-, b-, and c-axes, respectively.
Figure 6.
STF(SOMO)–STF(SOMO) interactions in α′-STF2IBr2. The alphabets designating the interacting pairs (A—H) correspond to those in Table 3. The red, green, and blue arrows indicate the directions of the crystallographic a-, b-, and c-axes, respectively.
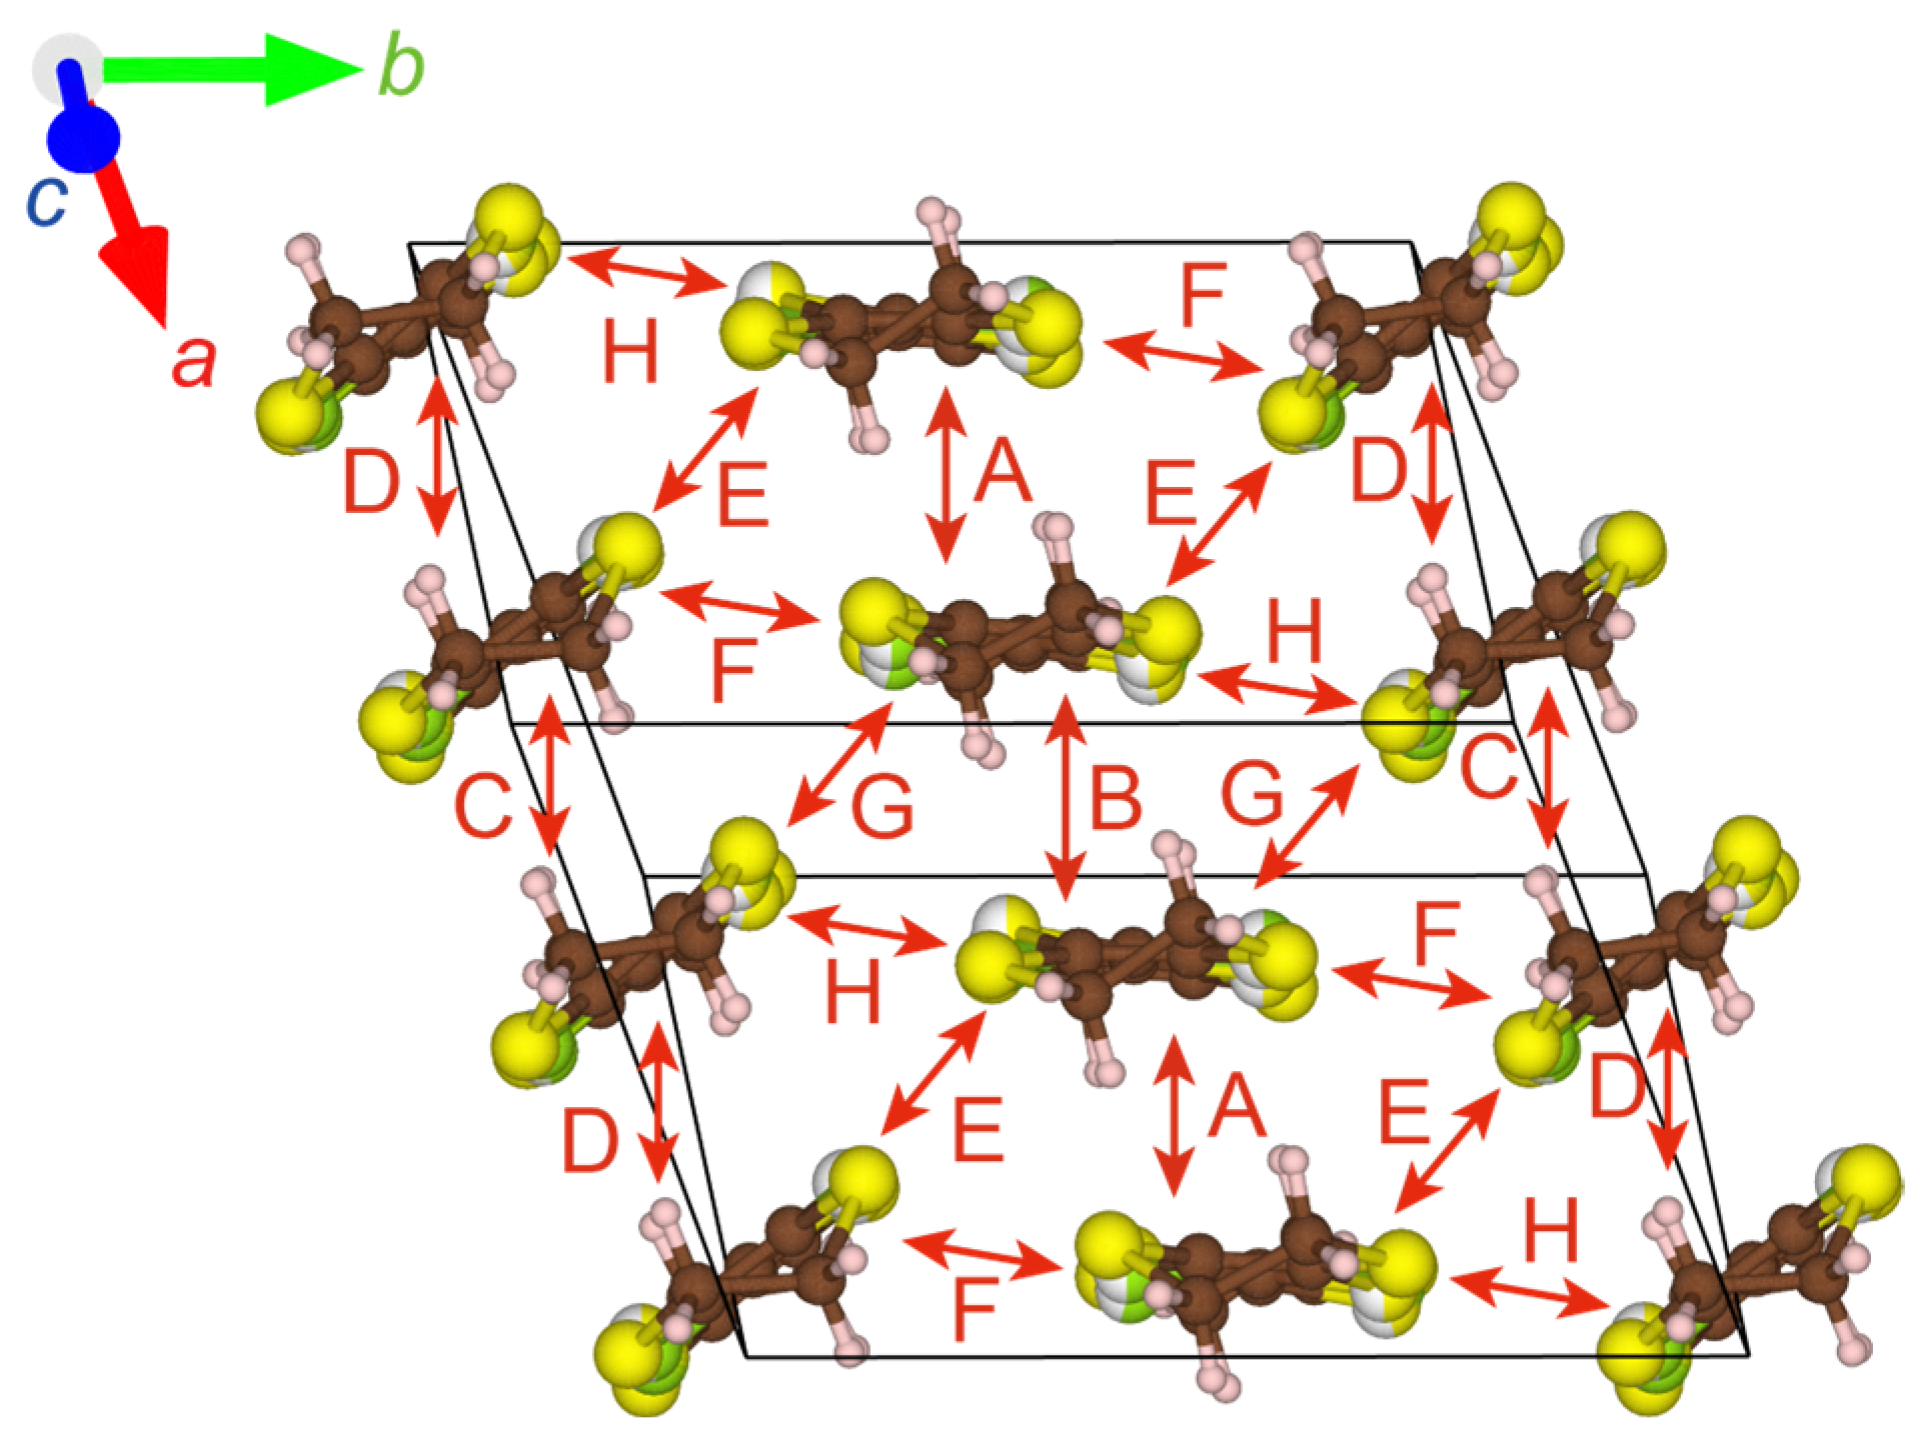
Figure 7.
STF–IBr2 interactions in α′-STF2IBr2. The alphabets designating the interacting pairs (M—P) correspond to those in Table 4. The red, green, and blue arrows indicate the directions of the crystallographic a-, b-, and c-axes, respectively.
Figure 7.
STF–IBr2 interactions in α′-STF2IBr2. The alphabets designating the interacting pairs (M—P) correspond to those in Table 4. The red, green, and blue arrows indicate the directions of the crystallographic a-, b-, and c-axes, respectively.

Table 1.
Extended Hückel parameters used in the band and related calculations.
| Elements and Atomic Orbitals | Hii (eV) *1 | ζ1 | c1 | ζ2 | c2 |
|---|---|---|---|---|---|
| I 5s | −22.3 | 3.341 | 0.6869 | 2.046 | 0.4869 |
| I 5p | −10.9 | 2.920 | 0.6140 | 1.671 | 0.5258 |
| Br 4s | −26.8 | 3.361 | 0.6310 | 2.044 | 0.5050 |
| Br 4p | −12.3 | 2.920 | 0.5822 | 1.624 | 0.5472 |
| Im 3s *2 | −22.585 | 2.800 | 0.60765 | 1.800 | 0.51875 |
| Im 3p *2 | −11.325 | 2.325 | 0.57495 | 1.225 | 0.56685 |
| S 3s | −23.9 | 2.662 | 0.5990 | 1.688 | 0.5246 |
| S 3p | −11.9 | 2.338 | 0.5377 | 1.333 | 0.5615 |
| C 2s | −19.2 | 1.831 | 0.7931 | 1.153 | 0.2739 |
| C 2p | −11.8 | 2.730 | 0.2595 | 1.257 | 0.8026 |
| H 1s *3 | −13.6 | 1.3 | 1 | NA | NA |
*1 Hii indicates the valence-state ionization potential, while other parameters, ζi and ci (i = 1,2), are those in Equation (1). *2 Im is an imaginary atom possessing the averaged values of parameters (Hii, ζi, and ci (i = 1,2)) between S and Se [23,36,37]. The principal quantum number of the outermost orbital of Im is assumed to be three, as these parameters yielded the calculation results which explain the observed physical properties most consistently. *3 H 1s orbital is described by a single- zeta Slater-type orbital, and thus ζ2 and c2 are not applied (NA).
Table 2.
Lattice constants of α′-STF2IBr2 and α-STF2I3.
| Materials | α′-STF2IBr2 | α-STF2I3 | |||
|---|---|---|---|---|---|
| T (K) | 296 | 150 | 90 | 296 | 93 |
| Space Group | P1 | ||||
| System | Triclinic | ||||
| a (Å) | 8.9175(3) | 8.6984(2) | 8.6555(2) | 9.2162(3) | 9.08536(18) |
| b (Å) | 11.9990(4) | 12.0537(3) | 12.0449(2) | 10.8222(3) | 10.6938(2) |
| c (Å) | 16.5862(6) | 16.5339(3) | 16.5069(3) | 17.6354(5) | 17.5875(4) |
| α (°) | 85.050(3) | 85.254(2) | 85.321(2) | 96.864(7) | 96.5821(17) |
| β (°) | 88.353(3) | 89.265(2) | 89.538(1) | 97.868(7) | 97.8330(18) |
| γ (°) | 70.791(3) | 71.102(2) | 71.173(2) | 90.692(6) | 90.9456(16) |
| V (Å3) | 1669.68(10) | 1634.30(7) | 1623.11(6) | 1729.19(10) | 1680.75(6) |
| Z | 2 | ||||
| CCDC deposit # | 2,298,691 | 2,299,346 | 2,261,968 | 2,121,344 | 2,261,185 |
| References | This work | [23,24] | |||
Table 3.
Overlap (S) and transfer (t) integrals between STF cations based on extended Hückel calculations for the structure at 90 K of α′-STF2IBr2. The alphabets designating the interacting pairs correspond to those in Figure 6.
Table 3.
Overlap (S) and transfer (t) integrals between STF cations based on extended Hückel calculations for the structure at 90 K of α′-STF2IBr2. The alphabets designating the interacting pairs correspond to those in Figure 6.
| Interacting Pairs | α′-STF2IBr2 (90 K) | |
|---|---|---|
| S (10−2) | t (10−1 eV) | |
| A | 2.05 | −0.3348 |
| B | 6.46 | −1.2825 |
| C | 3.45 | −0.6463 |
| D | 6.65 | −1.2821 |
| E | −0.83 | 0.1657 |
| F | −0.38 | 0.0850 |
| G | −0.12 | 0.0284 |
| H *1 | −0.65 | 0.1007 |
*1 Because the phases (signs) of the molecular orbitals of the crystallographically independent STF molecules can be assumed arbitrarily and because the calculated absolute value was rather small, the sign of intermolecular interaction H could not be uniquely determined between (S, t) = (−0.65, 0.1007) and (0.65, −0.1007).
Table 4.
Overlap (S) and transfer (t) integrals between IBr2 and STF in α′-STF2IBr2 based on an extended Hückel calculation for the structure at 90 K. The alphabets designating the interacting pairs correspond to those in Figure 7.
Table 4.
Overlap (S) and transfer (t) integrals between IBr2 and STF in α′-STF2IBr2 based on an extended Hückel calculation for the structure at 90 K. The alphabets designating the interacting pairs correspond to those in Figure 7.
| Interacting Pairs | α′-STF2IBr2 (90 K) | |
|---|---|---|
| S (10−4) | t (10−1 eV) | |
| M | 2.0 | −1.7 |
| N | −1.0 | 1.5 |
| O | −3.0 | 6.7 |
| P | −1.0 | 1.4 |
Disclaimer/Publisher’s Note: The statements, opinions and data contained in all publications are solely those of the individual author(s) and contributor(s) and not of MDPI and/or the editor(s). MDPI and/or the editor(s) disclaim responsibility for any injury to people or property resulting from any ideas, methods, instructions or products referred to in the content. |
© 2023 by the authors. Licensee MDPI, Basel, Switzerland. This article is an open access article distributed under the terms and conditions of the Creative Commons Attribution (CC BY) license (https://creativecommons.org/licenses/by/4.0/).
Share and Cite
MDPI and ACS Style
Funatsu, K.; Oka, R.; Tajima, N.; Naito, T. New Organic Crystalline Material Close to Nodal-Line Materials: α′-STF2IBr2. Crystals 2023, 13, 1606. https://doi.org/10.3390/cryst13111606
AMA Style
Funatsu K, Oka R, Tajima N, Naito T. New Organic Crystalline Material Close to Nodal-Line Materials: α′-STF2IBr2. Crystals. 2023; 13(11):1606. https://doi.org/10.3390/cryst13111606
Chicago/Turabian StyleFunatsu, Koki, Ryuhei Oka, Naoya Tajima, and Toshio Naito. 2023. "New Organic Crystalline Material Close to Nodal-Line Materials: α′-STF2IBr2" Crystals 13, no. 11: 1606. https://doi.org/10.3390/cryst13111606
Note that from the first issue of 2016, this journal uses article numbers instead of page numbers. See further details here.