
Design and Investigation of a Side-Chain Liquid Crystalline Polysiloxane with a Ntb-Phase-Forming Side Chain

Abstract
:1. Introduction
2. Experiment
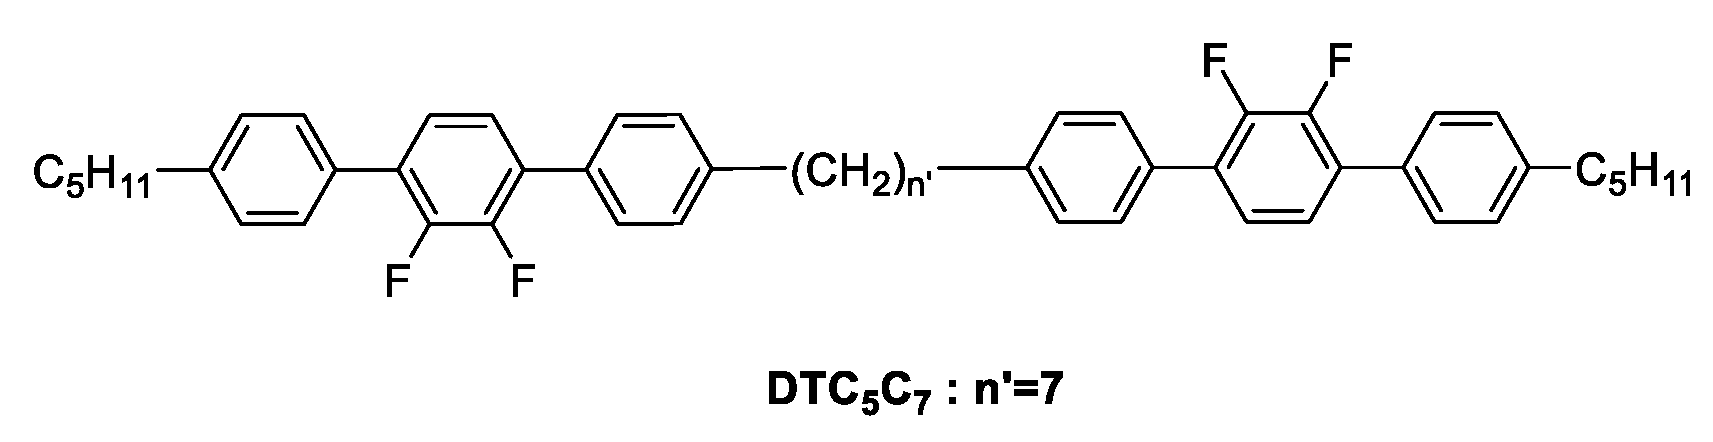
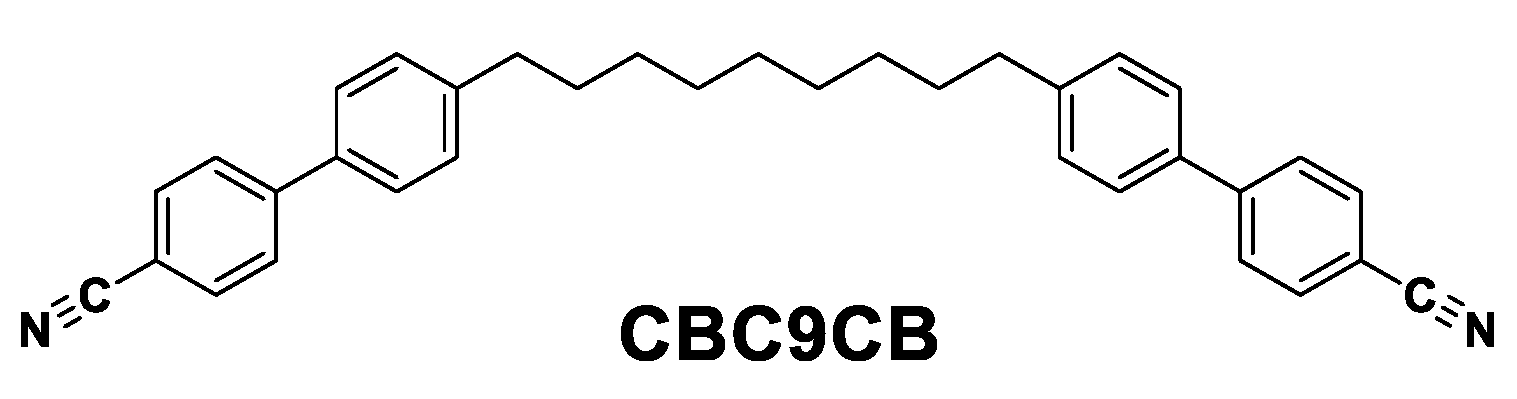
2.1. Materials
2.2. Methods
2.3. Purification of Polymers
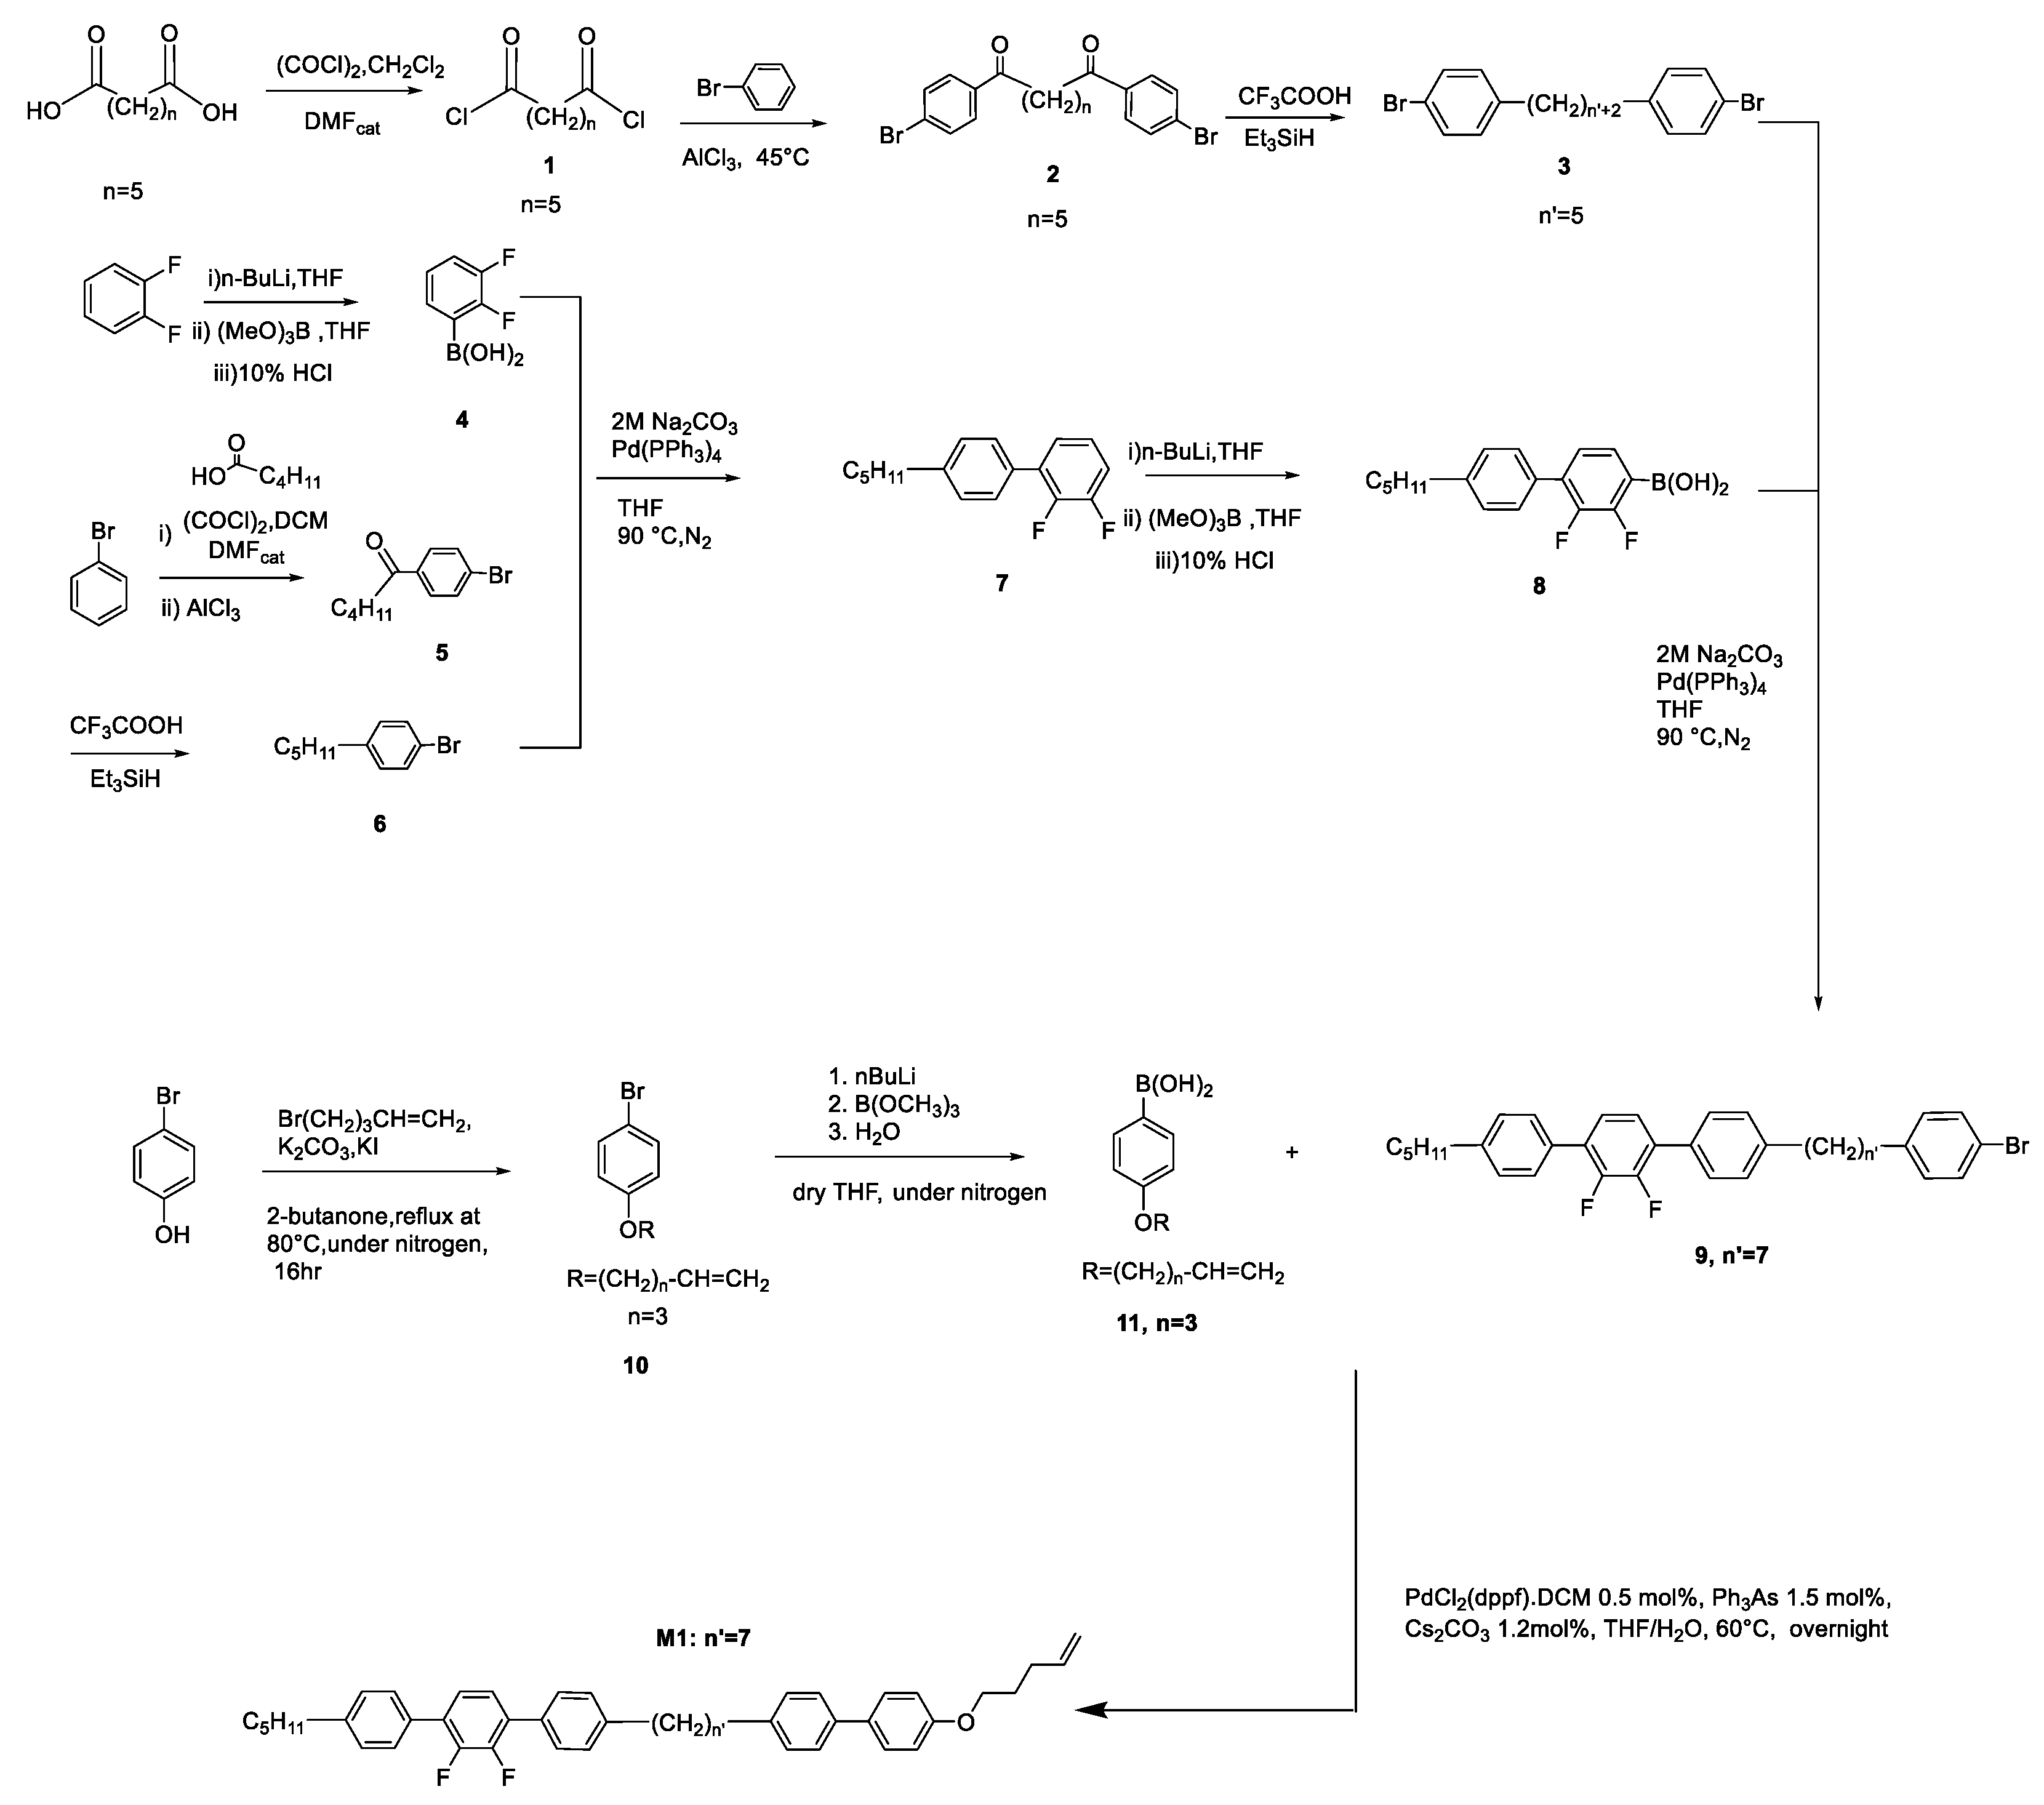
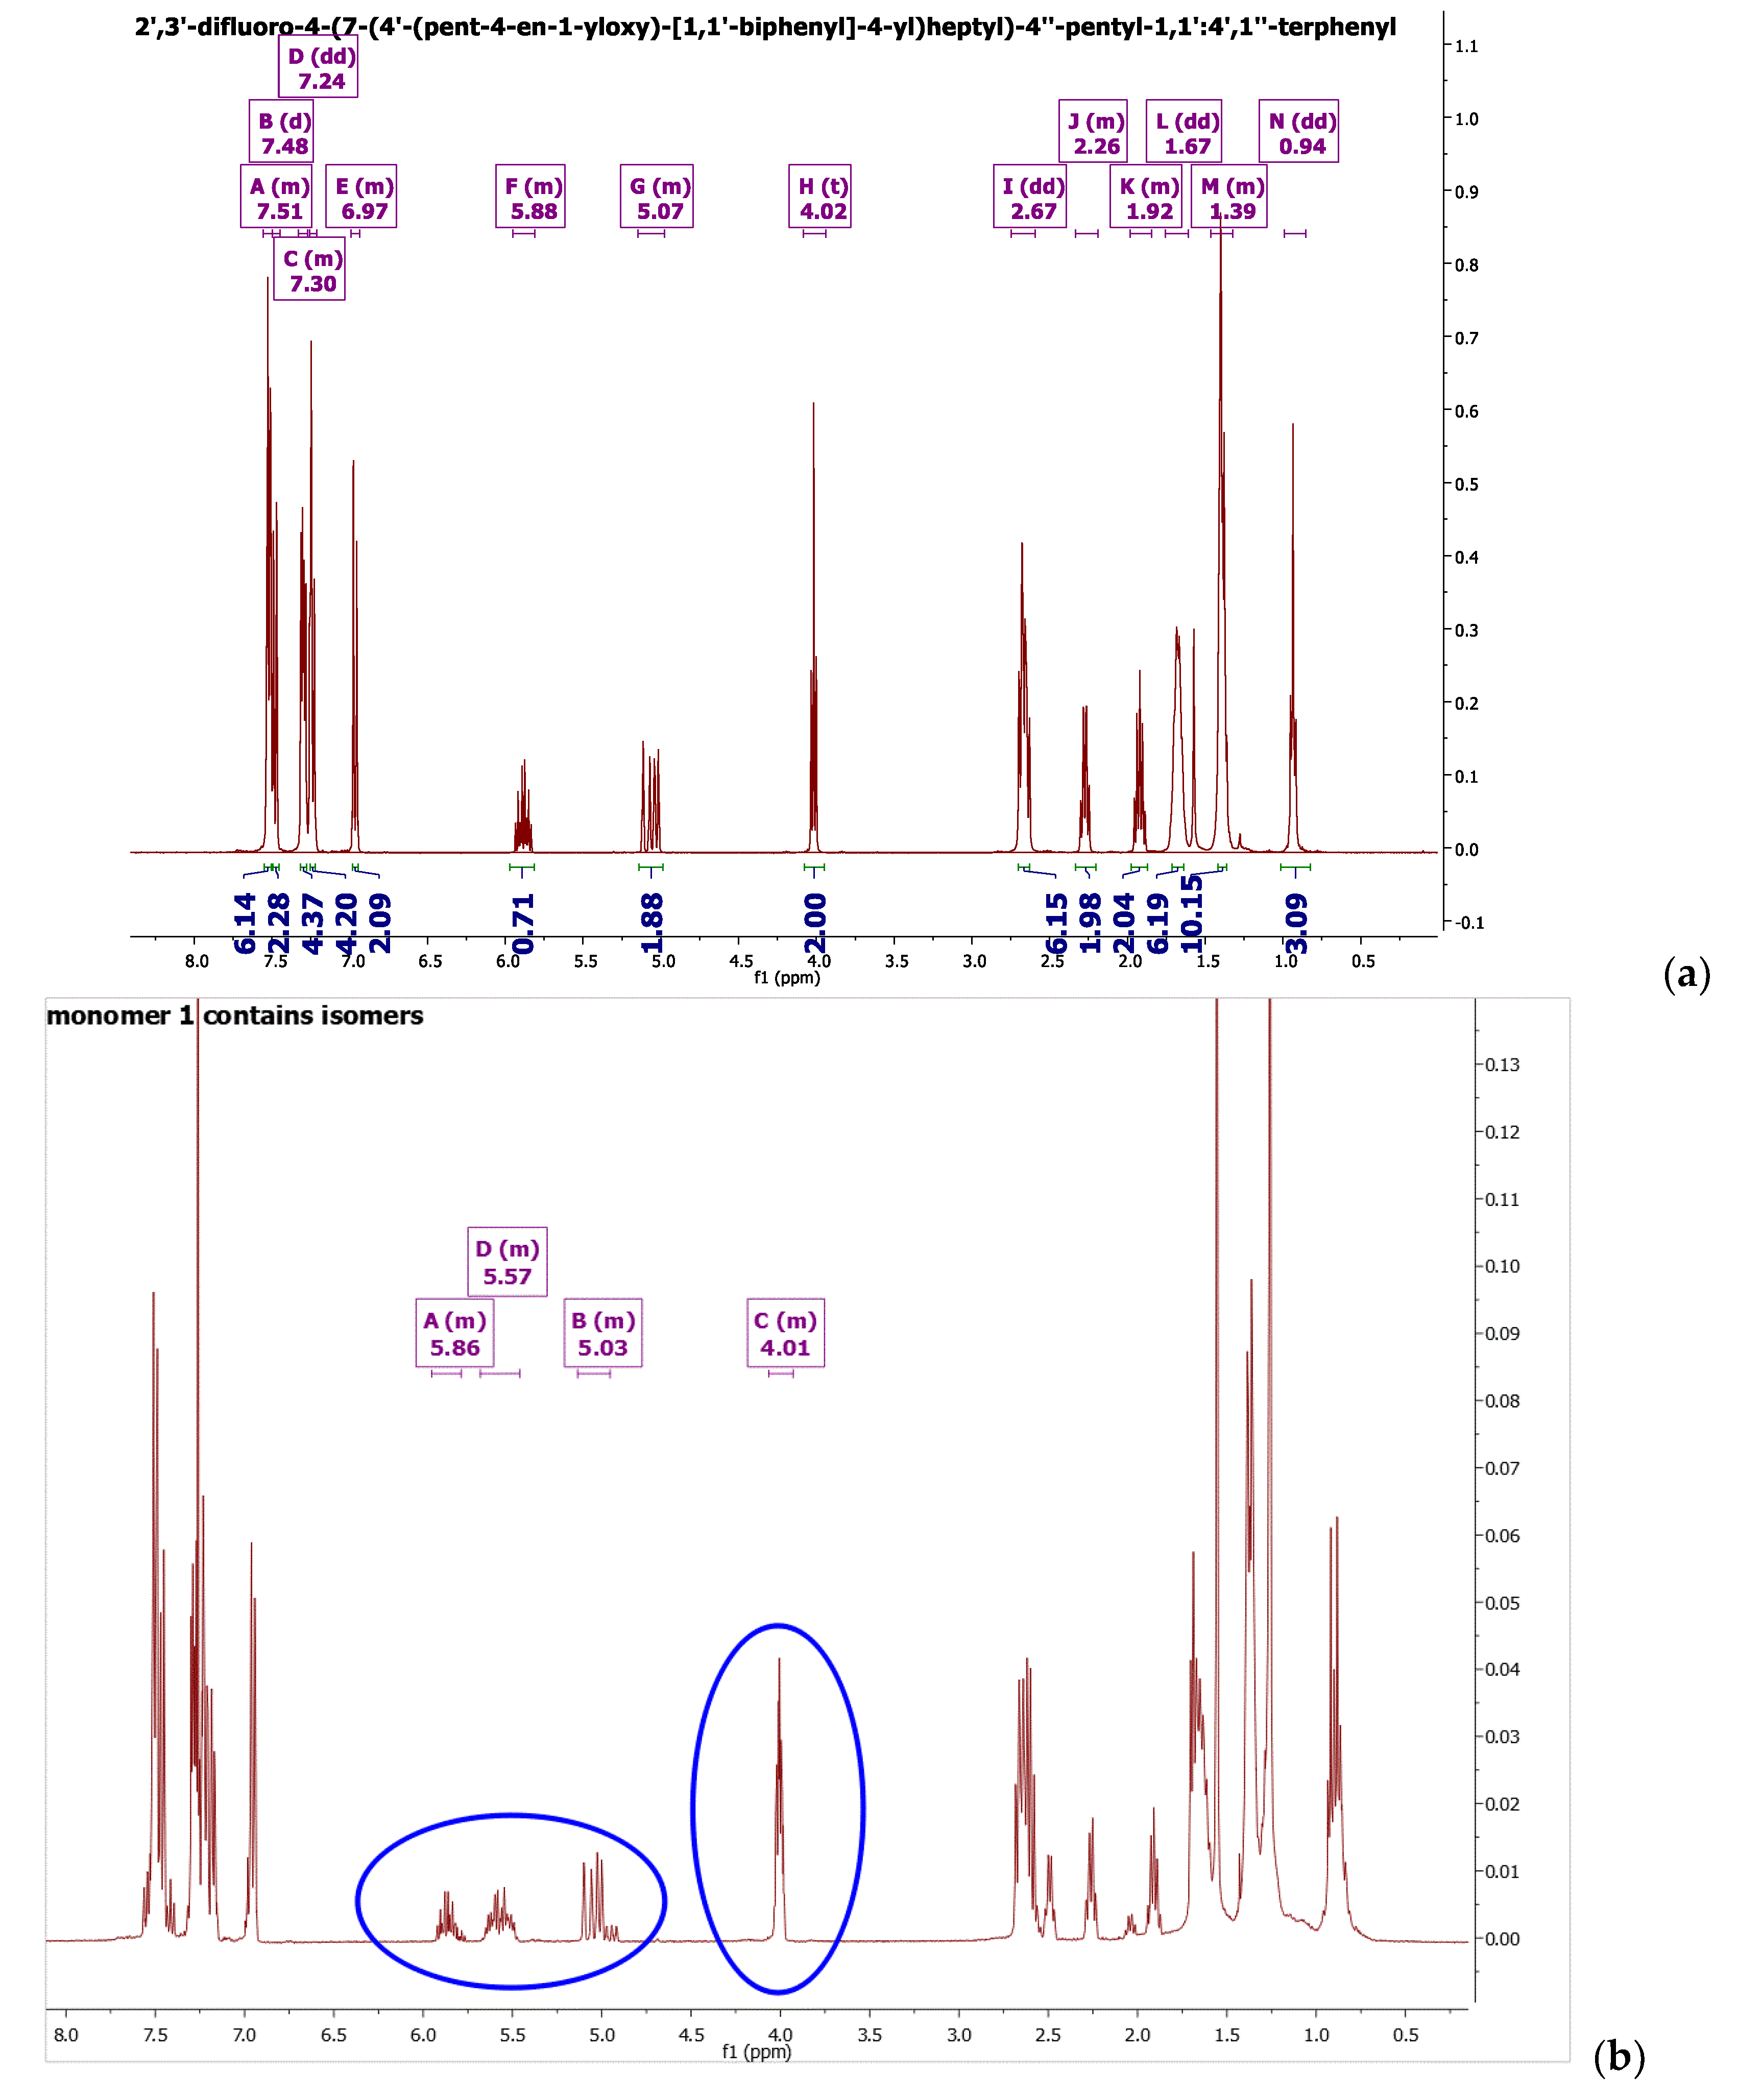
2.4. Synthesis of Monomers
2.5. Synthesis of the Pentamethyldisiloxane Derivative (PMDS1)
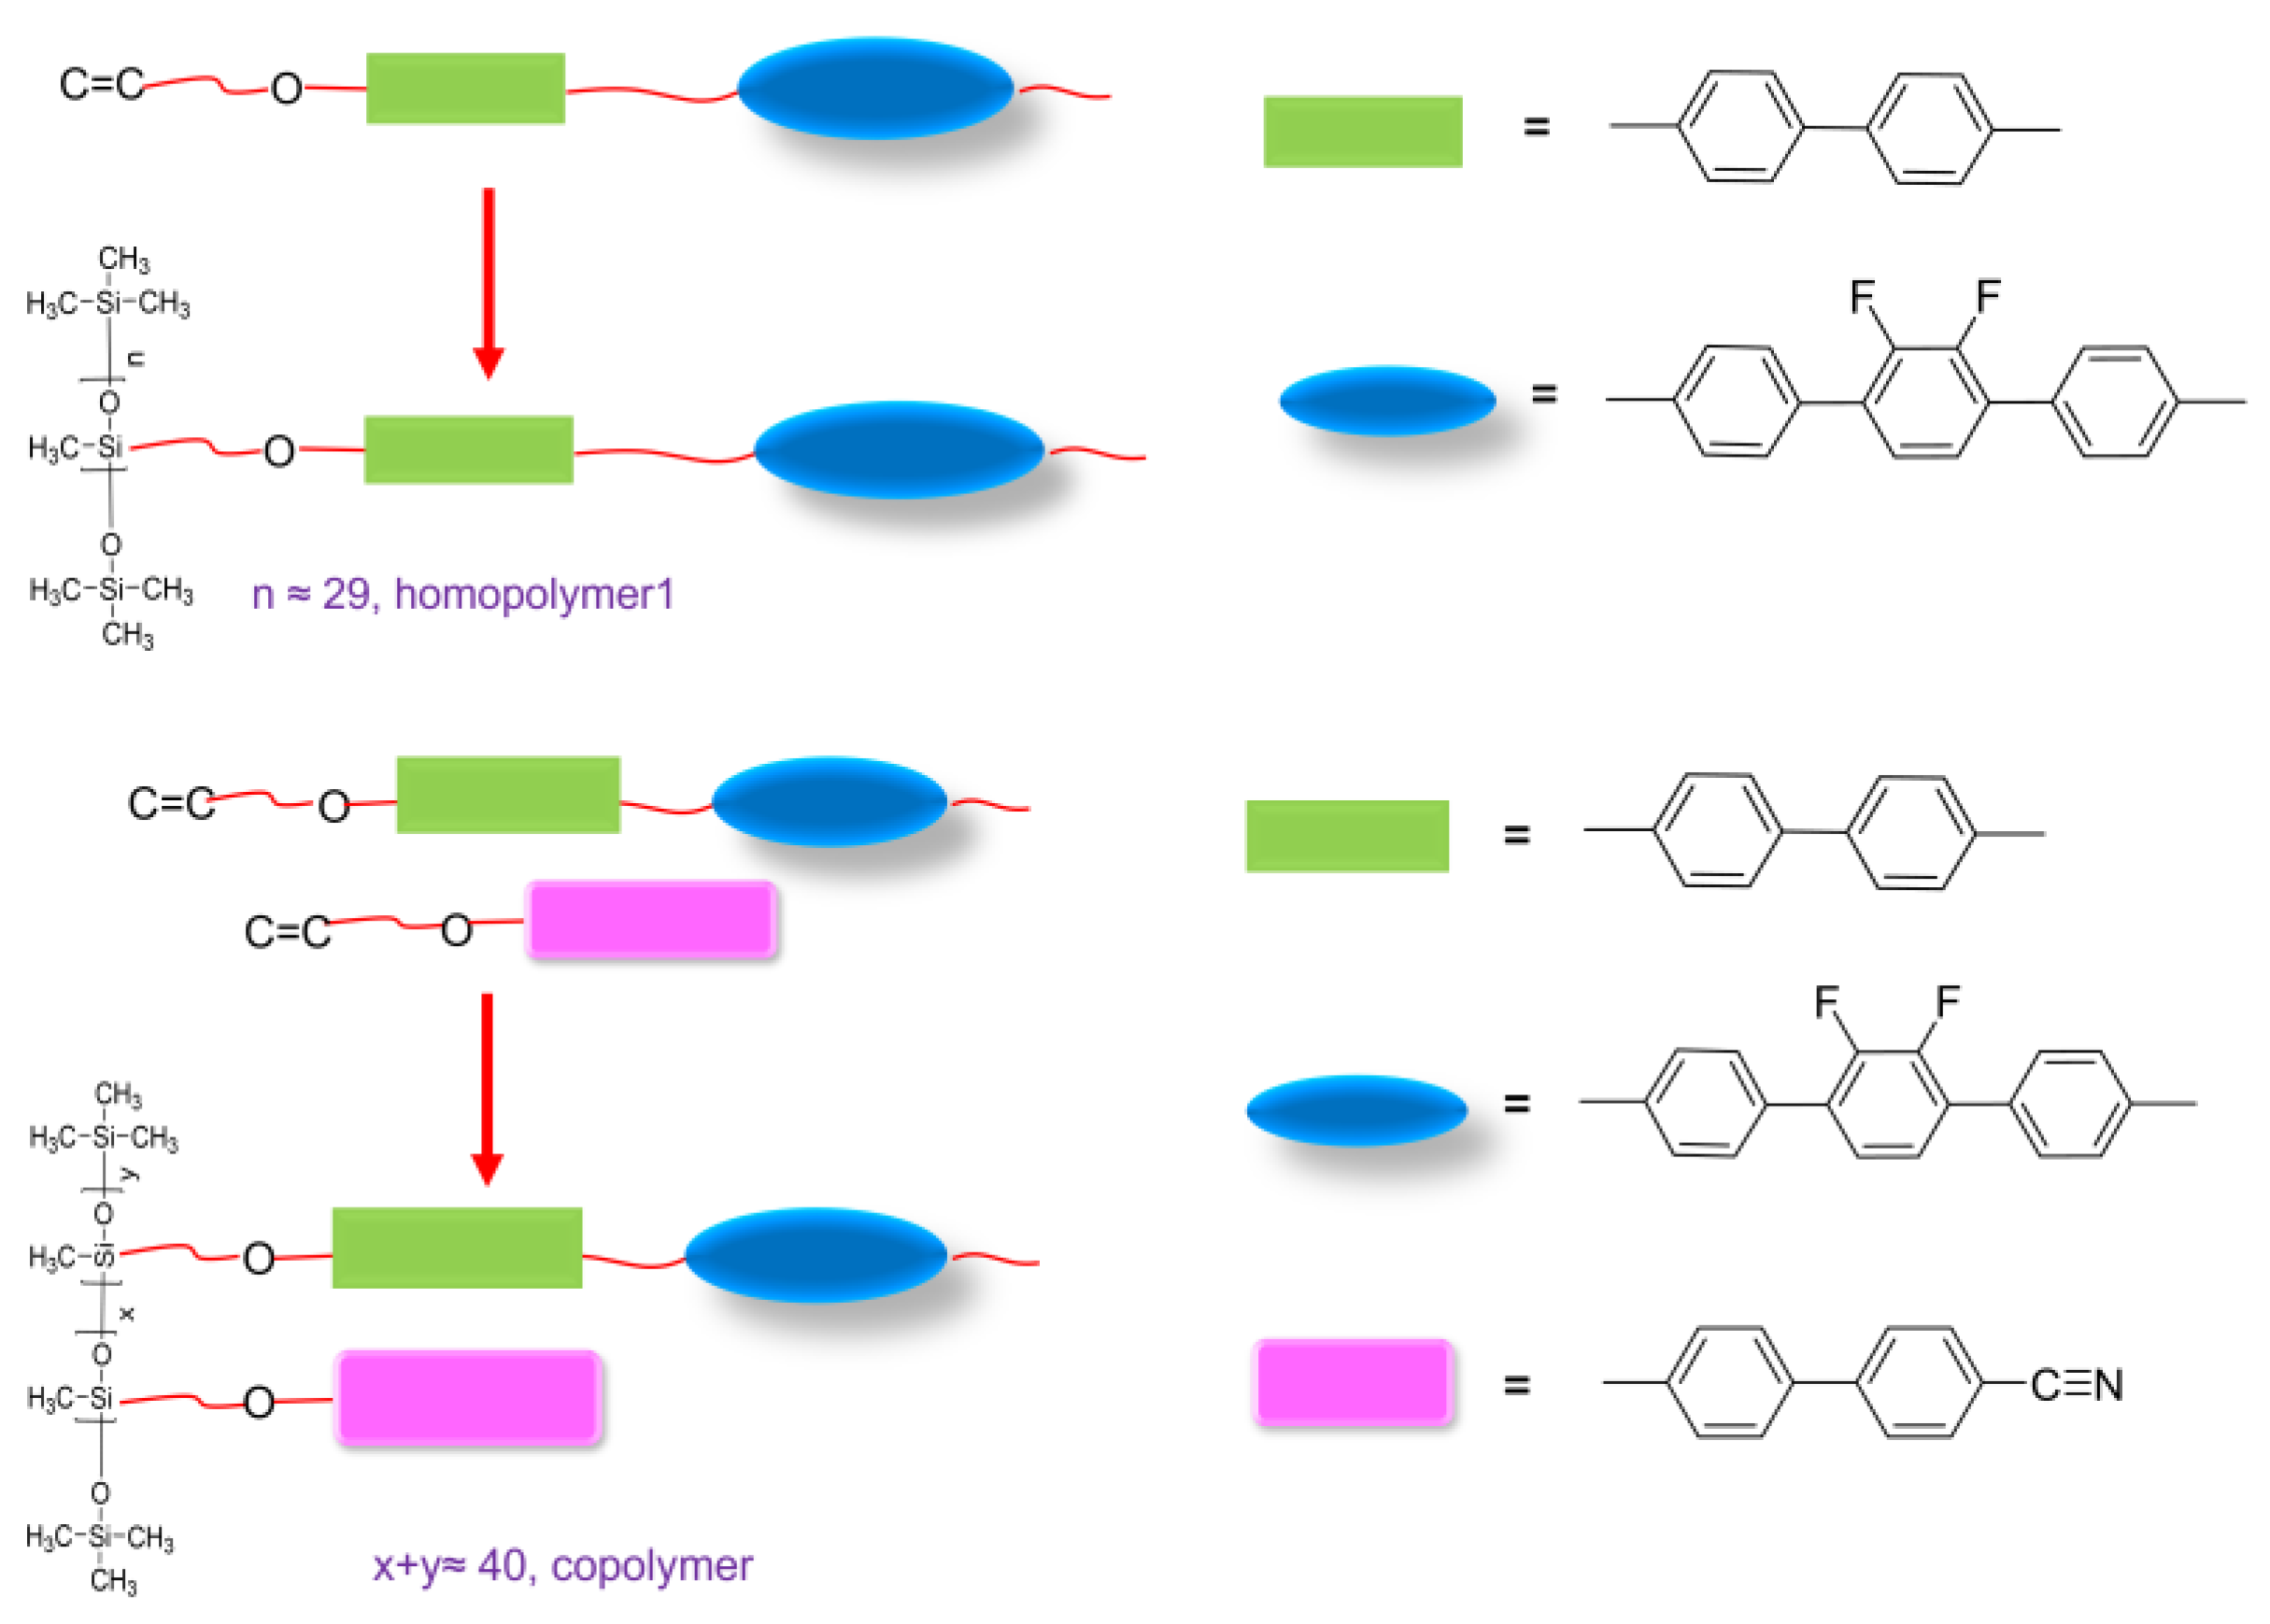
2.6. Synthesis of the Homopolymers (HP1 and PCN)
2.6.1. PCN
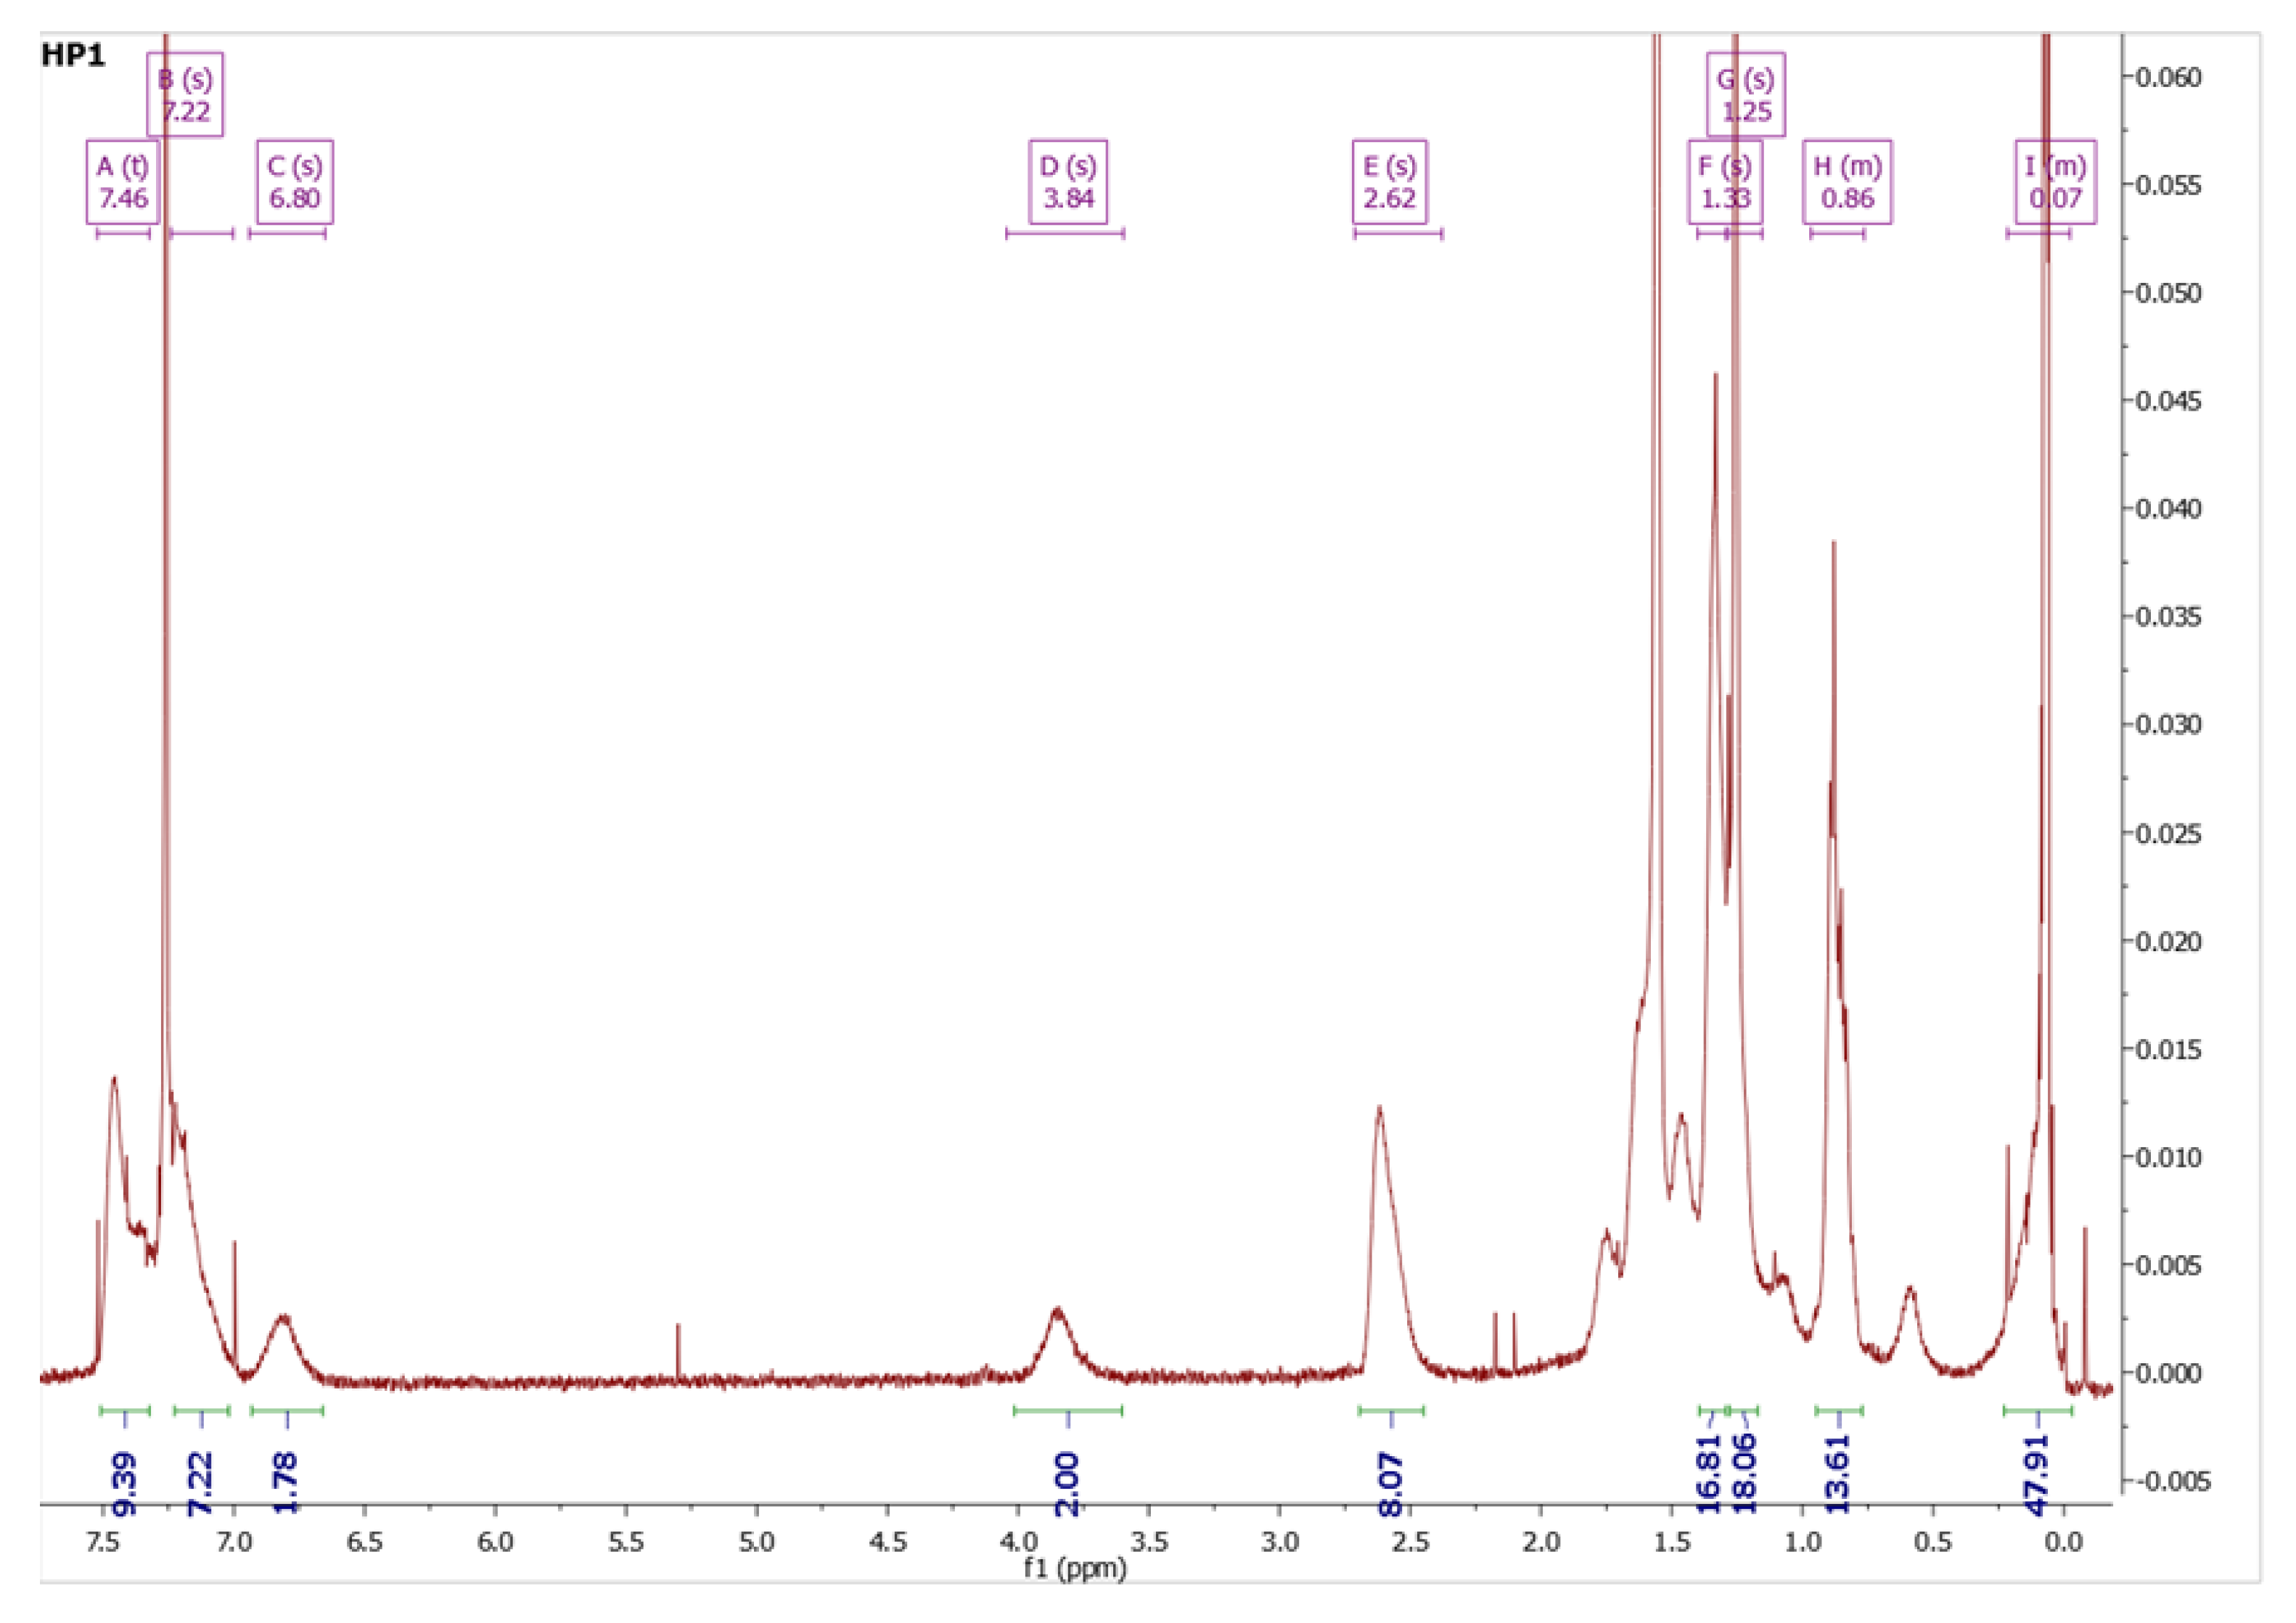
2.6.2. HP1
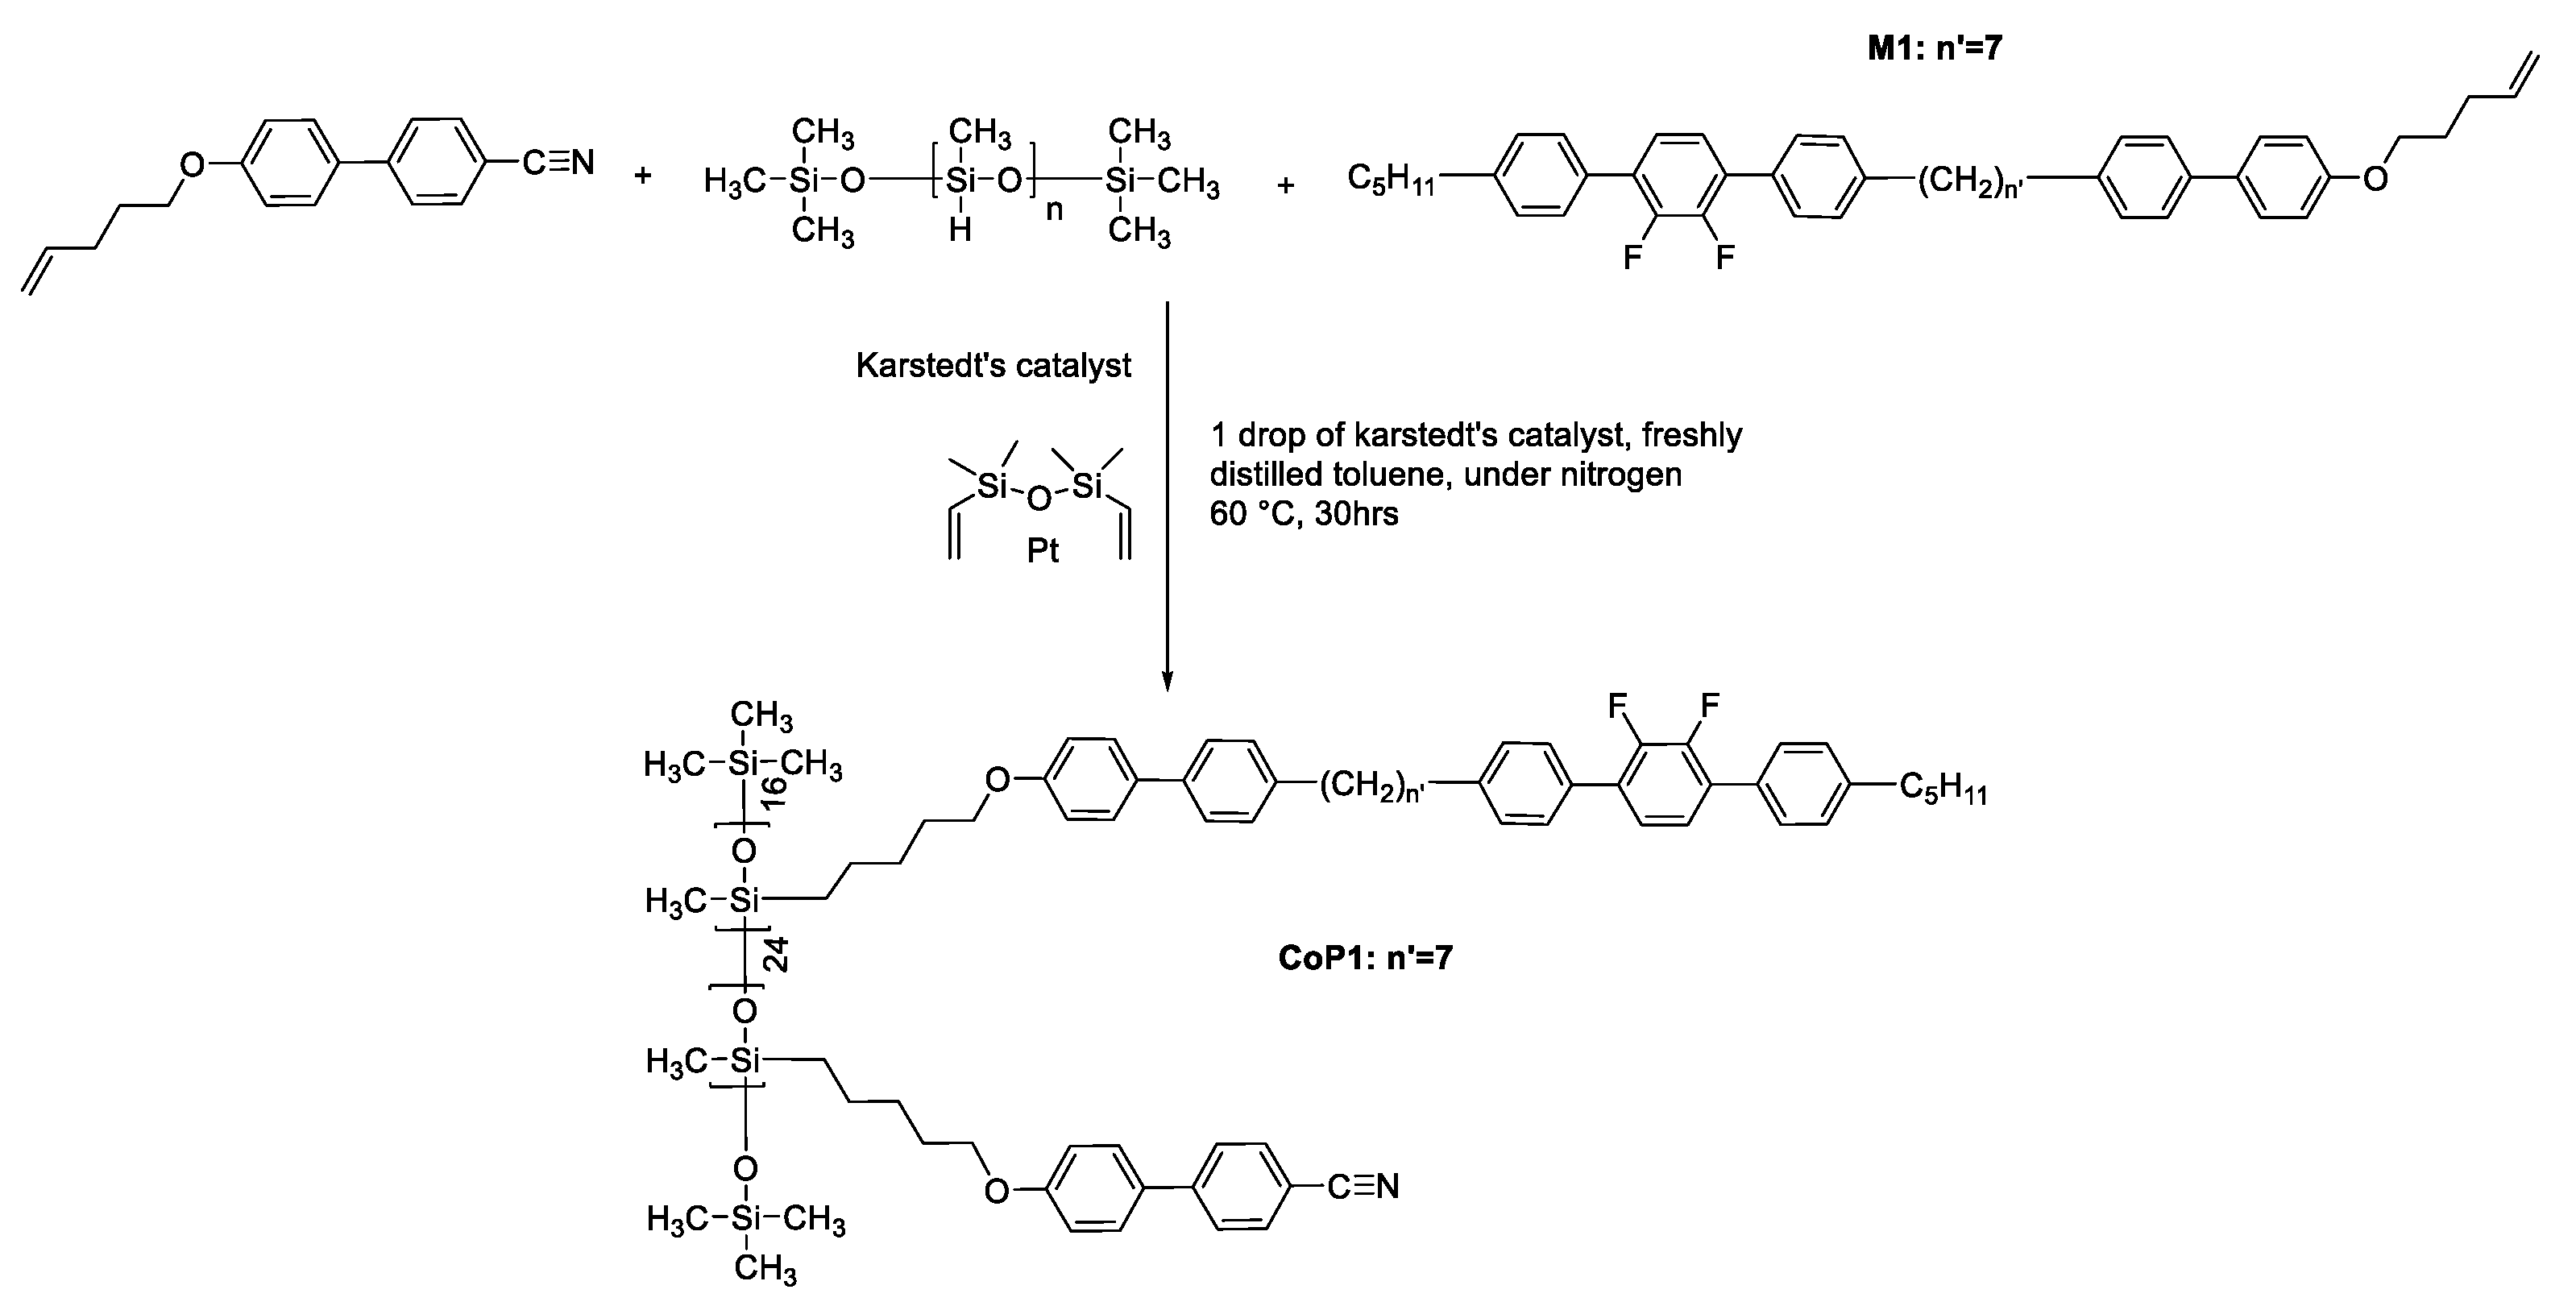
2.7. Synthesis of the Copolymer (CoP1)
CoP1
3. Results and Discussion
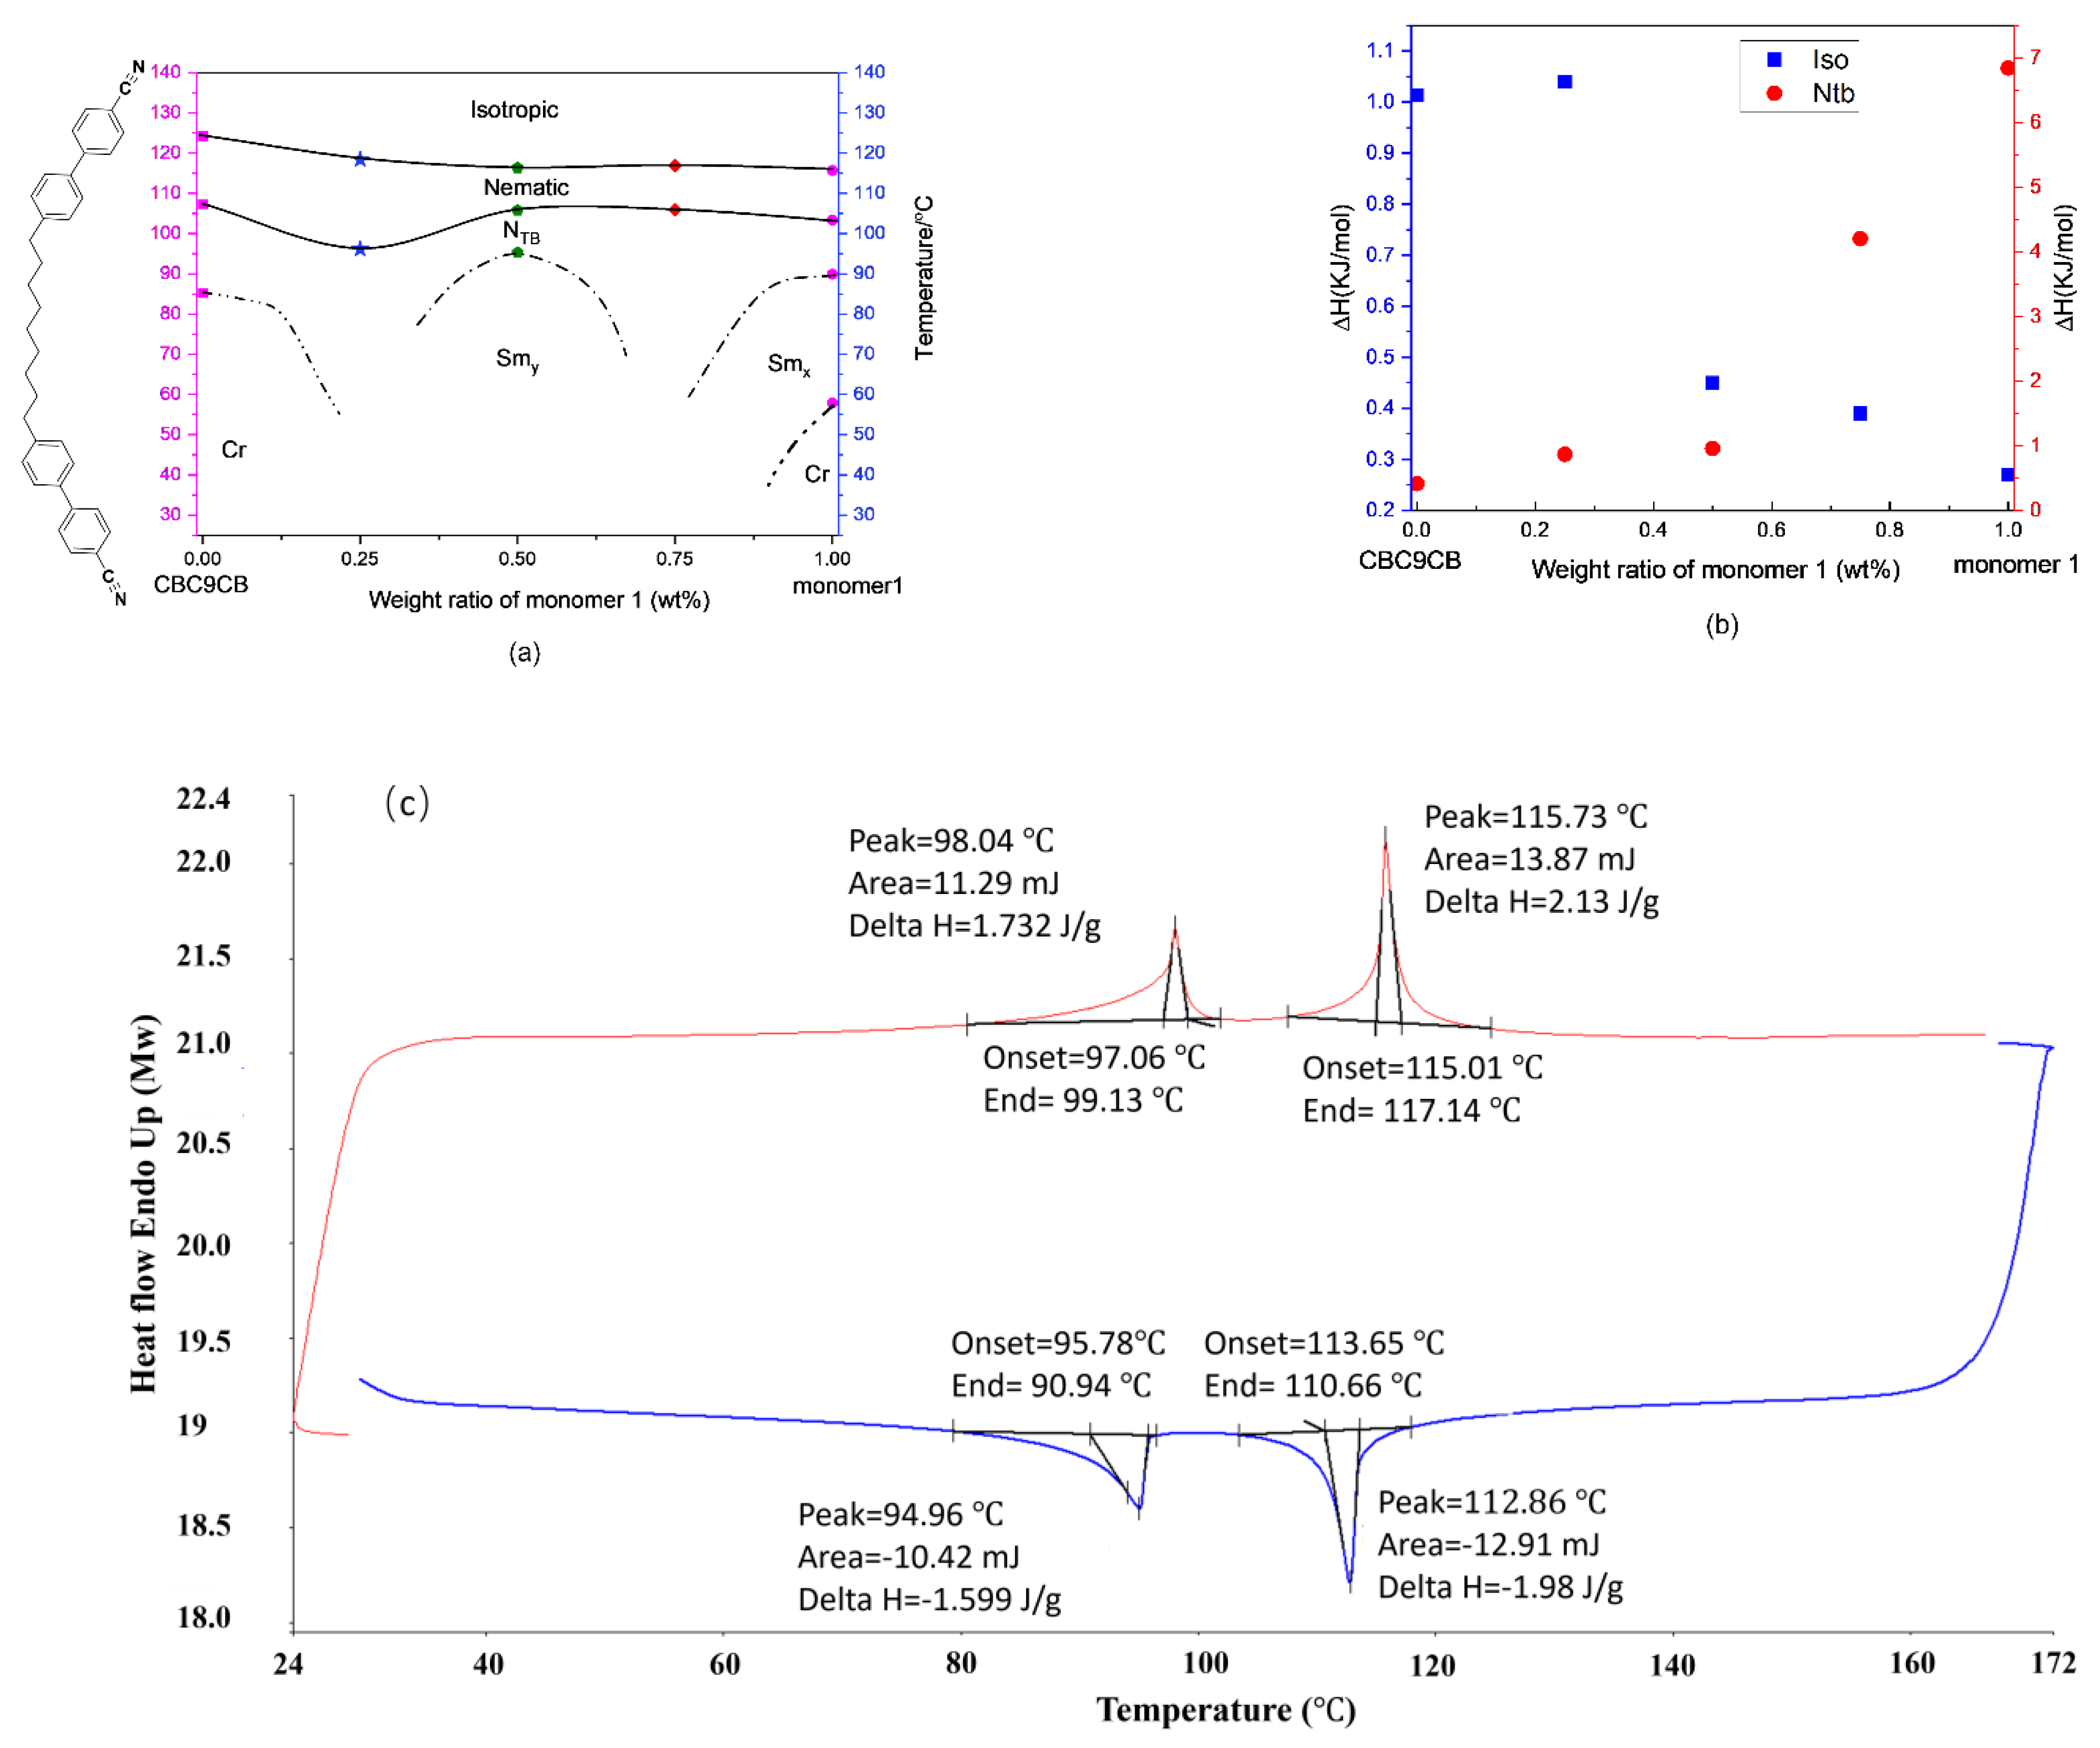
3.1. DSC Studies
- (a)
- Cr = crystalline; I = isotropic; Nx = unknown nematic phase; Smx = unknown smectic phase.
- (b)
- Monotropic phases are shown in square brackets; enthalpies are shown in parentheses, unit (J/g).
- (c)
- Peak width was measured as the difference between onset and offset temperatures ().
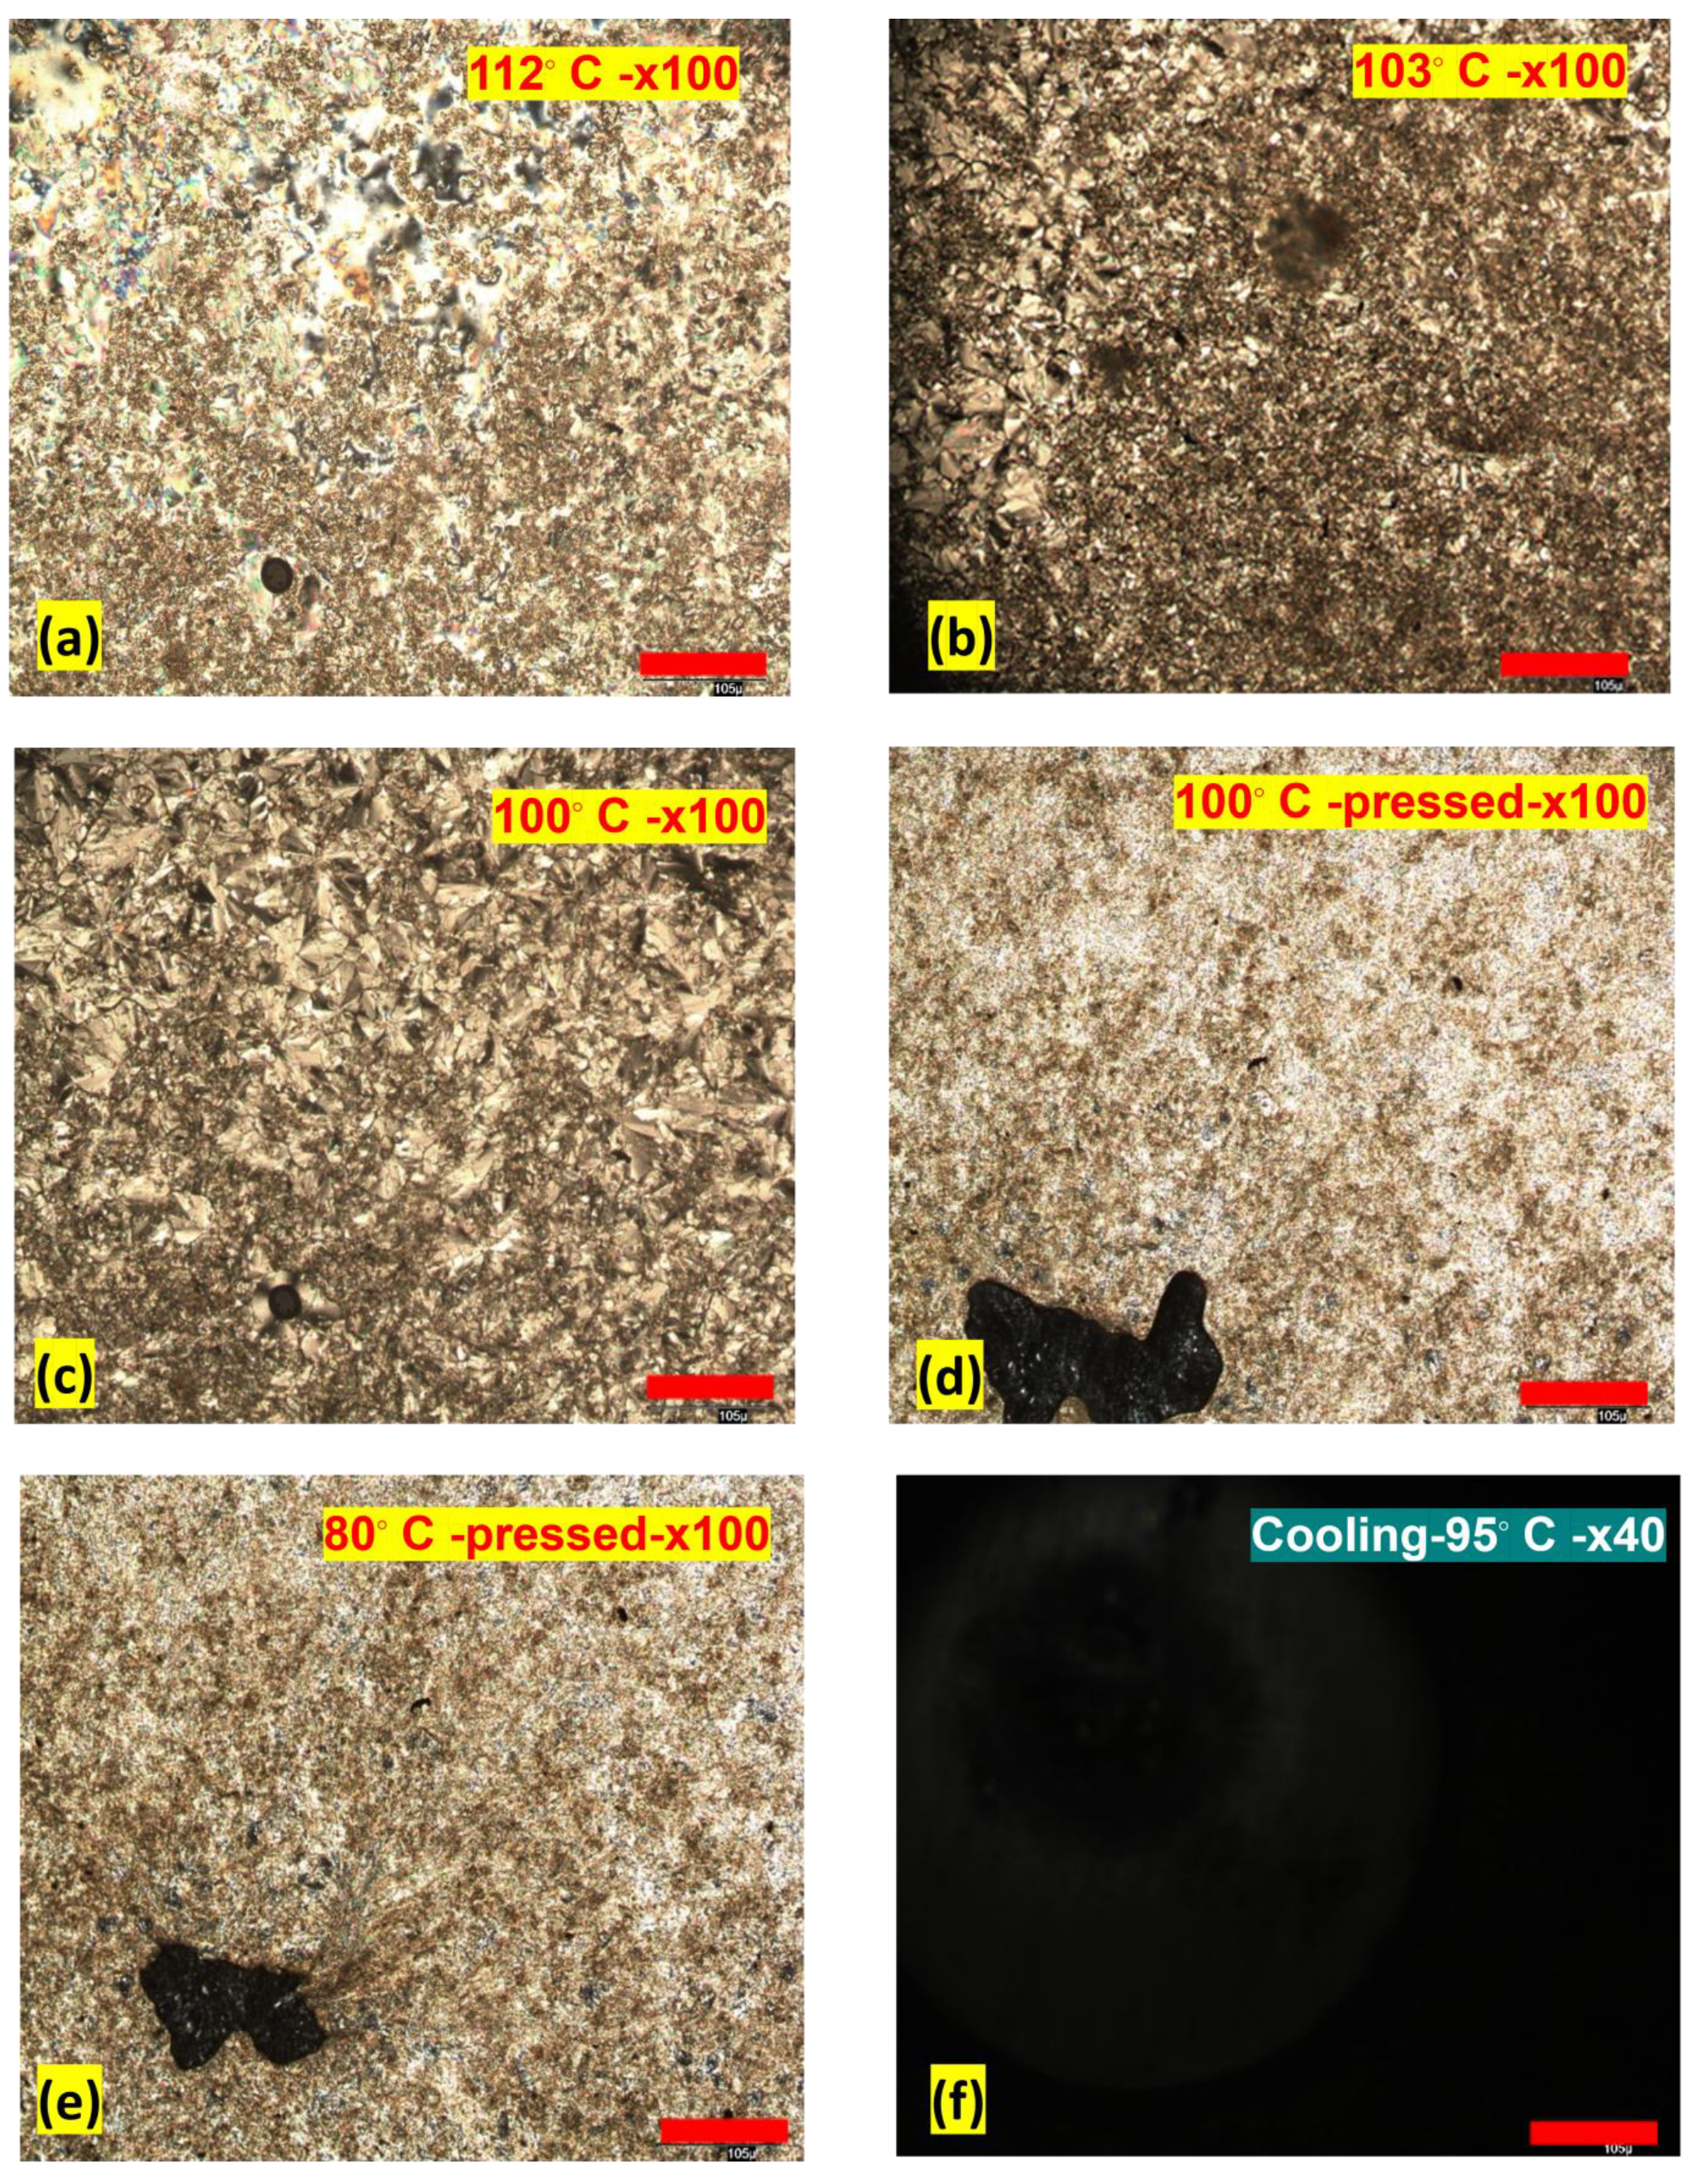
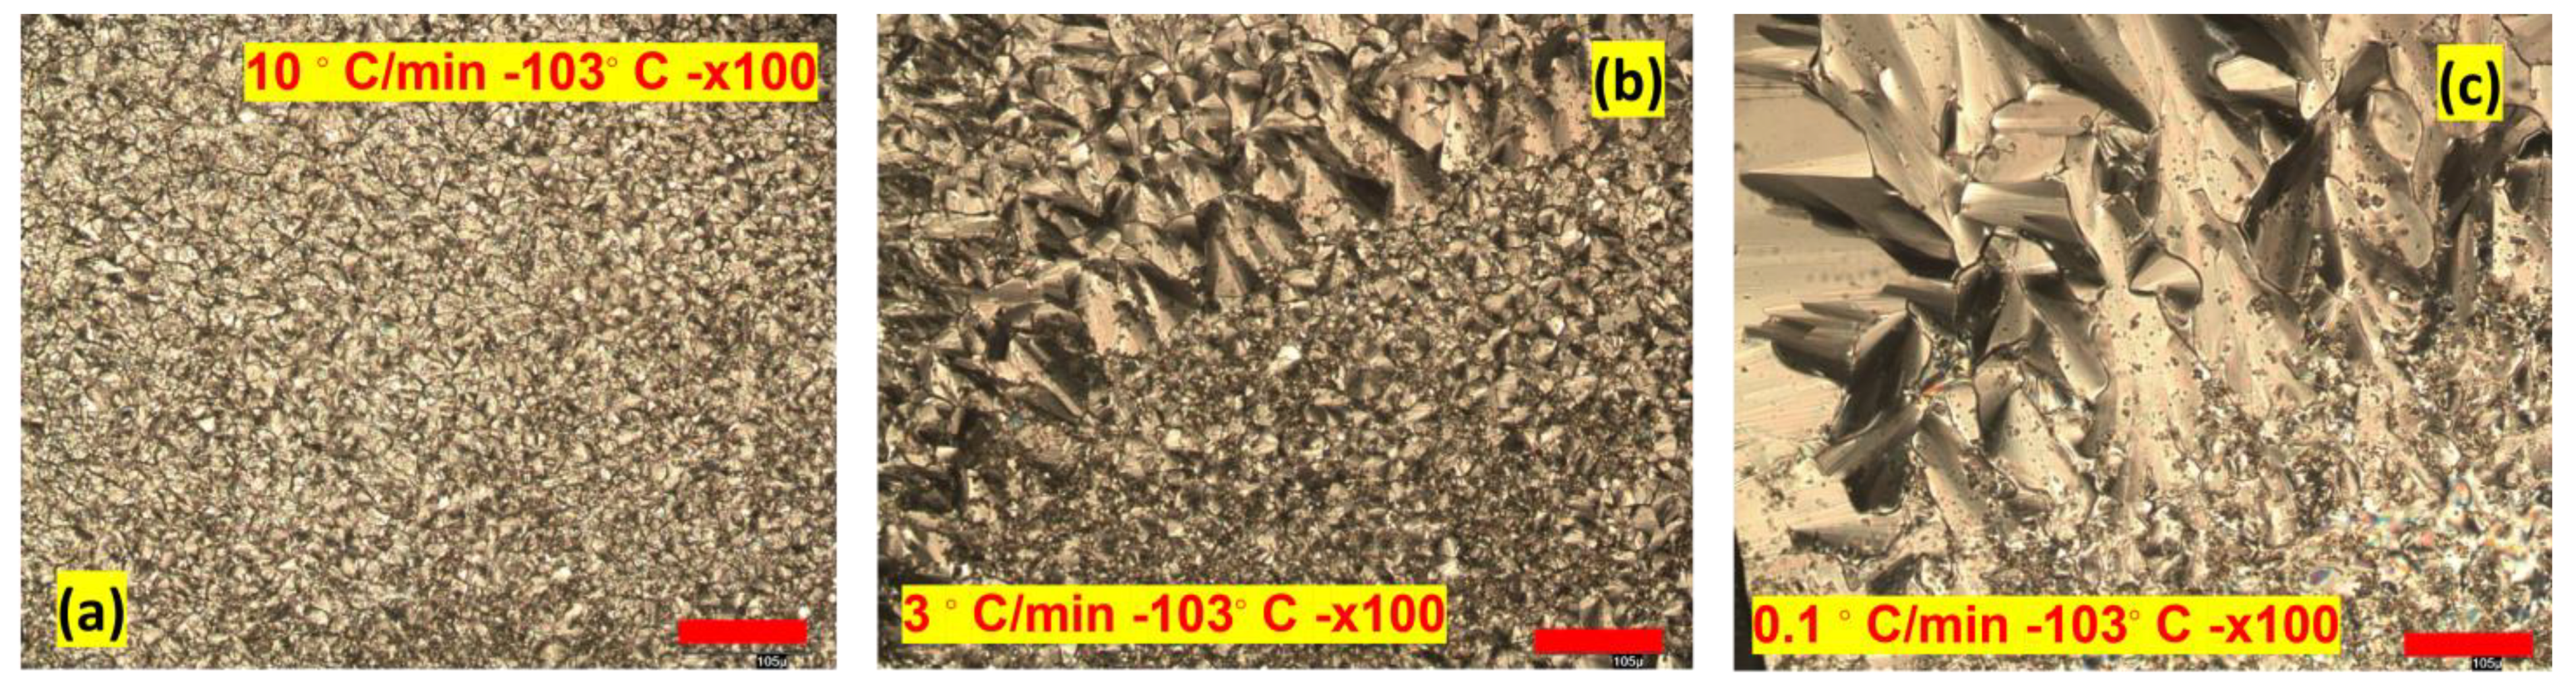
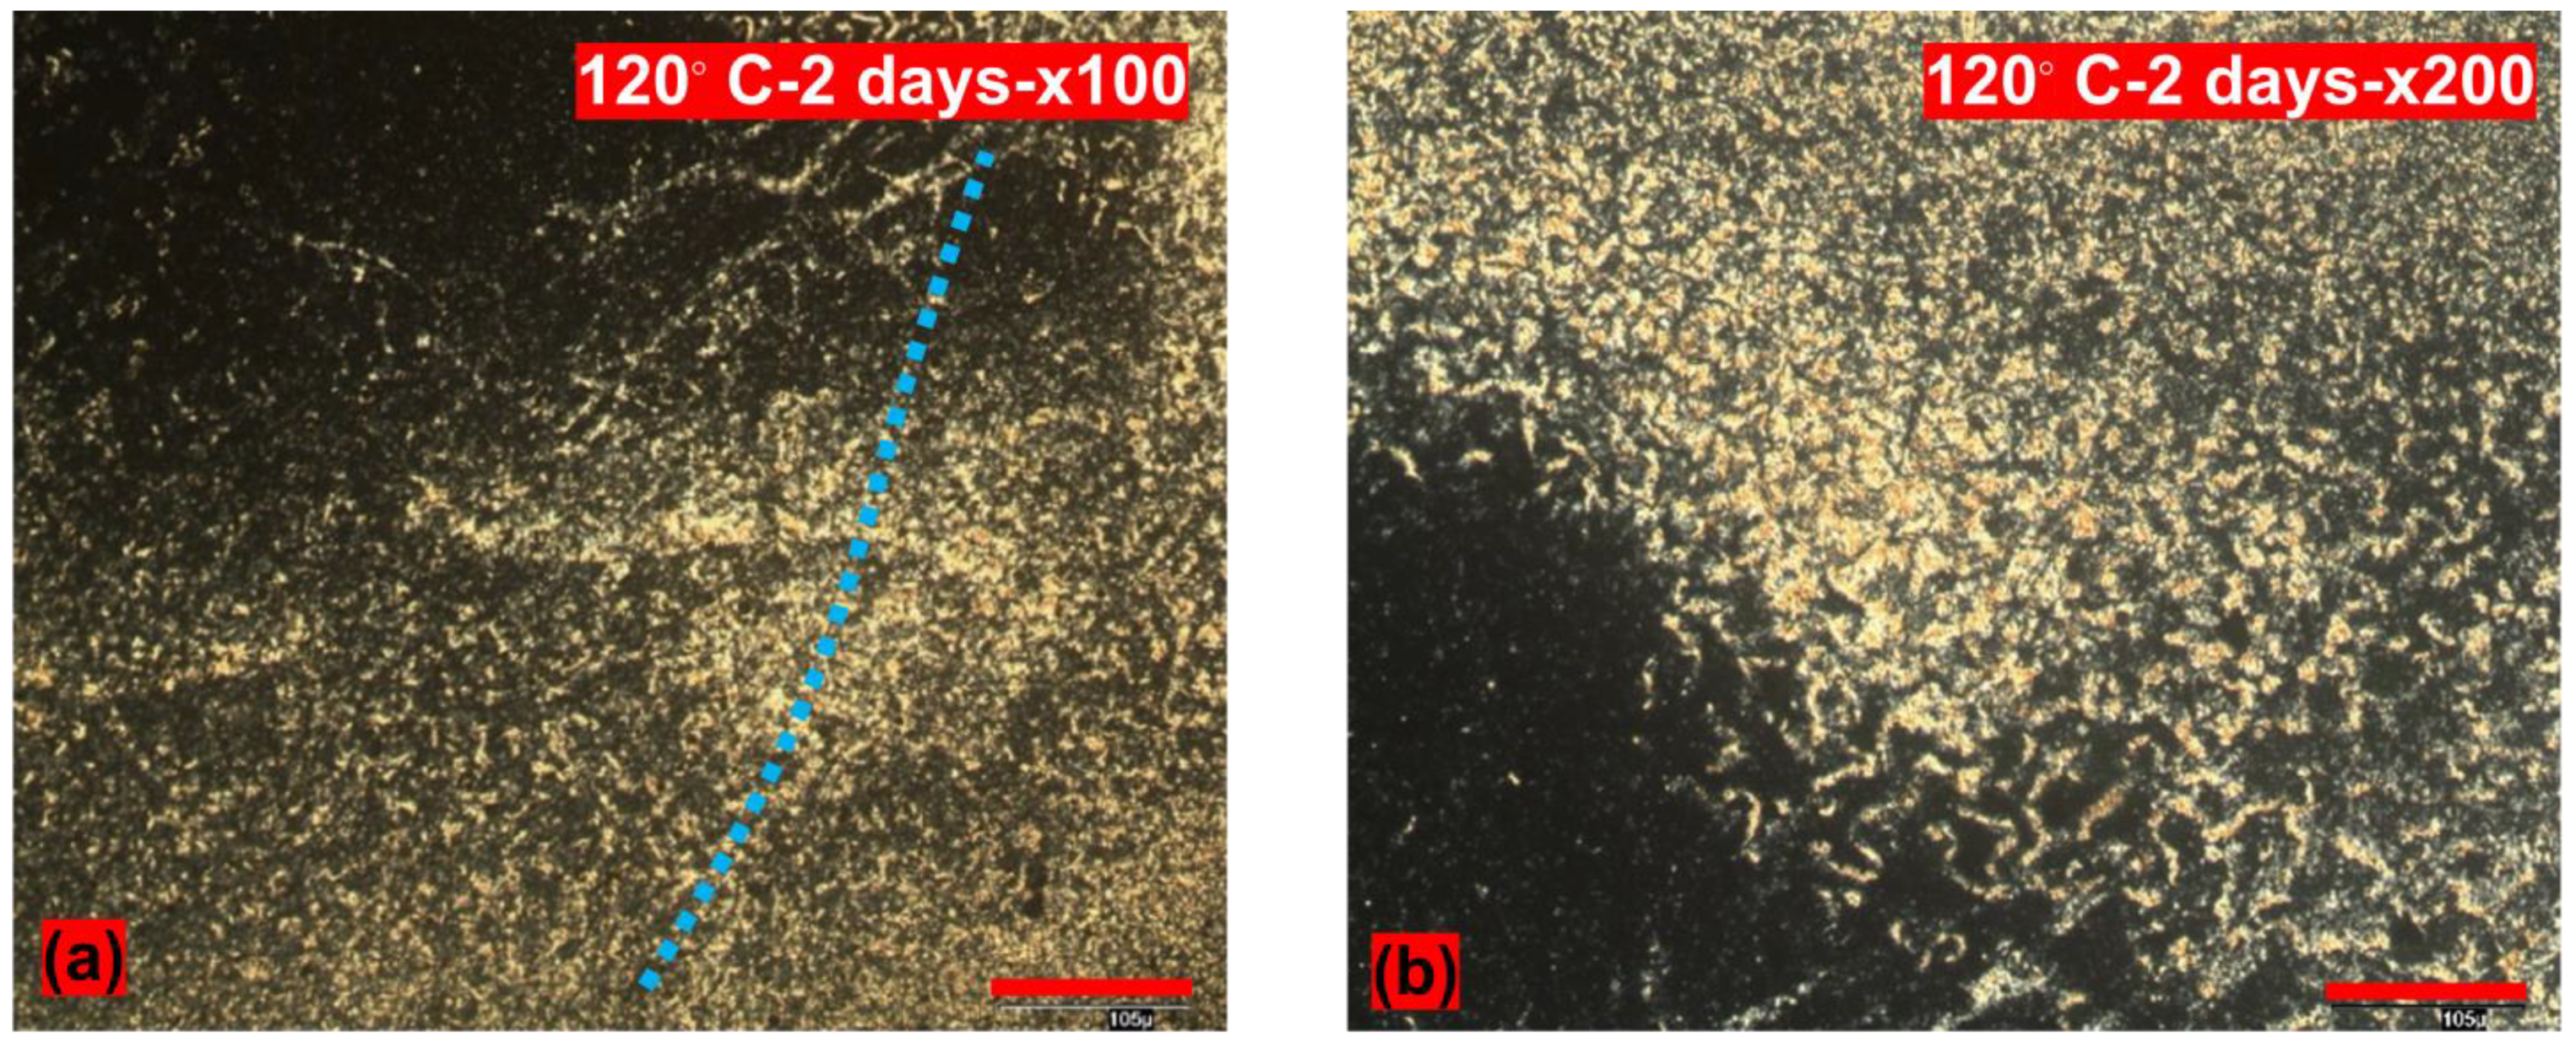
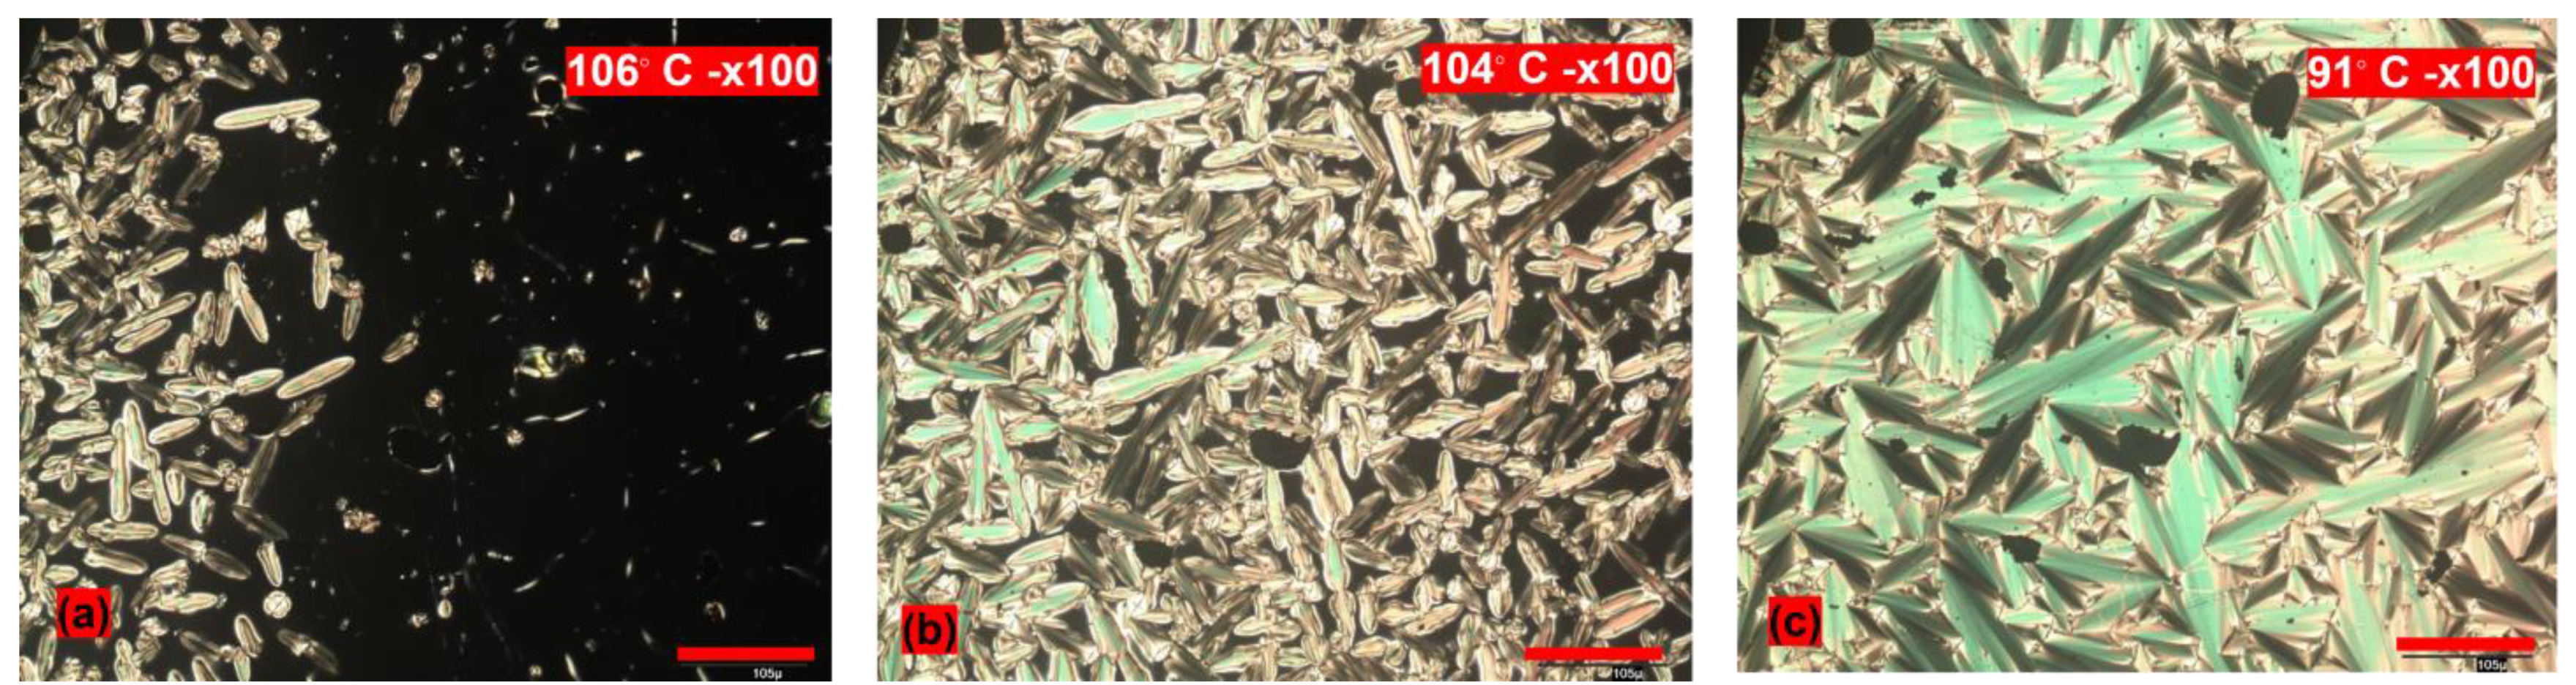
3.2. POM Studies
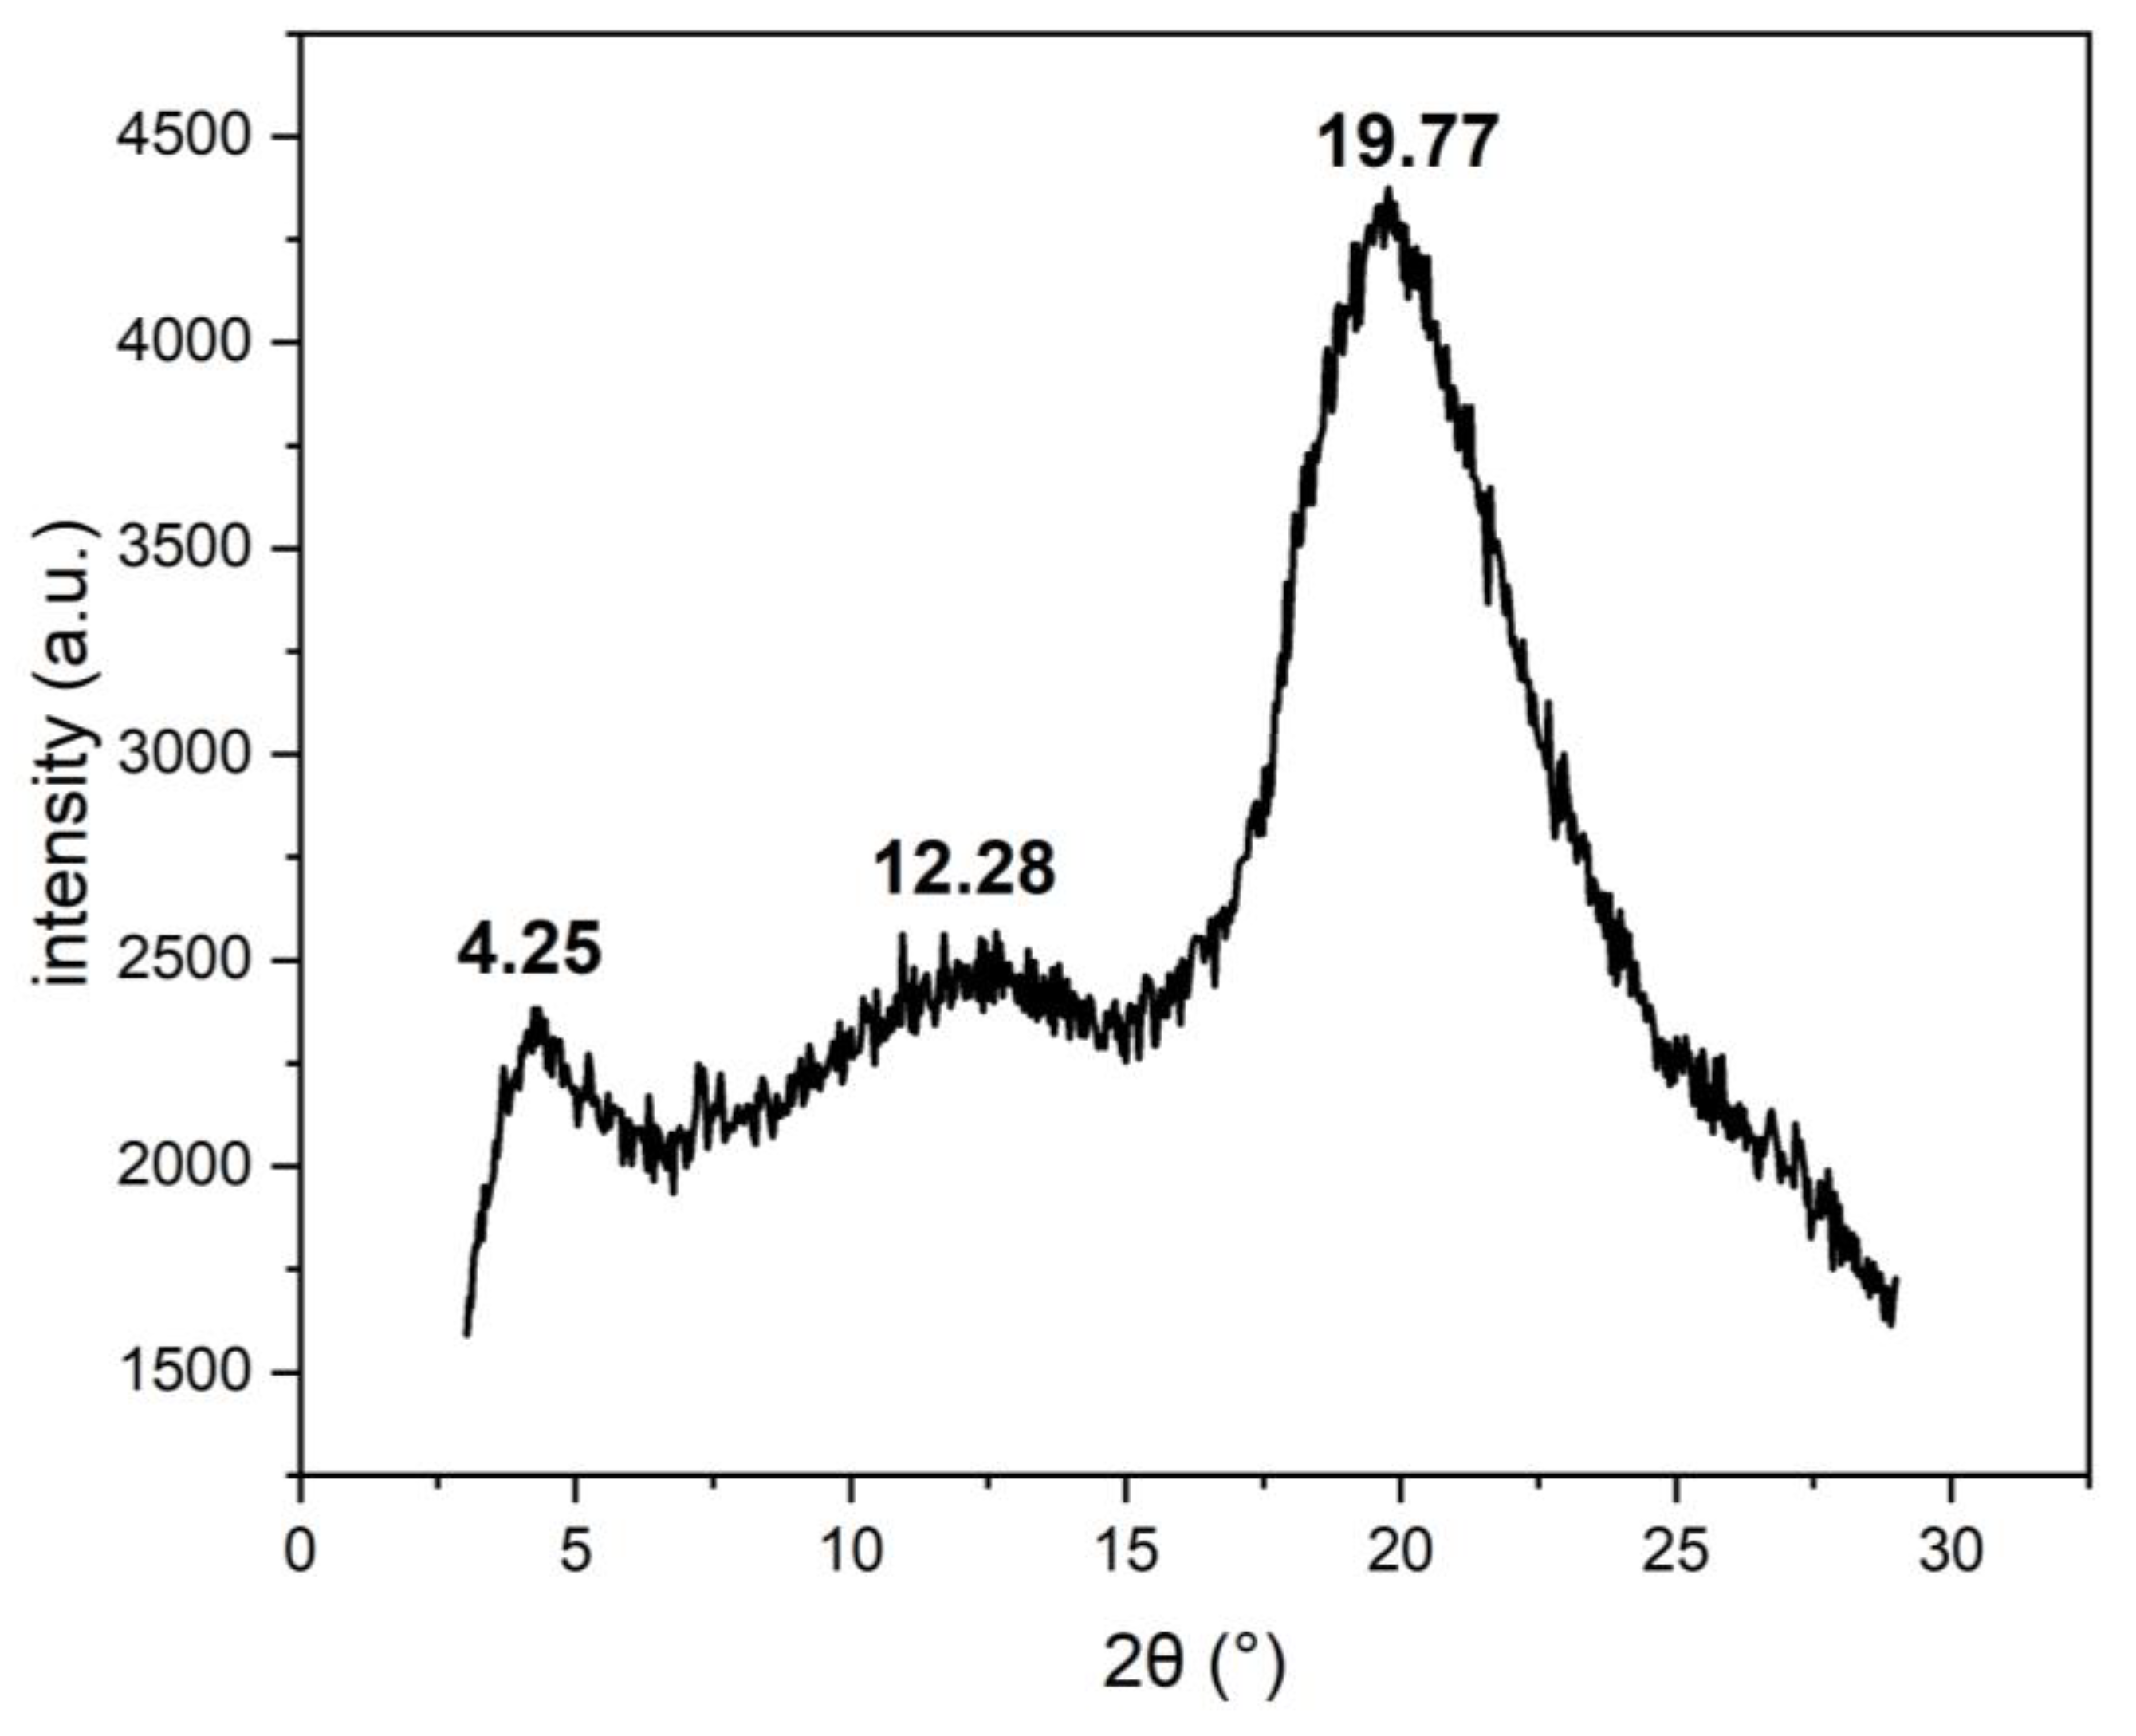
3.3. X-ray Powder Diffraction
3.4. Phase Diagram
3.5. Polysiloxanes
4. Conclusions
Supplementary Materials
Author Contributions
Funding
Data Availability Statement
Acknowledgments
Conflicts of Interest
References
- Finkelmann, H.; Happ, M.; Portugal, M.; Ringsdorf, H. Liquid crystalline polymers with biphenyl-moieties as mesogenic group. Die Makromol. Chem. Macromol. Chem. Phys. 1978, 179, 2541–2544. [Google Scholar] [CrossRef]
- Finkelmann, H.; Ringsdorf, H.; Wendorff, J.H. Model considerations and examples of enantiotropic liquid crystalline polymers. Polyreactions in ordered systems, 14. Die Makromol. Chem. Macromol. Chem. Phys. 1978, 179, 273–276. [Google Scholar] [CrossRef]
- Finkelmann, H.; Koldehoff, J.; Ringsdorf, H. Synthesis and Characterization of Liquid-Crystalline Polymers with Cholesteric Phase. Angew. Chem. Int. Ed. Engl. 1978, 17, 935–936. [Google Scholar] [CrossRef]
- Finkelmann, H.; Day, D. Structure of mesomorphic polymer phases. Die Makromol. Chem. Macromol. Chem. Phys. 1979, 180, 2269–2274. [Google Scholar] [CrossRef]
- Finkelmann, H.; Rehage, G. Investigations on liquid crystalline polysiloxanes, 2. Optical properties of cholesteric phases and influence of the flexible spacer on the mobility of the mesogenic groups. Die Makromol. Chem. Rapid Commun. 1980, 1, 733–740. [Google Scholar] [CrossRef]
- Finkelmann, H.; Rehage, G. Investigations on liquid crystalline polysiloxanes, 1. Synthesis and characterization of linear polymers. Die Makromol. Chem. Rapid Commun. 1980, 1, 31–34. [Google Scholar] [CrossRef]
- Milano, J.C.; Robert, J.M.; Vernet, J.L.; Gallot, B. The thioether spacer in liquid crystalline polysiloxanes with cyano-and nitrobiphenyl mesogens. Macromol. Chem. Phys. 1999, 200, 1580–1586. [Google Scholar] [CrossRef]
- Jeng, G.P.C.; Kuo, J.F.; Chen, C.Y. Synthesis and mesomorphic behavior of terminally carboxyl oligo (ethylene oxide) monomethyl ethers-substituted side chain liquid crystalline polysiloxanes. I. J. Appl. Polym. Sci. 1993, 47, 697–706. [Google Scholar] [CrossRef]
- Gray, G.W.; Hill, J.S.; Lacey, D. Synthesis and properties of some liquid crystal polysiloxanes with laterally or terminally attached side chains. Mol. Cryst. Liq. Cryst. 1991, 197, 43–55. [Google Scholar] [CrossRef]
- Day, G.M.; Kim, H.-J.; Jackson, W.R.; Simon, G.P. Synthesis and characterization of novel chiral liquid crystalline polysiloxanes. Acta Polym. 1999, 50, 96–104. [Google Scholar] [CrossRef]
- Hsu, C.S.; Lu, Y.H. Synthesis and characterization of side-chain liquid crystalline polysiloxanes containing 4-alkanyloxyphenyl trans-4-alkylcyclohexanoate side groups. J. Polym. Sci. Part A Polym. Chem. 1991, 29, 977–986. [Google Scholar] [CrossRef]
- Richard, H.; Mauzac, M.; Sigaud, G.; Achard, M.; Hardouin, F. Liquid crystal side chain polysiloxanes containing various proportions of non-mesogenic units. Liq. Cryst. 1991, 9, 679–689. [Google Scholar] [CrossRef]
- Kawashima, Y.; Nozaki, K.; Hiyama, T.; Yoshio, M.; Kanie, K.; Kato, T. Liquid-crystalline stereoregular polyketone prepared from a mesogenic vinylarene and carbon monoxide. J. Polym. Sci. Part A Polym. Chem. 2003, 41, 3556–3563. [Google Scholar] [CrossRef]
- Gu, H.D.; Chen, L.; Yan, J.X. Effect of chiral isosorbide groups on mesomorphic properties of side-chain liquid-crystalline polysiloxanes. Liq. Cryst. 2009, 36, 1319–1327. [Google Scholar] [CrossRef]
- Huang, H.; Cong, Y.; Lin, Z.; Zhang, B. Synthesis and properties of side-chain liquid crystalline polymers grafted with chiral dimers containing cholesteryl groups. Liq. Cryst. 2020, 47, 723–736. [Google Scholar] [CrossRef]
- Saha, R.; Babakhanova, G.; Parsouzi, Z.; Rajabi, M.; Gyawali, P.; Welch, C.; Mehl, G.H.; Gleeson, J.; Lavrentovich, O.D.; Sprunt, S. Oligomeric odd–even effect in liquid crystals. Mater. Horiz. 2019, 6, 1905–1912. [Google Scholar] [CrossRef]
- Ahmed, Z.; Welch, C.; Mehl, G.H. The design and investigation of the self-assembly of dimers with two nematic phases. RSC Adv. 2015, 5, 93513–93521. [Google Scholar] [CrossRef]
- Johnson, C.R.; Braun, M.P. A two-step, three-component synthesis of PGE1: Utilization of. alpha.-iodo enones in Pd (0)-catalyzed cross-couplings of organoboranes. J. Am. Chem. Soc. 1993, 115, 11014–11015. [Google Scholar] [CrossRef]
- Mano, J.F.; Correia, N.T.; Moura Ramos, J.J.; Fernandes, A.C. A thermally stimulated discharge currents study of the molecular motions in two polysiloxane side-chain liquid crystalline polymers. J. Polym. Sci. Part B Polym. Phys. 1995, 33, 269–277. [Google Scholar] [CrossRef]
- McArdle, C.B. Side Chain Liquid Crystal Polymers; Springer Science & Business Media: Berlin/Heidelberg, Germany, 1990. [Google Scholar]
- Gemmell, P.; Gray, G.W.; Lacey, D. Effects of molecular structure on the properties of terminally cyano-substituted side chain liquid crystalline polysiloxanes. Mol. Cryst. Liq. Cryst. 1985, 122, 205–218. [Google Scholar] [CrossRef]
- Stevens, H.; Rehage, G.; Finkelmann, H. Phase transformations of liquid crystalline side-chain oligomers. Macromolecules 1984, 17, 851–856. [Google Scholar] [CrossRef]
- Finkelmann, H. Liquid crystalline side-chain polymers. Philosophical Transactions of the Royal Society of London. Ser. A Math. Phys. Sci. 1983, 309, 105–114. [Google Scholar]
- Shibaev, V.; Plate, N. Synthesis and structure of liquid-crystalline side-chain polymers. Pure Appl. Chem. 1985, 57, 1589–1602. [Google Scholar] [CrossRef]
- Ramou, E.; Ahmed, Z.; Welch, C.; Karahaliou, P.; Mehl, G.H. The stabilisation of the Nx phase in mixtures. Soft Matter 2016, 12, 888–899. [Google Scholar] [CrossRef]
- Dierking, I. Textures of Liquid Crystals; John Wiley & Sons: Hoboken, NJ, USA, 2003. [Google Scholar]
- Newton, J.; Coles, H.; Hodge, P.; Hannington, J. Synthesis and properties of low-molar-mass liquid-crystalline siloxane derivatives. J. Mater. Chem. 1994, 4, 869–874. [Google Scholar] [CrossRef]
- Paterson, D.A.; Abberley, J.P.; Harrison, W.T.; Storey, J.M.; Imrie, C.T. Cyanobiphenyl-based liquid crystal dimers and the twist-bend nematic phase. Liq. Cryst. 2017, 44, 127–146. [Google Scholar] [CrossRef]
- Stevenson, W.D.; Zou, H.X.; Zeng, X.B.; Welch, C.; Ungar, G.; Mehl, G.H. Dynamic calorimetry and XRD studies of the nematic and twist-bend nematic phase transitions in a series of dimers with increasing spacer length. Phys. Chem. Chem. Phys. 2018, 20, 25268–25274. [Google Scholar] [CrossRef]


| Compound No | GPC Results | Weight Average DP Obtained by GPC | Average Molecular Weight of Repeating Units | ||
|---|---|---|---|---|---|
| Polysiloxane backbone | 830 | 663 | 1.3 | 13.8 | 60.1 |
| HP1 | 21,494 | 15,441 | 1.4 | 29.4 | 730.4 |
| PCN | 28,848 | 14,212 | 2.0 | 89.3 | 323.1 |
| CoP1 (M1: MCN = 1.2: 0.8) | 22,720 | 12,778 | 1.8 | 40 | 567.5 |
| Compound No | Spacer Length | Number of F Groups Attached | Transition Temperature °C (Using Onset and Offset of the Peaks), Measured by DSC at 10 °C/min, Enthalpies Unit (J/g) | Highest LC-I Temperature Peak Width |
|---|---|---|---|---|
| M1 | 5 | 2 | Cr 87.5 Ntb 101.5 (10.1) N 113.0 (0.5) I | 3.8 |
| I 114.2 (−0.5) N 102.5 (−10.2) Ntb 90.6 (−3.6) Smx 59 Cr | 3.9 | |||
| MCN | - | - | Cr 86.4 (93.7) I | - |
| I 66.9 (−1.5) [N 49.3] Cr | 1.5 | |||
| PMDS 1 | 5 | 2 | Cr 68.7 Smx 92.5 (1.8) SmA 110.5 (17.5) I | 2.4 |
| I 108.6 (−17.7) SmA 90.4 (−1) Smx 45.3 Cr | 2.5 | |||
| HP1 | 5 | 2 | Cr 107.1 Nx 182.9 (10.6) I | 32.8 |
| I 174.1 (−10.4) Nx 106.8 Cr | 29.6 | |||
| PCN | 5 | 0 | SA 164.9 (5.2) I | 9.5 |
| I 166.6 (−5.3) SA | 4.9 | |||
| CoP1 (M1: MCN = 1.2: 0.8) | 5 | 2 | N 141.39 (7.0) I | 34.5 |
| I 148.3 (−5.9) N | 38.6 |
| 2ϴ (°) | d-Value (Å) |
|---|---|
| 4.25 | 20.78 |
| 12.28 | 7.20 |
| 19.77 | 4.49 |
Disclaimer/Publisher’s Note: The statements, opinions and data contained in all publications are solely those of the individual author(s) and contributor(s) and not of MDPI and/or the editor(s). MDPI and/or the editor(s) disclaim responsibility for any injury to people or property resulting from any ideas, methods, instructions or products referred to in the content. |
© 2023 by the authors. Licensee MDPI, Basel, Switzerland. This article is an open access article distributed under the terms and conditions of the Creative Commons Attribution (CC BY) license (https://creativecommons.org/licenses/by/4.0/).
Share and Cite
Jiang, W.; Mehl, G.H. Design and Investigation of a Side-Chain Liquid Crystalline Polysiloxane with a Ntb-Phase-Forming Side Chain. Crystals 2023, 13, 1614. https://doi.org/10.3390/cryst13121614
Jiang W, Mehl GH. Design and Investigation of a Side-Chain Liquid Crystalline Polysiloxane with a Ntb-Phase-Forming Side Chain. Crystals. 2023; 13(12):1614. https://doi.org/10.3390/cryst13121614
Chicago/Turabian StyleJiang, Wanhe, and Georg H. Mehl. 2023. "Design and Investigation of a Side-Chain Liquid Crystalline Polysiloxane with a Ntb-Phase-Forming Side Chain" Crystals 13, no. 12: 1614. https://doi.org/10.3390/cryst13121614