
Microstructure, Dielectric Properties and Bond Characteristics of Lithium Aluminosilicate Glass-Ceramics with Various Li/Na Molar Ratio

Abstract
:1. Introduction
2. Experiments
2.1. Preparation of Glass-Ceramics
2.2. Structure Test
2.3. Performance Test
3. Results and Discussion
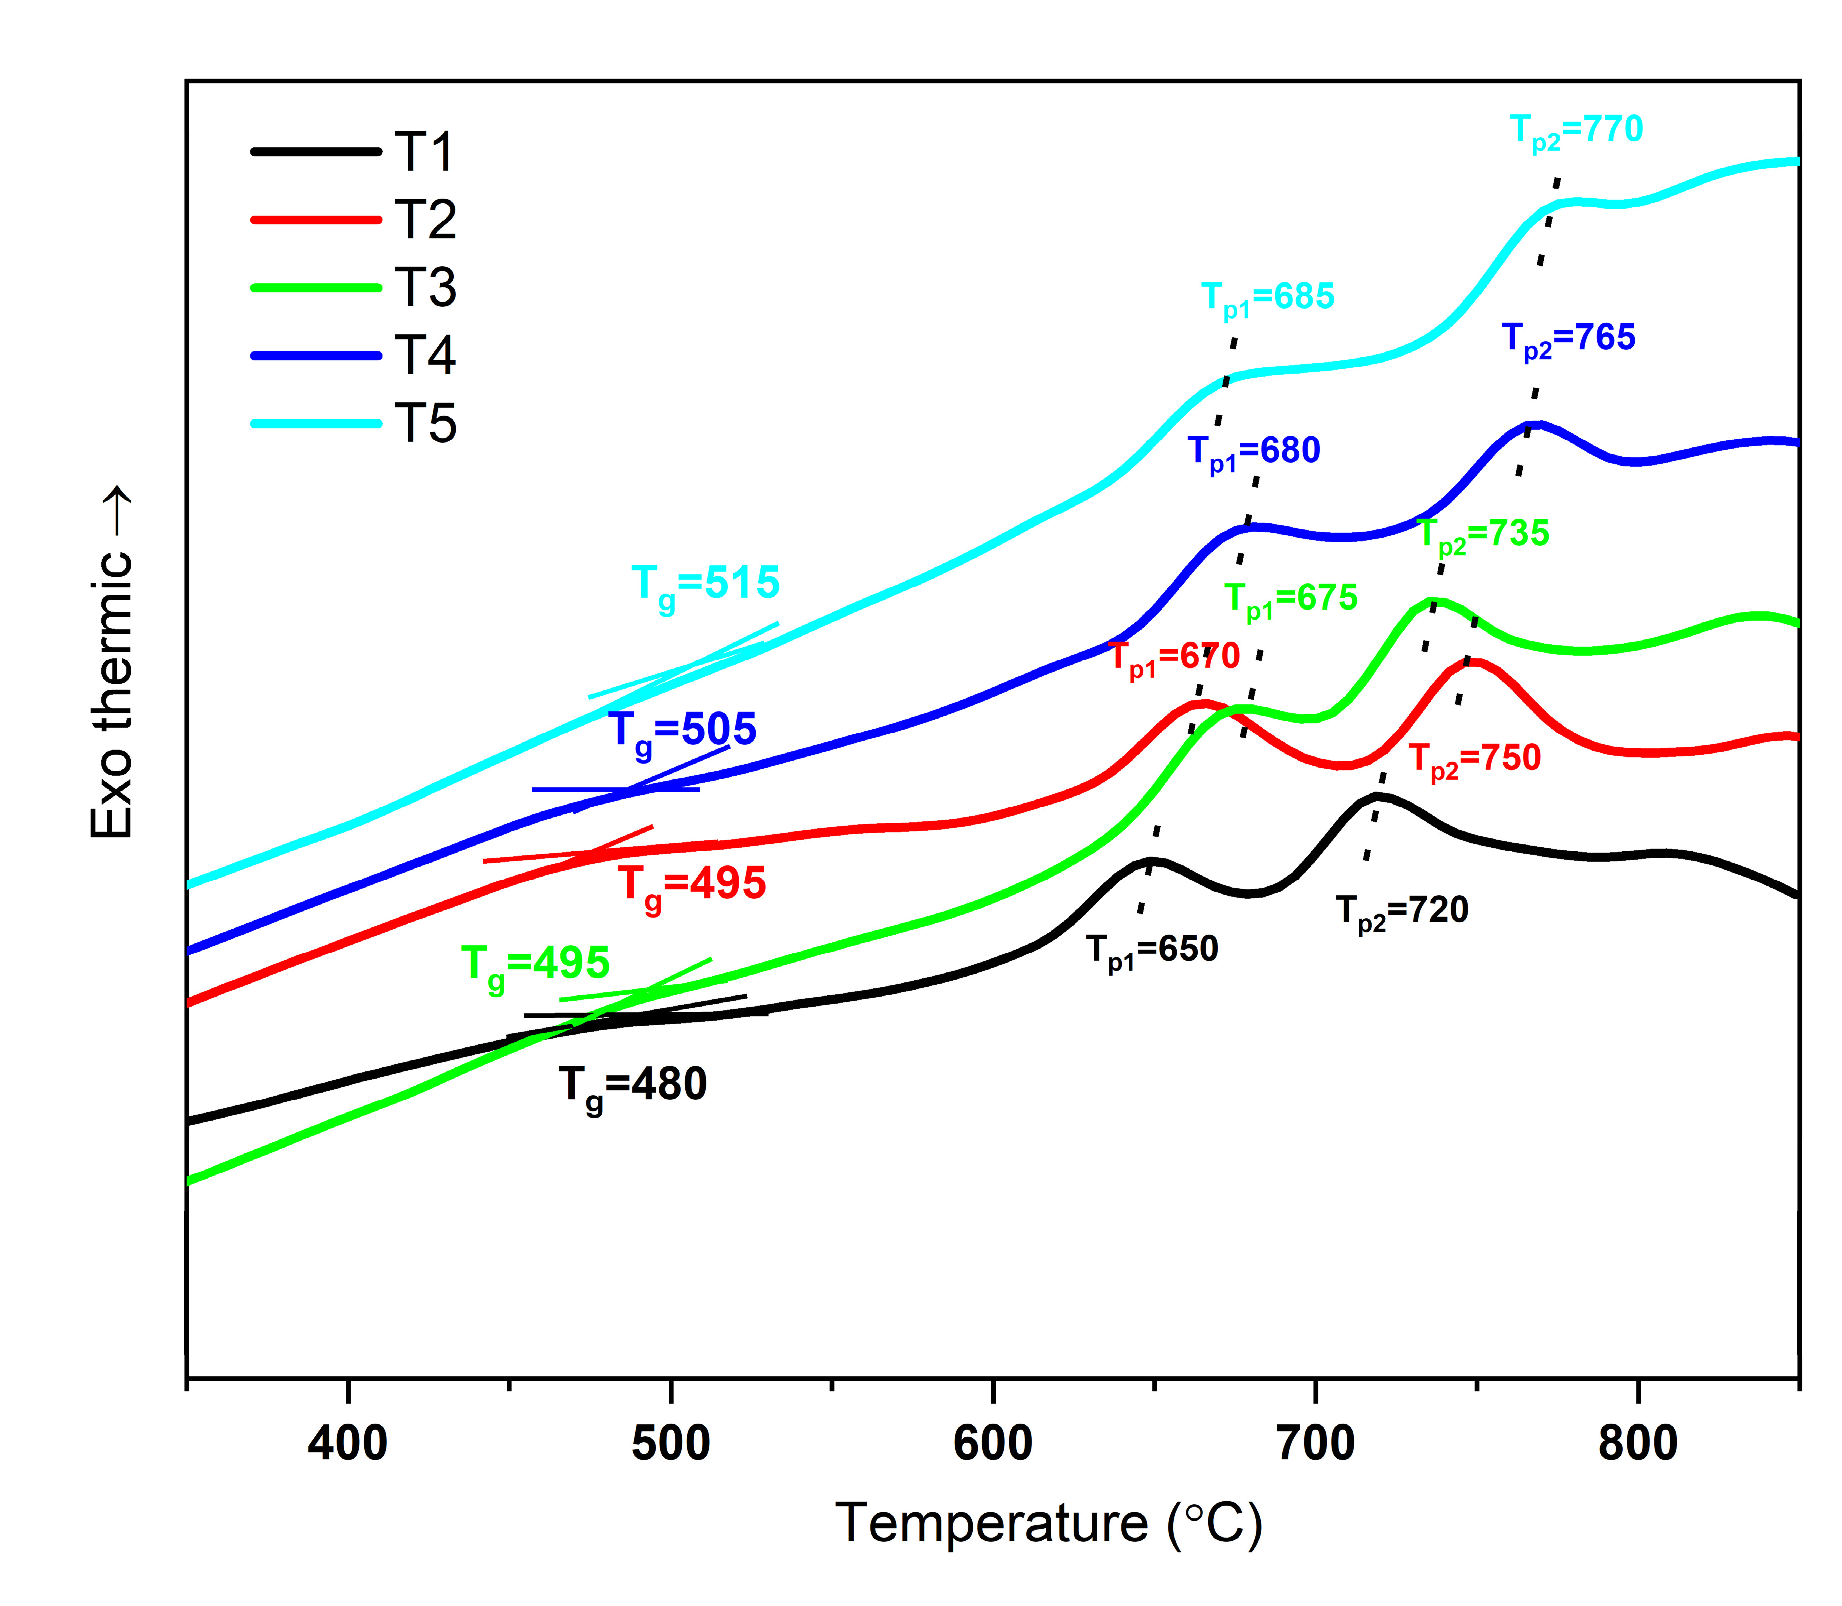
3.1. DSC
3.2. Infrared (IR) Spectrum Analysis
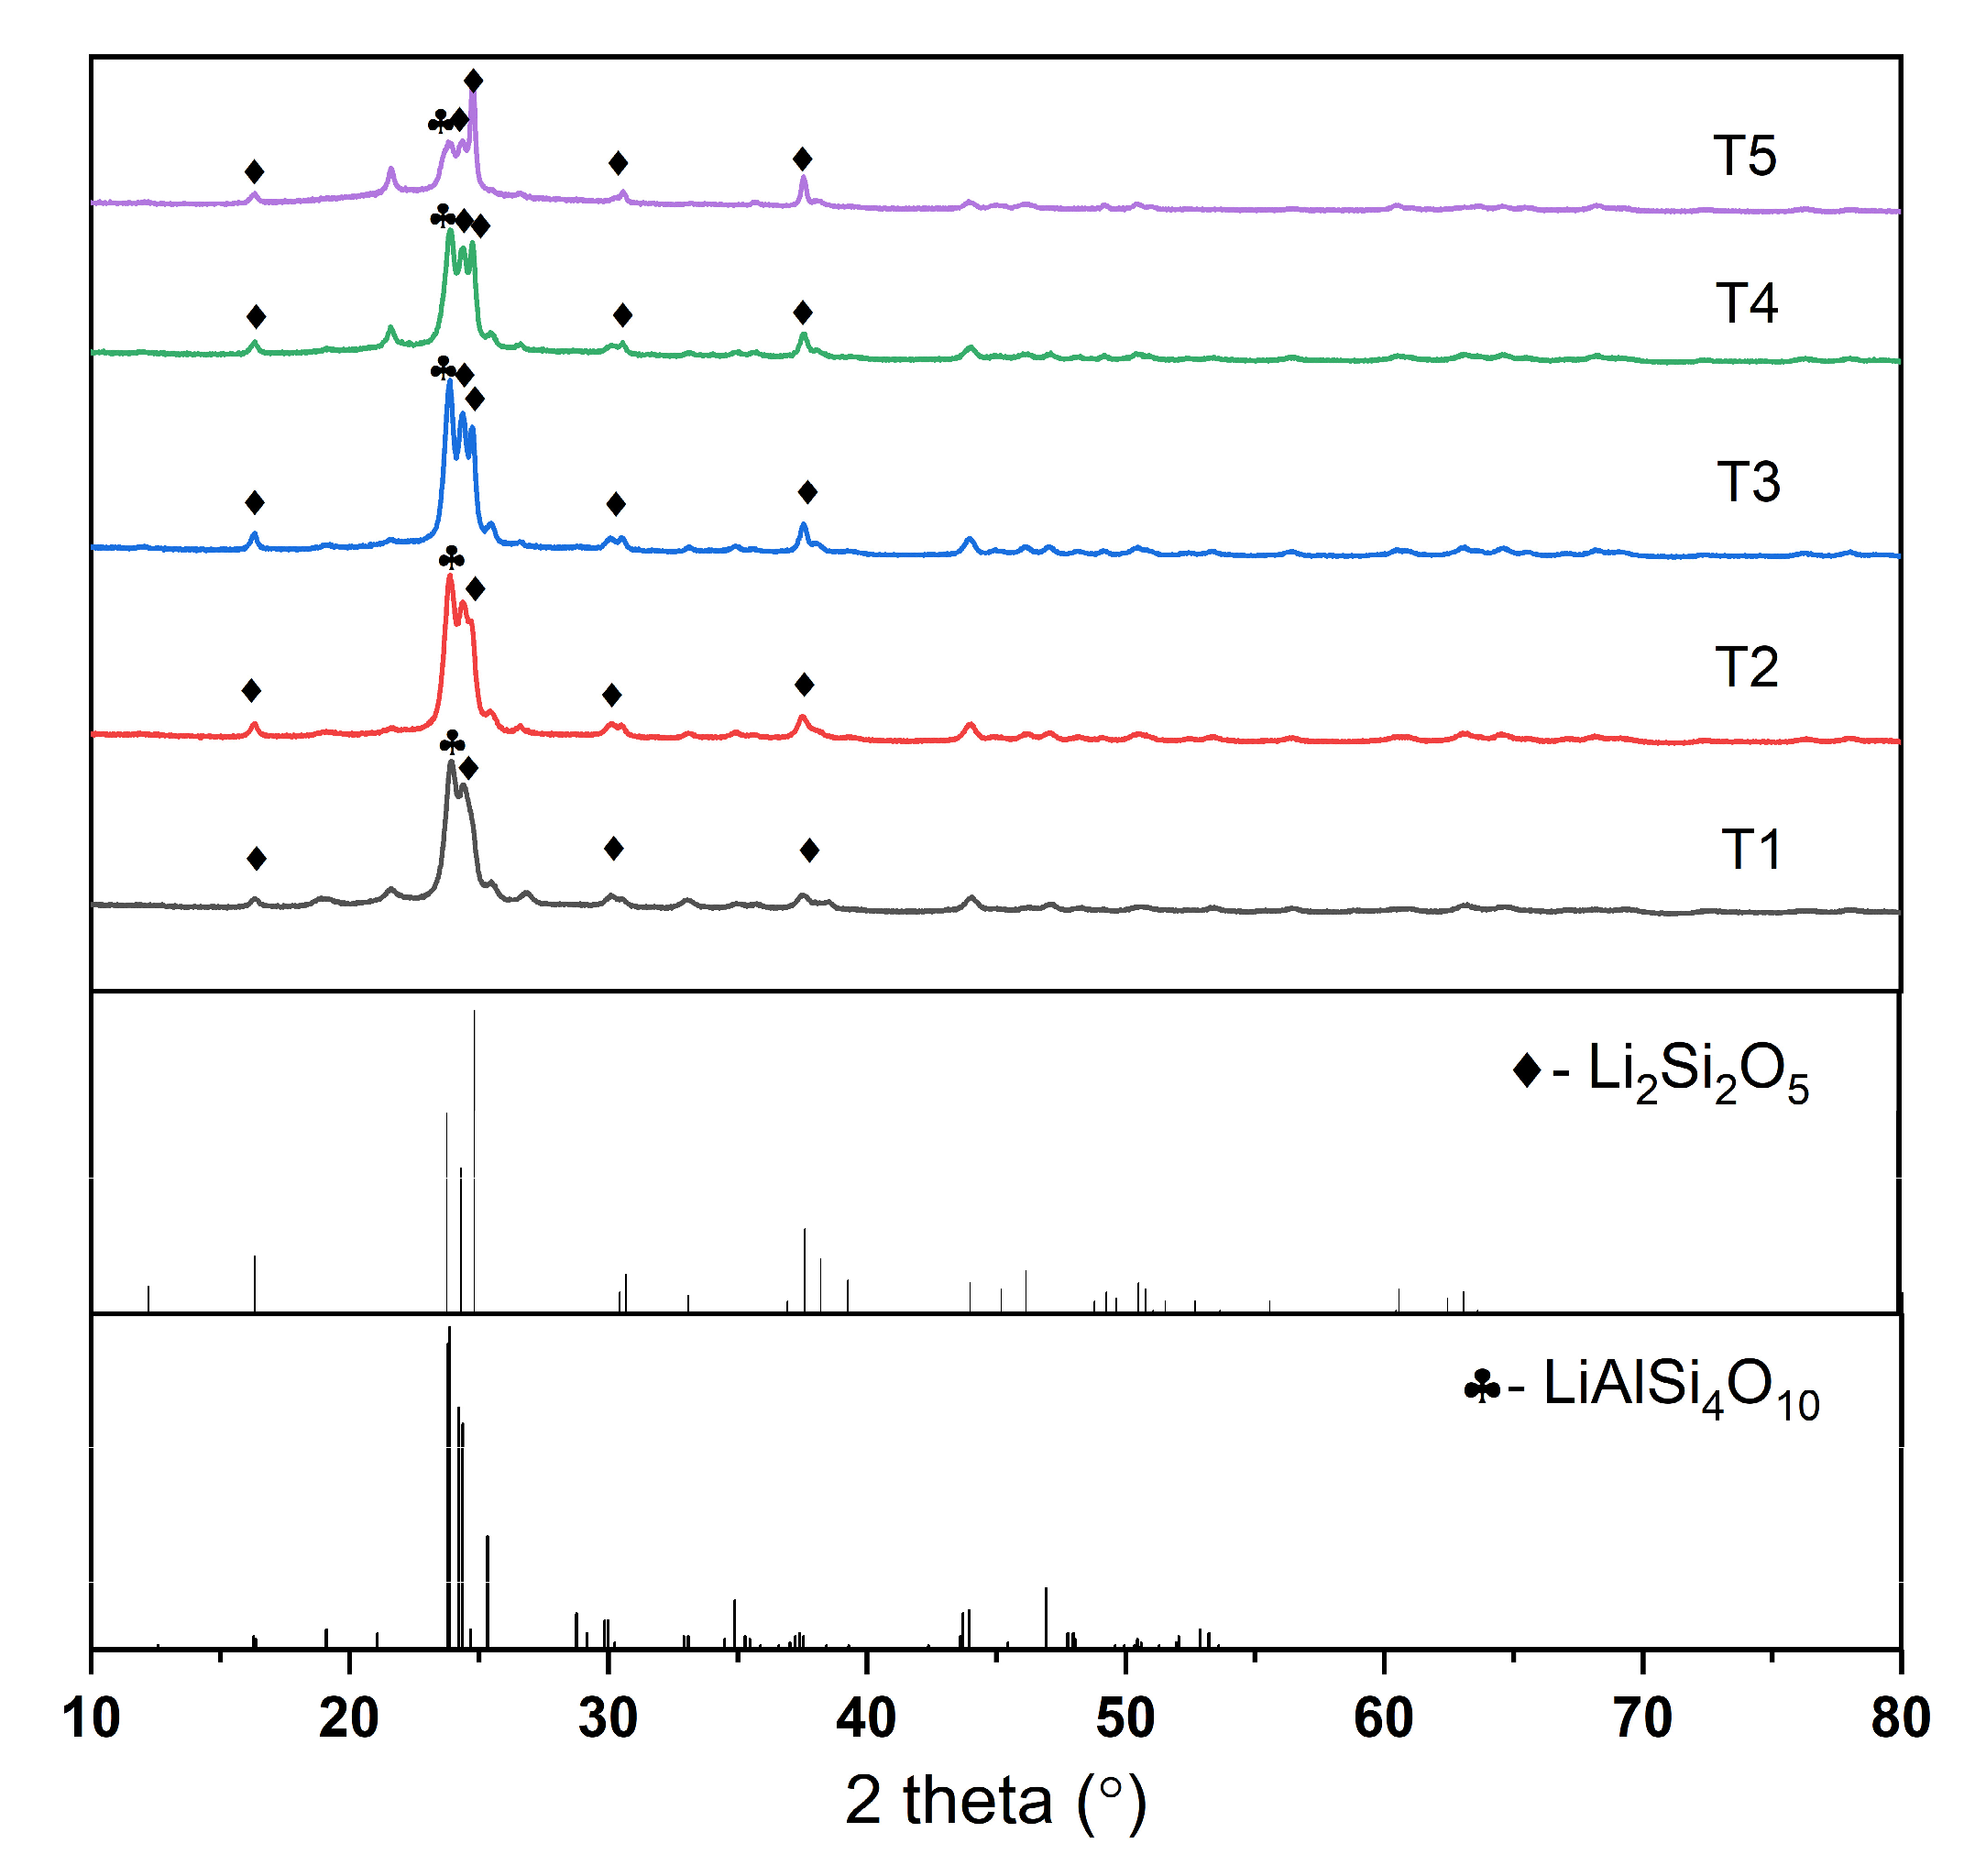
3.3. XRD
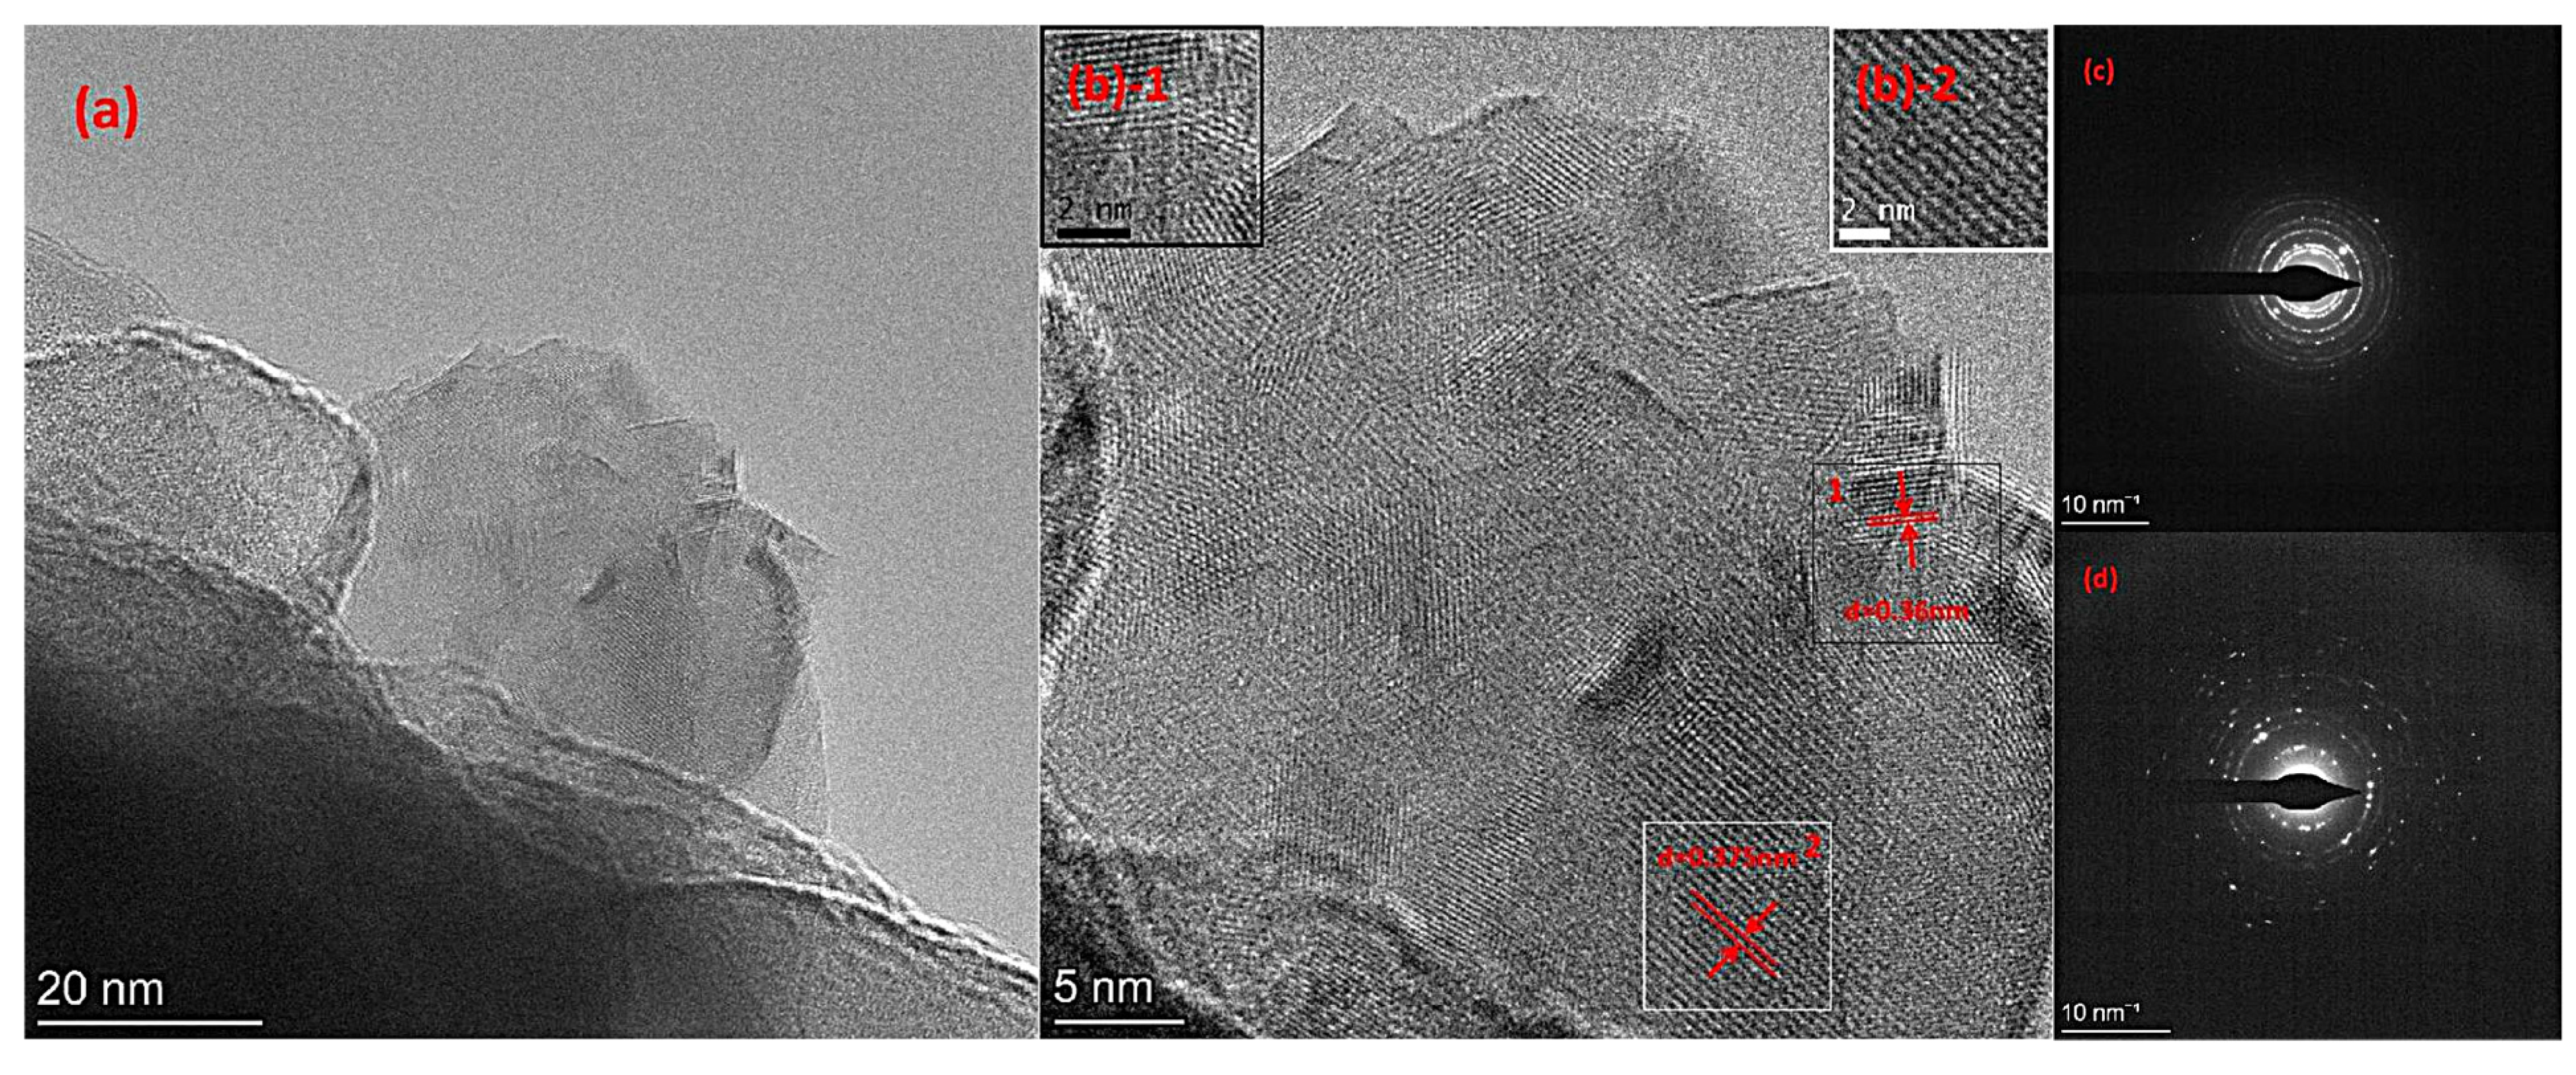
3.4. TEM
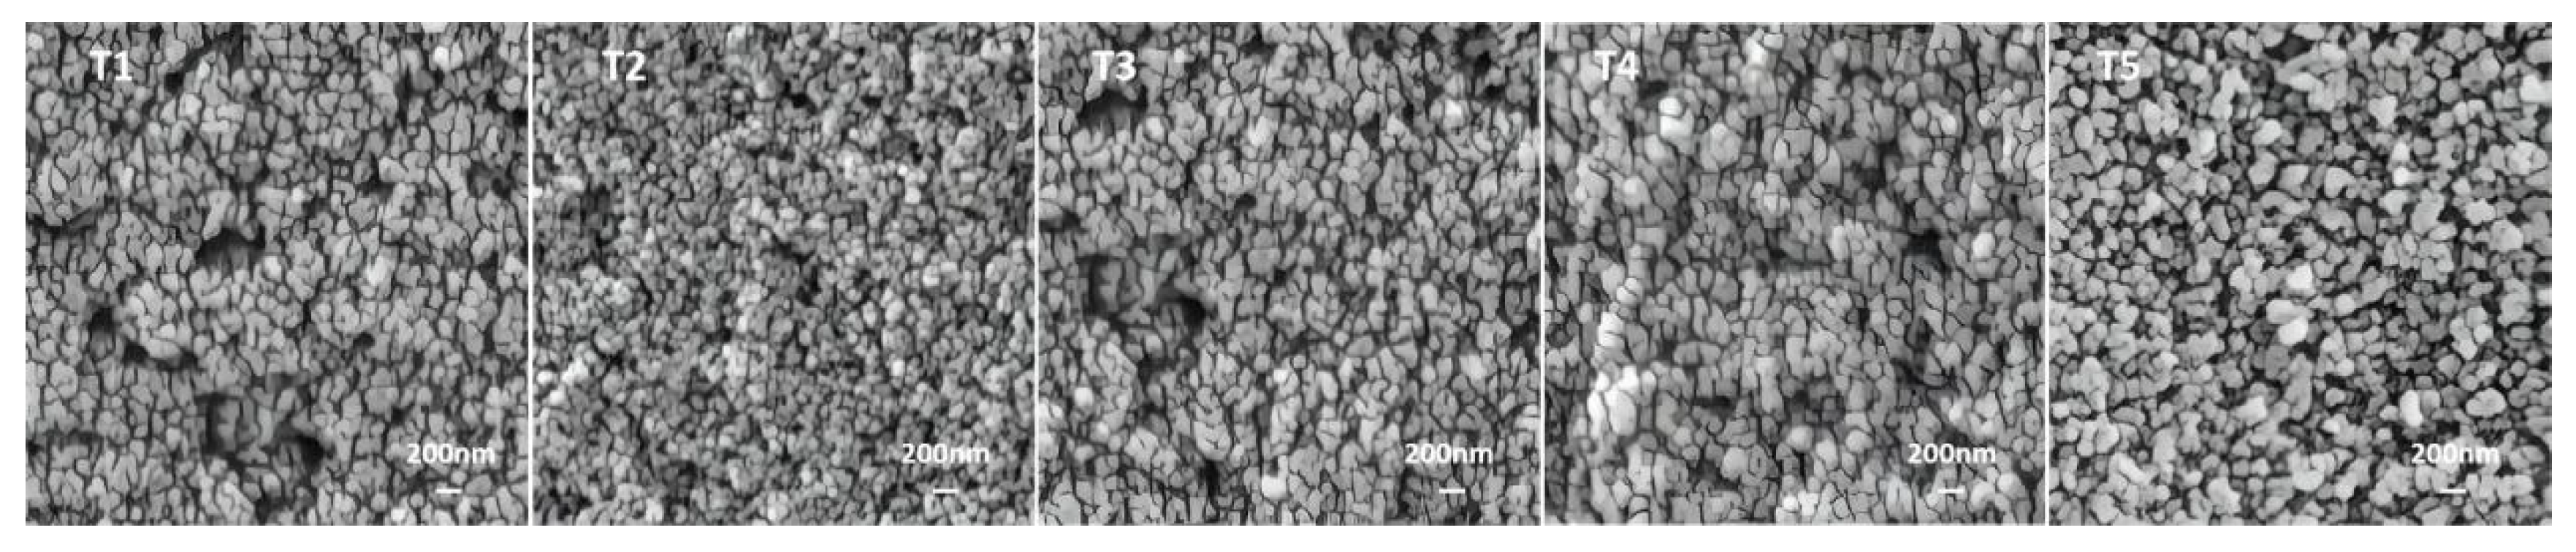
3.5. SEM
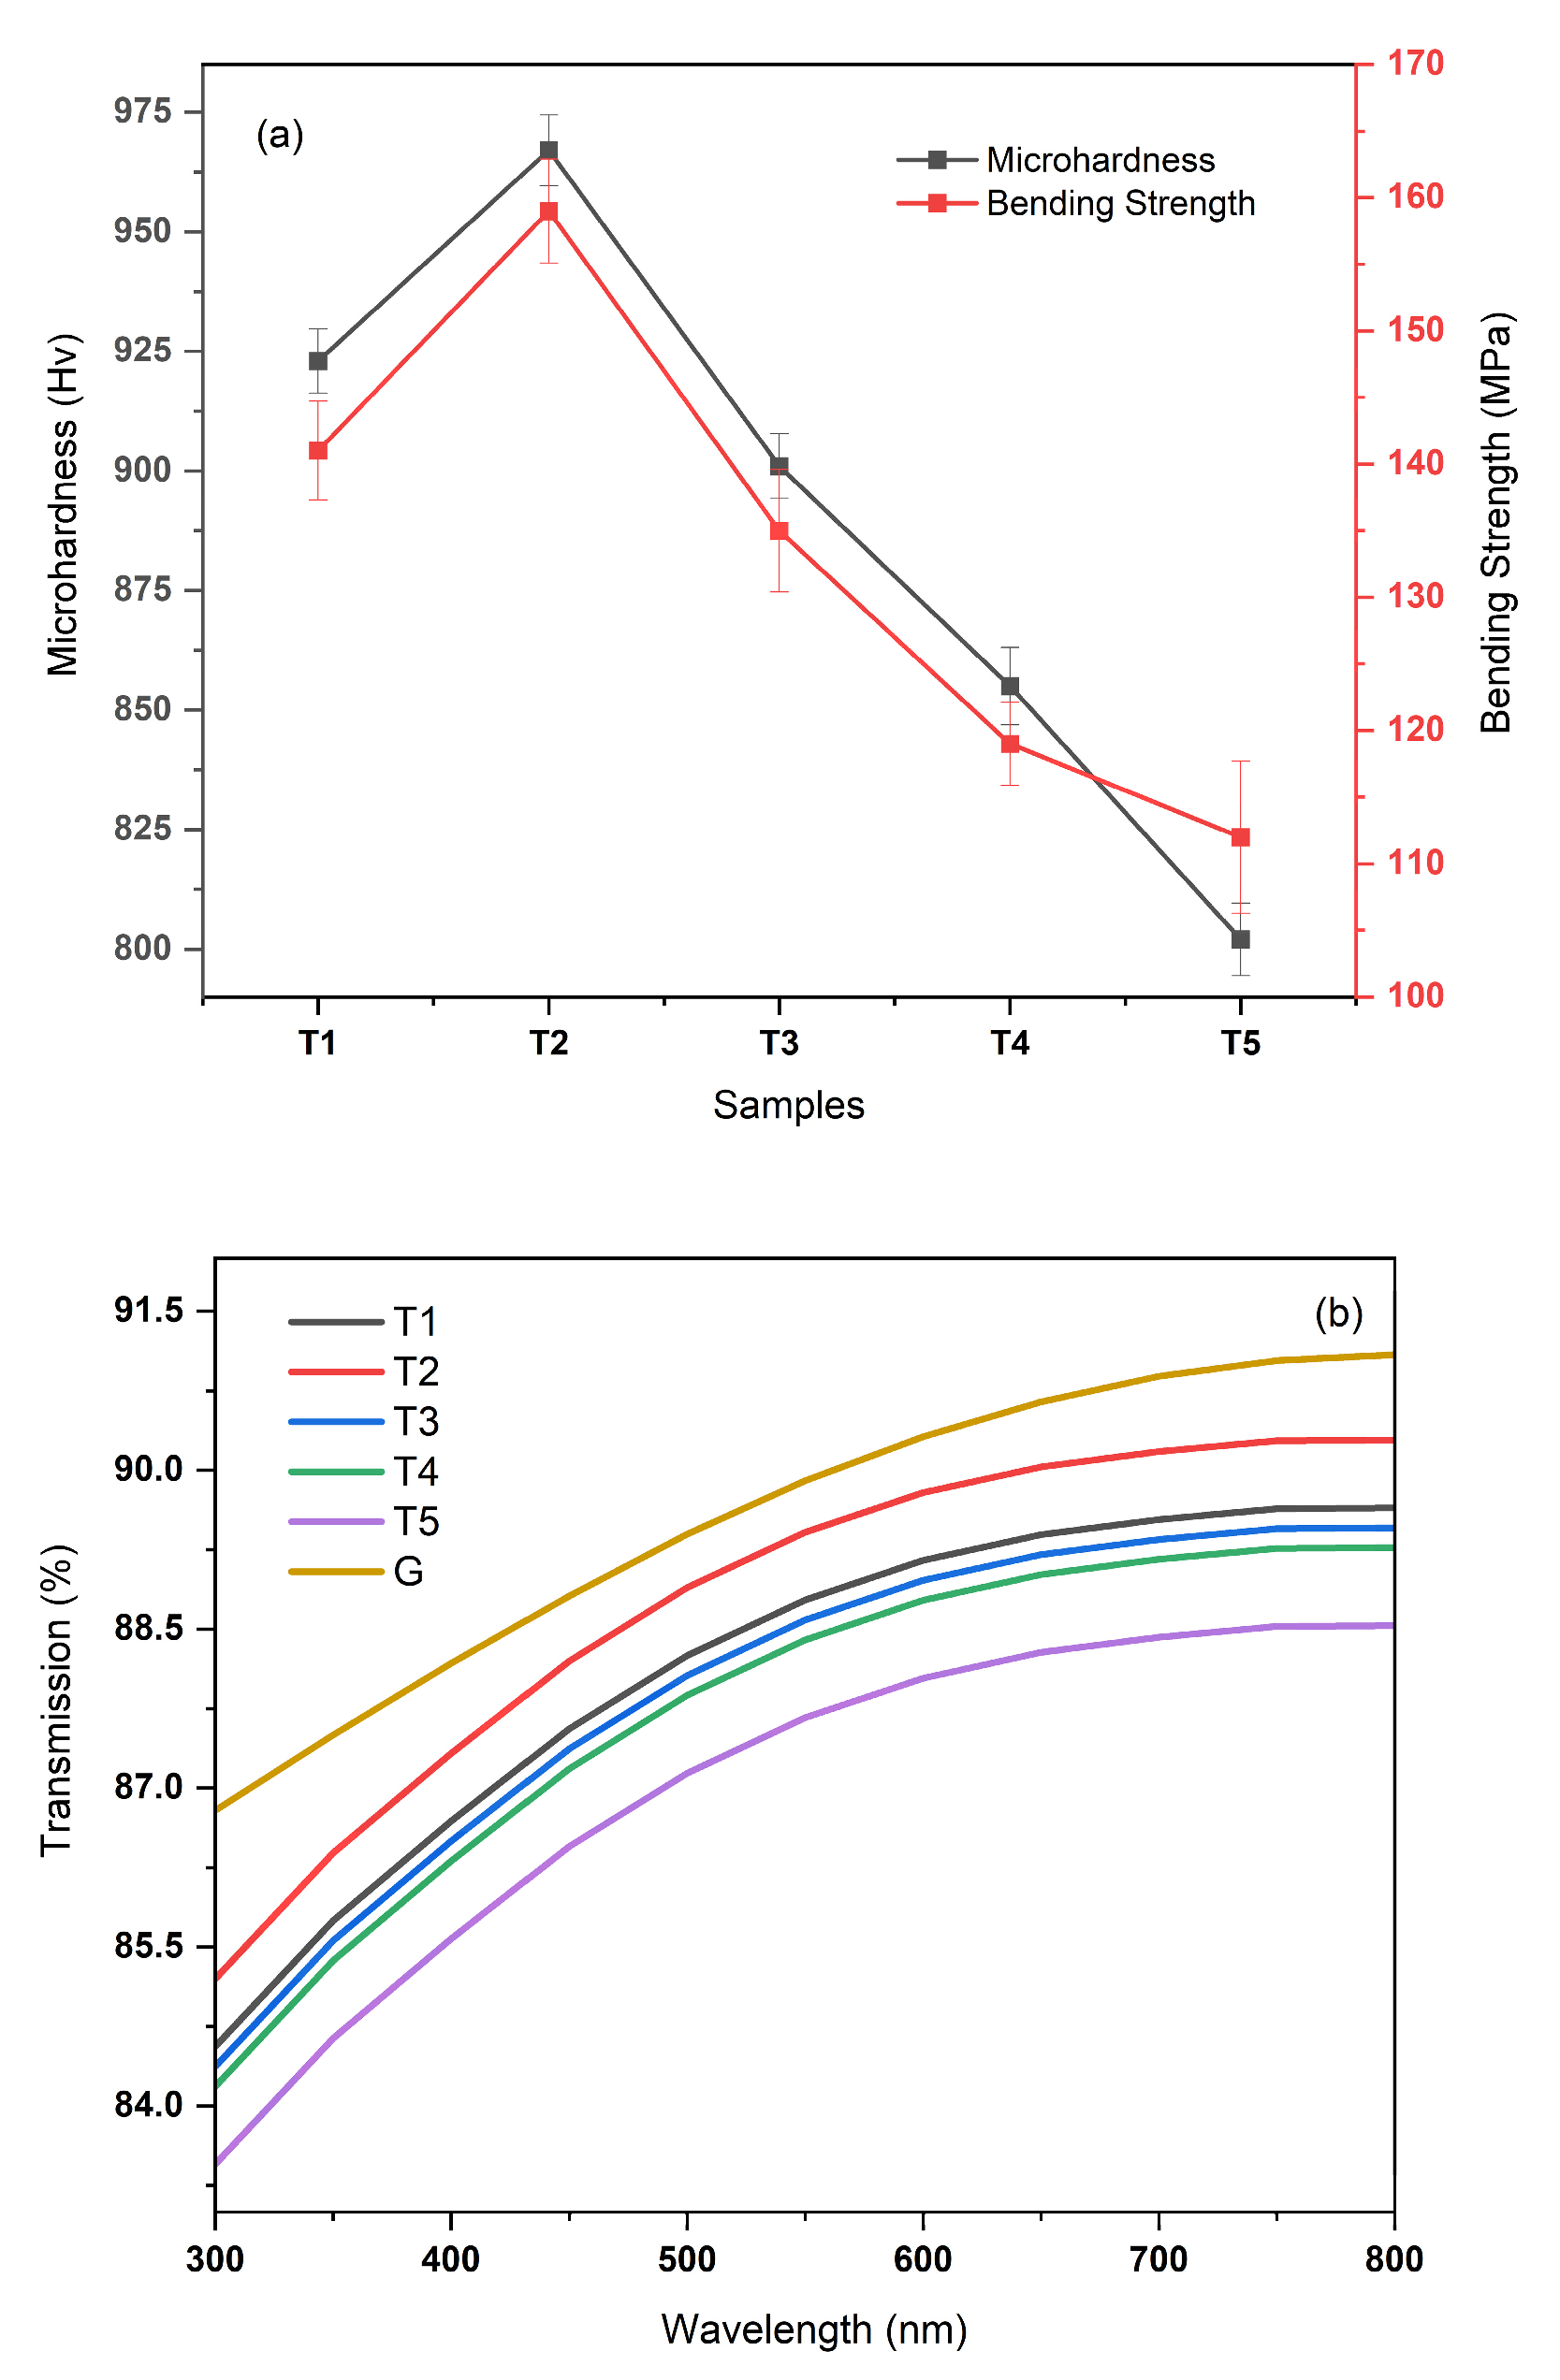
3.6. Mechanical Properties and Light Transmittance
4. Conclusions
Author Contributions
Funding
Data Availability Statement
Acknowledgments
Conflicts of Interest
References
- Liu, S.; Wang, J.; Ding, J.; Hao, H.; Zhao, L.; Xia, S. Crystallization, microstructure and dielectric properties of the SrO-BaO-Nb2O5-Al2O3-SiO2 based glass ceramics added with ZrO2. Ceram. Int. 2019, 45, 4003–4008. [Google Scholar] [CrossRef]
- Yoon, S.O.; Shim, S.H.; Kim, K.S.; Park, J.G.; Kim, S. Low-temperature preparation and microwave dielectric properties of ZBS glass–Al2O3 composites. Ceram. Int. 2009, 35, 1271–1275. [Google Scholar] [CrossRef]
- Chen, J.; Huanping, W.; Siqiao, F. Effects of CaSiO3 addition on sintering behavior and microwave dielectric properties of Al2O3 ceramics. Ceram. Int. 2011, 37, 989–993. [Google Scholar] [CrossRef]
- Fang, Y.; Li, L.; Xiao, Q.; Chen, X.M. Preparation and microwave dielectric properties of cristobalite ceramics. Ceram. Int. 2012, 38, 4511–4515. [Google Scholar] [CrossRef]
- Chen, G.; Liu, X. Sintering, crystallization and properties of MgO-Al2O3-SiO2 system glass-ceramics containing ZnO. J. Alloy. Compd. 2007, 431, 282–286. [Google Scholar] [CrossRef]
- Sohn, S.; Choi, S. Crystallization behavior in the glass system MgO-Al2O3-SiO2: Influence of CeO2 addition. J. Non-Cryst. Solids 2001, 282, 221–227. [Google Scholar] [CrossRef]
- Imanaka, Y. Multilayered Low Temperature Cofired Ceramics (LTCC) Technology; Springer Science + Business Media: New York, NY, USA, 2005. [Google Scholar]
- Zanotto, E.D. A bright future for glass-ceramics. Am. Ceram. Soc. Bull. Am. Ceram. Soc. 2010, 89, 19–27. [Google Scholar]
- Rödel, J.; Kounga, A.B.N.; Weissenberger-Eibl, M.; Koch, D.; Bierwisch, A.; Rossner, W.; Hoffmann, M.J.; Danzer, R.; Schneider, G. Development of a roadmap for advanced ceramics: 2010–2025. J. Eur. Ceram. Soc. 2009, 29, 1549–1560. [Google Scholar] [CrossRef]
- Arnault, L.; Rivière, A. Relaxation mechanisms and microstructure in glass and glass-ceramics. J. Alloys Compd. 2000, 310, 32–35. [Google Scholar] [CrossRef]
- Chen, G.; Ma, M.; Wei, A.; Liu, Z.; Zhang, F.; Mitchell, A.; Li, Y. The dielectric, thermal properties and crystallization mechanism of Li–Al—B–Si—O glass—Ceramic systems as a new ULTCC material. Ceram. Int. 2019, 45, 19689–19694. [Google Scholar] [CrossRef]
- Qing, Z. The effects of B2O3 on the microstructure and properties of lithium aluminosilicate glass-ceramics for LTCC applications. Mater. Lett. 2018, 212, 126–129. [Google Scholar] [CrossRef]
- Krasnikov, A.S.; Berezhnoi, A.I.; Krasnikova, M.D. Effect of ions with different radii on the properties of lithium aluminosilicate photosensitive devitrified glasses. Glass Ceram. 1998, 55, 106–110. [Google Scholar] [CrossRef]
- Savabieh, H.; Alizadeh, P.; Dasilva, Y.A.R.; Erni, R.; Clemens, F.J. Investigation of dielectric properties and microstructure of sintered 13·2Li2O-67·6SiO2-14·49Al2O3-3·3TiO2-0.4BaO-0.97ZnO glass-ceramics. J. Eur. Ceram. Soc. 2017, 37, 631–639. [Google Scholar] [CrossRef]
- Zhou, Z.Q.; He, F.; Shi, M.J.; Xie, J.; Wan, P.; Cao, D.H. Effect of Na2O Content on the Structure and Properties of LAS Glass-ceramics Prepared by Spodumene. J. Wuhan Univ. Technol.-Mat. Sci. Edit. 2022, 37, 794–800. [Google Scholar] [CrossRef]
- Shi, J.; He, F.; Xie, J.; Liu, X.; Yang, H. Effects of Na2O/BaO ratio on the structure and the physical properties of low-temperature glass-ceramic vitrified bonds. Ceram. Int. 2018, 44, 10871–10877. [Google Scholar] [CrossRef]
- Zhang, W.T.; He, F.; Xiao, Y.; Xie, M.Q.; Xie, J.L.; Sun, R.J.; Yang, H.; Luo, Z.H. Effects of Al/Na and Heat Treatment on the Structure and Properties of Glass Ceramics from Molten Blast Furnace Slag. Ceram. Int. 2019, 45, 13692–13700. [Google Scholar] [CrossRef]
- Li, W.C.; Wang, X.; Chen, H.Y.; Zhang, X.F.; Hu, L.L.; Chen, S.B. Influence of fluorine content on crystallization and mechanical properties of SiO2-Li2O glass-ceramics. Ceram. Int. 2023, 49, 29123–29132. [Google Scholar] [CrossRef]
- Ji, C.J.; Li, L.Y.; Gao, W.K.; Wang, J.; Han, J.J. Influence of Al2O3/SiO2 ratio in multicomponent LNAS glasses and glass-ceramics on the crystallization behavior, microstructure and mechanical performance. Ceram. Int. 2023, 49, 10652–10662. [Google Scholar] [CrossRef]
- Chen, M.; He, F.; Shi, J.; Xie, J.; Yang, H.; Wan, P. Low Li2O content study in Li2O-Al2O3-SiO2 glass-ceramics. J. Eur. Ceram. Soc. 2019, 39, 4988–4995. [Google Scholar] [CrossRef]
- Kucharczyk, S.; Sitarz, M.; Zajac, M.; Deja, J. The effect of CaO/SiO2 molar ratio of CaO-Al2O3-SiO2 glasses on their structure and reactivity in alkali activated system. Spectrochim. Acta Part A Mol. Biomol. Spectrosc. 2018, 194, 163–171. [Google Scholar] [CrossRef]
- Partyka, J.; Sitarz, M.; Leśniak, M.; Gasek, K.; Jeleń, P. The effect of SiO2/Al2O3 ratio on the structure and microstructure of the glazes from SiO2–Al2O3–CaO–MgO–Na2O–K2O system. Spectrochim. Acta Part A Mol. Biomol. Spectrosc. 2015, 134, 621–630. [Google Scholar] [CrossRef]
- Li, H.; Su, Y.; Li, L.Y.; Strachan, D.M. Raman spectroscopic study of gadolinium(III) in sodium-aluminoborosilicate glasses. J. Non. Cryst. Solids 2001, 292, 167–176. [Google Scholar] [CrossRef]
- Doweidar, H.; El-Damrawi, G.; Al-Zaibani, M. Distribution of species in Na2O–CaO–B2O3 glasses as probed by FTIR. Vib. Spectrosc. 2013, 68, 91–95. [Google Scholar] [CrossRef]
- Shi, J.; He, F.; Ye, C.; Hu, L.; Xie, J.; Yang, H.; Liu, X. Preparation and characterization of CaO–Al2O3–SiO2 glass-ceramics from molybdenum tailings. Mater. Chem. Phys. 2017, 197, 57–64. [Google Scholar] [CrossRef]
- Reddy, A.A.; Goel, A.; Tulyaganov, D.U.; Kapoor, S.; Pradeesh, K.; Pascual, M.J.; Ferreira, J.M.F. Study of calcium–magnesium–aluminum–silicate (CMAS) glass and glass-ceramic sealant for solid oxide fuel cells. J. Power Sources 2013, 231, 203–212. [Google Scholar] [CrossRef]
- Mukherjee, D.P.; Das, S.K. The influence of TiO2 content on the properties of glass ceramics: Crystallization, microstructure and hardness. Ceram. Int. 2014, 40, 4127–4134. [Google Scholar] [CrossRef]
- Arvind, A.; Kumar, R.; Deo, M.N.; Shrikhande, V.K.; Kothiyal, G.P. Preparation, structural and thermo-mechanical properties of lithium aluminum silicate glass–ceramics. Ceram. Int. 2009, 35, 1661–1666. [Google Scholar] [CrossRef]
- Li, Y.; Liang, K.; Cao, J.; Xu, B. Spectroscopy and structural state of V4+ ions in lithium aluminosilicate glass and glass–ceramics. J. Non. Cryst. Solids 2010, 356, 502–508. [Google Scholar] [CrossRef]
- Naskar, M.K.; Chatterjee, M. A novel process for the synthesis of lithium aluminum silicate powders from rice husk ash and other water-based precursor materials. Mater. Lett. 2005, 59, 998–1003. [Google Scholar] [CrossRef]
- Nevolina, L.A.; Shtenberg, M.V.; Zherebtsov, D.A.; Koroleva, O.N. Structure and crystallizability of K2O-B2O3-SiO2 and K2O-B2O3-GeO2 glasses: Effect of composition and heat treatment mode. Ceram. Int. 2023. [Google Scholar] [CrossRef]
- Li, M.H.; Dong, C.; Ma, Y.P.; Jiang, H. Light-Transmitting Lithium Aluminosilicate Glass-Ceramics with Excellent Mechanical Properties Based on Cluster Model Design. Nanomaterials 2023, 13, 530. [Google Scholar] [CrossRef]
- Vomacka, P.; Babushkin, O.; Warren, R. Zirconia as a nucleating agent in a yttria-alumina-silica glass. J. Eur. Ceram. Soc. 1995, 15, 1111–1117. [Google Scholar] [CrossRef]
- Du, J.; Jones, B.; Lanagan, M. Preparation and characterization of dielectric glass-ceramics in Na2O–PbO–Nb2O5–SiO2 system. Mater. Lett. 2005, 59, 2821–2826. [Google Scholar] [CrossRef]
- Chakrabarti, A.; Molla, A.R. BaBi2Ta2O9 based glass-ceramics: Influence of ZrO2 on crystallization kinetics, microstructure and dielectric properties. J. Alloy. Compd. 2019, 805, 247–257. [Google Scholar] [CrossRef]


| Formulation (wt.%) | SiO2 | Al2O3 | Li2O | Na2O | B2O3 | P2O5 | ZrO2 |
|---|---|---|---|---|---|---|---|
| T1 | 68.86 | 3.71 | 21.62 | 0.86 | 2.15 | 0.93 | 1.86 |
| T2 | 68.86 | 3.71 | 20.62 | 1.86 | 2.15 | 0.93 | 1.86 |
| T3 | 68.86 | 3.71 | 19.62 | 2.86 | 2.15 | 0.93 | 1.86 |
| T4 | 68.86 | 3.71 | 18.62 | 3.86 | 2.15 | 0.93 | 1.86 |
| T5 | 68.86 | 3.71 | 17.62 | 4.86 | 2.15 | 0.93 | 1.86 |
| Recipes | T1 | T2 | T3 | T4 | T5 |
|---|---|---|---|---|---|
| Tg | 480 | 490 | 495 | 505 | 515 |
| Tx1 | 605 | 625 | 640 | 645 | 648 |
| Tp1 | 650 | 670 | 675 | 680 | 685 |
| Tx2 | 690 | 710 | 705 | 735 | 745 |
| Tp2 | 720 | 750 | 735 | 765 | 775 |
| Sample | Li2Si2O5 (%) | LiAlSi4O10 (%) | Crystallinity |
|---|---|---|---|
| T1 | 81.7 | 18.1 | 85.1% |
| T2 | 80.1 | 19.6 | 91.5% |
| T3 | 82.6 | 16.9 | 78.2% |
| T4 | 84.7 | 15.1 | 73.8% |
| T5 | 87.5 | 12.2 | 70.9% |
Disclaimer/Publisher’s Note: The statements, opinions and data contained in all publications are solely those of the individual author(s) and contributor(s) and not of MDPI and/or the editor(s). MDPI and/or the editor(s) disclaim responsibility for any injury to people or property resulting from any ideas, methods, instructions or products referred to in the content. |
© 2023 by the authors. Licensee MDPI, Basel, Switzerland. This article is an open access article distributed under the terms and conditions of the Creative Commons Attribution (CC BY) license (https://creativecommons.org/licenses/by/4.0/).
Share and Cite
Li, M.; Kong, L.; Wang, W.; Ma, Y.; Jiang, H. Microstructure, Dielectric Properties and Bond Characteristics of Lithium Aluminosilicate Glass-Ceramics with Various Li/Na Molar Ratio. Crystals 2023, 13, 1647. https://doi.org/10.3390/cryst13121647
Li M, Kong L, Wang W, Ma Y, Jiang H. Microstructure, Dielectric Properties and Bond Characteristics of Lithium Aluminosilicate Glass-Ceramics with Various Li/Na Molar Ratio. Crystals. 2023; 13(12):1647. https://doi.org/10.3390/cryst13121647
Chicago/Turabian StyleLi, Minghan, Lingqi Kong, Wenzhi Wang, Yanping Ma, and Hong Jiang. 2023. "Microstructure, Dielectric Properties and Bond Characteristics of Lithium Aluminosilicate Glass-Ceramics with Various Li/Na Molar Ratio" Crystals 13, no. 12: 1647. https://doi.org/10.3390/cryst13121647