Article

High-Temperature Crystal Chemistry of Meta-Autunite Group Minerals: Metatorbernite, Cu(UO2)2(PO4)2(H2O)8 and Metazeunerite, Cu(UO2)2(AsO4)2(H2O)8

by
Evgeny V. Nazarchuk
1,
Vladislav V. Gurzhiy
1,*,
Yana G. Tagirova
1,
Dmitri O. Charkin
2,
Maria G. Krzhizhanovskaya
1,
Anatoly V. Kasatkin
3 and
Oleg V. Eremin
4
1
Department of Crystallography, Saint-Petersburg State University, University Emb. 7/9, St. Petersburg 199034, Russia
2
Department of Chemistry, Moscow State University, Vorobievy Gory 1, bd. 3, Moscow 119991, Russia
3
Fersman Mineralogical Museum of the Russian Academy of Sciences, Leninskiy pr. 18, 2, Moscow 119071, Russia
4
Institute of Natural Resources, Ecology and Cryology, Siberian Branch, Russian Academy of Sciences, Nedorezova str. 16a, Chita 672014, Russia
*
Author to whom correspondence should be addressed.
Crystals 2023, 13(12), 1688; https://doi.org/10.3390/cryst13121688
Submission received: 16 November 2023 / Revised: 3 December 2023 / Accepted: 13 December 2023 / Published: 15 December 2023
(This article belongs to the Section Mineralogical Crystallography and Biomineralization)

Abstract

:
Thermal expansion of metatorbernite, Cu(UO2)2(PO4)2(H2O)8 (1), and metazeunerite, Cu(UO2)2(AsO4)2(H2O)8 (2), has been investigated using single-crystal and powder X-ray diffraction. Both minerals are prone to dehydration, which proceeds already at ambient conditions. According to the single-crystal XRD data, 1 is stable up to 300(50) K, while 2 is stable up to 250(50) K. Powder XRD studies at various temperatures suggest that 1 dehydrates in three stages at ca. 353, 373, and 483 K, while 2 in two stages at ca. 283 and 543 K. Calculation of the main coefficients of thermal expansion reveals strong anisotropy. The expansion is maximal in the direction normal to the autunite-type layers. This correlates with the anisotropy in thermal evolution of Cu–O bond lengths and differences in the thermal behavior of PO4 and AsO4 tetrahedra.

1. Introduction

Secondary uranium minerals of the meta-autunite group, M[(UO2)2(TO4)2]·(8–12)H2O (M = K, Na, NH4, H3O, Ba, Ca, Co, Cu, Fe2+, Mg, Mn2+, Ni, Zn; T = As or P) [1] are formed at various stages of oxidation of uranium deposit areas [2]. Some of them are of particular interest being present in amounts essential for industrial processing [3]. Due to the particularly low solubility in neutral solutions and omnipresence of phosphorus sources, uranyl phosphates are considered to play a very essential role in uranium migration both in geological media and in the environment of spent nuclear fuel (SNF) deposits [4]. For instance, in Finland and Sweden, SNF is packed into sealed copper vessels which slowly oxidize under ambient conditions; reaction with SNF leads to the formation, among others, of torbernite-like compounds [5,6].
By now, the meta-autunite group contains 21 mineral species whereof the most common are meta-autunite, metatorbernite, metazeunerite and their partially dehydrated derivatives [7]. These minerals generally form as well-faceted square platelets up to 1 mm in size. Unfortunately, these are generally not suitable for X-ray studies due to twinning and damage caused by metamict decay as well as by de- and rehydration processes. Structure investigation of meta-autunite group minerals was performed in four tetragonal, two monoclinic, and one triclinic space groups, most of which are subgroups of the P4/nmm which corresponds to the highest (archetypic) symmetry. All these structures belong to the same motif, wherein each uranium polyhedra (tetragonal bipyramid) shares equatorial vertices with four TO4 (T = P, As) polyhedra arranged in a checkerboard manner, thus forming autunite-like layers; H2O molecules and cations are sandwiched in the interstices. The subtle structural differences, reflected in symmetry breaking from the archetypic P4/nmm, are due to variations in the arrangement and site occupancies of the interstitial species (metal cations and H2O molecules), and rotations of U- and P- (or As-) centered polyhedra around the axes perpendicular to the autunite-type layers.
The “basic” structural models for the meta-autunite group minerals are those of autunite, Ca(UO2)2(PO4)2(H2O)10-12 [8], and meta-autunite, Ca(UO2)2(PO4)2(H2O)6 [9]. The structure of metatorbernite was initially solved in P4/nmm with the unit cell parameters of a = 6.95, and c = 17.26 Å [9]; unfortunately, this model provided unrealistic anisotropic thermal parameters for oxygen atoms (R1 = 4.1%). Later, the space group and cell parameters were reconsidered several times. Ross et al. [10] and later Stergiou et al. [11] refined the structure in a similar unit cell (a = 6.969, c = 17.306 Å, R1 = 5.6%), but in another tetragonal P4/n space group. Based on IR spectroscopy data, Calos and Kennard [12] suggested a twice smaller unit cell (a = 6.950(1), c = 8.638(4) Å), and refined the structure in the P4/nmm space group to R1 = 9.2%. In 2003, Locock and Burns [13] studied a synthetic analog of metatorbernite and demonstrated that the structure could be successfully refined both in P4/nmm and in P4/n, but finally chose in favor of the latter space group. Recent studies using synchrotron radiation indicated that this structure could be refined both in P4/n and in P4/ncc [14].
A similar diversity is observed for the structural model of metazeunerite. Its crystal structure was initially refined by Hanic [15] in the P42/nmc space group with R1 = 14.8%. Hennig et al. [16] refined it in P4/ncc, (c = 17.420(1) Å) and P4/nmm (c = 8.710(1) Å). Locock and Burns [13] suggested P4/n with a = 7.1094(1) and c = 17.416(1) Å.
These controversies most likely occur from the fact that the hydration state of the mineral under study is variable and not always well known exactly for a given sample under conditions of current study; as previously noted, the variations in the arrangement of interlayer species, including H2O molecules, subtle as they are, may affect the overall symmetry. For instance, torbernite, Cu(UO2)2(PO4)2(H2O)12, partially converts to metatorbernite, Cu(UO2)2(PO4)2(H2O)8, already at ambient conditions [17]. This fact is also confirmed by our studies, since most of the examined samples from the private and museum collections were actually dehydrated meta-forms regardless of what was indicated on the label. Thus, the water content is by no means constant and strongly depends on storage temperature, overall pressure, relative humidity, etc. [18]. The mineral may partially effloresce even upon mild heating by the incident X-ray beam [19]. Moreover, thermal analysis results are expected to differ for specimens taken from different deposits and localities, since metatorbernite samples from different sources could also exhibit different patterns of cation/H2O distribution in the interlayer space [14]. This creates essential difficulties and uncertainties upon determination of not only the structural details, but also the thermal behavior and calculation of thermodynamic parameters for the minerals of the meta-autunite group. The latter data are essentialfor better understanding the genesis of some uranium deposits and prediction of uranium migration from natural and technogenic sources [4].
The differences in hydration states and overall interlayer arrangements are very well illustrated by the controversies in the published data on thermal behavior of various samples of the same minerals and their synthetic analogs. Upon thermal studies of metatorbernite, Frost et al. [20] observed four stages of mass loss at 295, 411, 428, and 564 K (the values are recalculated from °C given in the original paper) which they correlated to dehydration processes and stepwise release of 1.5, 4.5 and 2 H2O molecules per formula unit (pfu). Above 564 K, the named compound is anhydrous. According to the DTA studies by Pozas-Tormo et al. [21], metatorbernite dehydrates in four stages at 348, 383, 416, and 510 K, releasing 3 H2O molecule pfu between 298 and 353 K, five between 353 and 423 K, and two between 423 and 573 K. Studies by Ambartsumyan et al. [22] and Cejka et al. [23] revealed endothermic events at nearly coinciding temperatures of 393, 423, and 528 K, and 406, 445, and 538 K, respectively.
Studies of synthetic metatorbernite crystals [24,25] revealed three steps of H2O loss: four molecule pfu below 393 K, two between 393 and 423 K, and another two between 423 and 723 K, corresponding to full dehydration. Further heating resulted in the formation of copper pyrophosphate and uranium oxide.
Similar contradictions also exist for metazeunerite. Frost et al. [17] recorded five dehydration stages at 321, 361, 398, 1155, and 1186 K. The first three correspond to the release of 2, 4, and 2 H2O molecule pfu, while the two latter stages may involve loss of arsenic and formation of anhydrous Cu[(UO2)(AsO4)]2. Vochten et al. [25] conducted their TGA studies in air stream and reported four dehydration steps for a synthetic analog with formation of Cu(UO2)2(AsO4)2(H2O)7 (at 381 K), Cu(UO2)2(AsO4)2(H2O)3 (403 K), Cu(UO2)2(AsO4)2(H2O)2.5 (458 K), and Cu(UO2)2(AsO4)2 (503 K). Chernorukov et al. [26] noticed that between 323 and 473 K, metazeunerite releases H2O molecules in several steps at 333, 355, 381, 401, and 453 K.
Despite the detailed character of the aforementioned thermal studies of metatorbernite and metazeunerite, these data differ very essentially between each other; their thermal expansion was not addressed at all. Within the current study, we performed a combined single-crystal (SCXRD) and powder (PXRD) X-ray diffraction study to investigate the thermal expansion of these minerals, determine the components of the thermal expansion tensor, and to explain these observations based on atomic coordinates, bond distances, and angles. In a course of single-crystal studies, general attention was paid to the temperature intervals below the first dehydration stage where an H2O content of the samples under study is more or less constant. Above the first dehydration step, the crystals lost their integrity and the acquired data became uninterpretable. PXRD studies were conducted also at higher temperatures, in order to register the dehydration events.

2. Materials and Methods

2.1. Samples and Occurrence

The crystals of metatorbernite (1) were collected at the Old Gunnislake Mine, Clitters United Mines, Gunnislake, Calstock, Cornwall, England, UK. The crystals of metazeunerite (2) were collected at the Weißer Hirsch Mine, Neustädtel, Schneeberg, Erzgebirgskreis, Saxony, Germany (2a), and from Melekhinskaya Sopka, Sherlovaya Gora Deposit, Borzinsky District, Zabaykalsky Krai, Russian Federation [27] (2b). In the selected samples, metatorbernite associates mainly with meta-autunite, uraninite and cuprite. Metazeunerite in sample 2a associates with trögerite, uranospinite and walpurgite, and sample 2b is formed along cracks of quartz–topaz greisen with ferberite.

2.2. Chemical Composition

The semi-quantitative chemical analyses of 1 and 2 were carried out with a Hitachi FlexSEM 1000 scanning electron microscope (Tokyo, Japan) equipped with an EDS Xplore Contact 30 detector and Oxford AZtecLive STD system of analysis (Oxford, UK). Analytical conditions were as follows: accelerating voltage 20 kV and beam current 5 nA. The following standards and X-ray lines were used: Cu—Cu, Kα; Si—SiO2, Kα; P—NdP5O14, Kα; As—GaAs, Lα; U—UO2, Mβ.
In sample 1, only Cu, U and P were determined by EDS with a ratio 0.89:2.11:1.99; no admixture of As was found. In samples 2a and 2b, in turn, a small admixture of P was detected: the Cu, U, As, P ratios were 0.88:2.04:1.81:0.23 and 0.96:1.99:1.97:0.06, respectively.

2.3. Single-Crystal X-ray Diffraction Studies

Single-crystal X-ray diffraction (SCXRD) data of 1 and 2a were collected using a Rigaku XtaLAB Synergy-S diffractometer (Tokyo, Japan) [28] equipped with a PhotonJet-S detector operating with MoKα radiation at 50 kV and 1 mA. A single crystal was chosen and more than a hemisphere of data collected with a frame width of 0.5° in ω, and 3 s spent counting for each frame. The data were integrated and corrected for absorption, applying a multi-scan-type model using the Rigaku Oxford Diffraction programs CrysAlisPro (Tokyo, Japan) [29].
The same crystals of 1 and 2a were used in the temperature range of 100–300 K, using the Oxford Cryostream 800 system (Oxford, UK). The structures were successfully refined with the use of the SHELX software package [30]. Crystallographic data collected at 100 K are provided in Table 1. Supplementary crystallographic data were deposited in the Inorganic Crystal Structure Database (ICSD) and can be obtained by quoting CSD 2307946-2307947 via www.ccdc.cam.ac.uk/structures (accessed on 1 October 2023).
The effect of thermal motion on the bond length values from SCXRD experiments [31] was taken into account. Corrections for all bonds in the studied compounds were calculated by using a formula for the rigid-body motion:
L 2 = l 0 2 + 3 8 π 2 ( B e q A 2 B e q A 1 )
where L and l0 are corrected and observed A1A2 bond lengths, respectively; Beq(A1) and Beq(A2) are equivalent temperature factors of A1 (cation, i.e., Cu or S) and A2 (anion, i.e., O or Cl) atoms, respectively.
As noted above, two unit cell versions have been proposed for metatorbernite and metazeunerite with c~8.6 or 17 Å (double the first value), with the structures solved either in P4/nmm or in one of its subgroups. Structure solutions for synthetic analogs of metatorbernite and metazeunerite [13] were performed in P4/n using a [010/100/001] twin matrix. In fact, the structure of 1 can be considered as an alternation of autunite-like layers and layers formed by copper-centered polyhedra (vide infra). In the highest-symmetrical (P4/nmm) unit cell, two copper sublayers are repeated (Figure 1a); the unique copper site is assumed to be half occupied. In the lower-symmetrical (P4/n) structure, the copper cations and vacancies comprise two sites of twice lower occupancy (compared to the previous case) which are ordered (one fully occupied, one vacant) and shifted in the next layer in a staggered order to the former (Figure 1b). Therefore, the inter-autunite-layer contents in these structures exhibit different topologies. The projections of the U and T cations in the autunite-like layers onto representations of the P4/nmm and P4/n space groups are given in Figure 1c,d; the U and T cation positions are fixed irrespective of the space group choice. In the meantime, the positions of the copper and oxygen atoms are affected (Figure 1e,f). In the archetypic P4/nmm case, the copper atoms are located both at the planes and on the fourfold axes, while those of oxygen atoms are fixed at the symmetry planes. In the less symmetrical P4/n, the copper atoms reside only on the fourfold axes (the on-plane site is vacant). Overall, there exist two sites which could accommodate copper cations whereof only one is occupied in each of the two layers in P4/n solution.
Locock and Burns [13] pointed out that the introduction of twin matrices essentially affected the structure solution of synthetic analogs, permitted a double decrease in R1 and resolved the problem of high residual electron density. We attempted to refine the structures of 1 and 2a based on natural samples in all space groups hitherto reported for the meta-autunite group minerals; the best results were obtained for P4/nmm and P4/n. However, we were unable to attain R1 values below 11% in P4/n, and the residual density peaks’ values were too high (5.550/−4.720 e/Å3). Applying the twin matrix suggested by Locock and Burns [13] did not improve the solution. The solution in P4/n with a doubled cell parameter c (~17 Å) with the introduction of the [100/001/0-10] twin matrix resulted in the disappearance of residual density; yet, the search for higher symmetry using PLATON [32] indicated a likely space group, P4/ncc. Attempted refinement in the P4/ncc group resulted in non-realistic anisotropic thermal parameters of Cu and O (mostly non-positive definite). Therefore, we consider the solution in P4/nmm in the smaller unit cell, described above, as the most reliable. The reconstructed reciprocal space of 1 (Figure 1g,h) contains some additional reflections in (0kl)* planes; these extra spots are either artifacts or consequences of the started dehydration processes.

2.4. Powder X-ray Diffraction Studies at Non-Ambient Temperatures

Crystalline samples of 1, 2a and 2b were ground in an agate mortar and prepared from heptane suspension on a Pt strip (20 × 12 × 2 mm3) for the in situ examination using a Rigaku Ultima IV powder X-ray diffractometer (PXRD, CuKα radiation; 40 kV/30 mA; Bragg-Brentano geometry; PSD D-Tex Ultra detector; Rigaku, Tokyo, Japan). A Rigaku R-300 chamber was used for data collection under vacuum within a range of 100–573 K with T steps of 10 K. A Rigaku SHT-1500 chamber (Rigaku, Tokyo, Japan) was used for data collection in air within a range of 293–673 K with T steps of 10 K. The heating rate was 2 K/min. The collection time at each temperature step was about 30 min. The zero-shift parameter was refined at every step, and it was usually increased by 0.01–0.02° 2θ because of the sample holder expansion upon heating. Phases were identified using the ICDD PDF-2 Database (release 2019; Newtown Square, PA 19073, USA).
Several runs were performed to statistically confirm the obtained data. The unit cell parameters at different temperatures were calculated at every temperature step with the Rietveld method using the TOPAS program [33]. The ThetaToTensor program [34] was applied for the determination of the main coefficients of the thermal expansion tensor using a linear approximation of temperature dependences for the unit cell parameters, as well as for the determination of the principal axes of the thermal expansion tensor orientation.

2.5. Thermodynamic Calculations

The equilibrium states of 1 and 2 under heating and atmospheric pressure were calculated in the Selector software package, based on minimizing the Gibbs energies of multicomponent multiphase systems [35]. Thermodynamic data for a variety of possible components are taken from reference books [36,37,38].

3. Results

3.1. Crystal Structure Description

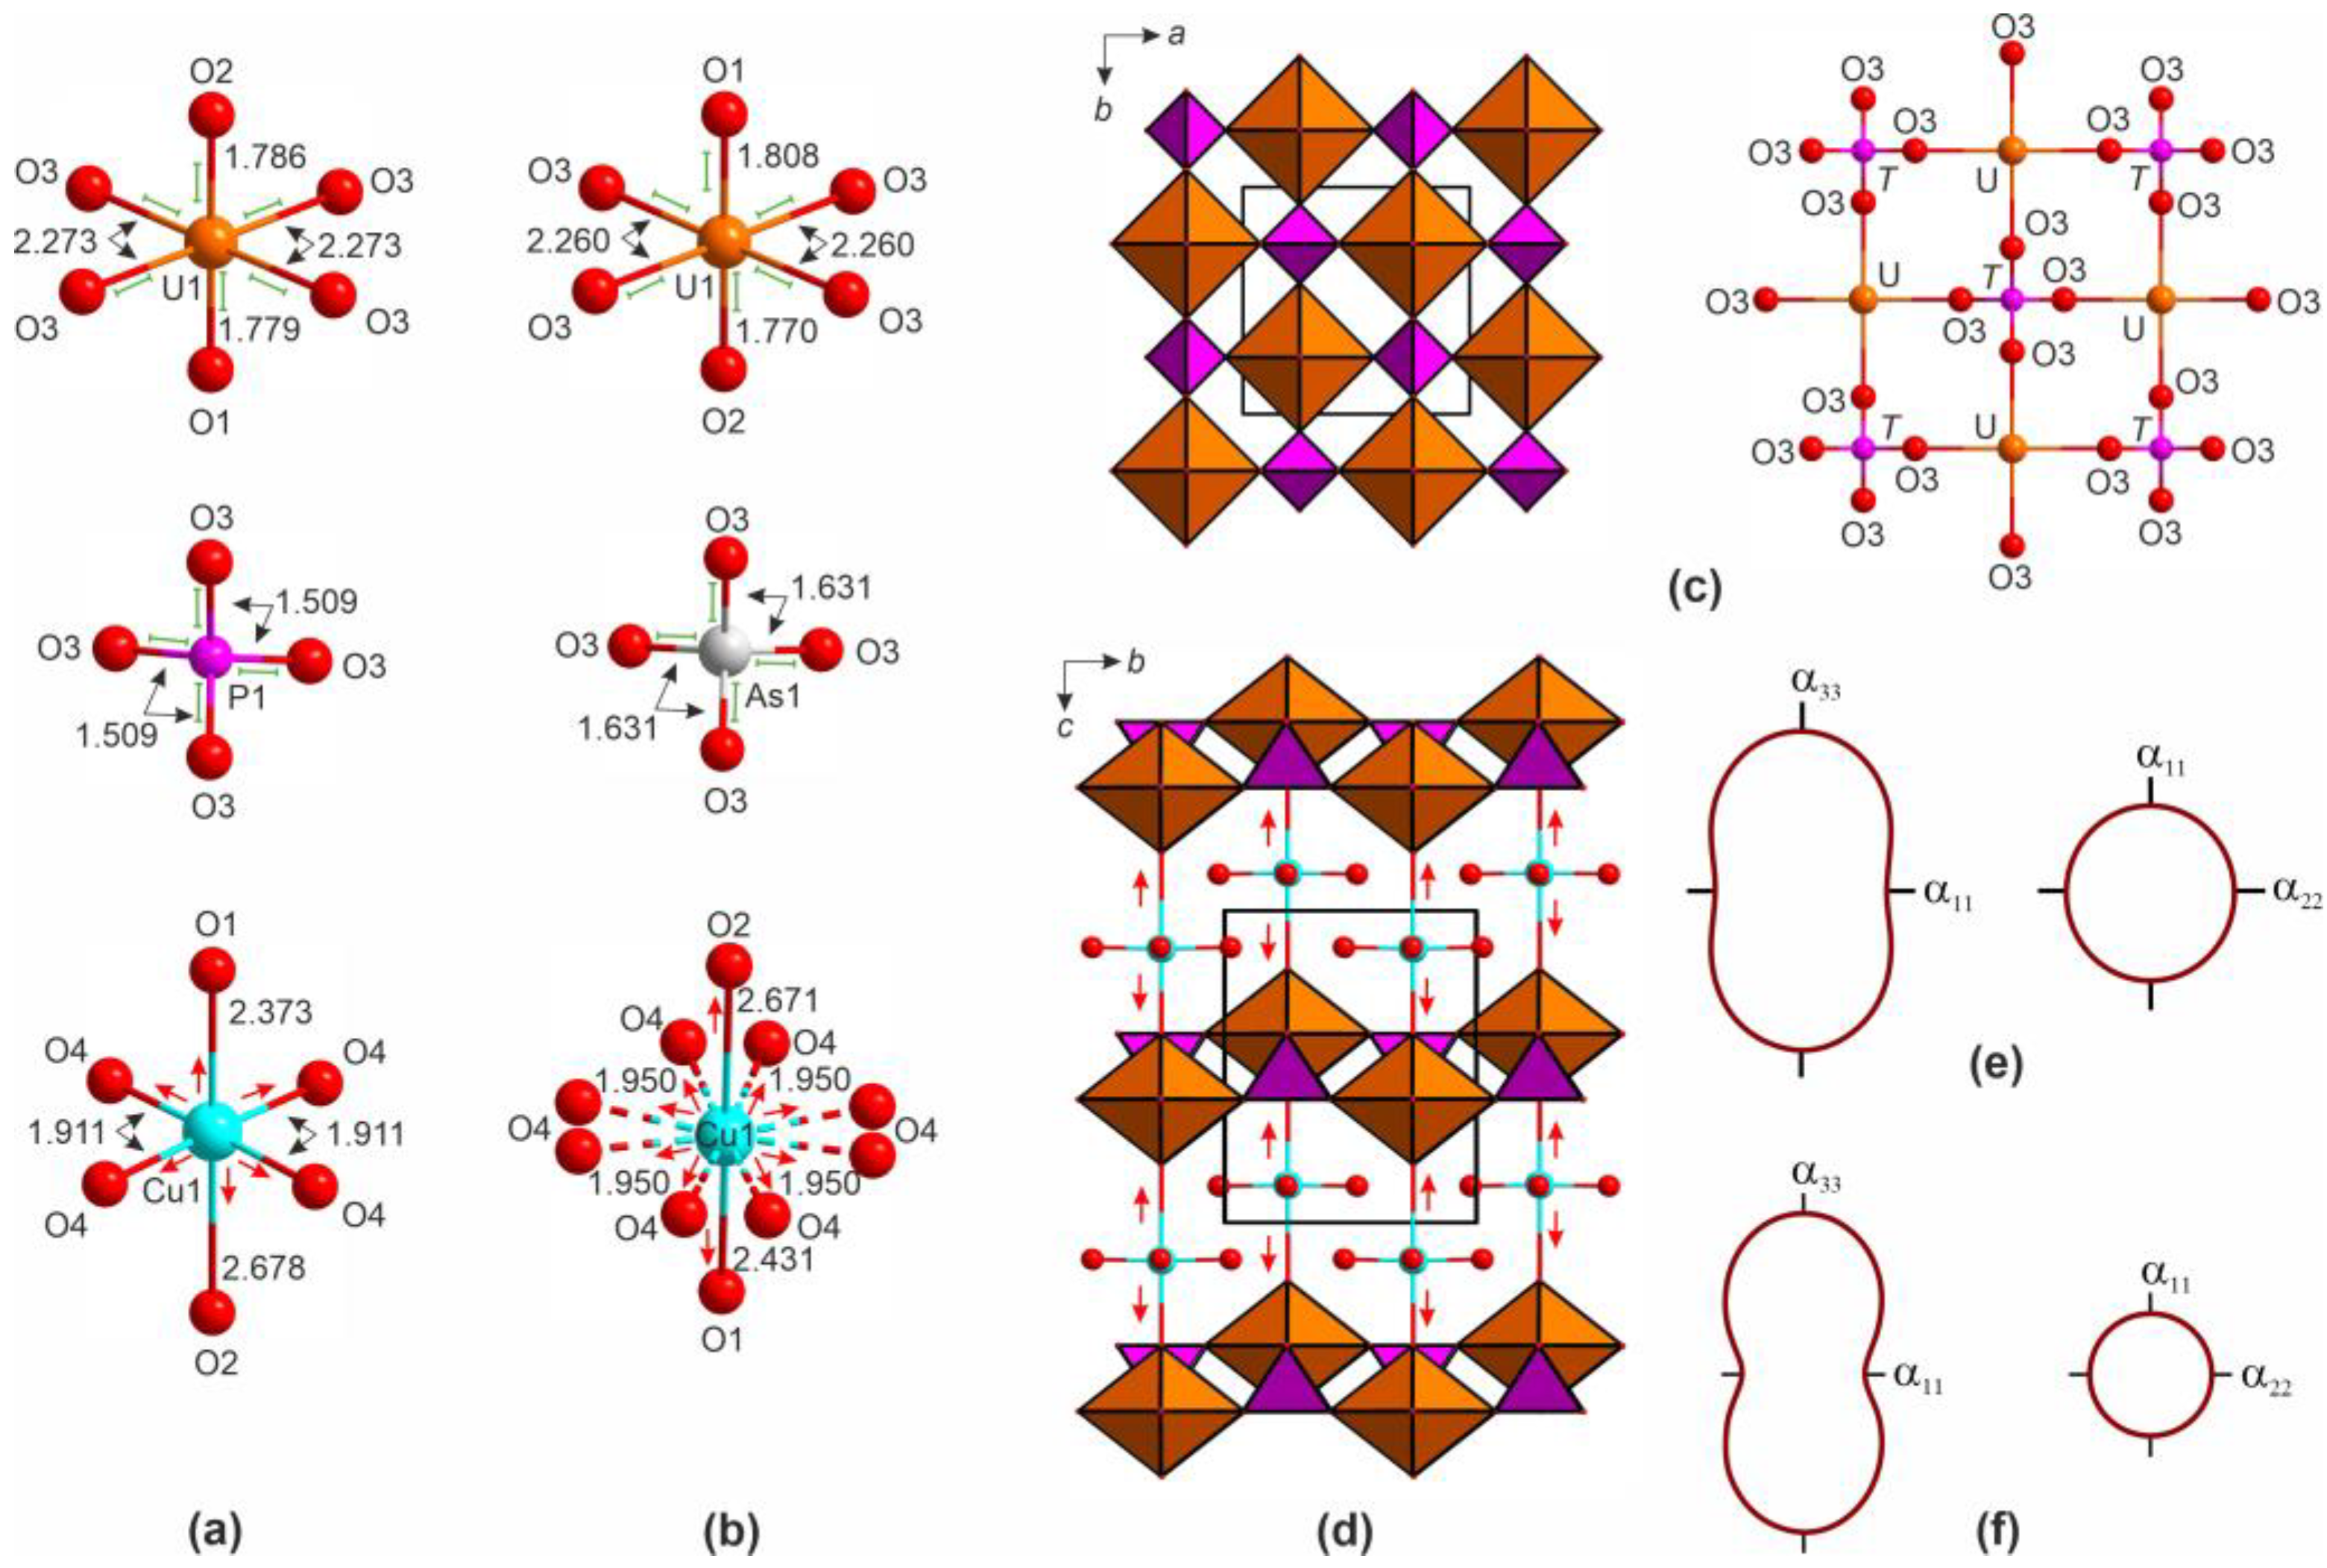
In the crystal structures of 1 and 2, the single crystallographically non-equivalent U atom forms a typical uranyl cation (<U–OUr> = 1.782 and 1.789 Å, respectively) which is coordinated, in the equatorial plane, via four O atoms (<U–Oeq> = 2.273 and 2.260 Å) (Figure 2a,b). One symmetrically independent T atom (T = P, As) is tetrahedrally coordinated with <T–O> = 1.509 and 1.631 Å for PO4 and AsO4, respectively. The Cu atom is coordinated by six ligands, forming a distorted octahedron (4 + 2), due to the pronounced Jahn–Teller effect [39]. Each [CuO2(H2O)4] octahedron has two long (<Cu–O> = 2.525 and 2.551 Å) and four short (<Cu–H2O> = 1.911 and 1.950 Å) bonds. In the structure of 2, O sites in the equatorial plane of the CuO6 are split (Figure 2b). The bond valence sums, calculated using the parameters from [40], correlate well with the formal valences of the atoms.
In the structures of 1 and 2 (Figure 2c), UO6 polyhedra share vertices with the TO4 (T = P, As) tetrahedra to form corrugated autunite-type [(UO2)2(TO4)2]2− layers originally described by Beintema [8]. The Cu sites are located in between the uranyl phosphate 2D complexes, so that [CuO2(H2O)4] polyhedra link the autunite-type layers into the framework structure (Figure 2d).

3.2. Thermal Behavior of Metatorbernite and Metazeunerite Crystal Structures

The structures of 1 and 2 expand along all directions upon heating from 100 to 300 K, but most strongly along c (Figure 3a,b). The thermal dependences of the unit cell parameters can be correctly approximated by the following linear fits (where T is temperature). For metatorbernite, a = 6.9506 + 0.57 × 10⁻⁴ T, c = 8.606 + 1.31 × 10⁻⁴ T, and V = 415.77 + 132 × 10−4 T. For metazeunerite, a = 7.0818 + 0.66 × 10⁻⁴ T, c = 8.6576 + 2.11 × 10⁻⁴ T, and V = 434.19 + 188 × 10−4 T. The thermal expansion of 1 and 2 is strongly anisotropic (Figure 2e,f), and the principal coefficients are α11 = 8(2), α33 = 15(6), αV = 32(8) × 10−6 K−1 for 1 and α11 = 9(2), α33 = 24(2), and αV = 43(7) × 10−6 K−1 for 2. The anisotropy of the overall thermal expansion is connected to the anisotropy in expansion of coordination polyhedra (Figure 3c,d). Upon heating from 100 to 300 K, U-O bonds elongate only slightly yet monotonously (by 0.004(8) in the uranyl cation and by 0.003(6) Å in the equatorial plane). The PO4 tetrahedra are slightly more rigid compared to the AsO4 (0.001(4) vs. 0.002(1) Å, respectively). The largest increments are observed for the copper polyhedra: the Cu–H2O bonds in 1 elongate by 0.007(8) Å, while in 2, by 0.027(8) Å. The bonds with OUr (Cu–O1 and Cu–O4) also elongate anisotropically (by 0.011(8) Å and 0.026(8) Å in 1, and by 0.015(2) Å and 0.035(2) Å in 2, respectively). Thus, the bond lengths in the UO6 and TO4 polyhedra remain constant within the precision limit while those in the [CuO2(H2O)4] octahedra expand noticeably, which causes expansion of the interlayer space until the first dehydration step.
The evolution of PXRD patterns of 1 with a temperature increase in the range of 293–673 K is represented in Figure 4. Three dehydration stages (at 353, 373, and 483 K) are clearly visible in Figure 4a. Each step causes a shift in the diffraction maxima towards higher 2θ values, which is best illustrated by the (001) reflection. Stubbs et al. [41] calculated the interlayer distances from the positions of diffraction maxima and demonstrated that those expectedly decrease at each dehydration step. Due to high dehydration rates, the selection of monophasic products is a challenging task and many investigators have very likely dealt with mixtures of various hydrates. Heating such mixtures may result in two sets of reflections containing, e.g., initial 1 and its first dehydration product. Further heating of such mixtures leads to two transitions at 313 and 463 K. The temperatures of the first dehydration event, determined by the SCXRD and PXRD measurements, are in agreement.
It can be seen from Figure 4a that the diffraction maxima of 1 mostly disappear at ~373 K; the decomposition starts at ~353 K. An experimental PXRD pattern for 1 at room temperature is shown in Figure 4b.
Equations describing the temperature dependence of the unit cell parameters of metatorbernite can be described by the following linear functions (where T is a temperature): a = 6.96 + 0.8 × 10⁻⁴ T; c = 8.65 + 2.17 × 10⁻⁴ T; V = 418.94 + 201.96 × 10⁻⁴ T. Upon heating, the unit cell of 1 is expanding along all crystallographic axes (Figure 4c). PXRD experimental points are highlighted in black, SCXRD points are highlighted in green. The calculated values of the main components of the TE tensor (α11 = 12(2), α33 = 25(2), αV = 48(6) × 10−6 K−1) illustrate its strongly anisotropic character (αmaxmin = 2.1). The maximal thermal expansion is observed in the direction normal to the autunite-like layers (Figure 4d), which is in agreement with the SCXRD data.
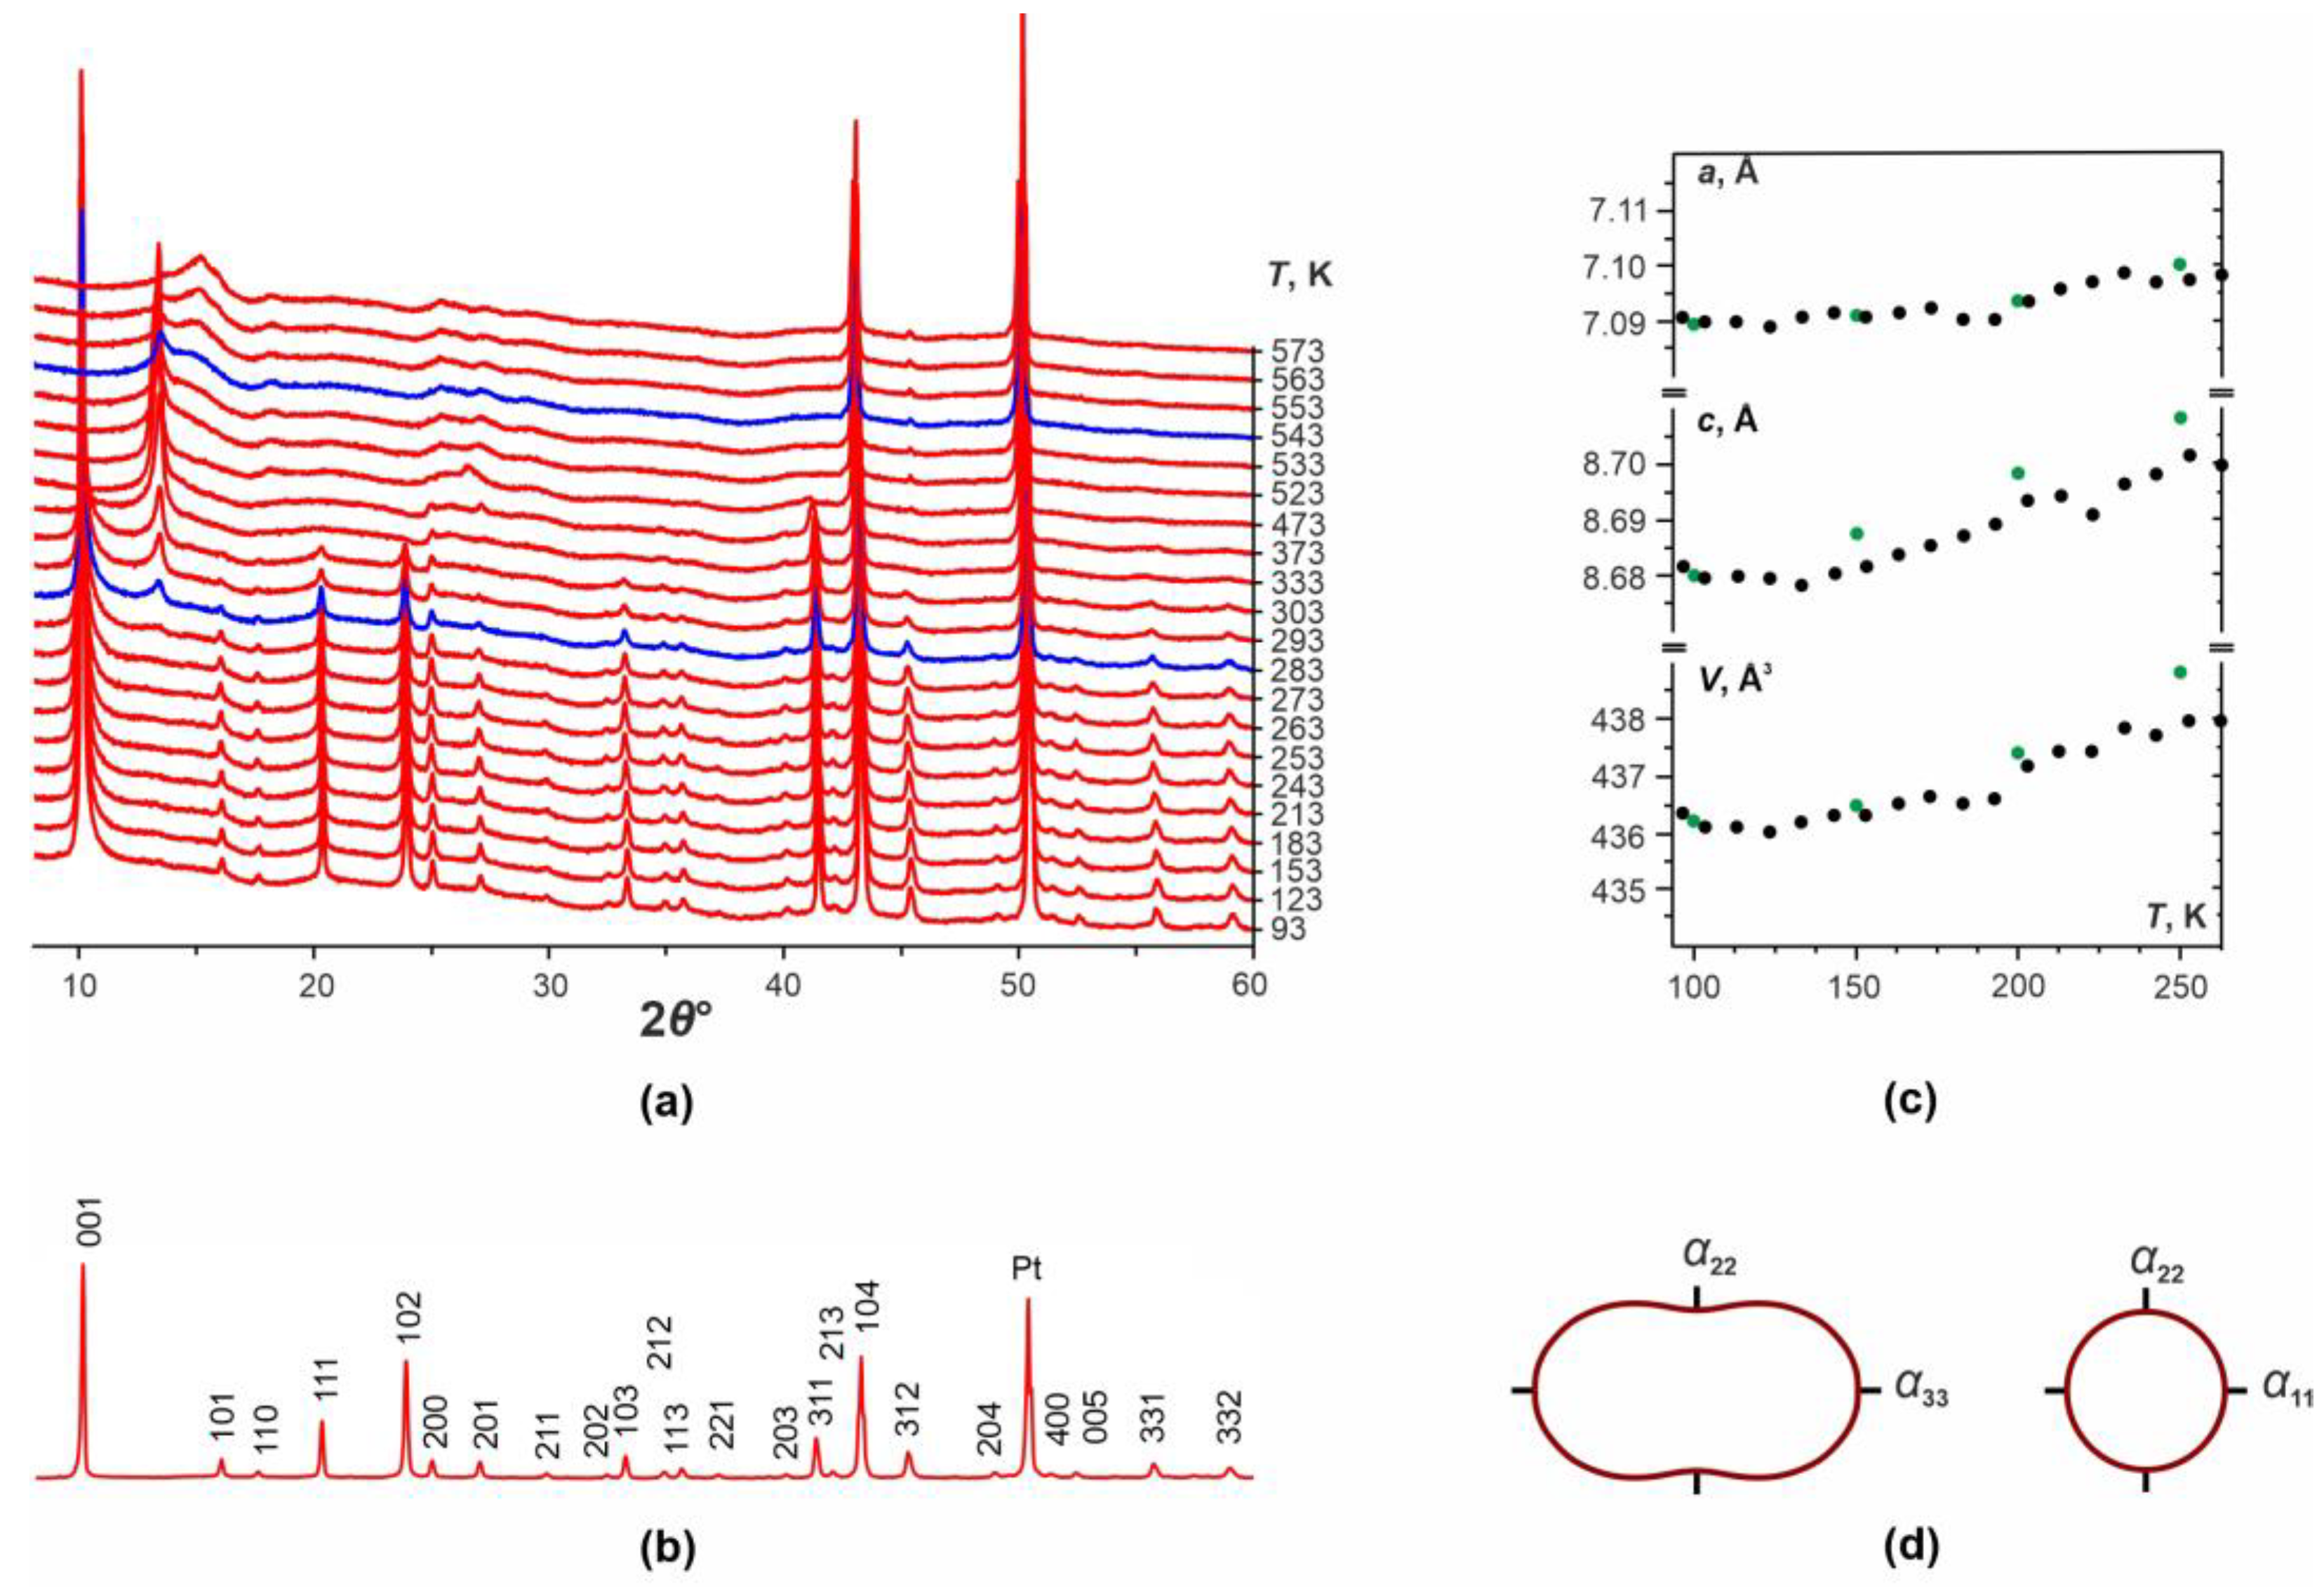
The thermal behavior of 2 was studied in the range of 93–573 K (Figure 5a); the experimental PXRD pattern collected at 93 K is shown on Figure 5b. Between 93 and 283 K, the diffraction maxima shift only slightly due to the thermal expansion. The first event is observed at 283 K, while the second at 543 K. Another independent experiment between 100 and 333 K gives the same result. At c.a. 333 K, the diffraction pattern corresponds to a partially dehydrated phase which is stable until the end of experiment.
Equations describing the temperature dependence of the unit cell parameters of metazeunerite within the range of 100 to 263 K (Figure 5c) are a = 7.09 + 0.6 × 10⁻⁴ T, c = 8.7 + 1.52 × 10⁻⁴ T, and V = 438.55 + 154 × 10−4 T. The thermal expansion of 2 is strongly anisotropic (α11 = 8(1), α33 = 18(1), and αV = 35(3) × 10−6 K−1). The maximal expansion is observed along the normal to the uranyl arsenate layers (Figure 5d), as it was observed for 1.
Two independent methods (SCXRD and PXRD) were used to study the thermal expansion of metatorbernite and metazeunerite. The data obtained for each mineral (Figure 4c and Figure 5c) were combined and utilized to calculate the average values of the thermal expansion coefficients. (α11 = 5(1), α33 = 23(1), and αV = 32(3); and α11 = 9(1), α33 = 17(1), αV = 34(3) × 10−6 K−1 for 1 and 2, respectively). Yet, the caveat is that the two parts of this graph contain data obtained using different techniques, including calculation methods, and therefore different levels of precision.

3.3. Changes in the Standard Gibbs Energies of Formation Calculations

Expansions of the ΔfG° values into oxide components are obtained [42,43] for the experimentally determined standard Gibbs energies of formations (ΔfG°) of synthetic metatorbernite [44] and metazeunerite [45] as follows according to Table 2:
ΔfG°(1) = g(CuO) + 8g(H2O) + 2g(UO3) + g(P2O5) = −6132.0 (kJ/mol),
ΔfG°(2) = g(CuO) + 8g(H2O) + 2g(UO3) + g(As2O5) = −5356.0 (kJ/mol),
The contributions of the oxides g(P2O5) and g(As2O5) to the ΔfG° values differ significantly (Table 2), since they represent properties for different chemical elements. Taking into account the identical stoichiometry of metatorbernite and metazeunerite, one can compare the values of g(CuO) + 8g(H2O) + 2g(UO3) for decompositions (1) and (2). They are −4632.395 and −4537.228 kJ/mol, respectively, which shows a greater energetic affinity for the complexation of uranium oxides, copper and water with phosphate than with arsenate. According to the polythermic studies, reported both in previous and our studies, thermal dehydration results in the formation of anhydrous copper uranyl phosphate and arsenate, respectively, which are in turn stable to relatively high temperatures. Unfortunately, no thermodynamic data are known for these complex compounds. Therefore, only qualitative trends can be compared when considering the stability of hydrated species against simple constituting oxides.

4. Discussion

Despite the essential spread of temperature ranges for the dehydration steps of metatorbernite, most investigators point to three intervals of 373–393, 393–423, and 503–523 K. Our data on the first step agree well with the values reported by Pozas-Tormo (383 K) [21], Ambartsumyan (383 K) [22], and Vochten (393 K) [24], which are 10–30 K below those reported by Frost (411 K) [20] and Stubbs (402 K) [43]. According to the TGA data, metatorbernite releases from 1.5 [20] to 4 [24] H2O molecule pfu. In experiments performed on pure metatorbernite (without dehydrated phases), no effects are registered at other temperatures, in contrast to those at 423–453 K reported by Vochten et al. [24]. In addition, we did not observe any effects at 295 upon heating pure metatorbernite. In the meantime, experiments performed on mixtures of pristine and partially dehydrated metatorbernite two effects at 303 and 473 K were registered. These “extra” events may occur either due to the earlier overcoming of kinetic barriers or the formation of intermediate hydrates via “seeded” dehydration.
The study of 2 by variable-temperature PXRD reveals two dehydration steps at 283 and 543 K. Close values to the first were reported by Frost (321 K) and Chernorukov (333 K), and to the second by Vochten (503 K). The changes in diffraction pattern are smooth, and some maxima disappear between 283 and 373 K.
We note that the registered temperatures of the first dehydration effect in our single-crystal and powder diffraction experiments nearly coincide (300–363 and 250–303 K for 1 and 2, respectively). However, the thermal behavior of both isostructural minerals is different. The reasons likely stem from the structural details: the autunite-like layers in their structures are comprised of vertex-sharing UO6 octahedra and TO4 tetrahedra, via the U–O3–T bridges (Figure 2c). The U–O3 distance increases by 0.003(6) Å for 1 and by 0.006(2) Å in 2 with an average length of 2.320 Å with increasing temperature. The P–O3 and As–O3 increase by 0.001(4) and 0.002(1) Å with the average lengths of 1.567 and 1.710 Å in 1 and 2, respectively. Hence, the longer As–O3 exhibits a slightly larger thermal expansion as compared to the shorter P–O3. This is reflected in the small but statistically discernable differences of thermal expansion coefficients in the plane of the layer (α11 = 8(2) and 9(2) × 10−6 K−1 for 1 and 2, respectively). The expansion in the normal direction is of the same order (α33 = 15(6) and 24(2) × 10−6 K−1, respectively); it is mostly determined by the expansion of CuO6 polyhedra. The latter are linked to the autunite layers via O1–Cu1–O2 bridges (Figure 2c). In the equatorial plane, each Cu cation forms four Cu–O4 bonds. The Cu1–O1 distances increase by 0.010(8) and 0.015(2)Å upon heating, while Cu1–O2 by 0.025(8) and 0.035(2)Å for 1 and 2, respectively. The equatorial Cu–O4 bonds elongate by 0.014(8) and 0.027(2) Å. Therefore, an expansion of interstitial structure, which includes CuO6 octahedra, is nearly two orders larger compared to those in the autunite-like layers; the equatorial Cu–O4 bonds expand twice more rapidly in 2 compared to 1, which explains the differences in the α33 values.

5. Conclusions

In this paper, we reported on the thermal behavior studies of the crystal structures of two related uranyl minerals, metatorbernite and metazeunerite, by the means of single-crystal and powder X-ray diffraction methods for the first time.
In terms of thermal behavior, the structure of metatorbernite can be considered as a system of one rigid and other “inflatable” layers (comprised of UO6-PO4 and CuO6 polyhedra) wherein heating leads to increasing interlayer distance which enhances the stepwise release of water. The structure of metazeunerite is more flexible due to the larger expansion of the AsO4 tetrahedra; this may possibly account for the partial retention of H2O molecules between 283 and 543 K.
An important point when studying minerals of this group is the choice of the unit cell and the space symmetry group. A “direct”, “intuitive”, or “by-analogy-to” attribution of a mineral to a particular space group in this family is apparently incorrect. Various settings should be considered as “polytype” modifications [46], for which the maximal symmetry will correspond to a small tetragonal unit cell with c~8.6 Å and the archetypic P4/nmm space group. The symmetry lowering can be caused by various factors, such as isomorphism in tetrahedral positions, different compositions of the interstitial complex, changes in the hydration degree during crystal growth, etc. Also note the possibility of subtle temperature- or composition-driven second-order phase transitions which are particularly challenging to detect. Yet, it should be noted that slight differences in chemical composition of 2a and 2b samples had no effect on the symmetry. The comparison of our results to those of the previous works indicates that the symmetry is mostly determined by the arrangement of Cu atoms. One is tempted therefore to assume that in synthetic crystals, these actually occupy only one of several potential sites [13], possibly due to some kinetic preferences, as the synthesis time is relatively short. For the natural samples, much longer formation times are sufficient for various re-distributions, including those leading to a higher overall symmetry and a smaller unit cell. On the other hand, there are many more parameters quite different for the natural and synthetic conditions, including different precursors, their chemical composition, impurity effects, etc. To elucidate their role and to determine which of these play the major role(s) in the resulting structural architecture of meta-autunite group minerals, further precise investigation of mineral species and synthetic phases is required.

Author Contributions

Conceptualization, E.V.N., V.V.G. and A.V.K.; Methodology, E.V.N. and V.V.G.; Software, E.V.N., Y.G.T., O.V.E. and M.G.K.; Validation, E.V.N.; Formal analysis, E.V.N., Y.G.T., A.V.K. and O.V.E.; Investigation, E.V.N., V.V.G., Y.G.T., D.O.C., M.G.K. and O.V.E.; Resources, A.V.K.; Data curation, Y.G.T. and A.V.K.; Writing—original draft, E.V.N., V.V.G. and D.O.C.; Writing—review and editing, E.V.N., V.V.G. and D.O.C.; Visualization, Y.G.T., E.V.N. and M.G.K.; Supervision, E.V.N. and V.V.G. All authors have read and agreed to the published version of the manuscript.

Funding

This research was funded by the Russian Science Foundation, grant number 23-17-00080.

Data Availability Statement

The data presented in this study are available in the article.

Acknowledgments

We are grateful to the reviewers for their valuable comments and personally to Borisov A.S. for his contribution to the experimental part of this work. Technical support by the X-ray Diffraction Resource Centers of Saint-Petersburg State University is gratefully acknowledged.

Conflicts of Interest

The authors declare no conflict of interest.

References

  1. Krivovichev, S.V.; Plášil, J. Mineralogy and Crystallography of Uranium. In Uranium: From Cradle to Grave; MAC Short Courses; Burns, P.C., Sigmon, G.E., Eds.; Midlands Arts Centre: Birmingham, UK, 2013; Volume 43, pp. 15–119. [Google Scholar]
  2. Lussier, A.J.; Lopez, R.A.K.; Burns, P.C. A revised and expanded structure hierarchy of natural and synthetic hexavalent uranium compounds. Can. Mineral. 2016, 54, 177–283. [Google Scholar] [CrossRef]
  3. Cuney, M.; Kyser, K. Recent and Not-So-Recent Developments in Uranium Deposits and Implications for Exploration; Mineralogical Association of Canada: Quebec City, QC, Canada, 2008. [Google Scholar]
  4. Cretaz, F.; Szenknect, S.; Clavier, N.; Vitorge, P.; Mesbah, A.; Descostes, M.; Poinssot, C.; Dacheux, N. Solubility properties of synthetic and natural meta-torbernite. J. Nucl. Mater. 2013, 442, 195–207. [Google Scholar] [CrossRef]
  5. Hedman, T.; Nystrom, A.; Thegerstrom, C. Swedish containers for disposal of spent nuclear fuel and radioactive waste. Comptes Rendus Phys. 2002, 3, 903–913. [Google Scholar] [CrossRef]
  6. Rosborg, R.; Werme, L. The Swedish nuclear waste program and the long-term corrosion behaviour of copper. J. Nucl. Mater. 2008, 379, 142–153. [Google Scholar] [CrossRef]
  7. Finch, R.; Murakami, T. Systematics and paragenesis of uranium minerals. In Uranium: Mineralogy, Geology and the Environment; Burns, P.C., Finch, R., Eds.; Mineralogical Society of America: Washington, DC, USA, 1999; pp. 91–179. [Google Scholar]
  8. Beintema, J. On the composition and crystallography of autunite and the meta-autunites. Recl. Trav. Chim. Pays Bas. 1938, 57, 155–175. [Google Scholar] [CrossRef]
  9. Makarov, E.S.; Tobelko, K.I. Crystal structure of metatorbernite. Dokl. Akad. Nauk SSSR 1960, 131, 87–89. [Google Scholar]
  10. Ross, M.; Evans, H.T.; Appleman, D.E. Studies of the torbernite minerals. II. The crystal structure of meta-torbernite. Am. Mineral. 1964, 49, 1603–1621. [Google Scholar]
  11. Stergiou, A.C.; Rentzeperis, P.J.; Sklavounos, S. Refinement of the crystal structure of metatorbernite. Z. Kristallogr. 1993, 205, 1–7. [Google Scholar] [CrossRef]
  12. Calos, N.J.; Kennard, C.H.L. Crystal structure of copper bis(uranyl phosphate) octahydrate (metatorbernite), Cu(UO2PO4)2×8(H2O). Z. Kristallogr. 1996, 211, 701–702. [Google Scholar] [CrossRef]
  13. Locock, A.J.; Burns, P.C. Crystal structures and synthesis of the copper-dominant members of the autunite and meta-autunite groups: Torbernite, zeunerite, metatorbernite and metazeunerite. Can. Miner. 2003, 41, 489–502. [Google Scholar] [CrossRef]
  14. Kulaszewska, J.; Dann, S.; Warwick, P.; Kirk, C. Solid solution formation in the metatorbernite–metazeunerite system (Cu(UO2)2(PO4)2−x(AsO4)x.nH2O) and their stability under conditions of variable temperature. Phil. Trans. R. Soc. 2018, 377, 20180242. [Google Scholar] [CrossRef] [PubMed]
  15. Hanic, F. The crystal structure of meta-zeunerite Cu(UO2)2(AsO4)2×8(H2O). Czech. J. Phys. 1960, B10, 169–181. [Google Scholar] [CrossRef]
  16. Hennig, C.; Reck, G.; Reich, T.; Rossberg, A.; Kraus, W.; Sieler, J. EXAFS and XRD investigations of zeunerite and meta-zeunerite. Z. Kristallogr. 2003, 218, 37–45. [Google Scholar] [CrossRef]
  17. Frost, R.L.; Weier, M.L.; Adebajo, M.O. Thermal decomposition of metazeunerite—A high-resolution thermogravimetric and hot-stage Raman spectroscopic study. Thermochim. Acta 2004, 419, 119–129. [Google Scholar] [CrossRef]
  18. Suzuki, Y.; Sato, T.; Isobe, H.; Kogure, T.; Murakami, T. Dehydration processes in the meta-autunite group minerals meta-autunite, metasaléeite, and metatorbernite. Amer. Mineral. 2005, 90, 1308–1314. [Google Scholar] [CrossRef]
  19. Locock, A.J. Crystal chemistry of actinide phosphates and arsenates. In Structural Chemistry of Inorganic Actinide Compounds; Krivovichev, S.V., Burns, P.C., Tananaev, I.G., Eds.; Elsevier: Amsterdam, The Netherlands, 2007; pp. 217–278. [Google Scholar]
  20. Frost, R.L.; Kristóf, J.; Weier, M.L.; Martens, W.N.; Horváth, E. Thermal decomposition of metatorbernite—A controlled rate thermal analysis study. J. Therm. Anal. Calorim. 2005, 79, 721–725. [Google Scholar] [CrossRef]
  21. Pozas-Tormo, R.; Moreno-Real, L.; Martinez-Lara, M.; Bruque-Gamez, S. Layered metal uranyl phosphates. Retention of divalent ions by amine intercalates of uranyl phosphates. Can. J. Chem. 1986, 64, 30. [Google Scholar] [CrossRef]
  22. Ambartsumyan, T.L.; Basalova, G.I.; Gorzhevskaya, S.A. Thermal Investigations of Uranium and Uranium-Bearing Minerals; Gosatomizdat: Moscow, Russia, 1961; 148p. (In Russian) [Google Scholar]
  23. Cejka, J.; Muck, A. Thermal analysis and infrared spectra of some natural and synthetic uranium micas. Thermochim. Acta 1985, 86, 387. [Google Scholar] [CrossRef]
  24. Vochten, R.; Huybrechts, W.; Remaut, G.; Deliens, M. Formation of meta-torbernite starting from curite: Crystallographic data and electrokinetic properties. Phys. Chem. Miner. 1979, 4, 281–290. [Google Scholar] [CrossRef]
  25. Vochten, R.; Piret, P.; Goeminne, A. Synthesis, crystallographic data, solubility and electrokinetic properties of copper-, nickel- and cobalt-uranylphosphate. Bull. Minéral. 1981, 104, 457–467. [Google Scholar] [CrossRef]
  26. Chernorukov, N.G.; Nipruk, O.V.; Knyazev, A.V.; Pykhova, Y.P. Synthesis and study of uranyl arsenate (UO2)3(AsO4)2×12H2O. Z. Neorg. Khim. 2011, 56, 199–203. [Google Scholar] [CrossRef]
  27. Filenko, R.A.; Yurgenson, G.A.; Smirnova, O.K. New data on mineralogy of the oxidation zone of the Sherlovogorsky ore area (Eastern Transbaikalia). Geosph. Res. 2018, 4, 44–55. [Google Scholar] [CrossRef]
  28. Fraser, W. Diffractometers for modern X-ray crystallography: The XtaLAB Synergy X-ray diffractometer platform. Rigaku J. 2020, 36, 37–47. [Google Scholar]
  29. CrysAlisPro Software System, version 1.171.41.94a; Rigaku Oxford Diffraction: Oxford, UK, 2021.
  30. Sheldrick, G.M. Crystal structure refinement with SHELXL. Acta Crystallogr. 2015, C71, 3–8. [Google Scholar]
  31. Downs, R.T. Analysis of harmonic displacement factors. Rev. Mineral. Geochem. 2000, 41, 61–87. [Google Scholar]
  32. Spek, A.L. An overview of PLATON/PLUTON crystal structure validation. Acta Cryst. 2020, E76, 1–11. [Google Scholar] [CrossRef]
  33. Bruker TOPAS, version 5.0; Bruker AXS Inc.: Madison, WI, USA, 2014.
  34. Bubnova, R.S.; Firsova, V.A.; Filatov, S.K. Software for determining the thermal expansion tensor and the graphic representation of its characteristic surface (theta to tensor-TTT). Glass Phys. Chem. 2013, 39, 347–350. [Google Scholar] [CrossRef]
  35. Chudnenko, K.V. Thermodynamic Modeling in Geochemistry: Theory, Algorithms, Software, Applications; Academic Publishing House Geo: Novosibirsk, Russia, 2010; 287p. (In Russian) [Google Scholar]
  36. Grenthe, I.; Gaona, X.; Plyasunov, A.V.; Rao, L.; Runde, W.H.; Grambow, B.; Konings, R.J.M.; Smith, A.L.; Moore, E.E. Second Update on the Chemical Thermodynamics of Uranium, Neptunium, Plutonium, Americium and Technetium, Chemical Thermodynamics; Nuclear Energy Agency, OECD: Paris, France, 2021; Volume 14. [Google Scholar]
  37. Yokokawa, H. Tables of thermodynamic properties of inorganic compounds. J. Nation. Chem. Lab. Ind. 1988, 83, 27–118. [Google Scholar]
  38. Reid, R.; Prausnitz, J.; Sherwood, T. The Properties of Gases and Liquids, 3rd ed.; McGrawHill Book Company: New York, NY, USA, 1977; 592p. [Google Scholar]
  39. Burns, P.C.; Hawthorne, F.C. Coordination-geometry structural pathways in Cu2+ oxysalt minerals. Can. Mineral. 1995, 33, 889–905. [Google Scholar]
  40. Gagne, O.C.; Hawthorne, F.C. Bond-length distributions for ions bonded to oxygen: Alkali and alkaline-earth metals. Acta Crystallogr. Sect. B Struct. Sci. 2016, 72, 602–625. [Google Scholar] [CrossRef]
  41. Stubbs, J.E.; Post, J.E.; Elbert, D.C.; Heaney, P.J.; Veblen, D.R. Uranyl phosphate sheet reconstruction during dehydration of metatorbernite [Cu(UO2)2(PO4)2·8H2O]. Amer. Mineral. 2010, 95, 1132–1140. [Google Scholar] [CrossRef]
  42. Eremin, O.V. Method for calculating changes in the standard Gibbs energies of formation of minerals that belong to the class of uranophosphates. Radiochemistry 2020, 62, 480–491. [Google Scholar] [CrossRef]
  43. Eremin, O.V.; Rusal’, O.S.; Solodukhina, M.A.; Epova, E.S. Procedure for calculating the standard Gibbs potentials of minerals of the class of uranoarsenates. Russ. J. Phys. Chem. A 2020, 94, 678–686. [Google Scholar] [CrossRef]
  44. Nipruk, O.V.; Chernorukov, N.G.; Godovanova, N.S.; Arova, M.I. State of uranophosphates MII(PUO6)2·nH2O (MII = Mn2+, Co2+, Ni2+, Cu2+, Zn2+, Cd2+, Pb2+) in aqueous solutions. Radiochemistry 2012, 54, 528–536. [Google Scholar] [CrossRef]
  45. Chernorukov, N.G.; Nipruk, O.V.; Pykhova, Y.P.; Godovanova, N.S. Study of the state of uranoarsenates MII(PUO6)2·nH2O (MII = Mn2+, Co2+, Ni2+, Cu2+, Zn2+, Cd2+, Pb2+) in aqueous solutions. Russ. J. Gen. Chem. 2012, 82, 1348–1356. [Google Scholar] [CrossRef]
  46. Moroz, I.K.; Valueva, A.A.; Sidorenko, G.A.; Zhil’tsova, I.G.; Karpova, L.N. The crystal chemistry of uranium micas. Geokhimiya 1973, 18, 210–223. (In Russian) [Google Scholar]
Figure 1. Projection of the structure of 1 in P4/nmm (a) and P4/n (b) along the [010] direction. Projection of the uranyl phosphate layers (c,d) and Cu-H2O (e,f) interstitial space in the structure of 1 in the P4/nmm and P4/n space groups, respectively. Unwrapped precession images of the reciprocal space along b* (g) and c* (h) of the structure of 1. Legend: U = brown; P = lilac; Cu = cyan; O = red; H = black.
Crystals 13 01688 g001
Figure 2. Thermal expansion of the crystal structures of 1 and 2. Thermal behavior of U-, P-, As- and Cu-centered coordination polyhedra in the structures of 1 (a) and 2 (b); bond length values are given for the model at 100 K. Polyhedral and ball-and-stick representations of 1 and 2 along the [001] (c) and [100] (d) directions. The pole figures of thermal expansion coefficients of 1 (e) and 2 (f) in the temperature range of 100–300 K. Legend: see Figure 1; bonds that increases on heating are marked with red arrows, and those that do not change on heating are marked by green lines.
Crystals 13 01688 g002
Figure 3. The unit cell parameters and selected bond lengths (Å) as a function of temperature (100–300 K) under heating for 1 (a,c) and 2 (b,d). ESDs of the unit cell and bond lengths parameters are within the limits of the symbols.
Crystals 13 01688 g003
Figure 4. Powder X-ray diffraction patterns of 1 as a function of temperature (313–673 K) under heating in air (a). An experimental PXRD pattern for 1 collected at room temperature (b) with hkl indices marked. The unit cell parameters of metatorbernite as a function of temperature (c). PXRD experimental points are highlighted in black; SCXRD points are highlighted in green. The pole figures of thermal expansion coefficients of metatorbernite (d) in the temperature range of 313–353 K. The temperatures corresponding to the stages of dehydration are indicated in blue.
Crystals 13 01688 g004
Figure 5. Powder X-ray diffraction patterns of 2 as a function of temperature (93–573 K) under heating in a vacuum (a). An experimental PXRD pattern for 2 collected at 93 K (b) with hkl indices marked. The unit cell parameters of metatorbernite as a function of temperature (c). PXRD experimental points are highlighted in black, SCXRD points are highlighted in green. The pole figures of thermal expansion coefficients of metatorbernite (d) in the temperature range of 100–263 K.
Crystals 13 01688 g005
Table 1. Crystallographic data and refinement parameters for 1 and 2a.
12a
Temperature (K)100
Radiation, λ (Å)MoKα, 0.71073
Crystal systemtetragonal
Space groupP4/nmm
a (Å)6.9589(2)7.0896(2)
c (Å)8.6170(4)8.6802(5)
Volume (Å3)417.29(3)436.29(4)
Crystal size (mm3)0.15 × 0.06 × 0.040.17 × 0.07 × 0.05
θ range (°)3.76–27.503.71–28.39
h, k, l ranges−8 → 7,−7 → 9,
−9 → 9,−8 → 9,
−8 → 11−11 → 7
Total reflections collected20581869
Unique reflections (Rint)0.0380.045
R1[F > 4σF], wR1[F > 4σF]0.021, 0.0550.051, 0.13
Rall, wRall0.023, 0.0560.058, 0.14
Highest difference peak1.964.54
Deepest hole−1.20−2.46
Goodness-of-fit1.0891.118
ICSD23079462307947
Table 2. Additive oxide contributions of the ΔfG° values of metatorbernite (1) and metazeunerite (2).
Compoundg(CuO), kJ/molg(H2O), kJ/molg(UO3), kJ/molg(T2O5),
T = P, As, kJ/mol
1−238.573−239.035−1240.771−1499.603
2−178.408−259.211−1142.566−818.766
Disclaimer/Publisher’s Note: The statements, opinions and data contained in all publications are solely those of the individual author(s) and contributor(s) and not of MDPI and/or the editor(s). MDPI and/or the editor(s) disclaim responsibility for any injury to people or property resulting from any ideas, methods, instructions or products referred to in the content.