Article

Effect of Laser Shock Peening without Coating on Grain Size and Residual Stress Distribution in a Microalloyed Steel Grade

by
Calvin Samuel
1,
Arivarasu MOGANRAJ
2,*,
Sathya Swaroop
3,
K. Praveenkumar
1,3,4,
Arivazhagan Natarajan
1,
Muktinutalapati Nageshwara Rao
1,
Badirujjaman Syed
5 and
Basudev Bhattacharya
5
1
School of Mechanical Engineering, Vellore Institute of Technology, Vellore 632014, India
2
Centre for Innovative Manufacturing Research, Vellore Institute of Technology, Vellore 632014, India
3
Surface Modification Lab, School of Advanced Sciences, Vellore Institute of Technology, Vellore 632014, India
4
Department of Mechanical and Automation Engineering, Sri Sai Ram Engineering College, Chennai 600044, India
5
TATA Steel, R&D Division, Jamshedpur 831007, India
*
Author to whom correspondence should be addressed.
Crystals 2023, 13(2), 212; https://doi.org/10.3390/cryst13020212
Submission received: 8 December 2022 / Revised: 29 December 2022 / Accepted: 31 December 2022 / Published: 24 January 2023
(This article belongs to the Section Crystalline Metals and Alloys)

Abstract

:
This study aimed to identify the optimal combination of wavelength and laser pulse density to achieve the optimal pulse pressure that can induce the maximum compressive residual stress at the subsurface of microalloyed steel. For this, laser shock peening without coating (LSPwC) was performed on microalloyed steel samples at the fundamental wavelength (1064 nm) with pulse densities of 3, 6, 9, and 12 GW/cm2 and at the second harmonic wavelength (532 nm) with pulse densities of 3, 6, and 9 GW/cm2. The residual stress distributions were studied to a depth of 500 µm in the laser-treated samples. Tensile residual stress was observed at the surface of laser-peened specimens in both wavelength conditions (1064 and 532 nm). The significant impartment of compressive residual stress across the depth was achieved at the fundamental wavelength (1064 nm). The maximum compressive residual stress was attained with a laser pulse density of 9 GW/cm2 in the 1064nm wavelength condition. The optical micrographic analysis in the subsurface regions of the LSPwC specimen at 1064 nm and 9 GW/cm2 shows evidence of a high degree of plastic deformation. Electron backscatter diffraction (EBSD) analysis shows that there is grain refinement due to plastic deformations in samples subjected to the fundamental wavelength. Microhardness distribution analysis across the subsurface region shows work-hardening effects in the laser-processed samples in the 1064 nm condition. This study also shows that there is an indication of a thermal softening effect in the samples treated with the 532 nm wavelength, and it is correlated with lower compressive residual stress across the depth.

1. Introduction

Low-carbon or low-alloy steels are preferred structural materials in infrastructure and automotive sectors due to their unique properties, such as resistance to defects, high strength, and ease of fabricability. In high-strength, low-carbon low-alloy steel (HSLA), small amounts of columbium, molybdenum, vanadium, and titanium are intentionally added. These alloying elements have beneficial effects on the strength, ductility, and high-impact toughness of the steel. Such microalloyed steel has a wide range of applications that include welding, one of the primary modes of fabrication in structural engineering and automotive chassis [1,2,3]. Structural integrity is one of the critical concerns for applications employing microalloyed steels, which should be ascertained beforehand so as to avoid any catastrophic failures during their application. Fatigue fracture, stress corrosion cracking (SSC), and hydrogen-induced cold cracking (HIC) are the different modes of failure encountered in structural steels. All of these failure modes are related to crack initiation and propagation, which are influenced by the tensile residual stress. Among them, fatigue fracture is the most commonly encountered in structural steels under cyclic loading conditions. In in-service locations, the vibration generated is the source of cyclic stresses. Cyclic stresses make microscopic defects (microvoids and crack-like flaws) at the surface vulnerable to failure [4,5]. These cracks proliferate across the surface and induce fatigue fracture. It is well known that fatigue and fracture toughness are severely affected by crack-like flaws, which make the structures susceptible to failure at a lower load than estimated. Structural steels are generally fabricated through a thermo-mechanical control process (TMCP) that involves hot rolling and a controlled cooling process. Hot-rolled microalloyed steel has a predominant acicular ferrite phase, which increases the toughness of the material. The fabrication of structural steels through TMCP involves a slow cooling rate that causes grain coarsening and minimizes the volume fraction of acicular ferrite [6]. This microstructural change results in adverse effects on the mechanical properties of the material. In addition to that, the fabrication of structural steels involves welding and weld joints. These joints are inevitably weak under fatigue loading. It is widely reported that 37% of structural failures are due to cracking, as compared to 27% of failures associated with metal erosion (corrosion) [7]. So, it is highly necessary for structural steel manufacturers to control microstructural changes or adopt a technique that narrows down failures associated with surface or subsurface cracking and its propagation during cyclic loading conditions (fatigue). Several techniques improve surface properties through grain refinement and impart compressive residual stresses. Techniques such as surface mechanical attrition treatment (SMAT), equal-channel angular pressing (ECAP), waterjet peening, ultrasonic peening, shot peening (SP), and laser shock peening (LSP) induce compressive residual stresses. Among these, LSP is exclusive in imparting compressive residual stress without sacrificing the surface roughness. The compressive residual stress confines the surface crack initiation and its propagation [8,9].
Laser shock peening (LSP) is a surface treatment technology that imparts beneficial compressive residual stresses to the material surface through intense shock waves [10,11,12]. These shock waves penetrate depths up to several hundreds of micrometers. The laser-based surface modification process has been receiving attention in industrial sectors in recent times due to its commercial viability. Like other surface treatments, laser peening generates compressive stress in the surface layers, inhibiting failures caused by fatigue and stress corrosion cracking [9,13]. A modified technique of conventional laser peening is called laser shock peening without coating (LSPwC) [14]. In this technique, no coatings are employed on the sample surface, which is a more efficient and time-saving process used in recent times [15,16,17,18]. In the LSPwC technique, it is highly difficult to achieve compressive residual stress on the top surface, and this is an absolute downside for using a high-energy laser technique in the shock peening process. Moreover, using a high-energy laser results in a higher thermal gradient, surface melting, and solidification, and it significantly reduces the imparted compressive residual stress beneath the surface [12,14]. In order to overcome the negative effects of a high-energy laser, a low-energy Nd: YAG laser source is used as a reliable laser source for the surface treatment process, especially in the LSPwC process. The tensile residual stress formation on the top surface can be narrowed down through low-energy laser sources, and in addition, using a low-energy laser source is economical [10,11]. This laser-assisted technique includes microstructural changes such as the dislocation density (isotropic hardening) and subgrain boundaries to improve the mechanical characteristics. From the earlier literature, it has been evident that LSP enhances fatigue, corrosion, and stress corrosion cracking [19,20,21,22,23]. It is also used in the biomedical sector for better cell adhesion and resistance against wear and corrosion [24,25,26]. Laser peening is also used in the surface modification of ceramics; a detailed review can be found elsewhere [27]. Lasers are also used in other applications, such as anti-icing/deicing [28], electronic fields in antennas [29], the generation of nano/microstructures in supercapacitors [30], Graphene-Based Flexible Electronics [31], 3D printing of micro-optics [32], optoelectronic devices [33], micropatterning [34], photothermal slippery surfaces [35], solar materials [36], and flexible surface enhancement [37] in the biomedical field.
Benxin Wu and Yung C. Shin [38] studied the effect of laser shock peening on the target material with and without a water confinement system. In their study, laser shock peening with a water confinement configuration created plasma pressures 4 times higher and 2–3 times longer than that of the direct configuration system. Chong Peng et al. [39] evaluated the effect of laser shock peening on the bending fatigue performance of AISI 9310 steel spur gear. Laser shock peening was performed at a wavelength of 1064 nm, laser pulse densities of 7 and 9 J with a 16 ns pulse duration time, and a 2 Hz repetition rate with a 50% overlap rate. Finite element modeling was developed to analyze the residual stress distribution on the laser-shock-peened (LSP) surface; the results were verified by X-ray diffraction analysis. In this study, both simulation and X-ray analysis results show that there was a considerable induction of compressive residual stress at the target surface. Micheal Kattoura et al. [40] investigated the effect of laser shock peening (LSP) to improve the fatigue life of ATI 718 Plus at a high temperature of 650 °C. In that investigation, LSP induced severe surface plastic deformation, which in turn led to a high magnitude of compressive residual stress at the surface, and changes in the near-surface microstructure resulted in high surface hardening. The changes in the near-surface microstructure were in the form of a high dislocation density through dislocation entanglements, slip band formation, and subgrains/crystallites that remained stable at elevated temperatures. In addition, LSP retained ~−470 MPa residual stress (68% of its initial residual stress) even after 140 h exposure to 650 °C. The retained residual stresses and the stable microstructure resulting from LSP increased the yield strength at 650 °C by ~14% and the endurance limit at 650 by ~10%. Shuai Huang et al. [41] reported that LSP had beneficial effects in terms of the impact toughness of Ti-17 titanium alloy. The authors successfully improved the impact toughness of laser-shock-peened specimens by up to 53% compared to unpeened specimens. Umapathi and Swaroop [42] investigated the effect of different wavelengths (1064 nm and 532 nm) on laser-shock-peened Ti-2.5Cu alloy without coating. The authors performed laser peening at different wavelengths (1064 and 532 nm) at a constant pulse density (6.97 GW/cm2) with overlap rates of 53, 63, and 73%. In the 1064 nm condition, there were no significant changes in thermal softening despite different overlap rates. They observed thermal softening to depths of 500 µm (at 532 nm) and 200 µm (at 1054 nm). From their study, it is evident that the extent of thermal softening is wavelength-dependent. Prabhakaran and Kalainathan [43] studied the effect of multiple laser shock peening on double-quenched and tempered dual-phase spring steel (SAE 9254). LSPwC was performed using a Nd: YAG laser source at a 1064 nm wavelength and 300 mJ pulse pressure with a pulse duration of 10 ns at a frequency of 10 Hz. They observed severe plastic deformation and several features of grain refinement, such as shear cells, shear bands, refined grain boundaries, twin lamellae, stacking faults, and grain boundary dislocations. Y. Shadangi et al. [44] studied the effect of laser pulse energy on the hardness profile, tensile properties, residual stress, and corrosion behavior of interstitial-free (IF) steel. In this investigation, the specimens were subjected to different pulse energies of 170, 230, 290, and 340 mJ. In their study, the hardness value increased with the increase in the laser pulse density, and there was a significant improvement in the yield strength. In all of these investigations, significant microstructural changes were observed. Adrian T. De Wald et al. [45] investigated tensile residual stress mitigation in Alloy 22 welds due to laser shock peening. The authors reported that the depth of compressive residual stress was significantly dependent on the number of peening layers. Further, the authors were able to induce compressive residual stresses up to a depth of 4.3 mm in a 33 mm thick weld at the center of the weld bead, where high levels of tensile stress were initially found. The authors observed that laser peening significantly decreased the possibility of stress corrosion cracking since it produces such a deep layer of compressive stress on the surface. Hackel et al. [46] conducted a finite element analysis of the laser shock peening of ferrous and non-ferrous materials. They reported that the local compressive stress greatly improves resistance to fatigue and resistance to stress corrosion cracking. Sakino et al. [47] investigated the effect of laser shock peening on welded 490 MPa grades of structural steels. The authors observed that the fatigue life of bridge steels greatly increased after laser shock peening. Yi et al. [48] studied the effect of laser shock peening (LSP) on the microstructure and mechanical properties of high-carbon steel using two different pulse energies (2 and 6 J) and a 1064 nm wavelength with a 5 Hz repetition rate. Higher microhardness and higher residual stress were acquired using LSP with higher pulse energy (6 J). The higher dislocation density is responsible for this higher hardness and residual stress. Prabhakaran et al. [49] studied the effect of laser shock peening without coating (LSPwC) on improving the fatigue life of ultrafine bainitic steel. LSPwC was performed on bainitic steel at a pulse density of 6 GW/cm2, with 75% overlap. LSPwC induced microstructural changes such as twin boundary, micro-shear band, and shear shell formation through plastic deformations. The researchers observed the strain-induced martensitic transformation in bainitic steel after LSPwC. Due to the microstructural changes and phase transformation, there was a significant improvement in the fatigue life of the peened specimen. Xu et al. [50] studied the effect of the laser shock peening scanning path and its overlap percentage on 316L stainless steel. The investigation was performed using a square pulse. Laser shock peening was performed at 30%, 50%, and 70% overlap along the width direction (path 1) and length direction (path 2) of a sample (turbine blade). The compressive residual stress was at its maximum with 70% overlap, and a uniform stress distribution was induced by scanning along the width direction. The overlap rate is a significant factor in inducing uniform compressive residual stress at greater depths.
From the literature survey, it is important to develop a suitable laser system for material to achieve the desired service life. A proper laser system can be attained through optimal parametric conditions, such as the pulse energy, pulse density, pulse duration, repetition rate, overlap percentages of the laser pulse, and suitable wavelength. The following points were clear from the literature survey: (1) the investigation of LSPwC on HSLA steel under different wavelength conditions has not been reported; (2) studies on LSPwC of steel are limited, and still, the investigation of the laser pulse density is required; (3) no studies have been reported on the effect of LSPwC on microalloyed high-strength low-alloy steel.
In this study, the above knowledge gap is filled by studying the effect of the laser pulse at different energy densities and wavelengths that induce maximum compressive residual stresses on microalloyed steel under LSPwC conditions. This research investigated the effect of laser shock peening on microalloyed steel to impart the maximum compressive residual stress to a greater extent (depth). For this investigation, near-infrared wavelengths (1064nm) and green wavelengths (532 nm) were used at laser pulse densities of 3, 6, 9, and 12 GW/cm2. The experiment was performed in a transparent confining medium (water) without thermo-protective coatings. In this report, the effect of the laser wavelength on microalloyed steel is clearly defined.

2. Experimental Procedures

2.1. Material Selection and Sample Preparation

Low-carbon microalloyed non-sour-type steel was indigenously developed by Tata Steel R&D Division, Jamshedpur, India. The nominal maximum elemental composition of the as-received material in wt.% was C—0.12% max; Mn—2.0% max; Si—1.0% max; S—0.01% max; P—0.1% max; Al—0.1% max; Ti + Nb + V—0.25% max; and N—0.012% max. The ferrite stabilizer (Si) in the chemical composition induces solid solution strengthening of the ferrite phase. The material was hot-rolled into 16 mm thick plates. The samples required for laser shock peening were cut to dimensions of 10 × 10 × 5 mm using wire electric discharge machining (WEDM). Before laser surface modification, the samples were emery-polished with grid sizes of 600, 800, and 1000 to remove oxide scales and surface protuberances.

2.2. Laser Shock Peening without Coating (LSPwC)

LSPwC was performed using a pulsed Nd: YAG laser that operates at a fundamental wavelength of 1064 nm and a second harmonic wavelength of 532 nm with a pulse duration of 10 ns and a repetition rate of 10 Hz. The laser shock peening setup is shown in Figure 1a. The laser beam had a spot diameter of 0.8 mm and was maintained by adjusting the focal length. The laser beam had a Gaussian intensity profile with a beam divergence of 0.8 mrad. LSPwC was performed at various pulse densities of 3, 6, 9, and 12 GW/cm2 at the fundamental wavelength (1064 nm) and 3, 6, and 9 GW/cm2 at the second harmonic wavelength (532 nm) with a 70% overlap rate (maintained along the peening direction and in the perpendicular direction). Due to machine constraints, the overlap rate was maintained by the servo-controlled bidirectional table that held the samples. A simple schematic representation of the laser peening pattern is shown in Figure 1b. Protective surface coatings were not employed during laser processing, due to which there was a mild decarburized surface formation on the peened specimen because of the adverse effect of extreme temperature developed at the laser–surface interface, which is shown in Figure 1c. Laser shock peening was performed by immersing the sample in running water, which formed a transparent confining layer above the sample surface. For the fundamental wavelength, a thin water confining layer (less than 1 mm) was maintained, whereas, for the second harmonic wavelength, a comparatively thick water confining layer (10 mm) was maintained. The confining layer formed by the running water eradicates ablated material from the sample surface during processing.

2.3. Residual Stress Measurements and Electropolishing

Residual stress measurements were carried out on the samples before and after laser processing using the Pulstec (µ-X360) XRD residual stress analyzer. The analyzer uses the cos α technique for residual stress measurements. The cosα method relies on the Debye–Scherrer ring pattern to detect normal and shear stress measurements. During the analysis, the X-rays record the Debye–Scherrer ring in the detector. The accuracy of the cosα method is equal to that of the sin2Ψ method, and the quantification time was considerably reduced to less than a minute. The residual stress was measured in the {211} plane, which is the standard plane for the α-Fe BCC structure. The X-ray incident angle was kept at 35°. The X-ray tube functioned at a voltage of 30 kV and a 1.0 mA current. The X-ray tube generates radiographic rays at a wavelength of 2.29 Å. The analyzer was calibrated using stress-free ferrite powder and solid platinum before the actual measurements. The residual stress was measured at three different points in the samples, and the mean value is reported as the average residual stress. Depth-wise residual stress was subsequently measured after the electropolishing process at intervals of 50, 100, 200, 300, 400, and 500 µm. Electropolishing was performed on the laser-peened surface using a Struers electropolisher. For electropolishing, an A2 electrolytic solution was used, and its chemical composition is given in Table 1. This electropolisher removes the material by an oxidizing and dissolving process in a confined manner without affecting the existing residual stress of the specimen. This electropolishing process aided in analyzing the residual stress distribution across depths. The specimen after electropolishing is shown in Figure 1d.

2.4. Microstructural Characterization

The crystallographic orientation, grain size distribution, and misorientation angle distribution in the microalloyed steel specimens before and after laser shock peening were analyzed using the electron backscatter diffraction (EBSD) technique. An FEI Quanta field-emission microscope was used for the EBSD analysis, with the operating parameters being a voltage of 30 kV and a current in the range of 1–50 nA. The EBSD crystallographic analysis depends on the formation of a Kikuchi diffraction pattern when the electron beam becomes incident on a flat, polished surface of the sample. In this analysis, the scan step size, working distance, and tilt angle were maintained at 0.4 mm, 20–22 mm, and 70°, respectively. The EBSD analysis was carried out on the cross-sectional area of the laser-peened and unpeened samples. The cross-sectional surfaces of the samples were prepared by mechanical polishing (grit sizes of 600, 800, 1000, 1200, and 1500) followed by electropolishing (0.8 A, 30 s) using an electrolyte consisting of perchloric acid and ethanol (1:7 ratio). Optical micrographic (OM) studies in the cross-sectional region of microalloyed specimens were performed using inverted Carl Zeiss microscopy. The samples for OM studies were mechanically polished and etched using Nital etchant for 5–10 s. Macrographic observations of the laser-shock-peened samples were made using Dino-Lite microscopy.

2.5. Microhardness Measurement

The microhardness distributions of the laser-shock-peened (LSP) and unpeened samples were analyzed using a Matsuzawa Vickers microhardness tester (MMT-x). The microhardness distribution was studied transversely along the subsurface region (right below the surface) for a depth of 4 mm with an indentation gap of 0.1 mm. The indentation hardness measurement was performed at a load of 100 gf with a 10 sec dwell time.

2.6. Surface Roughness

The surface roughness measurements of the unpeened and LSP samples were examined for a sampling length (probe travel length) of 5.6 mm using a contact-probe-type surface roughness measuring system (Marsurf M 400). For roughness measurements, the samples were cleaned with acetone to remove contaminants such as grease, oils, dust, and loose oxide particles. In each sample, three readings were taken, and the average value is considered the corresponding roughness value of the surface.

3. Results

3.1. Residual Stress Distribution Analysis in LSPwC Specimen

The residual stress distribution was analyzed across the depth of LSP specimens through the electrochemical polishing technique. The residual stress distribution profile is based on the function of depth. The subsurface residual stress was measured in a sequence of 50, 100, 200, 300, 400, and 500 μm depths. The residual stress distribution profiles of LSP specimens irradiated with 1064 nm and 532 nm wavelengths are given in Figure 2 and Figure 3, respectively. It is apparent from the graph (Figure 2) that laser shock peening at the fundamental wavelength (1064 nm) induces significant compressive residual stress across the depth in microalloyed steel. The graphical trend shows that there is substantial improvement in the imparted compressive residual stress with the range of pulse densities (3–9 GW/cm2), and it is important to observe that there is a trend reversal of the imparted compressive residual stress at a pulse density of 12 GW/cm2 in the fundamental wavelength condition. Figure 3 indicates that there is no significant impartment of compressive residual stress across the depth in the 532 nm wavelength condition at any of these laser pulse densities (3, 6, and 9 GW/cm2). Tensile residual stress is observed at the surface of the LSPwC specimen irradiated in both wavelength conditions (1064 and 532 nm). Further, the residual stress distribution profile of the laser-peened specimen is compared with that of the unpeened specimen. The unpeened specimen shows a flat profile of the residual stress distribution. The maximum compressive residual stress was attained at a laser pulse density of 9 GW/cm2 in the 1064 nm wavelength condition.

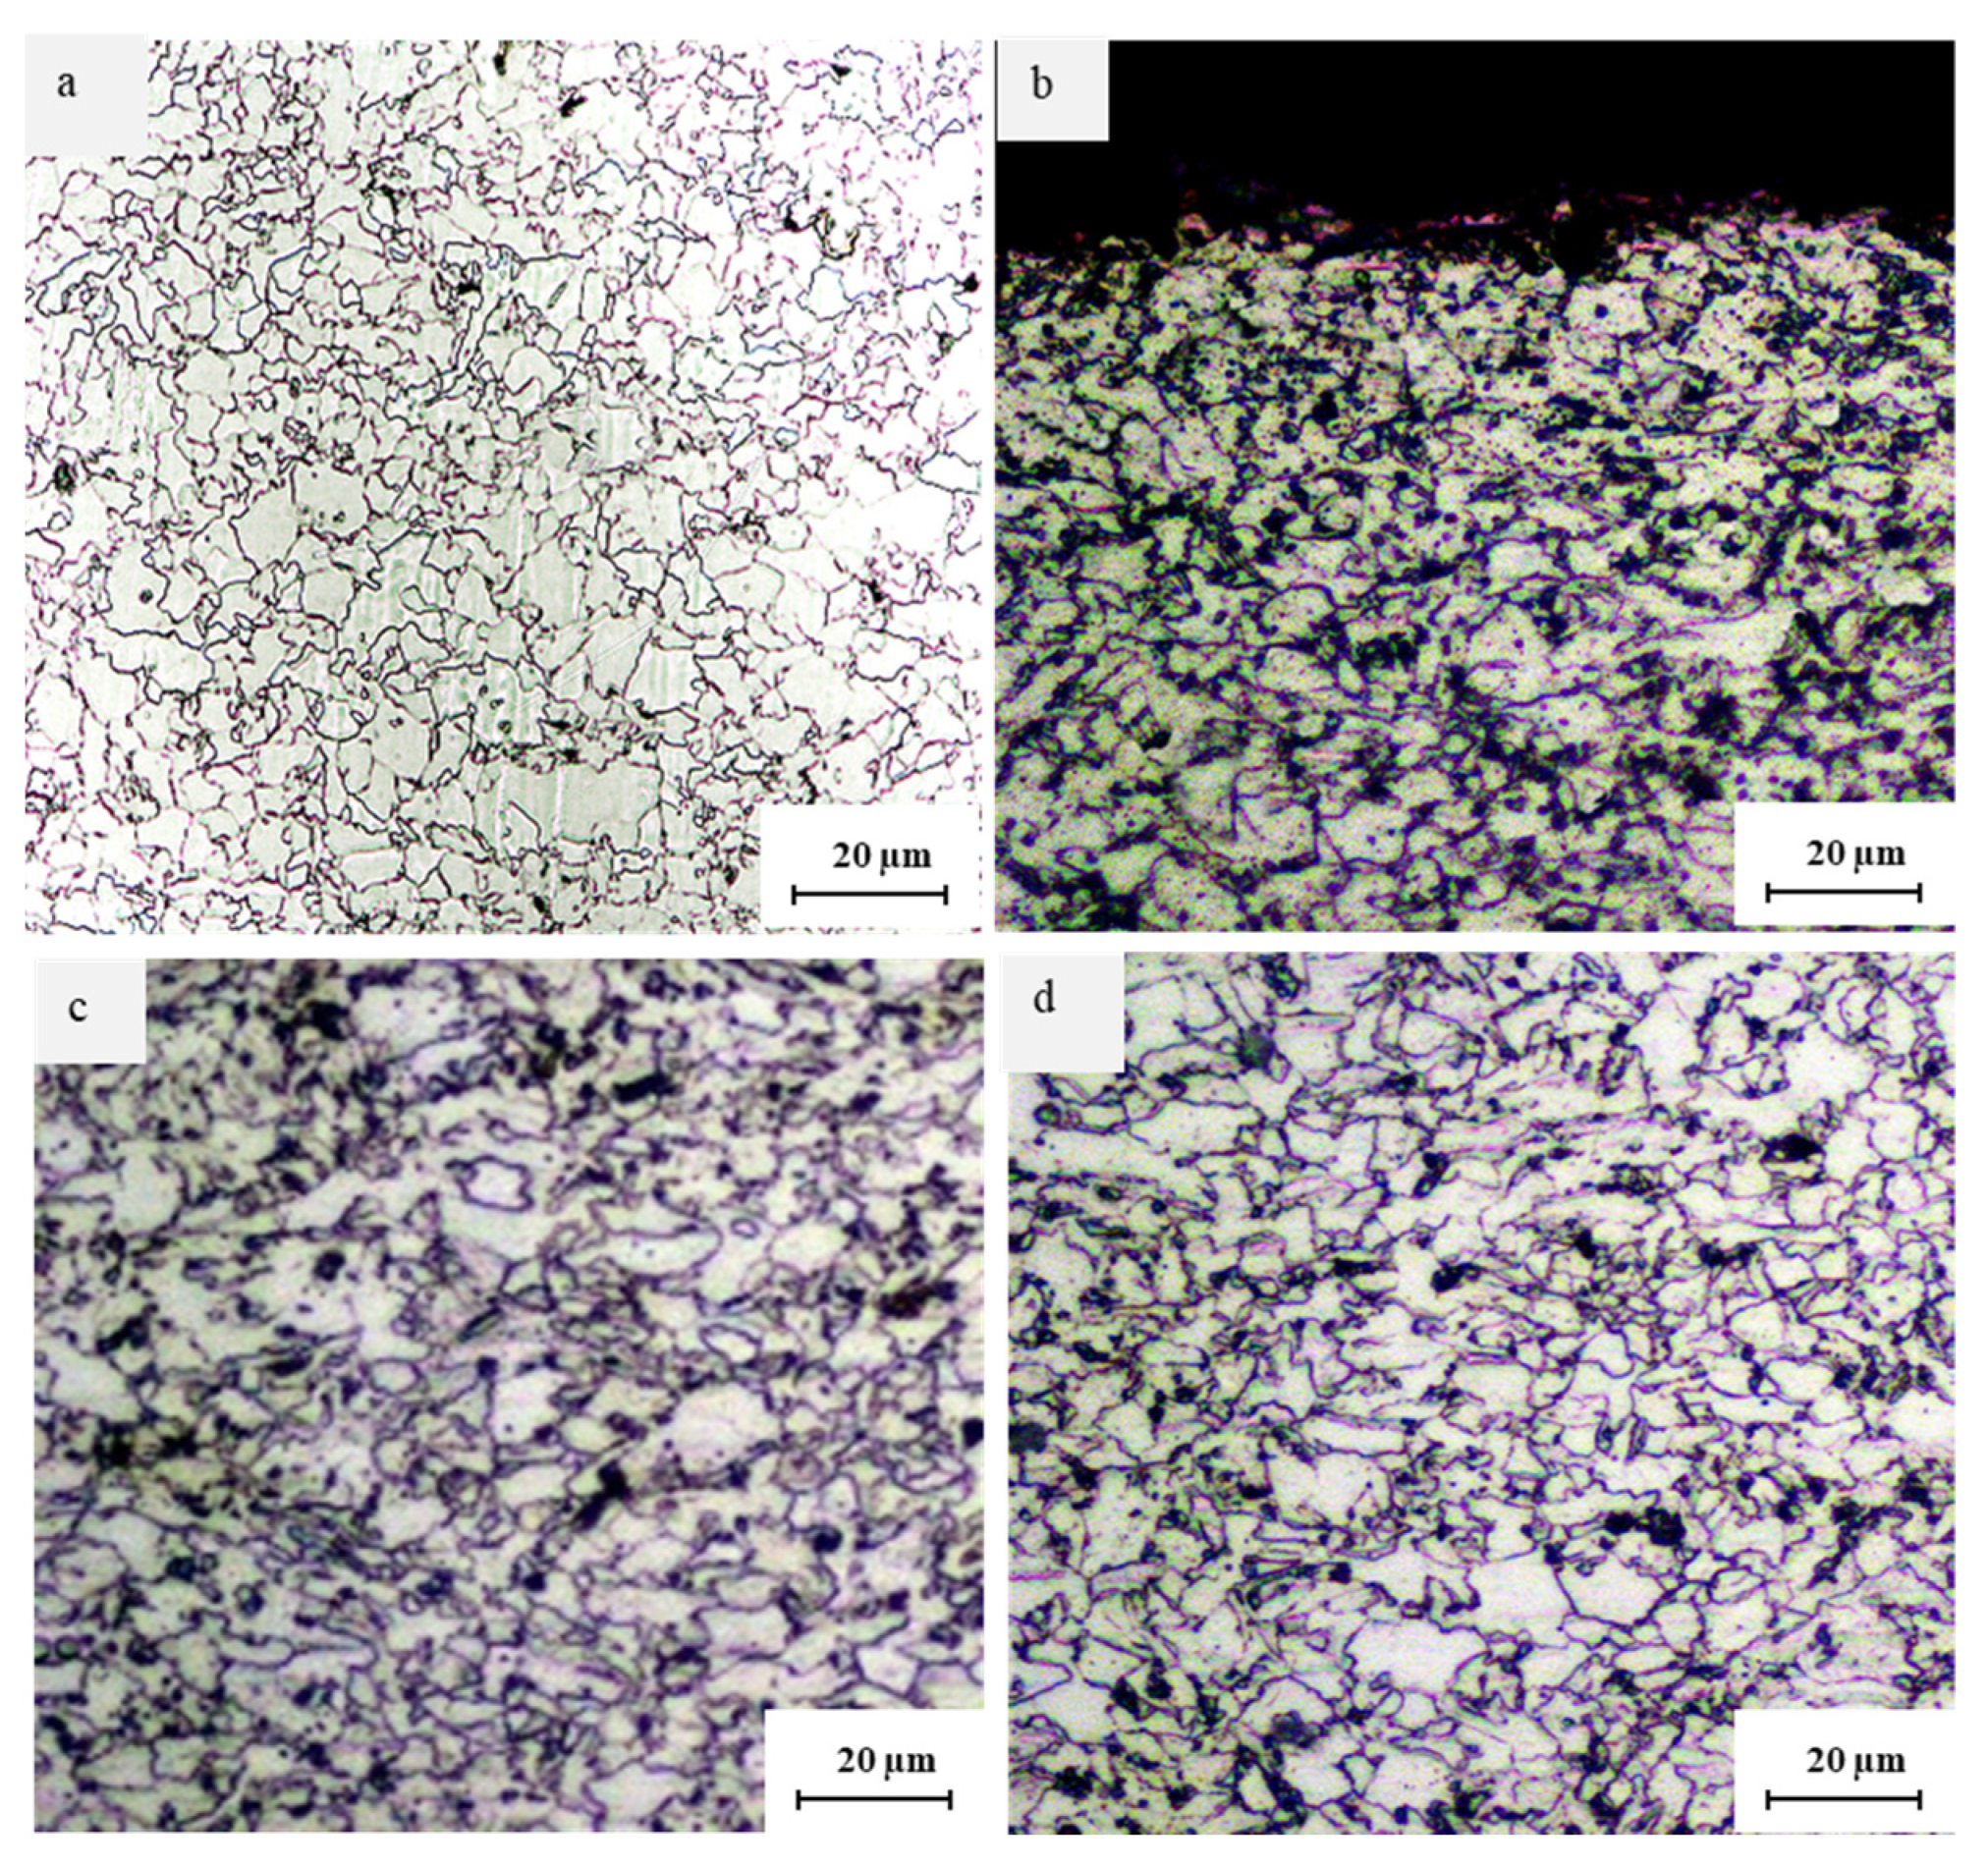
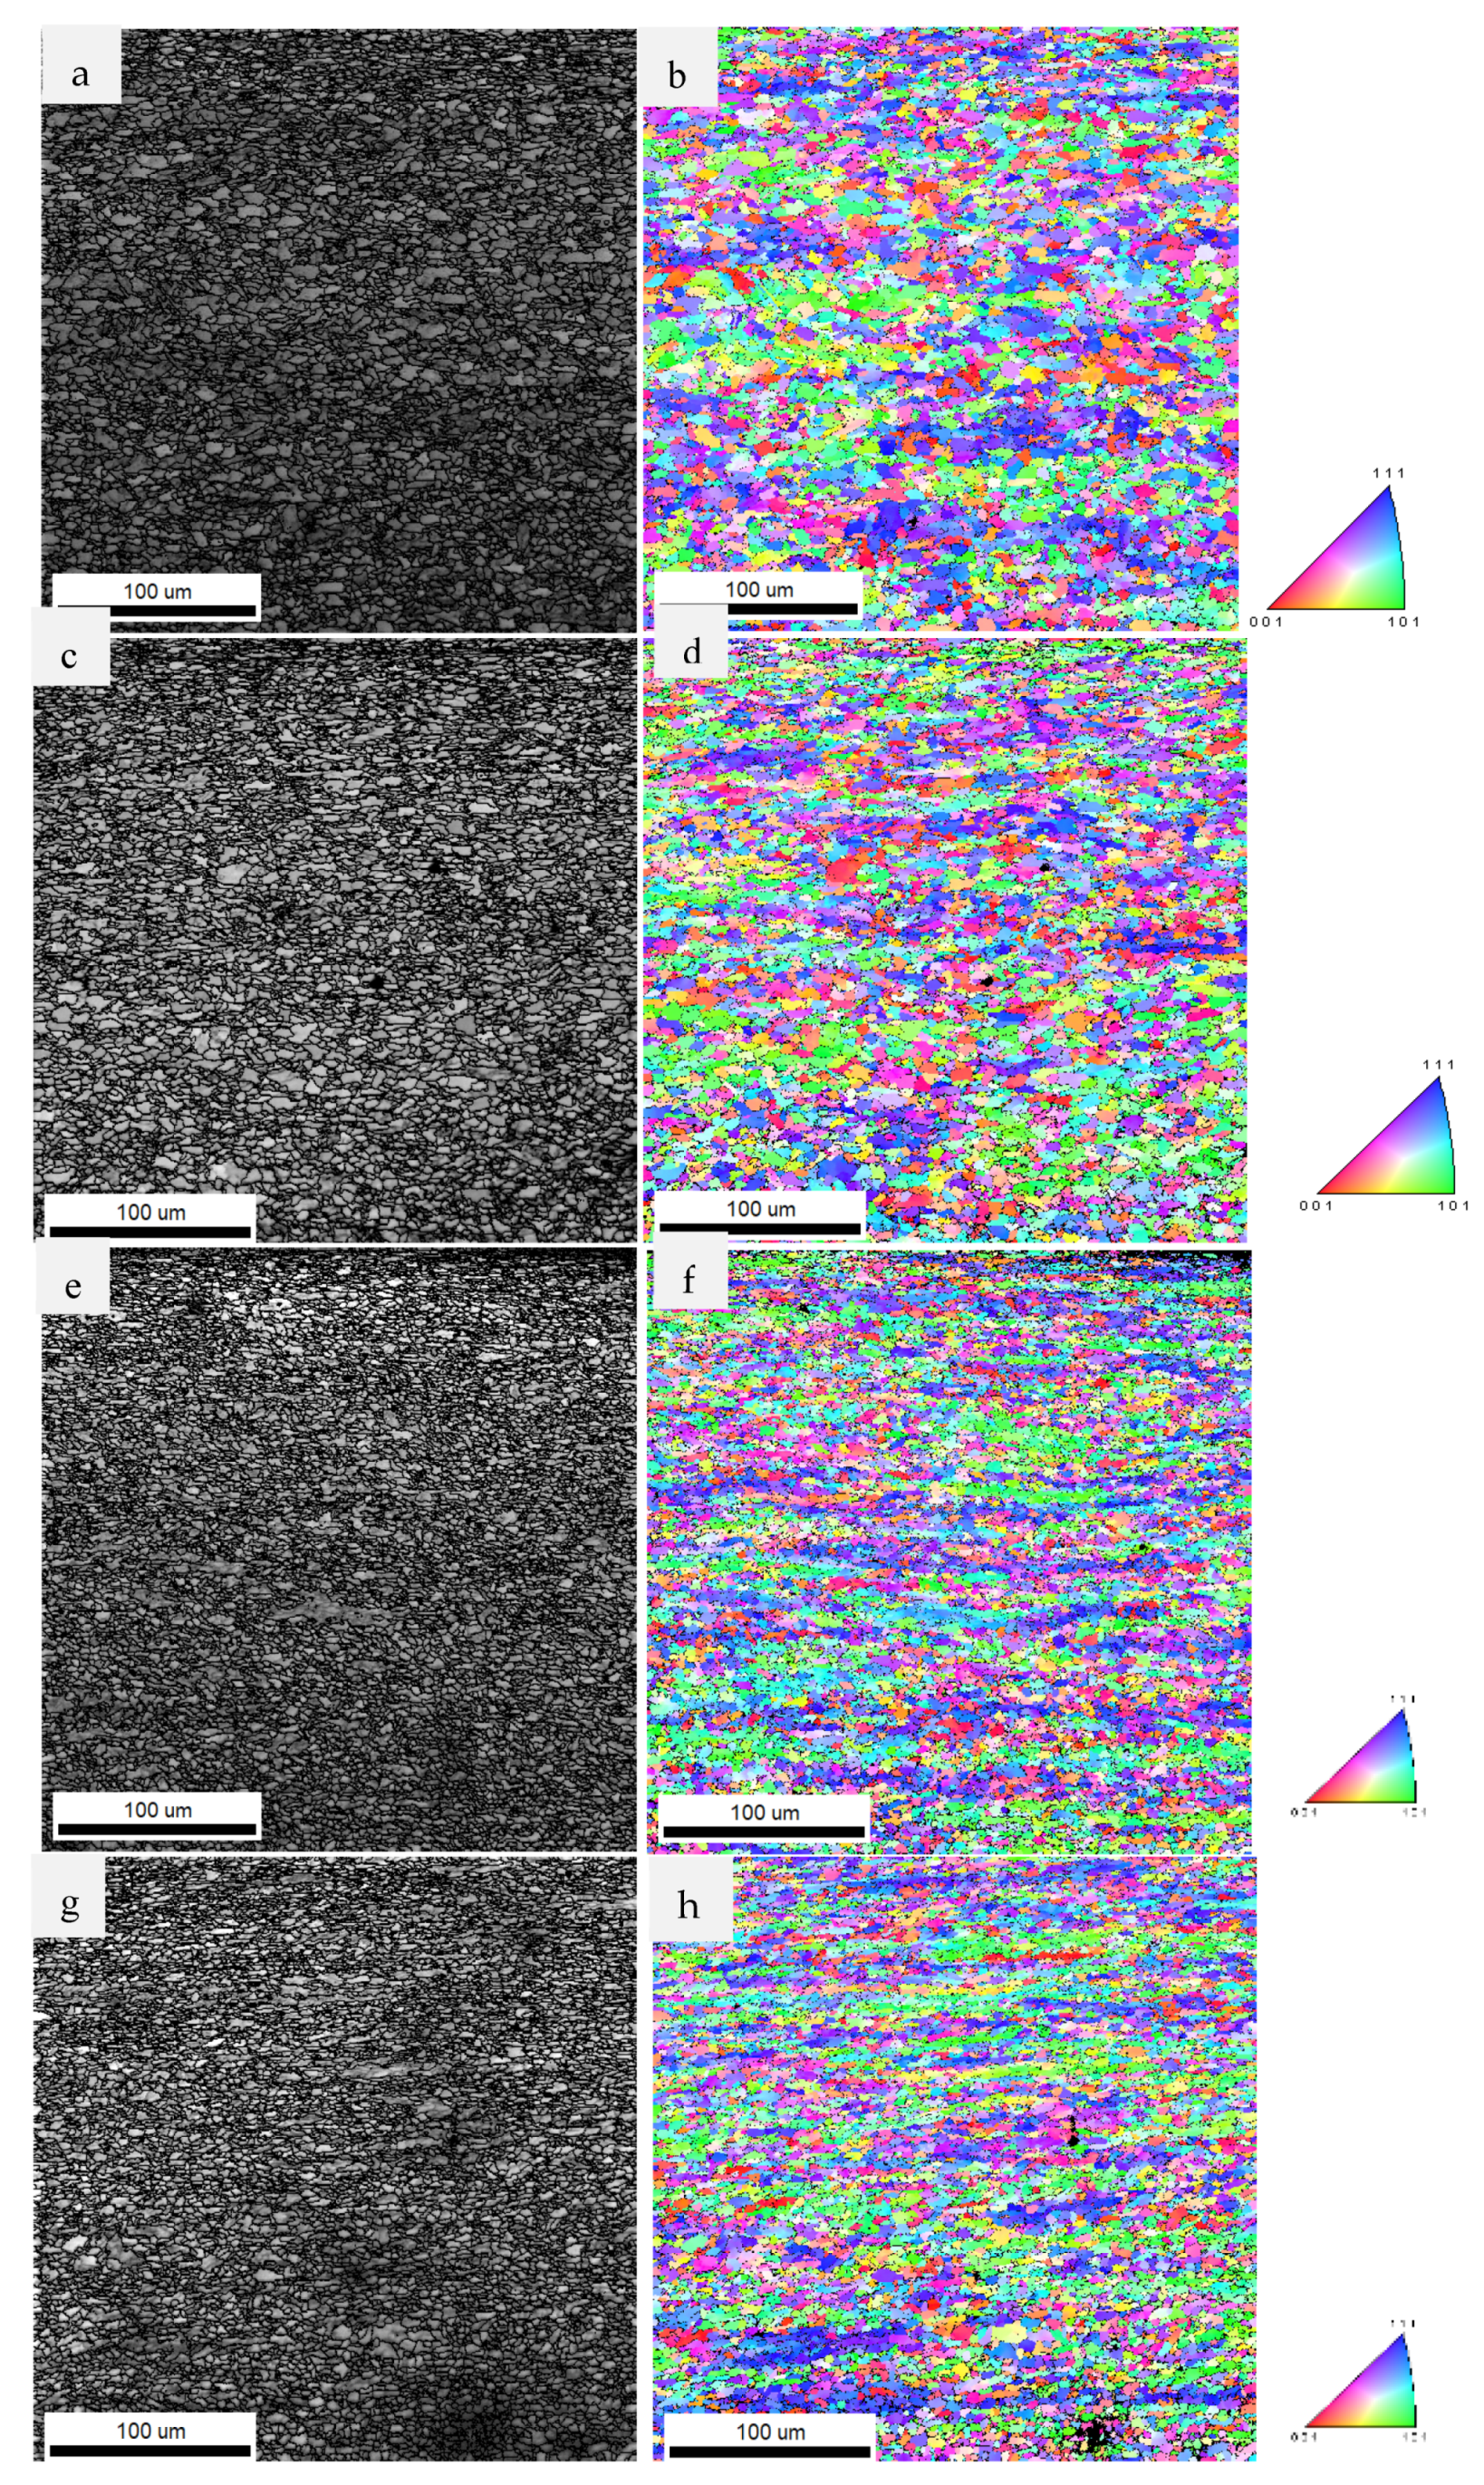
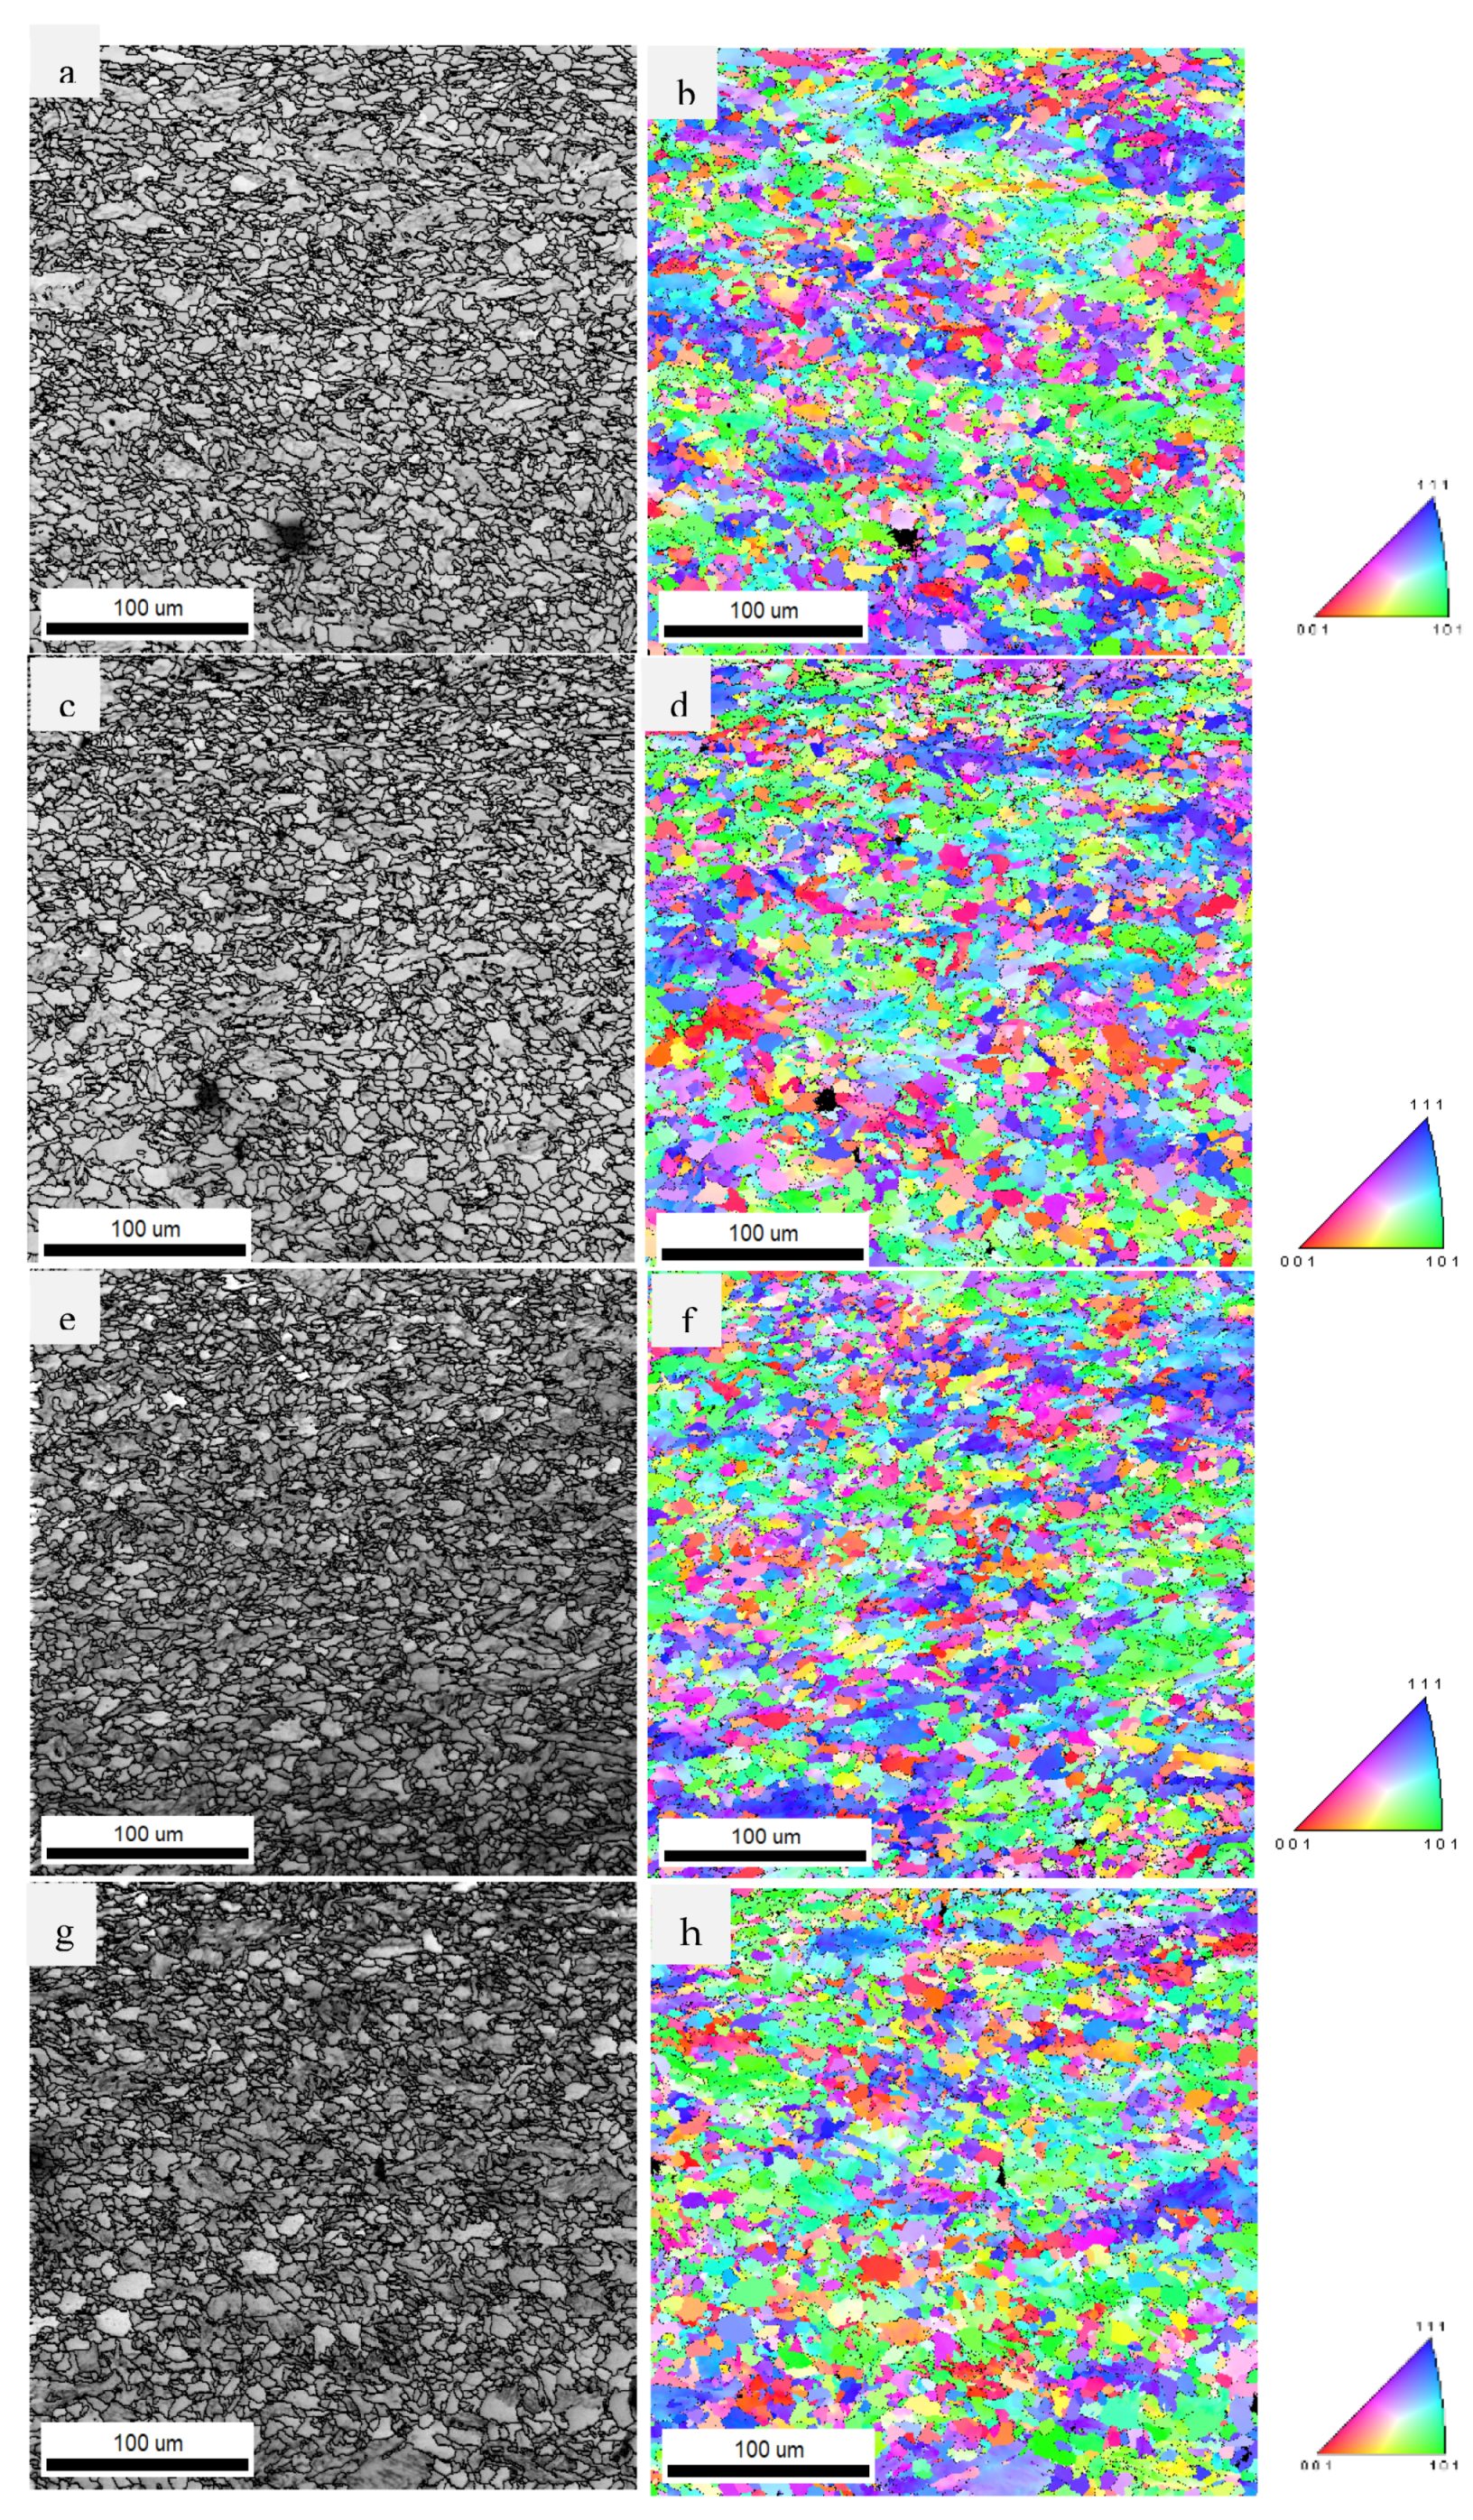
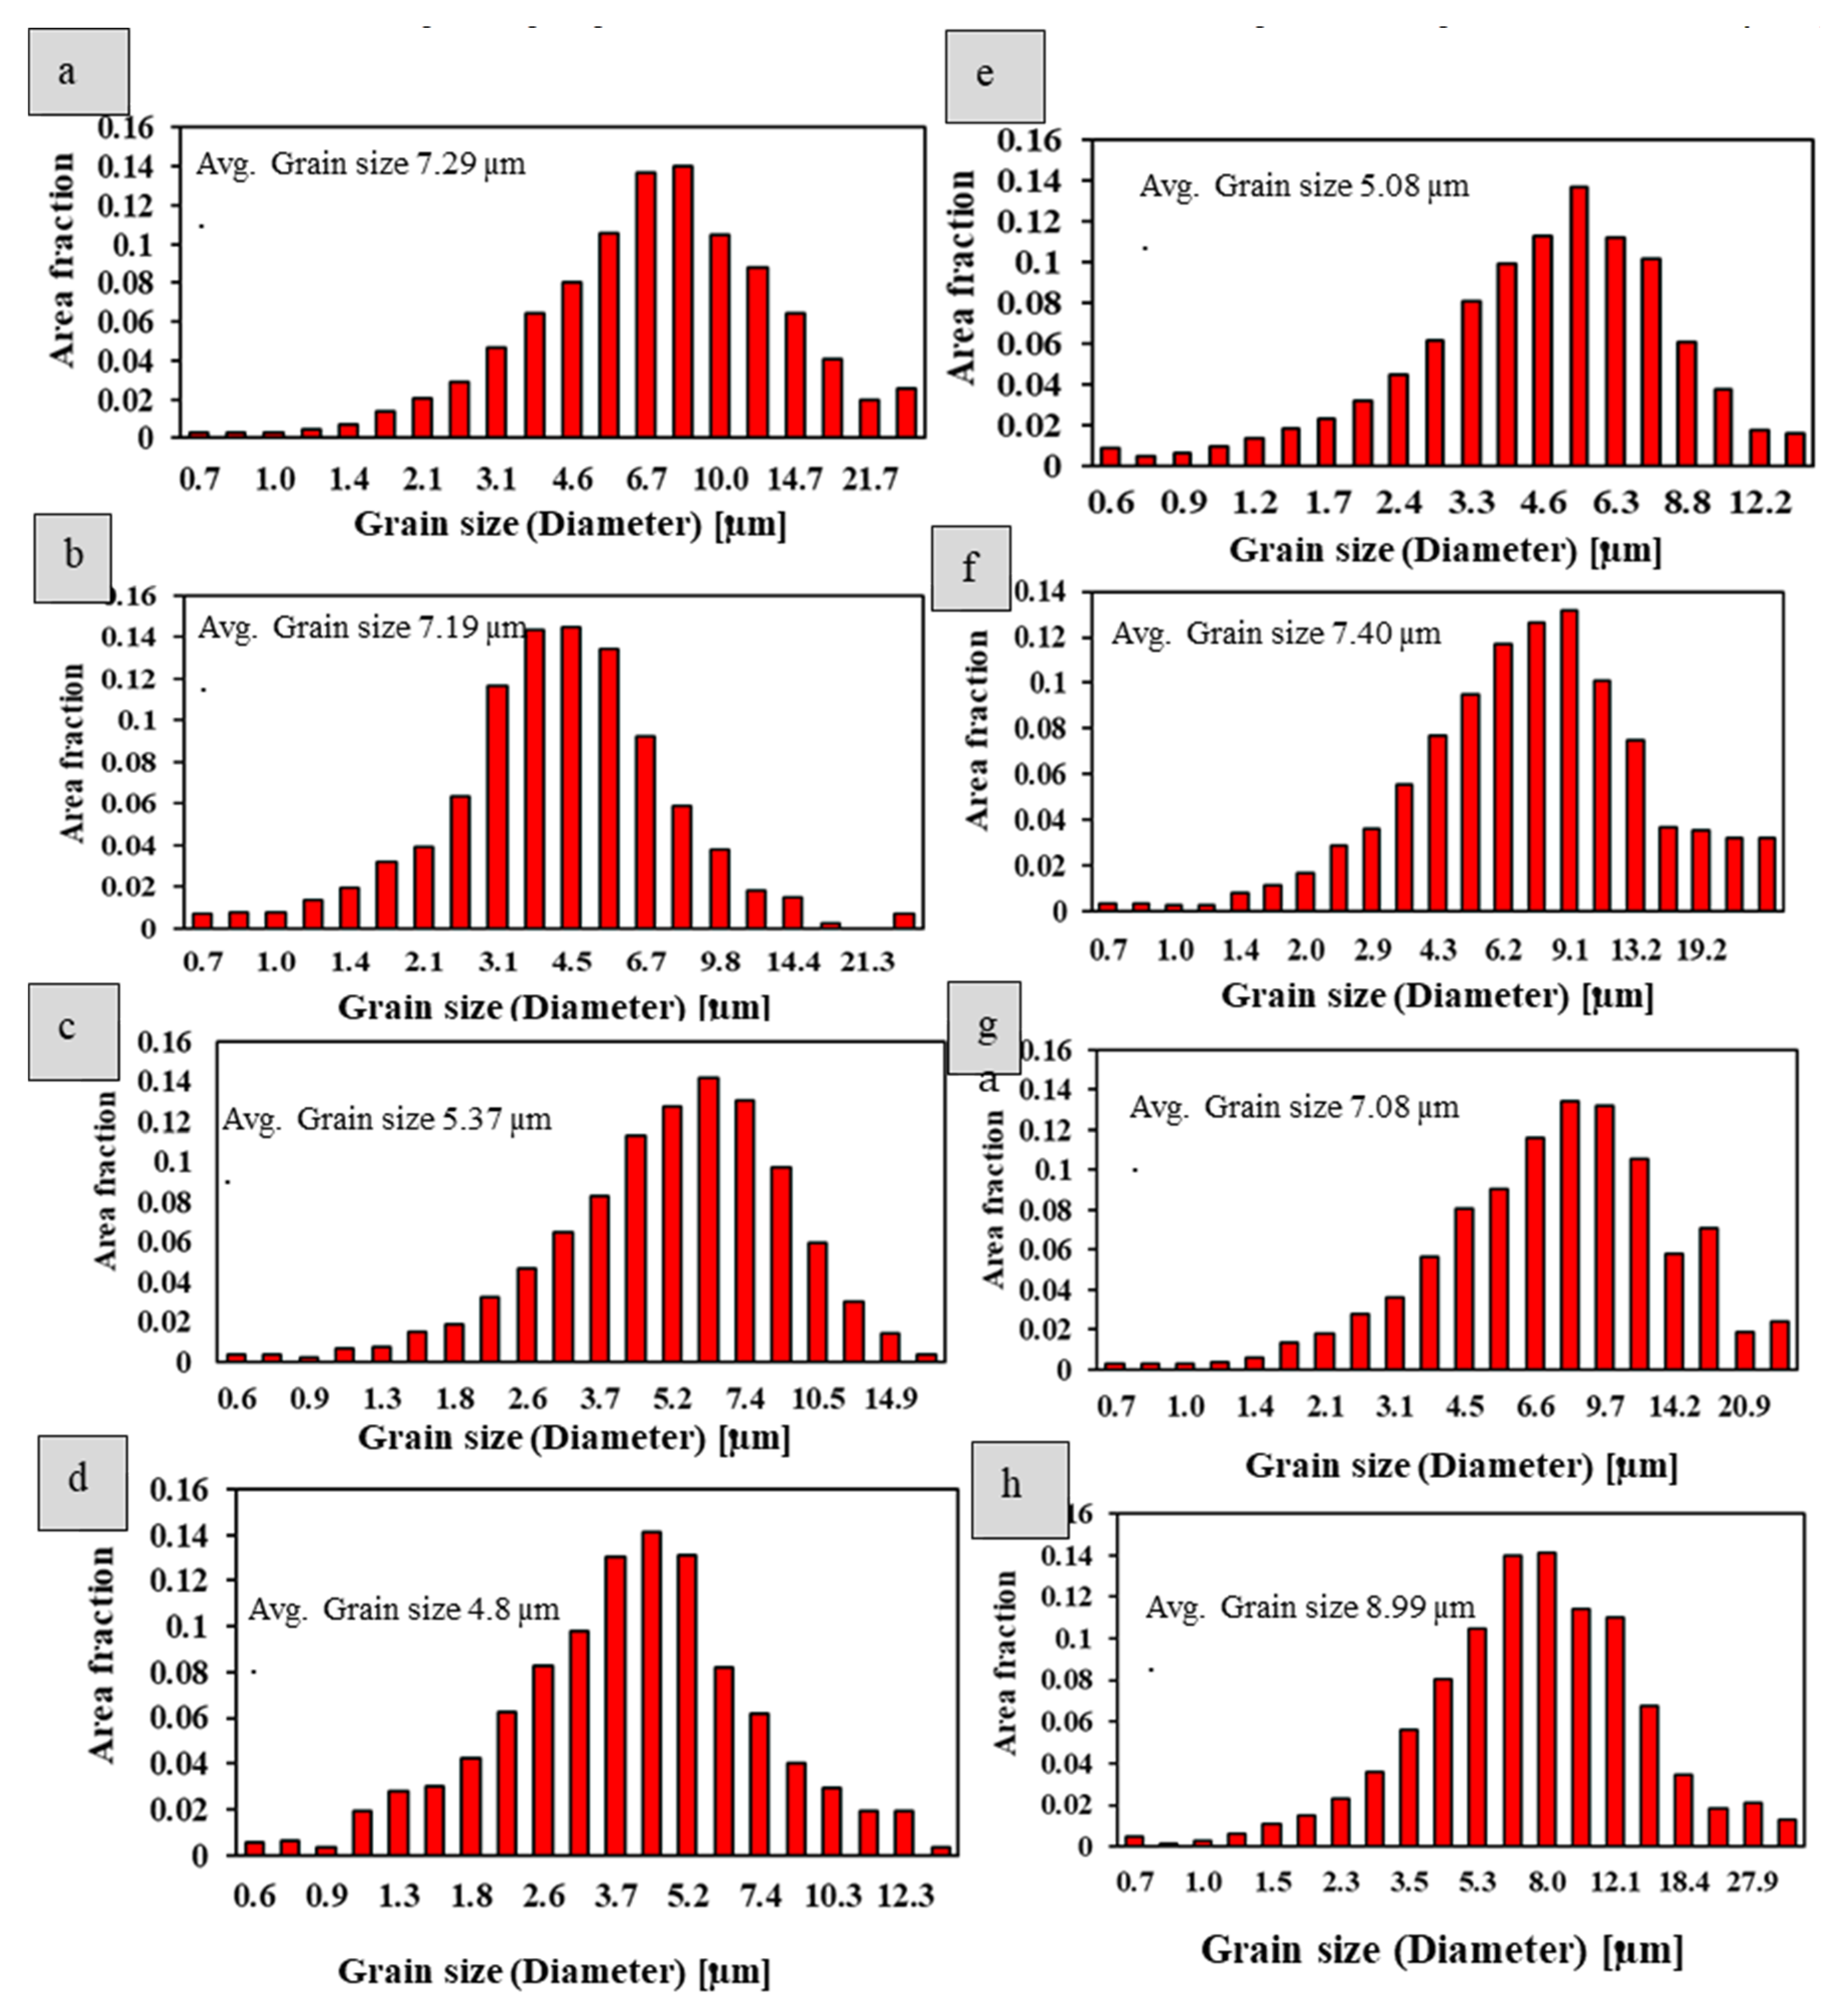
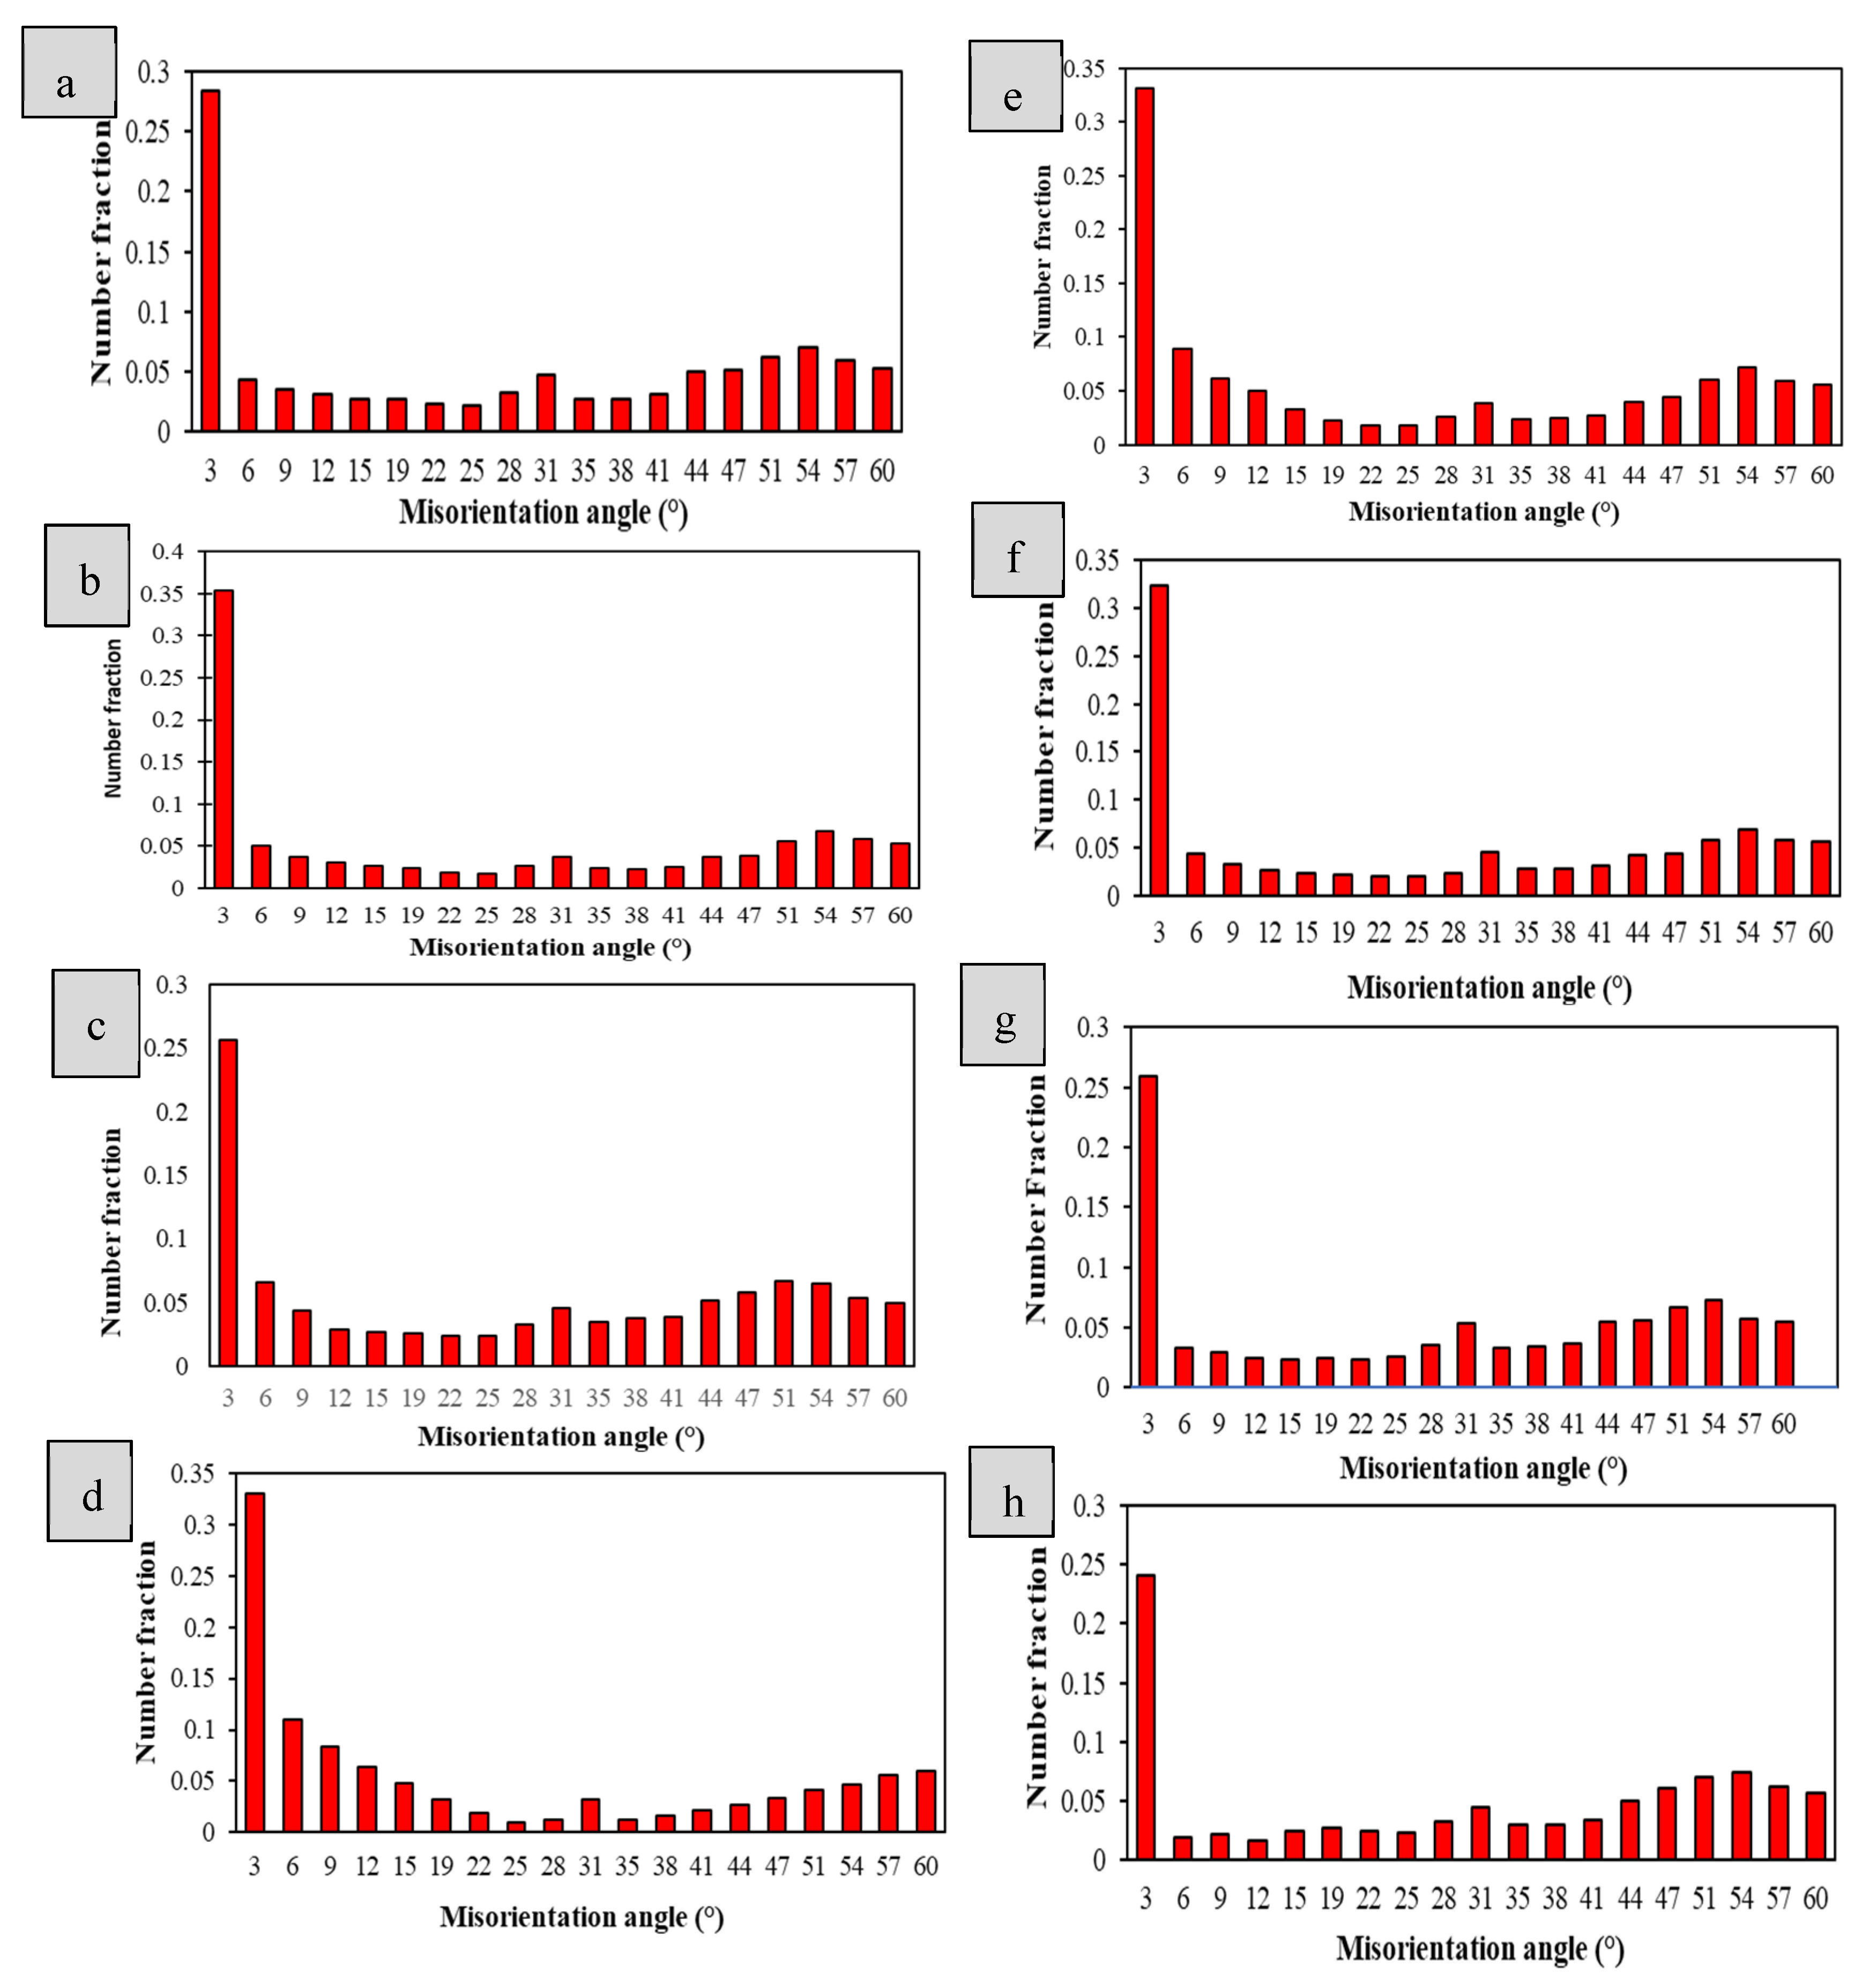
3.2. Microstructural Characterization of LSPwC Sample

Figure 4 presents the optical microstructures of the samples without and with peening. Peening was performed at a wavelength of 1064 nm and an energy density of 9 GW/sq. cm. Figure 4a shows the microstructure of the sample without peening. Figure 4b–d show the microstructure of the peened sample at the subsurface, below the subsurface, and at the midsection location, respectively. The sample after peening has darker etching regions than the unpeened one, indicating the plastic deformation that the peened specimen has undergone. Further, under the same etching conditions, the intensity of etching and the intensity of darkness decrease with increasing depth from the surface, suggesting that the extent of deformation induced by peening decreases with increasing depth from the surface. The results of the EBSD analysis are presented in Figure 5, Figure 6, Figure 7, Figure 8 and Figure 9. The area scanned in the subsurface region of the unpeened and laser-peened samples is about 300 x 300 µm2. Figure 5 and Figure 6 show the image quality (IQ) and inverse pole figure (IPF) mapping of specimens peened with a laser beam of 1064 and 532 nm wavelengths, respectively. After LSP at a 1064 nm wavelength, there was increasing grain refinement with increasing pulse density, as seen from the IQ mapping. In contrast, there was no such refinement after LSP at a 532 nm wavelength. The IPF mapping shows that LSP at a 1064 nm wavelength results in considerable changes in grain orientation; on the other hand, LSP at a 532 nm wavelength was found not to affect the grain orientation. The grain orientation was essentially the same as in the unpeened specimen.
Figure 7 presents the grain size distribution analysis in the subsurface region in the unpeened specimen and specimens peened with 1064 and 532 nm wavelengths. The analysis shows that there is a significant increase in the proportion of smaller grains after peening with a 1064 nm wavelength and that this proportion increases with increasing energy density. The average grain size in the scanned area was found to be 7.19 µm in the unpeened specimen and 7.08, 5.37, 4.8, and 5.18 µm in specimens peened with pulse densities of 3, 6, 9, and 12 GW/sq. cm, respectively. Figure 9 shows the distribution of grain boundary misorientation angles as a function of the wavelength and pulse density. The figure presents the analysis in the form of a histogram, giving the number fraction of different misorientation angles. It emerges that low-angle grain boundaries (misorientation of 2 to 15 degrees) are present to a significant extent in LSP specimens peened with a 1064 nm wavelength. In LSP specimens peened with a 532 nm wavelength, the proportion of high-angle grain boundaries (misorientation angle >15 degrees) is relatively high.

3.3. Microhardness Distribution Analysis

The microhardness distribution as a function of depth is shown in Figure 10. The microhardness measurements were carried out on the LSPwC specimens exposed to the fundamental wavelength (1064 nm) and the second harmonic wavelength (532 nm) at a pulse density of 9 GW/cm2. The microhardness values of the peened specimens were compared with that of the baseline specimen (unpeened specimen). The average hardness magnitudes across the subsurface regions of the unpeened specimens and specimens after LSP at 1064 nm and 532 nm with 9 GW/cm2 are 223.2 HV, 218.7 HV, and 217.6 HV, respectively. From the microhardness results, it is apparent that the LSP specimen at 1064 nm shows a higher trendline value than the baseline specimen and the LSP specimen in the 532 nm condition. The microhardness distribution studies also support the beneficial effect of the compressive residual stress imparted by the 1064 nm wavelength condition.

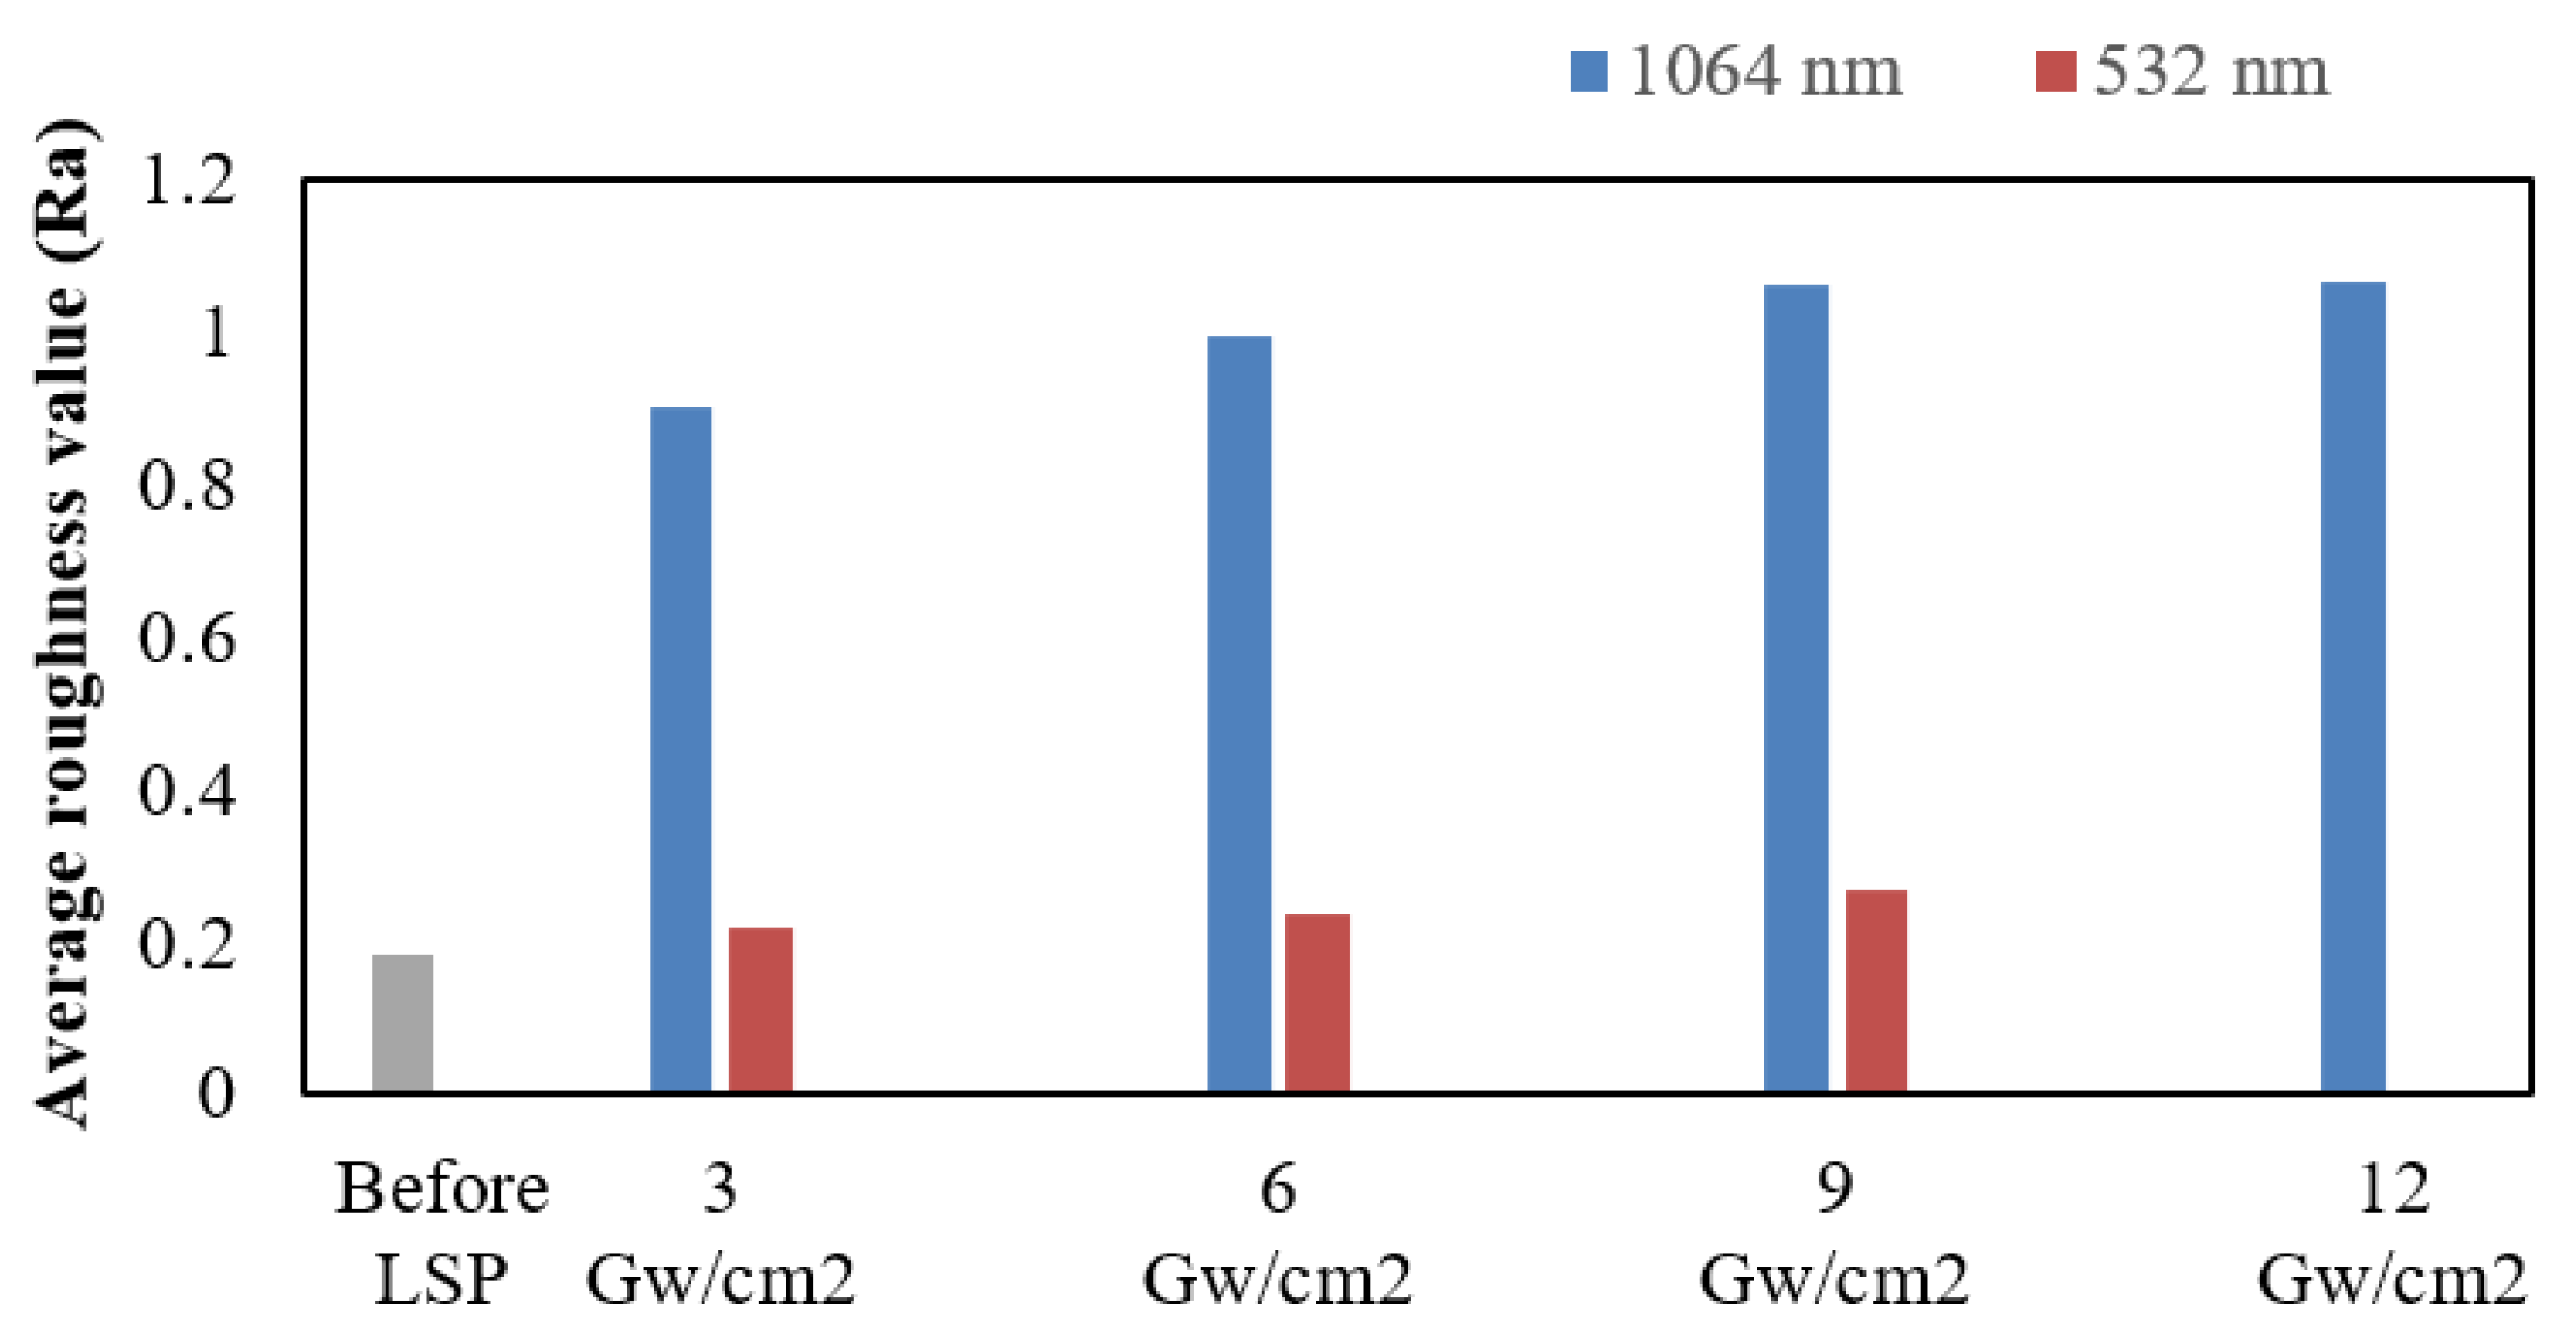
3.4. Surface Roughness Analysis

A surface roughness study was conducted on the laser-shock-peened surface in the fundamental wavelength (1064 nm) and second harmonic wavelength (532 nm) conditions, and the results are given in Figure 11. The average surface roughness values of specimens irradiated with the 1064 nm wavelength at laser pulse densities of 3, 6, 9, and 12 GW/cm2 are 0.899, 0.994, 1.061, and 1.066 μm, respectively. The average surface roughness values of specimens irradiated with the 532 nm wavelength at laser pulse densities of 3, 6, and 9 GW/cm2 are 0.202, 0.228, and 0.264 μm, respectively. In the 532 nm condition, the specimen shows an insignificant increase in the surface roughness value. It is evident from the results that the LSPwC specimen at the fundamental wavelength (1064 nm) shows a higher surface roughness value than the specimen treated with the harmonic wavelength (532 nm).

4. Discussion

4.1. Residual Stress Distribution of LSPwC Specimen at 1064 nm

From the analysis, it is evident that the LSPwC specimen exposed to a 1064 nm wavelength (Figure 2) sufficiently interacted with the material despite its moderate absorption coefficient. In all of these LSPwC specimens, the magnitude of the induced compressive residual stresses was strong at a 50 μm depth, and its intensity consecutively decreased as a function of depth. This is due to the strong shock wave near the laser surface interface, which weakens as it passes through the material [49,50,51,52]. The magnitude of the maximum compressive residual stress is −498 MPa at a 50 μm depth induced by a pulse density of 9 GW/cm2 at a 1064 nm wavelength. The compressive residual stress induced by 3 GW/cm2 reaches the tensile zone at a depth of 500 μm. This implies that the induced compressive residual stress becomes weaker as a function of depth and finally reaches a tensile zone. The residual stress trend shown in Figure 2 illustrates that the magnitude of the induced compressive residual stress increased monotonically with the increase in the laser pulse density from 3 GW/cm2 to 9 GW/cm2 for a 1064 nm wavelength. However, the compressive residual stress induced by a laser pulse density of 12 GW/cm2 was below the compressive stress induced by 9 GW/cm2. Breakdown plasma or secondary plasma generation is responsible for the reduction in the shock wave imparted by 1064nm at a pulse density of 12 GW/cm2 [38,53]. A detailed discussion of secondary plasma generation is provided in Section 4.1.2. It signifies that there is a considerable increase in the shock waves produced by laser pulse densities up to 9 GW/cm2, and it starts to descend at 12 GW/cm2.

4.1.1. Confined Plasma Generation

In this study, confined plasma was generated at the surface of microalloyed steel during laser shock peening without coating (LSPwC). This confined plasma generation intensified the shock waves at the subsurface and achieved considerable plastic deformation with the induction of compressive residual stresses. Dane et al. [54] reported that a high-amplitude shock wave was achieved through confined plasma generation on the metal surface (without coating) using a high-intensity laser beam with a pulse duration of nanoseconds.
In LSPwC, when a laser pulse at a 1064 nm wavelength with energy density >1 GW/cm2 irradiates a metallic material through a transparent overlay (water confining medium), the target material melts and forms high-energy plasma [55]. The plasma is generated by photons on the metallic surface. This generated plasma increases the photon–metal interaction by absorbing the laser energy more effectively without being reflected from the metallic surface throughout the pulse duration. This plasma expands throughout the pulse duration. The hydrodynamic expansion of the plasma is restricted by the surrounding confining medium and forms confined plasma [11,56]. By restricting the confined plasma expansion, the shock wave intensity increased [11,57,58]. The combined effect of the high-velocity impingement of photons and confined plasma generation induces a high-intensity pressure pulse (shock wave) for a shorter duration. Due to the shock wave, pulse pressure or stress is created, and it propagates toward the material. If the exerted stress exceeds the yield strength of the material, plastic deformation occurs in the subsurface region [11,40,41,43,55]. This plastic deformation alters the microstructure in the subsurface region and, therefore, the mechanical properties. As a result, compressive residual stress is developed due to microstructural dislocations (Figure 4b). In this study, the cross-sectional micrograph of the laser-peened specimen at a 1064 nm wavelength shows significant plastic deformations in the subsurface region, which is shown in Figure 4. This plastic deformation is due to the exerted pulse pressure or stress induced by the shock waves.

4.1.2. Secondary Plasma Formation

The breakdown plasma is considered a major limitation of the laser shock peening underwater confinement system [55]. This breakdown plasma attenuates a considerable amount of the incident laser pulse and reduces the laser energy to reach the confined plasma that forms at the target surface [53,55]. The breakdown plasma is induced after a certain threshold limit of the laser pulse density. The residual stress distribution profile shown in Figure 2 indicates that the threshold limit is 12 GW/cm2 (the compressive stress value is suppressed below 9 GW/cm2). Berthe et al. [59] reported a similar finding of a consecutive increase in shock wave pressure using laser pulse densities up to 10 GW/cm2 in the water confining medium. In that study, the laser pulse with an IR wavelength was saturated at a laser pulse density of 10 GW/cm2, which induced 5 GPa pressure in the specimen in the water confining medium.
The breakdown plasma or secondary plasma is generated by ionization caused by photons. The ionization caused by photons leads to an increase in the number of free electrons. If the free electrons exceed a certain range (1018 to 1020 cm−3), breakdown occurs [53]. The generated free electrons reach a critical limit at the critical pulse density. Above the critical pulse density (above 10 GW/cm2) [59], the breakdown plasma attenuates the incident laser pulse, which is called the transmission cut-off. This explains the reduction in the compressive residual stress at a power density of 12 GW/cm2.

4.2. Residual Stress Distribution of LSPwC Specimen at 532 nm

The residual stress distribution profile of the 532 nm wavelength (Figure 3) shows that the stress distributions mostly exist in the tensile zone. The maximum compressive residual stress is 6 MPa at a 200 μm depth with a laser pulse density of 9 GW/cm2. The low compressive residual stress induction shows that the shorter wavelength (532 nm) is ineffective on the microalloyed steel specimen. The 532 nm wavelength (green) had the lowest absorption coefficient as it passed through the water confining medium [55]. Therefore, the intensity of the electromagnetic radiation is unaffected. As a result, the laser–material interaction is severe, and the radiation reaches a greater penetration depth than 1064 nm radiation. In this condition, the thermal effect at the surface is restricted by the water confinement system, which effectively dissipates heat. However, the thermal effect in the subsurface region persists, which results in thermal softening that affects the residual stresses and mechanical effects, such as plastic deformation, grain boundary refinement, etc., induced by the shock waves. The interaction between thermal and mechanical effects is called a thermo-mechanical effect. The formation of the thermal softening zone is significant at 532 nm, which is due to the high thermal interference at the subsurface; there is a complete elimination of the induced compressive residual stress, which is reflected in the residual stress profile and microhardness profile of the LSPwC specimen in the 532 nm wavelength condition, as shown in Figure 3 and Figure 10.

4.3. Tensile Residual Stress at the Surface of Laser-Shock-Peened Samples

The surface of an LSPwC specimen typically has tensile residual stresses at the surface, which is due to the temperature effect of confined plasma formation [54]. Applications that demand a higher fatigue life rely on compressive residual stress at the surface, which plays a significant role in arresting crack nucleation and propagation [60,61,62,63,64,65]. To prevent this detrimental effect, the tensile zone should be narrowed down, or a thermal protective coating should be employed. From the graphs shown in Figure 2 and Figure 3, the accumulation of tensile residual stress at the surface at the 1064 nm wavelength is higher than that at the 532 nm wavelength. The average tensile residual stresses at the surface at 1064 nm and 532 nm wavelengths are +255 MPa and +220 MPa, respectively. This shows that the surface thermal expansion is slightly higher with laser shock peening in the 1064 nm condition than in the 532 nm condition. As discussed earlier in Section 3.1, the 1064 nm wavelength (near-IR) had a moderate absorption coefficient with the water confinement system [55]. Even then, it sufficiently interacted with the metal surface and formed largely confined plasma with the target surface, which affects the penetration depth of electromagnetic radiation. This results in insignificant thermal effects at the subsurface, and there may not be much change in the thermally affected region (thermal softening) under the surface at various pulse densities.

4.4. Microstructural Analysis

The optical micrographs of the LSPwC specimen with a 1064 nm wavelength and a 9 GW/cm2 laser pulse density (Figure 4b–d) give an indication of plastic deformation, with the degree of deformation decreasing as one moves from the subsurface to the midsection location.
The inverse pole figure (IPF) map represents the crystal orientation at the scanned surface using an RGB color legend or IPF legend. In this analysis, three different color codings were used to represent the crystallographic planes, with (0 0 1) as red, (1 1 1) as blue, and (1 0 1) as green. Figure 5 shows the IPF mapping of LSP samples at 1064 nm. The figure shows that there is a significant change in crystal orientation due to peening; this is a consequence of the accumulation of plastic deformation [7,51]. The IPF mapping after LSP at 1064 nm indicates that there is an increase in the proportion of {111} planes parallel to the surface with the laser pulse density. On the other hand, the IPF mapping of the LSP specimens at 532 nm shown in Figure 6 indicates that there is essentially no change in the grain orientation.
The grain size distribution analysis (Figure 7a–e) in the subsurface region of the LSP specimen in the 1064 nm condition shows that there is considerable grain refinement, and it increases progressively with the energy density. This indicates that the proportion of smaller grains (size 1.38–6.3 µm) increases with the increasing energy density of the laser (3, 6, 9, and 12 GW/cm2). The grain size distribution analysis of the specimen peened with the second harmonic wavelength (532 nm), in contrast, indicates that there is no grain refinement; in fact, there is some degree of grain coarsening. This may be attributed to recrystallization due to the involvement of high temperatures. The average grain size plot is shown in Figure 8. The absence of grain refinement with 532 nm peening is in line with an insignificant level of compressive residual stresses imparted when peened at this wavelength.
Figure 9 shows the distribution of misorientation angles of grain boundaries in the laser-processed specimens. This angle is defined as the minimum angle needed for a grain boundary to coincide with the adjacent grain boundary or a crystal lattice [51]. Based on the misorientation angle, the grain boundaries are classified as low-angle grain boundaries (2 < ϴ < 15°) and high-angle grain boundaries (>15°). The formation of low-angle grain boundaries is due to the addition of dislocations, and it further restricts the dislocation motion, whereas high-angle grain boundaries tend to slide and promote dislocation motion. The volume fraction of low-angle grain boundaries is significant in the LSP specimen in the fundamental wavelength condition (1064 nm), particularly at 9 GW/cm2. This indicates that there is a high degree of plastic deformation imparted to the material in this particular laser shock peening condition. The high-volume fraction of high-angle grain boundaries (>15°) in laser shock peening in the 532 nm condition is believed to be due to the recrystallization process triggered by high-temperature involvement.
The heavily deformed microstructure (Figure 4b) and the grain refinement in the subsurface region observed in the specimen irradiated with a 1064 nm wavelength at 9 GW/cm2 are in line with the high degree of compressive residual stress imparted after peening with these parameters [18,66]. No grain refinement was observed after peening with a 532 nm wavelength and 9 GW/sq.cm; the density of low-angle grain boundaries was also low. These observations point to the inability of peening with these parameters to induce plastic strain in the subsurface region. Softening occurring due to the high temperature coming into the picture after peening under these conditions leads to recrystallization and some grain growth.

4.5. Microhardness Analysis

Figure 10 shows the microhardness distributions of the laser-peened and unpeened samples across the subsurface region as a function of depth. The microhardness magnitude of the specimen irradiated with the 1064 nm wavelength at 9 GW/cm2 signifies that (1) there is a significant increase in hardness magnitude, indicating a grain size reduction (Hall–Petch relation), (2) the effect of thermal softening due to the laser–metal interaction is insignificant at 9 GW/cm2, and (3) there are no changes in the anisotropic properties.
Figure 10 shows the microhardness profile of a specimen irradiated with a 532 nm wavelength, which signifies that (1) there is a reduction in the hardness magnitude, which indicates insignificant grain refinement, and (2) thermal softening is observed until a depth of ̴2.4 mm (2400 μm). Here, the magnitude of the microhardness trendline lies below the reference trendline value (unpeened specimen). The reduction in the hardness magnitude (thermal softening) is due to grain-coarsening effects. The microhardness analysis confirms that the grain-coarsening phenomenon is caused by the grain size distribution analysis of the LSPwC specimen irradiated with 532 nm at 9 GW/cm2, as shown in Figure 7h.

4.6. Surface Roughness Measurement

Average roughness (Ra) measurements were carried out on the surface of LSPwC specimens exposed to radiation of 1064 nm and 532 nm wavelengths, and the result is presented in Figure 11. In general, LSPwC results in a significant rise in the roughness of the material surface [20,62,67]. It is clear from Figure 11 that the peened specimen at the fundamental wavelength (1064 nm) shows a higher surface roughness value than the specimen treated with the harmonic wavelength (532 nm). This is due to the higher absorption coefficient of the 1064 nm wavelength as it passes through the dielectric medium (water confinement layer) compared to that of the 532 nm wavelength [52]. As a result, the predominant amount of heat is dissipated at the surface by the 1064 nm wavelength, which is prone to surface damage due to the thermo-mechanical interaction between the laser and the metallic surface [47,49]. It is apparent from the results that there is a monotonic increase in the surface roughness with the pulse density for the case of irradiation with 1064 nm. This is because of the increased surface ablation of the treated surface, which is a common phenomenon in the LSPwC process [49].

5. Conclusions

In this research study, the appropriate wavelength (between 1064 nm and 532 nm) and pulse density (3, 6, 9, and 12 GW/cm2) that impart the optimal compressive residual stress in microalloyed steel are identified for the LSPwC technique. Laser-treated samples were characterized to measure their residual stress, microstructure, microhardness, and surface roughness. The key findings of this work are as follows:
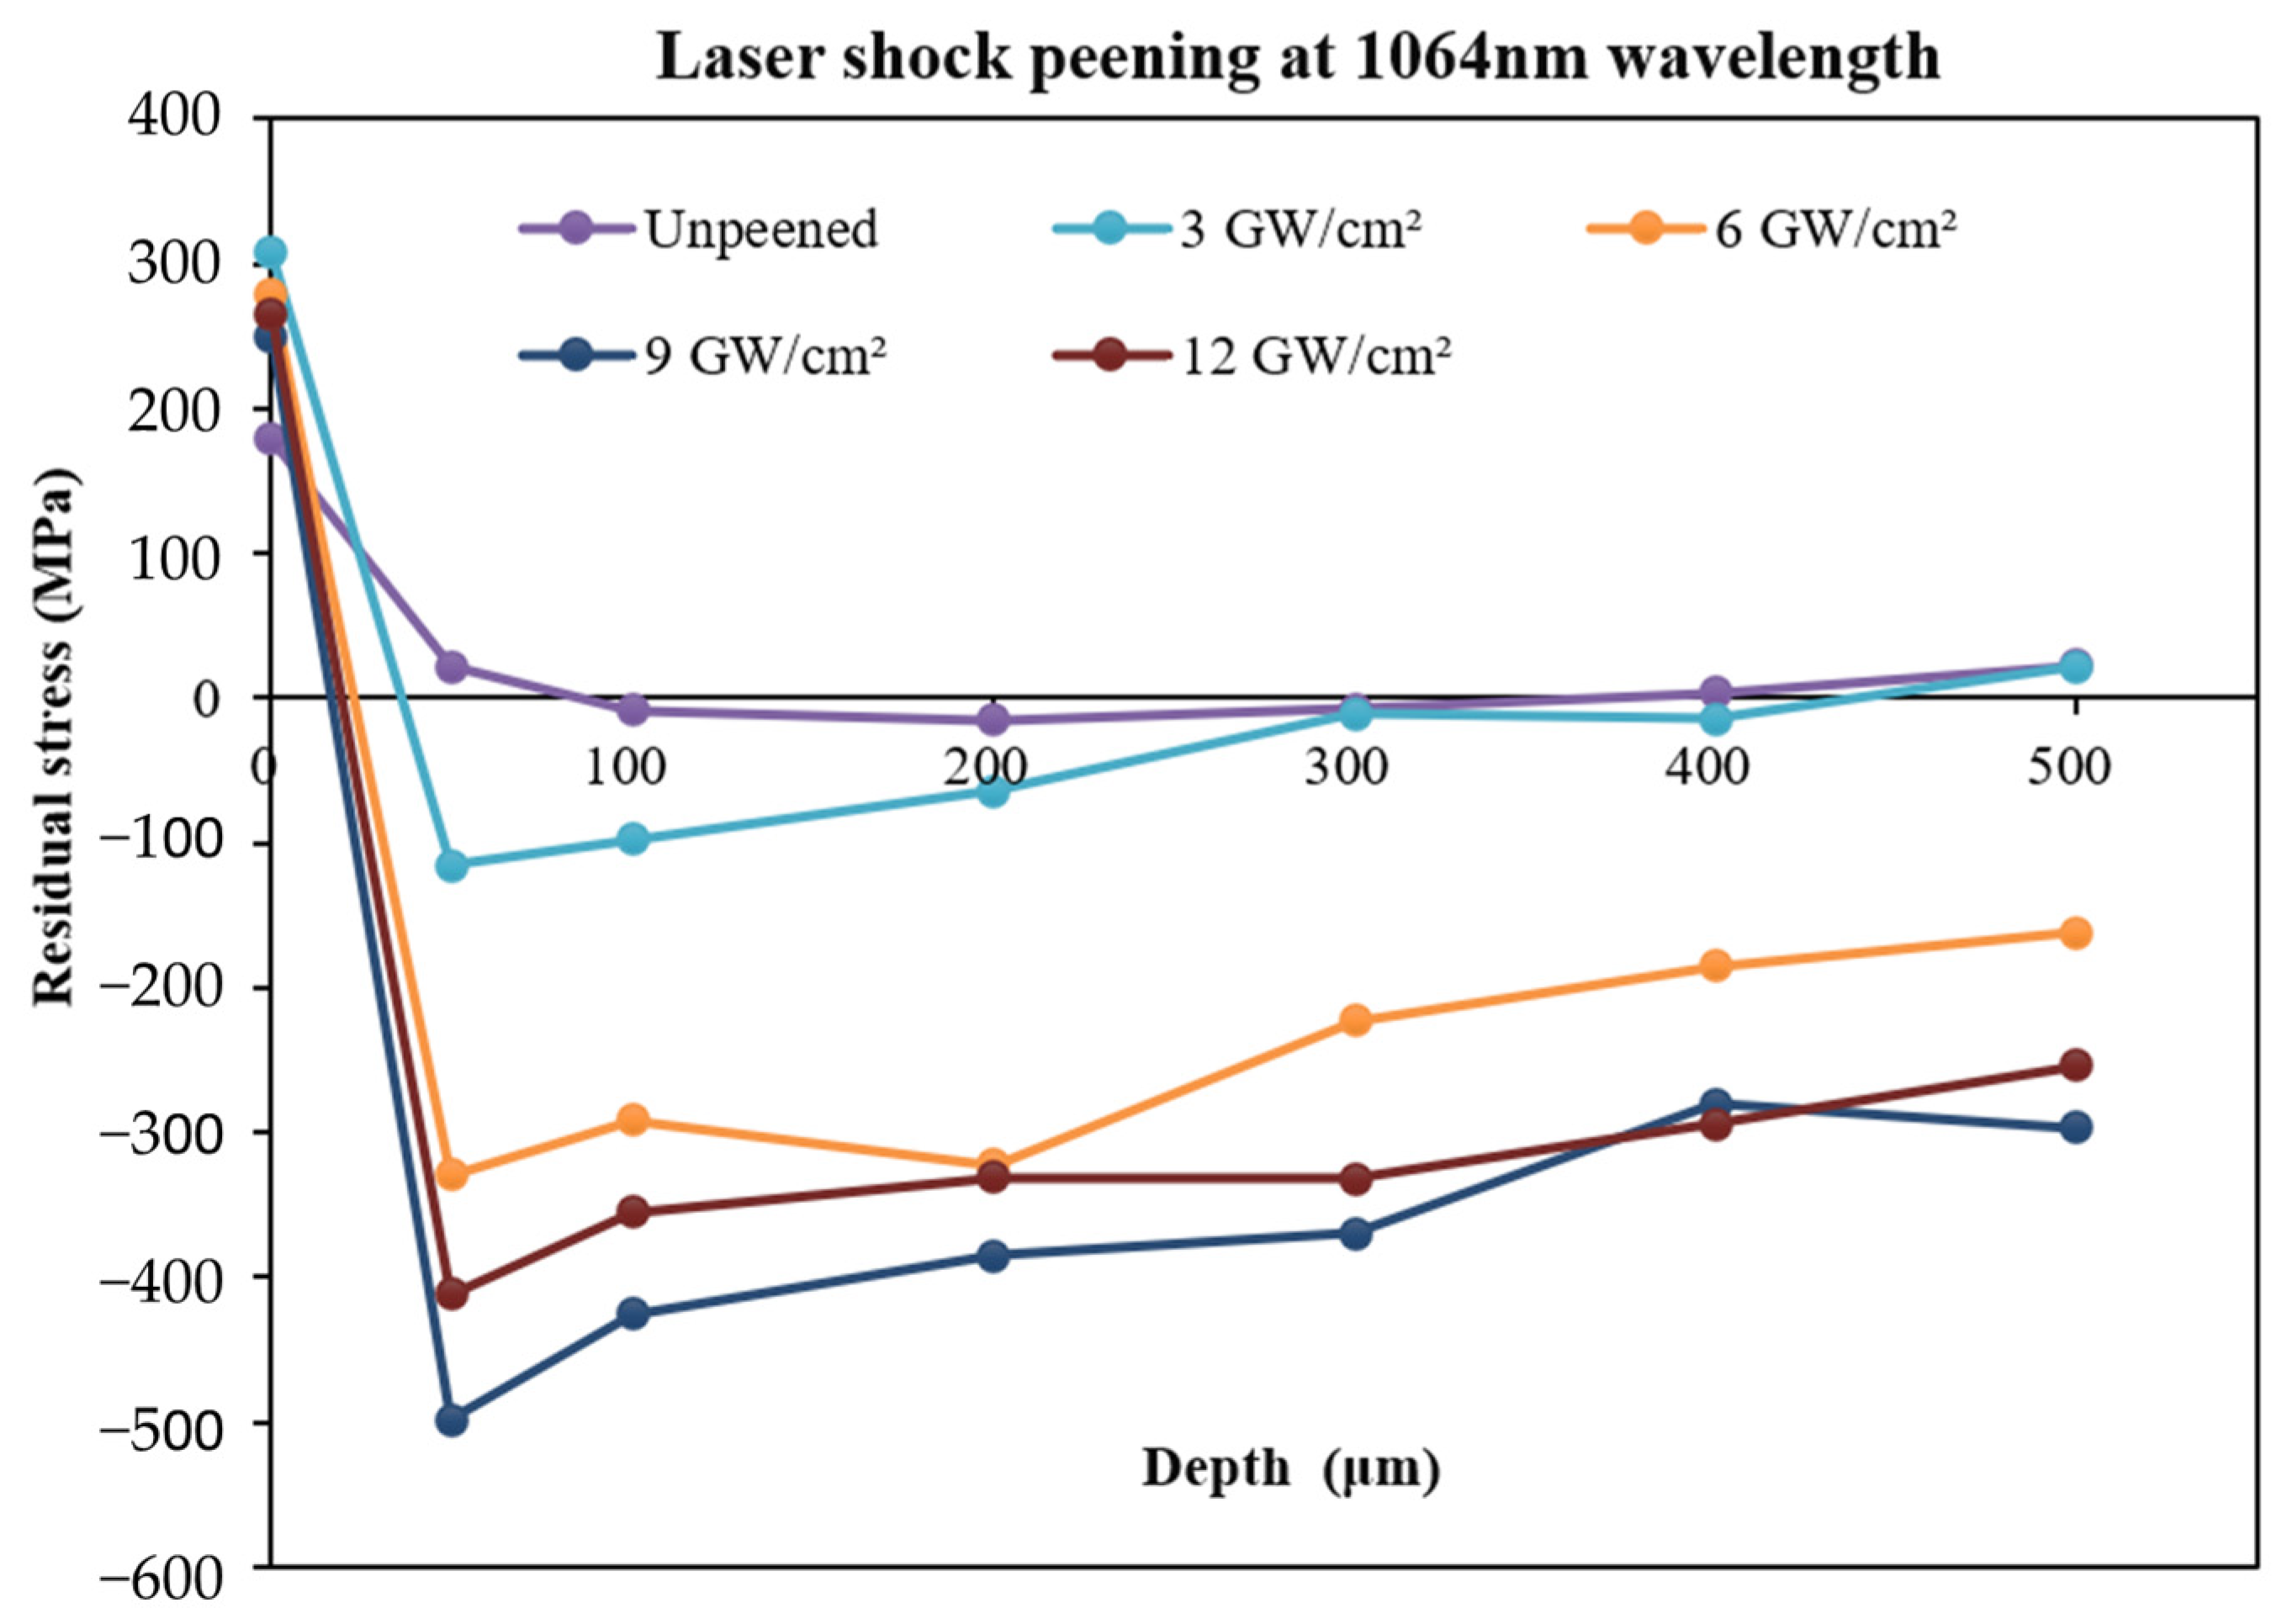
  • The residual stress depth profile shows that there is a substantial induction of compressive residual stress in the laser-processed samples at the 1064 nm wavelength and pulse densities of 3, 6, 9, and 12 GW/cm2. The maximum compressive residual stress of −498 MPa was attained at a laser pulse density of 9 GW/cm2 and the fundamental wavelength (1064 nm).
  • Laser shock peening at the fundamental wavelength (1064 nm) reveals that there is a progressive increase in the compressive stress intrusion with the pulse density up to 9 GW/cm2, and then it declines at 12 GW/cm2. The peak compressive stress is accumulated at a 50 µm depth in all of the laser-shock-peened samples at the fundamental wavelength (1064 nm).
  • Tensile residual stresses of comparable magnitude were also observed at the surface of the LSPwC specimen in both wavelength conditions (1064 and 532 nm). The average tensile residual stresses at the surface induced by 1064 nm and 532 nm wavelengths are +255 MPa and +220 MPa, respectively. This change in magnitude is due to the difference in confined plasma generation at the laser–metal interface.
  • The EBSD analysis shows that there is considerable grain refinement and an increase in the density of low-angle grain boundaries after laser shock peening at the 1064 nm wavelength at a pulse density of 9 GW/cm2. In contrast, there are no such microstructural changes after peening at the 532 nm wavelength with the same pulse density.
  • The microhardness distribution analysis indicates that there are considerable work-hardening effects involved after laser peening at the fundamental wavelength (1064 nm). In contrast, the specimen exposed to 532 nm shows an indication of thermal softening due to recrystallization effects, resulting in a lower trendline value than the unpeened specimen.
  • The surface roughness study shows that there is a monotonic increase in the roughness value with the pulse density of the LSPwC specimen at the 1064 nm wavelength. This indicates that surface ablation and shear deformation increase with the pulse density in laser shock peening at 1064 nm.

Author Contributions

C.S.: Conceptualization, Data curation, Writing—original draft. A.M.: Methodology, Funding acquisition, Writing—review & editing. S.S., K.P., A.N., M.N.R., B.S. and B.B.: Writing—review & editing. All authors have read and agreed to the published version of the manuscript.

Funding

This research work was funded by TATA Steel R&D, Jamshedpur and we also acknowledge TATA Steel R&D for providing necessary microalloyed steel plates for the studies.

Institutional Review Board Statement

Not applicable.

Informed Consent Statement

Not applicable.

Data Availability Statement

Not applicable.

Conflicts of Interest

The author declares no conflict of interest.

References

  1. Alipooramirabad, H.; Ghomashchi, R.; Paradowska, A.; Reid, M. Residual stress- microstructure- mechanical property interrelationships in multipass HSLA steel welds. J. Mater. Process. Technol. 2016, 231, 456–467. [Google Scholar] [CrossRef]
  2. Baker, T.N. Processes, microstructure and properties of vanadium microalloyed steels. Mater. Sci. Technol. 2009, 25, 1083–1107. [Google Scholar] [CrossRef] [Green Version]
  3. Yi, H.; Du, L.; Wang, G.; Liu, X. Development of Nb-V-Ti Hot-Rolled High Strength Steel With Fine Ferrite and Precipitation Strengthening. J. Iron Steel Res. Int. 2009, 16, 72–77. [Google Scholar] [CrossRef]
  4. Zheng, S.; Cheng, K.; Wang, J.; Liao, Q.; Liu, X.; Liu, W. Failure analysis of frame crack on a wide-body mining dump truck. Eng. Fail. Anal. 2015, 48, 153–165. [Google Scholar] [CrossRef]
  5. Sarkar, P.P. Analysis of Failure of a Chassis Long Member Manufactured from E-46 Grade Hot-Rolled Steel Coil. J. Fail. Anal. Prev. 2020, 20, 819–832. [Google Scholar] [CrossRef]
  6. Wang, X.; Yuan, G.; Zhao, J.; Wang, G. Microstructure and Strengthening/Toughening Mechanisms of Heavy Gauge Pipeline Steel Processed by Ultrafast Cooling. Metals 2020, 10, 1323. [Google Scholar] [CrossRef]
  7. Omale, J.I.; Ohaeri, E.G.; Szpunar, J.A.; Arafin, M.; Fateh, F. Microstructure and texture evolution in warm rolled API 5L X70 pipeline steel for sour service application. Mater. Charact. 2019, 147, 453–463. [Google Scholar] [CrossRef]
  8. Praveenkumar, K.; Swaroop, S.; Manivasagam, G. Effect of multiple laser peening on microstructural, fatigue and fretting-wear behaviour of austenitic stainless steel. Surf. Coatings Technol. 2022, 443, 128611. [Google Scholar] [CrossRef]
  9. Praveenkumar, K.; Mylavarapu, P.; Sarkar, A.; Isaac Samuel, E.; Nagesha, A.; Swaroop, S. Residual stress distribution and elevated temperature fatigue behaviour of laser peened Ti-6Al-4V with a curved surface. Int. J. Fatigue 2022, 156, 106641. [Google Scholar] [CrossRef]
  10. Montross, C.S.; Wei, T.; Ye, L.; Clark, G.; Mai, Y.W. Laser shock processing and its effects on microstructure and properties of metal alloys: A review. Int. J. Fatigue 2002, 24, 1021–1036. [Google Scholar] [CrossRef]
  11. Gujba, A.K.; Medraj, M. Laser Peening Process and Its Impact on Materials Properties in Comparison with Shot Peening and Ultrasonic Impact Peening. Materials 2014, 7, 7925–7974. [Google Scholar] [CrossRef] [PubMed] [Green Version]
  12. Clauer, A.H. Laser shock peening, the path to production. Metals 2019, 9, 626. [Google Scholar] [CrossRef] [Green Version]
  13. Pistochini, T.E.; Hill, M.R. Effect of laser peening on fatigue performance in 300M steel. Fatigue Fract. Eng. Mater. Struct. 2011, 34, 521–533. [Google Scholar] [CrossRef]
  14. Sano, Y.; Obata, M.; Kubo, T.; Mukai, N.; Yoda, M.; Masaki, K.; Ochi, Y. Retardation of crack initiation and growth in austenitic stainless steels by laser peening without protective coating. Mater. Sci. Eng. A 2006, 417, 334–340. [Google Scholar] [CrossRef]
  15. Sano, Y.; Mukai, N.; Okazaki, K.; Obata, M. Residual stress improvement in metal surface by underwater laser irradiation. Nucl. Instrum. Methods Phys. Res. Sect. B Beam Interact. Mater. At. 1997, 121, 432–436. [Google Scholar] [CrossRef]
  16. Dhakal, B.; Swaroop, S. Review: Laser shock peening as post welding treatment technique. J. Manuf. Process. 2018, 32, 721–733. [Google Scholar] [CrossRef]
  17. Karthik, D.; Swaroop, S. Laser peening without coating—An advanced surface treatment: A review. Mater. Manuf. Process. 2017, 32, 1565–1572. [Google Scholar] [CrossRef]
  18. Kalainathan, S.; Prabhakaran, S. Recent development and future perspectives of low energy laser shock peening. Opt. Laser Technol. 2016, 81, 137–144. [Google Scholar] [CrossRef]
  19. Praveenkumar, K.; Swaroop, S.; Manivasagam, G. Residual Stress Distribution, Phase Transformation, and Wettability Characteristics of Laser Peened Austenitic Stainless Steel. J. Mater. Eng. Perform. 2022, 31, 6846–6857. [Google Scholar] [CrossRef]
  20. Jose, B.; Patil, T.; Sudhagara Rajan, S.; Praveenkumar, K.; Manivasagam, G.; Swaroop, S. Effect of laser shock peening without coating (LPwC) on a surface and sub-surface characteristics of aged Ti 15 V-3Al- 3Cr-3Sn alloy. Mater. Today Proc. 2021, 46, 578–582. [Google Scholar] [CrossRef]
  21. Yang, Y.; Lian, X.; Zhou, K.; Li, G. Effects of laser shock peening on microstructures and properties of 2195 Al-Li alloy. J. Alloys Compd. 2019, 781, 330–336. [Google Scholar] [CrossRef]
  22. Spadaro, L.; Gomez-Rosas, G.; Rubio-González, C.; Bolmaro, R.; Chavez-Chavez, A.; Hereñú, S. Fatigue behavior of superferritic stainless steel laser shock treated without protective coating. Opt. Laser Technol. 2017, 93, 208–215. [Google Scholar] [CrossRef]
  23. Karthik, D.; Kalainathan, S.; Swaroop, S. Surface modification of 17-4 PH stainless steel by laser peening without protective coating process. Surf. Coatings Technol. 2015, 278, 138–145. [Google Scholar] [CrossRef]
  24. Vishnu, J.; Manivasagam, G. Surface Modification and Biological Approaches for Tackling Titanium Wear-Induced Aseptic Loosening. J. Bio- Tribo-Corrosion 2021, 7, 32. [Google Scholar] [CrossRef]
  25. Vishnu, J.; Ansheed, A.R.; Hameed, P.; Praveenkumar, K.; Pilz, S.; Andrea Alberta, L.; Swaroop, S.; Calin, M.; Gebert, A.; Manivasagam, G. Insights into the surface and biocompatibility aspects of laser shock peened Ti-22Nb alloy for orthopedic implant applications. Appl. Surf. Sci. 2022, 586, 152816. [Google Scholar] [CrossRef]
  26. Praveenkumar, K.; Manivasagam, G.; Swaroop, S. Effect of Laser Peening on the Residual Stress Distribution and Wettability Characteristics of Ti-6Al-4V Alloy for Biomedical Applications. Trends Biomater. Artif. Organs 2022, 36, 18–24. [Google Scholar]
  27. Shukla, P.P.; Swanson, P.T.; Page, C.J. Laser shock peening and mechanical shot peening processes applicable for the surface treatment of technical grade ceramics: A review. Proc. Inst. Mech. Eng. Part B J. Eng. Manuf. 2014, 228, 639–652. [Google Scholar] [CrossRef]
  28. Tang, B.H.; Wang, Q.; Han, X.C.; Zhou, H.; Yan, X.J.; Yu, Y.; Han, D.D. Fabrication of anti-icing/de-icing surfaces by femtosecond laser. Front. Chem. 2022, 10, 1073473. [Google Scholar] [CrossRef]
  29. Ge, X.L.; Yang, J.H.; Ren, H.; Qin, Z.J.; Chen, Q.D.; Han, D.D.; Zhang, Y.L.; Xu, S.; Sun, H.B. Commercial-Printed-Circuitry-Compatible Self-superhydrophobic Antennas Based on Laser Direct Writing. Prog. Electromagn. Res. 2023, 176, 45–53. [Google Scholar] [CrossRef]
  30. Fu, X.Y.; Cai, Q.; Ma, J.N.; Zhu, L.; Han, D.D.; Zhang, Y.L. Free-standing and flexible graphene supercapacitors of high areal capacitance fabricated by laser holography reduction of graphene oxide. Appl. Phys. Lett. 2021, 118, 071601. [Google Scholar] [CrossRef]
  31. You, R.; Liu, Y.Q.; Hao, Y.L.; Han, D.D.; Zhang, Y.L.; You, Z. Laser Fabrication of Graphene-Based Flexible Electronics. Adv. Mater. 2020, 32, 1901981. [Google Scholar] [CrossRef] [PubMed]
  32. Gonzalez-Hernandez, D.; Varapnickas, S.; Merkininkaitė, G.; Čiburys, A.; Gailevičius, D.; Šakirzanovas, S.; Juodkazis, S.; Malinauskas, M. Laser 3d printing of inorganic free-form micro-optics. Photonics 2021, 8, 577. [Google Scholar] [CrossRef]
  33. Yi, J.; Zhou, H.; Wei, W.H.; Han, X.C.; Han, D.D.; Gao, B.R. Micro-/Nano-Structures Fabricated by Laser Technologies for Optoelectronic Devices. Front. Chem. 2021, 9, 10–14. [Google Scholar] [CrossRef] [PubMed]
  34. Liu, Y.-Q.; Mao, J.-W.; Chen, Z.-D.; Han, D.-D.; Jiao, Z.-Z.; Ma, J.-N.; Jiang, H.-B.; Yang, H. Three-dimensional micropatterning of graphene by femtosecond laser direct writing technology. Opt. Lett. 2020, 45, 113–116. [Google Scholar] [CrossRef]
  35. Jiao, Z.Z.; Zhou, H.; Han, X.C.; Han, D.D.; Zhang, Y.L. Photothermal responsive slippery surfaces based on laser-structured graphene@PVDF composites. J. Colloid Interface Sci. 2023, 629, 582–592. [Google Scholar] [CrossRef]
  36. Han, D.D.; Han, D.D.; Chen, Z.D.; Li, J.C.; Mao, J.W.; Jiao, Z.Z.; Wang, W.; Zhang, W.; Zhang, Y.L.; Sun, H.B. Airflow Enhanced Solar Evaporation Based on Janus Graphene Membranes with Stable Interfacial Floatability. ACS Appl. Mater. Interfaces 2020, 12, 25435–25443. [Google Scholar] [CrossRef]
  37. Fang, L.N.; Li, J.C.; Zhang, J.R.; Han, D.D. Femtosecond Laser Structuring for Flexible Surface-Enhanced Raman Spectroscopy Substrates. IEEE Photonics J. 2021, 13. [Google Scholar] [CrossRef]
  38. Wu, B.; Shin, Y.C. Laser pulse transmission through the water breakdown plasma in laser shock peening. Appl. Phys. Lett. 2006, 88, 041116. [Google Scholar] [CrossRef]
  39. Xiao, Y. Effect of laser shock peening on bending fatigue performance of AISI 9310 steel spur gear. Opt. Laser Technol. 2017, 94, 15–24. [Google Scholar] [CrossRef]
  40. Kattoura, M.; Mannava, S.R.; Qian, D.; Vasudevan, V.K. Effect of laser shock peening on elevated temperature residual stress, microstructure and fatigue behavior of ATI 718Plus alloy. Int. J. Fatigue 2017, 104, 366–378. [Google Scholar] [CrossRef]
  41. Huang, S.; Zhu, Y.; Guo, W.; Peng, P.; Diao, X. Impact toughness and microstructural response of Ti-17 titanium alloy subjected to laser shock peening. Surf. Coatings Technol. 2017, 327, 32–41. [Google Scholar] [CrossRef]
  42. Umapathi, A.; Swaroop, S. Wavelength dependent deformation in a laser peened Ti-2.5Cu alloy. Mater. Sci. Eng. A 2017, 684, 344–352. [Google Scholar] [CrossRef]
  43. Prabhakaran, S.; Kalainathan, S. Compound technology of manufacturing and multiple laser peening on microstructure and fatigue life of dual-phase spring steel. Mater. Sci. Eng. A 2016, 674, 634–645. [Google Scholar] [CrossRef]
  44. Shadangi, Y.; Chattopadhyay, K.; Rai, S.B.; Singh, V. Effect of LASER shock peening on microstructure, mechanical properties and corrosion behavior of interstitial free steel. Surf. Coatings Technol. 2015, 280, 216–224. [Google Scholar] [CrossRef]
  45. DeWald, A.T.; Rankin, J.E.; Hill, M.R.; Lee, M.J.; Chen, H.L. Assessment of tensile residual stress mitigation in Alloy 22 welds due to laser peening. J. Eng. Mater. Technol. Trans. ASME 2004, 126, 465–473. [Google Scholar] [CrossRef] [Green Version]
  46. Hackel, L.; Rankin, J.; Racanellia, T.; Mills, T.; Campbell, J.H. Laser Peening to Improve Fatigue Strength and Lifetime of Critical Components. Procedia Eng. 2015, 133, 545–555. [Google Scholar] [CrossRef] [Green Version]
  47. Sakino, Y.; Sano, Y.; Kim, Y.C. Application of laser peening without coating on steel welded joints. Int. J. Struct. Integr. 2011, 2, 332–344. [Google Scholar] [CrossRef]
  48. Xiong, Y.; He, T.; Guo, Z.; He, H.; Ren, F.; Volinsky, A.A. Effects of laser shock processing on surface microstructure and mechanical properties of ultrafine-grained high carbon steel. Mater. Sci. Eng. A 2013, 570, 82–86. [Google Scholar] [CrossRef]
  49. Prabhakaran, S.; Kalainathan, S.; Shukla, P.; Vasudevan, V.K. Residual stress, phase, microstructure and mechanical property studies of ultrafine bainitic steel through laser shock peening. Opt. Laser Technol. 2019, 115, 447–458. [Google Scholar] [CrossRef]
  50. Xu, G.; Luo, K.Y.; Dai, F.Z.; Lu, J.Z. Effects of scanning path and overlapping rate on residual stress of 316L stainless steel blade subjected to massive laser shock peening treatment with square spots. Appl. Surf. Sci. 2019, 481, 1053–1063. [Google Scholar] [CrossRef]
  51. Lu, J.Z.; Deng, W.W.; Luo, K.Y.; Wu, L.J.; Lu, H.F. Surface EBSD analysis and strengthening mechanism of AISI304 stainless steel subjected to massive LSP treatment with different pulse energies. Mater. Charact. 2017, 125, 99–107. [Google Scholar] [CrossRef]
  52. Prabhakaran, S.; Kulkarni, A.; Vasanth, G.; Kalainathan, S.; Shukla, P.; Vasudevan, V.K. Laser shock peening without coating induced residual stress distribution, wettability characteristics and enhanced pitting corrosion resistance of austenitic stainless steel. Appl. Surf. Sci. 2018, 428, 17–30. [Google Scholar] [CrossRef]
  53. Sollier, A.; Berthe, L.; Peyre, P.; Bartnicki, E.; Fabbro, R. Laser-matter interaction in laser shock processing. Proc. SPIE Int. Soc. Opt. Eng. 2003, 4831. [Google Scholar] [CrossRef]
  54. Dane, C.B.; Hackel, L.; Daly, J.; Harrisson, J. Laser peening of metals- enabling laser technology. MRS Proc. 1997, 499, 73. [Google Scholar] [CrossRef] [Green Version]
  55. Ding, K.; Ye, L. Physical and mechanical mechanisms of laser shock peening. Laser Shock Peen. 2006, 7–46. [Google Scholar] [CrossRef]
  56. Clauer, A.H. Laser Shock Peening for Fatigue Resistance. Surf. Perform. Titan. 1996, 148, 217–230. [Google Scholar]
  57. Fairand, B.P.; Clauer, A.H.; Jung, R.G.; Wilcox, B.A. Quantitative assessment of laser-induced stress waves generated at confined surfaces. Appl. Phys. Lett. 1974, 25, 431–433. [Google Scholar] [CrossRef]
  58. Bolger, J.A.; Montross, C.S.; Rode, A.V. Shock waves in basalt rock generated with high-powered lasers in a confined geometry. J. Appl. Phys. 1999, 86, 5461–5466. [Google Scholar] [CrossRef]
  59. Berthe, L.; Fabbro, R.; Peyre, P.; Bartnicki, E. Wavelength dependent of laser shock-wave generation in the water-confinement regime. J. Appl. Phys. 1999, 85, 7552–7555. [Google Scholar] [CrossRef]
  60. Yella, P.; Rajulapati, K.V.; Prasad Reddy, G.V.; Sandhya, R.; Prem Kiran, P.; Buddu, R.K.; Bhanu Sankara Rao, K. Effect of laser shock peening on high cycle fatigue characteristics of 316LN stainless steel. Int. J. Press. Vessel. Pip. 2019, 176, 103972. [Google Scholar] [CrossRef]
  61. Sugimoto, K.; Mukherjee, M. TRIP aided and complex phase steels. Automot. Steels Des. Metall. Process. Appl. 2017, 217–257. [Google Scholar] [CrossRef]
  62. Dobrzanski, L.; Borek, W.; Mazurkiewicz, J. Influence of Thermo-Mechanical Treatments on Structure and Mechanical Properties of High-Mn Steel. Adv. Mater. Res. 2015, 1127, 113–119. [Google Scholar] [CrossRef]
  63. Peyre, P.; Fabbro, R. Laser shock processing: A review of the physics and applications. Opt Quant Electron 1995, 27, 1213–1229. [Google Scholar] [CrossRef]
  64. He, B.B.; Hu, B.; Yen, H.W.; Cheng, G.J.; Wang, Z.K.; Luo, H.W.; Huang, M.X. High dislocation density–induced large ductility in deformed and partitioned steels. Science 2017, 357, 1029–1032. [Google Scholar] [CrossRef] [PubMed] [Green Version]
  65. Zhang, L.; Lu, J.Z.; Zhang, Y.K.; Luo, K.Y.; Zhong, J.W.; Cui, C.Y.; Kong, D.J.; Guan, H.B.; Qian, X.M. Effects of different shocked paths on fatigue property of 7050-T7451 aluminum alloy during two-sided laser shock processing. Mater. Des. 2011, 32, 480–486. [Google Scholar] [CrossRef]
  66. Ge, M.Z.; Xiang, J.Y.; Yang, L.; Wang, J.T. Effect of laser shock peening on the stress corrosion cracking of AZ31B magnesium alloy in a simulated body fluid. Surf. Coatings Technol. 2017, 310, 157–165. [Google Scholar] [CrossRef]
  67. Dhakal, B.; Swaroop, S. Effect of laser shock peening on mechanical and microstructural aspects of 6061-T6 aluminum alloy. J. Mater. Process. Technol. 2020, 282, 116640. [Google Scholar] [CrossRef]
Figure 1. (a) Schematic of a laser shock peening setup. (b) Schematic representation of bidirectional laser peening strategy. (c) LSPwC sample with laser tracks and decarburized surface. (d) Sample after electropolishing.
Crystals 13 00212 g001
Figure 2. Residual stress distribution of LSPwC samples at 1064 nm wavelength.
Crystals 13 00212 g002
Figure 3. Residual stress distribution profile of LSPwC specimen at 532 nm.
Crystals 13 00212 g003
Figure 4. Cross-sectional micrographs of microalloyed steel sample (a) in unpeened condition and after laser shock peening at 1064 nm and 9 GW/cm2 (b) in subsurface region, (c) below subsurface, region, and (d) in midsection region.
Crystals 13 00212 g004
Figure 5. IQ and IPF mapping of LSPwC microalloyed steel at 1064 nm with (a,b) 3 GW/cm2, (c,d) 6 GW/cm2, (e,f) 9 GW/cm2, and (g,h) 12 GW/cm.
Crystals 13 00212 g005
Figure 6. IQ and IPF mapping of LSPwC microalloyed steel specimen at 532 nm with (a,b) 3 GW/cm2, (c,d) 6 GW/cm2, (e,f) 9 GW/cm2, and (g,h) 12 GW/cm.
Crystals 13 00212 g006
Figure 7. Grain size distribution in the subsurface region of microalloyed steel specimen (a) in unpeened condition; after LSP at 1064 nm with (b) 3 GW/cm2, (c) 6 GW/cm2, (d) 9 GW/cm2, and (e) 12 GW/cm2; and after LSP at 532 nm with (f) 3 GW/cm2, (g) 6 GW/cm2, and (h) 9 GW/cm2.
Crystals 13 00212 g007
Figure 8. Average grain size distribution of microalloyed steel specimen in unpeened and LSP conditions.
Crystals 13 00212 g008
Figure 9. Grain boundary misorientation distribution in the subsurface region of microalloyed steel specimen (a) in unpeened condition; after LSP at 1064 nm with (b) 3 GW/cm2, (c) 6 GW/cm2, (d) 9 GW/cm2, and (e) 12 GW/cm2; and after LSP at 532 nm with (f) 3 GW/cm2, (g) 6 GW/cm2, and (h) 9 GW/cm2.
Crystals 13 00212 g009
Figure 10. Microhardness distribution graph of LSPwC microalloyed steel specimen at 9 GW/cm2.
Crystals 13 00212 g010
Figure 11. Surface roughness graph of LSPwC specimen with 1064 (blue) nm and 532 nm (red) and before LSP (gray).
Crystals 13 00212 g011
Table 1. Chemical composition of A2 electrolyte.
S. No.A2 Electrolyte CompositionPercentage (%)
1Ethanol73.14
22n-Butoxy10.02
3Perchloric acid7.8
4Distilled Water9.017
Disclaimer/Publisher’s Note: The statements, opinions and data contained in all publications are solely those of the individual author(s) and contributor(s) and not of MDPI and/or the editor(s). MDPI and/or the editor(s) disclaim responsibility for any injury to people or property resulting from any ideas, methods, instructions or products referred to in the content.

