Article

Preparation and Investigation of Ni–Co–P Alloy Coatings Using Jet Electrodeposition with Varying Pulse Parameters

1
School of Mechanical Engineering, Anhui University of Science and Technology, Huainan 232001, China
2
College of Engineering, Nanjing Agricultural University, Nanjing 210031, China
*
Author to whom correspondence should be addressed.
Crystals 2023, 13(2), 303; https://doi.org/10.3390/cryst13020303
Submission received: 12 January 2023 / Revised: 7 February 2023 / Accepted: 10 February 2023 / Published: 12 February 2023

Abstract

:
Ni–Co–P alloy coatings were successfully fabricated by jet electrodeposition with varying pulse frequencies and duty cycles in order to prolong the longevity of steel C1045 substrates. The results showed that the microstructures and properties of samples were significantly affected by pulse frequencies and duty cycles. All the samples with varying pulse frequencies and duty cycles exhibited a face-centered cubic (FCC) structure. Additionally, the average grain size of the samples reached 20.6 nm. The microhardness of the coatings was observed to first increase, and then decrease, with a rise in pulse frequencies and duty cycles. The microhardness reached 656.2 HV0.1, and the wear scar width of the coatings reached 414.4 µm at 4 kHz pulse frequency and 80% duty cycle. Additionally, the corrosion current densities (Icorr) of samples reached a minimum value of 0.74 µA·cm−2, the corrosion rates (Rcorr) reached a minimum value of 8.9 µm·year−1, and the charge transfer resistance (Rct) reached a maximum value of 8.36 × 10⁴ Ω·cm−2, which indicated the optimal seawater corrosion resistance of the deposited coatings.

1. Introduction

High corrosion rate and poor wear resistance of steel C1045 substrates greatly limit their applications in industries. Additionally, the corrosion and wear processes of steel C1045 substrate surfaces are gradual and concealed, which constantly degrade the properties of equipment and influence rapid economic development [1,2]. Therefore, it is fundamental to develop new surface modification techniques and various surface protective materials that can increase the service life of mechanical parts under extreme conditions. Such techniques include electroless plating, electro-brush plating, thermospraying, powder metallurgy, electrodeposition, and jet electrodeposition.
The electrodeposition technique is a coating method used for preparing coatings that exhibit good anti-corrosion and wear-resistant properties [3,4], and which has many advantages in terms of equipment simplicity, economical processing, and deposition controllability [5,6,7]. The electrodeposited nickel (Ni) matrix coating is one of the most widely applied coatings in the world owing to its high hardness coupled with superior wear and corrosion resistance [8,9,10]. Furthermore, depositing Ni matrix with other metals to form alloy coatings can effectively improve the comprehensive performance of deposited coatings. These alloying elements include W [11], Co [12], Cu [13], Fe [14], Mo [15], B [16], and Cr [17]. Pulsed electrodeposition (PED) is a new variation of electrodeposition that is characterized by higher instantaneous current density compared to conventional direct current (DC) electrodeposition. The three most fundamental parameters that affect the coating structure, composition, and deposition efficiency in PED include peak current density (Ip), pulse imposition time (ON-time, Ton), and pulse switch off time (OFF-time, Toff) [18,19]. As a result, application of PED for deposition of coatings has been gathering momentum since variation of these parameters makes it possible to control the entire structure and properties of deposited coatings [20]. Ramaprakash et al. [21] reported that Ni–W alloy films obtained higher microhardness and better corrosion resistance after adjusting pulse frequency and pulse duty cycle. Chung et al. [22] improved microhardness and corrosion resistance of Ni–Co films by increasing pulse frequency. Yang et al. [23] concluded that the pulse frequency and duty cycle significantly influenced the microhardness of deposited Ni–Co–SiC coatings.
Compared with electrodeposition methods, jet electrodeposition technology is a new high-speed electroplating technology characterized by advantages such as high deposition velocity, high selectivity, and strong capability of producing thick composite coatings with fine grains [24,25,26,27]. In the recent past, many studies have focused on the influence of jet electrodeposition parameters on the structure and properties of coatings. For instance, Li et al. [28,29] reported that the microstructures and properties of Ni–Co–BN(h) coatings were affected by jet electrodeposition parameters (jet speed, jet voltages, pulse frequency, and duty cycle). Tang et al. [30] concluded that increasing the flow rate of the jet resulted in a decrease in the grain size of Ni–Co alloy coatings. Xia et al. [31] and Liu et al. [32] reported that the properties of coatings were affected by the injection speed of the plating solution and the scanning speed of the cathode. Qiao et al. [33] found that the key parameters of jet electrodeposition influenced the concentration of Co2+ ions, thereby impacting the microstructure and chemistry of Ni–Co alloys. In some instances, ternary alloy coatings have higher microhardness, wear and corrosion resistance compared to binary alloy coatings. For instance, Pang et al. [34], Fetohi et al. [35], and Khan et al. [36] reported that the microhardness, corrosion resistance, and coercivity of Ni–Co–P alloy coatings were better than that of Ni–Co alloy coatings, Ni–P alloy coatings, and Co–P alloy coatings, respectively.
Pulse parameters adjustment considerably affects the electrodeposition mechanism by influencing the nucleation and growth rate [37]. For Ni–Co–P coatings deposition, the Co content affects the Ni content in the coatings whereby Ni atoms and Co atoms form a face-centered cubic (FCC) and hexagonal close-packed (HCP) structure with increase in the content of Co element. Additionally, pulse frequencies and duty cycles adjustment considerably affect the microstructures and properties of samples by influencing the content of the Co element. Hence, it is necessary to study the effect of pulse frequencies and duty cycles on wear resistance and seawater corrosion resistance properties.
In this work, Ni–Co–P alloy coatings were successfully fabricated using jet electrodeposition with varying pulse frequencies and duty cycles in order to prolong the longevity of steel C1045 substrates. The effects of pulse frequencies and duty cycles on microhardness, wear, and seawater corrosion properties of deposited coatings were studied. Additionally, the effects of jet voltages, jet gaps, temperature of the plating solution, and reciprocating sweep speeds on enhancing the microhardness, wear, and corrosion-resistance capability were reported in previous work [2,38]. In the current work, the effect of frequency parameters, duty cycle, and Co element content on the microstructures and properties of the coating were explored. In addition, based on the analyses of the pulse jet electrodeposition process, the deposition mechanism was discussed in detail.

2. Experimental Device and Procedure

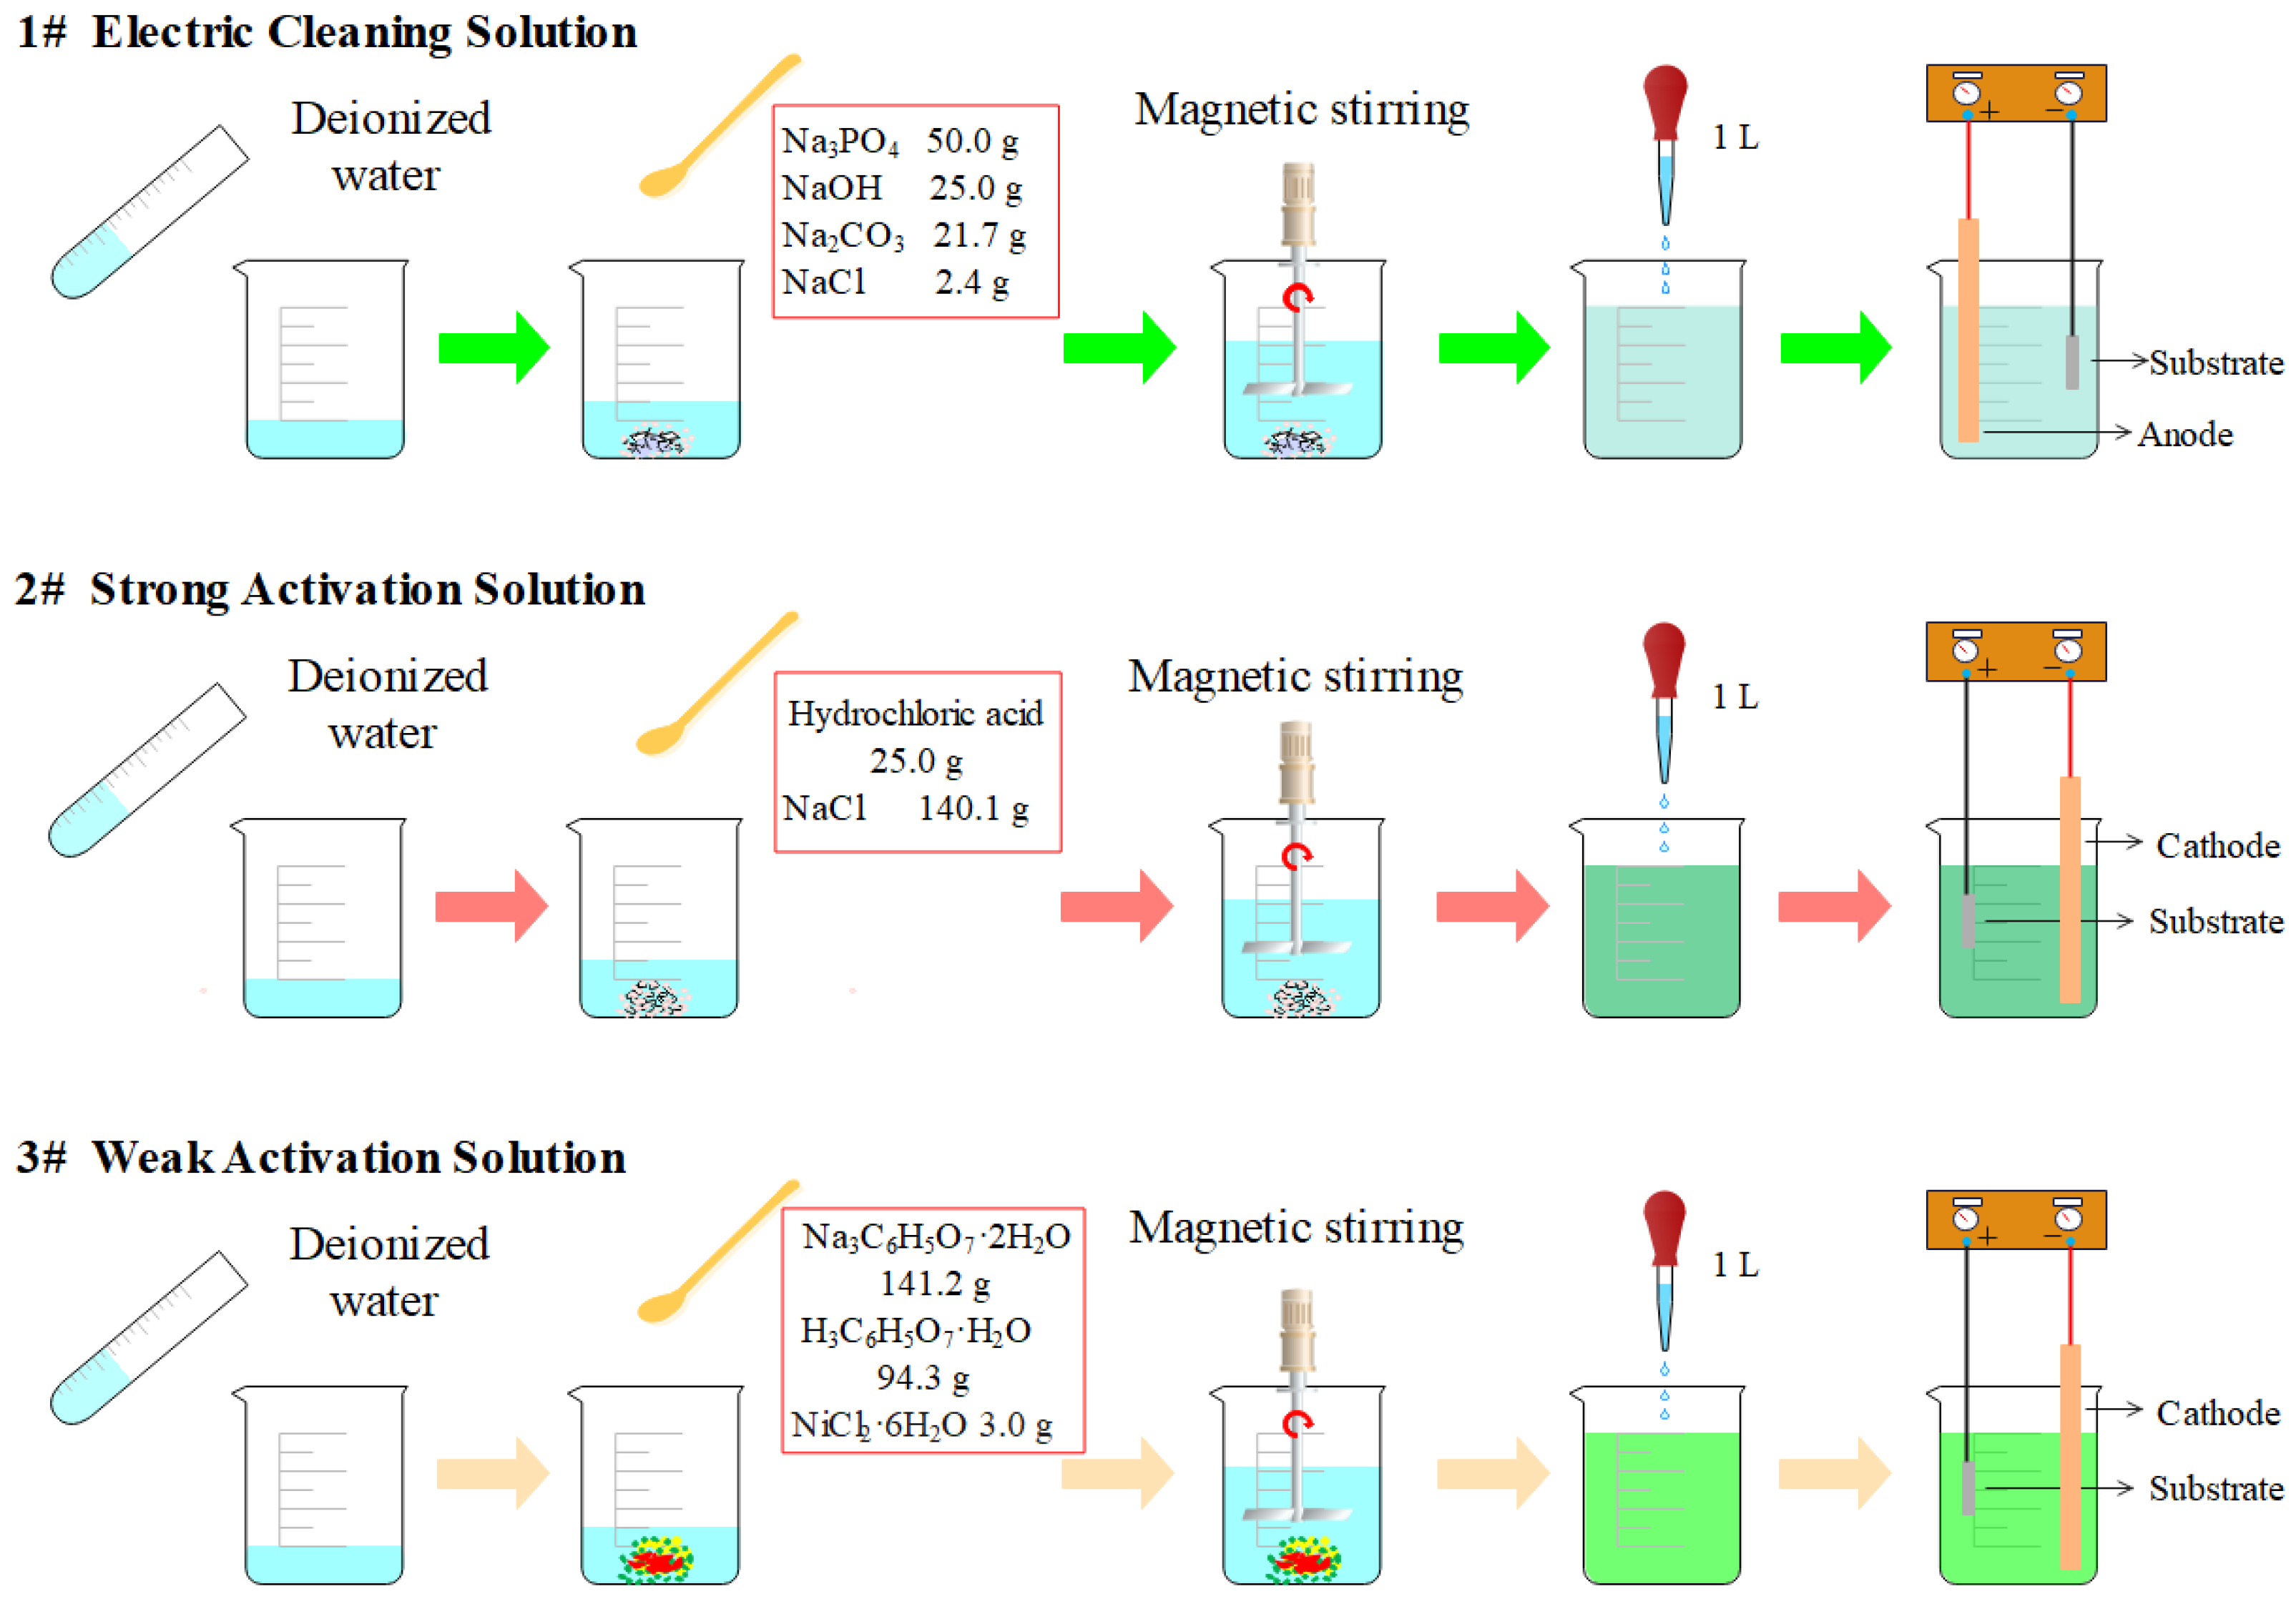
2.1. Materials and Pretreatment

The substrate materials were steel C1045 samples with a size of 7 mm × 8 mm × 30 mm throughout the experiment. To improve the bonding between the coating and the substrate surface, a series of pretreatment steps was undertaken for steel C1045 samples. Firstly, steel C1045 samples were cleaned and polished using different grades of abrasive water-resistant emery papers so as to prepare suitable jet electrodeposition surfaces. Secondly, steel C1045 samples were degreased using an electric cleaning solution (Solution 1) having a current of 1 A and a processing time of 30 s. Thirdly, steel C1045 samples were immersed in a strong activation solution (Solution 2) having a current of 1 A and a processing time of 35 s for the removal of the oxide layer. Finally, steel C1045 samples were immersed in a weak activation solution (Solution 3) having a current of 1 A and a processing time of 35 s for the removal of black carbon. After every step, deionized water was used to rinse steel C1045 samples. Figure 1 shows the composition of the pretreatment solutions (1→2→3) and operating conditions in the pretreatment experiment.

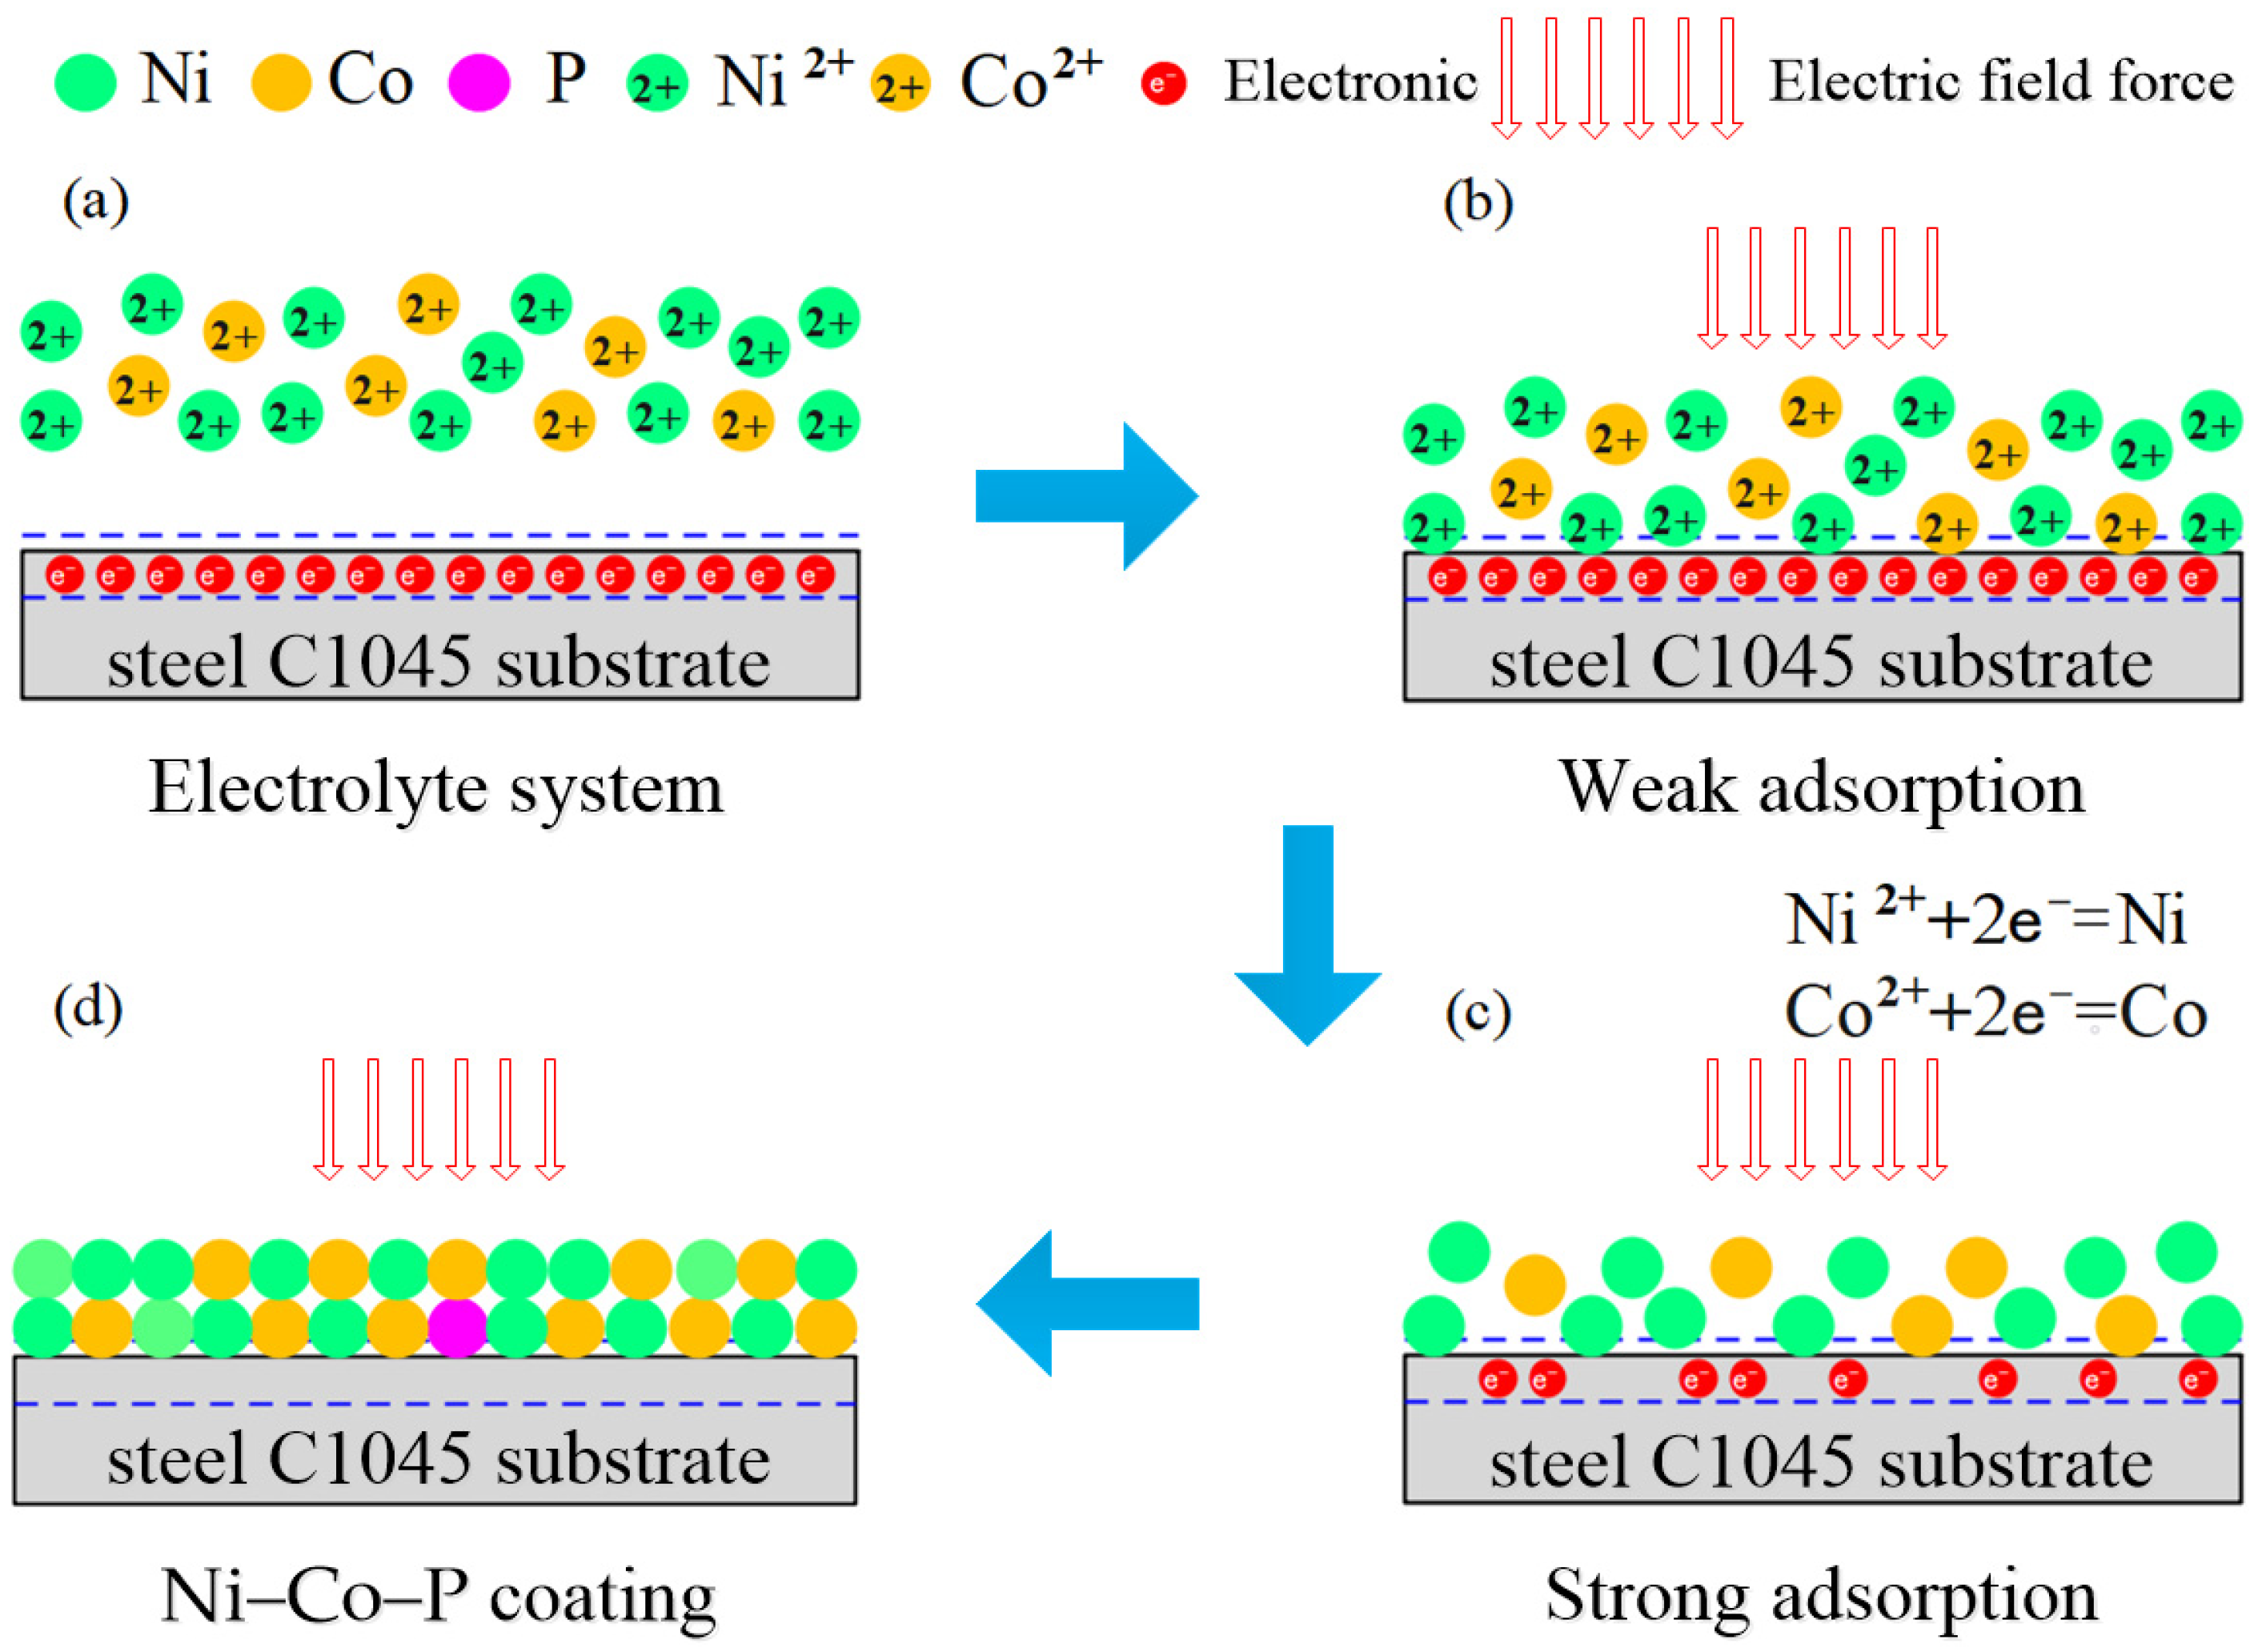
2.2. Preparation of Ni–Co–P Alloy Coatings

The Ni–Co–P alloy coatings were deposited from the aqueous solution [2,38]. The coatings were fabricated on steel C1045 substrates using jet electrodeposition with (i) varying pulse frequencies (2, 3, 4, 5, and 6 kHz) at a constant duty cycle of 80%, and (ii) varying duty cycles (40, 60, 80, and 99%) at a constant pulse frequency of 4 kHz. Additionally, all the jet electrodeposition experiments were performed at a constant electrodeposition time of 20 min, a plating solution temperature of 60 °C, an injection speed of 1.5 m·s−1, a jet gap of 2.0 mm, a reciprocating sweep speed of 175 mm·s−1, and a jet voltage of 12 V. Moreover, the samples were cleaned and air dried after the process of jet electrodeposition.

2.3. Characterization of Ni–Co–P Alloy Coatings

The scanning electron microscope (FEI Quanta FEG 250, SEM, Hillsboro, USA) was used to observe and analyze the cross-sectional morphology of samples. The energy dispersive spectrometer (EDS, X Flash Detector 5030, BRUKER, Karlsruhe, Germany) was used to study and analyze the chemical composition and distribution of chemical elements in samples. The X’Pert Power X-ray diffraction (PANalytical B.V., Almelo, Holland) was used to analyze the phase composition of samples. The crystallographic structure of Ni–Co–Si3N4 nanocomposite coatings was analyzed using CuKα radiation over a range of 2θ = 20° to 2θ = 90° at a scanning rate of 2θ = 4°/min and a voltage of 40 kV.
The microhardness of various samples was measured using a Struers Duramin-40 (US) microhardness tester (Ballerup, Copenhagen, Denmark) under the applied time and load of 15 s and 100 g. To increase accuracy of test results, the microhardness was averaged from readings of 10 separate location measurements for each sample surface. The wear of various samples was measured using a high-frequency reciprocating wear test machine (Zhongke Kaihua, Lanzhou, China) with a ball on disk pair. A time of 30 min, a load of 3.2 N, and a speed of 500 r/min was selected for the wear test. The surface morphologies showing the worn grooves were measured using FEI Quanta FEG as well.
The corrosion behaviors of samples were measured using a CS350 three-electrode electrochemical workstation (Wuhan Corrtest Instruments Corp., Ltd., Wuhan, China). Typically, a saturated calomel electrode was used as the reference electrode (RE), a platinum plate was used as a counter electrode (CE), and Ni–Co–P alloy coatings with an exposed surface area of 1 cm2 were used as a working electrode (WE). All the electrochemical measurements were carried out in an artificial seawater environment at room temperature. The chemical composition of artificial seawater was as follows: 24.530 g·L−1 NaCl, 5.200 g·L−1 MgCl2, 4.090 g·L−1 Na2SO4, 1.160 g·L−1 CaCl2, 0.695 g·L−1 KCl, 0.201 g·L−1 NaHCO3, 0.101 g·L−1 KBr, 0.027 g·L−1 H3BO3, 0.025 g·L−1 SrCl2, and 0.003 g·L−1 NaF. In addition, the potentiodynamic polarization curves and samples were carried out in the potential range of ± 0.6 V with respect to the Eocp and at a sweeping rate of 0.5 mV·s−1. The Nyquist and Bode plots of samples were carried out at a sinusoidal excitation amplitude of 10 mV root mean square coupled with a frequency range of 105~10−2 Hz.

3. Results and Discussion

3.1. Jet-Electrodeposition of Ni–Co–P Alloy Coatings

Figure 2 shows the schematic diagram of Ni–Co–P alloy coatings fabricated by jet electrodeposition. It was reported that there are two competing mechanism models in the electrodeposition which consist of crystal nucleation and growth [39,40]. According to Guglielmi’s two-step adsorption model [32,41], firstly, a large number of ions (Ni2+, Co2+) (see Figure 2a) were adsorbed on the cathode surface under the electric force, which exhibited weak adsorption (see Figure 2b). Secondly, discharge reactions occurred on the steel C1045 substrate surface, whereby Ni2+ ions were reduced to Ni atoms and Co2+ ions were reduced to Co atoms, characterized by strong adsorption (see Figure 2c) [42,43,44]. Simultaneously, a small amount of hydrogen ions (H2+) were also trapped on the surface of the cathode base to generate hydrogen bubbles (H2). After consecutively uninterrupted weak and strong adsorption processes, a large number of Ni atoms and Co atoms coupled with a few P atoms were deposited on the steel C1045 substrate surface, thereby generating the Ni–Co–P alloy coating (see Figure 2d).

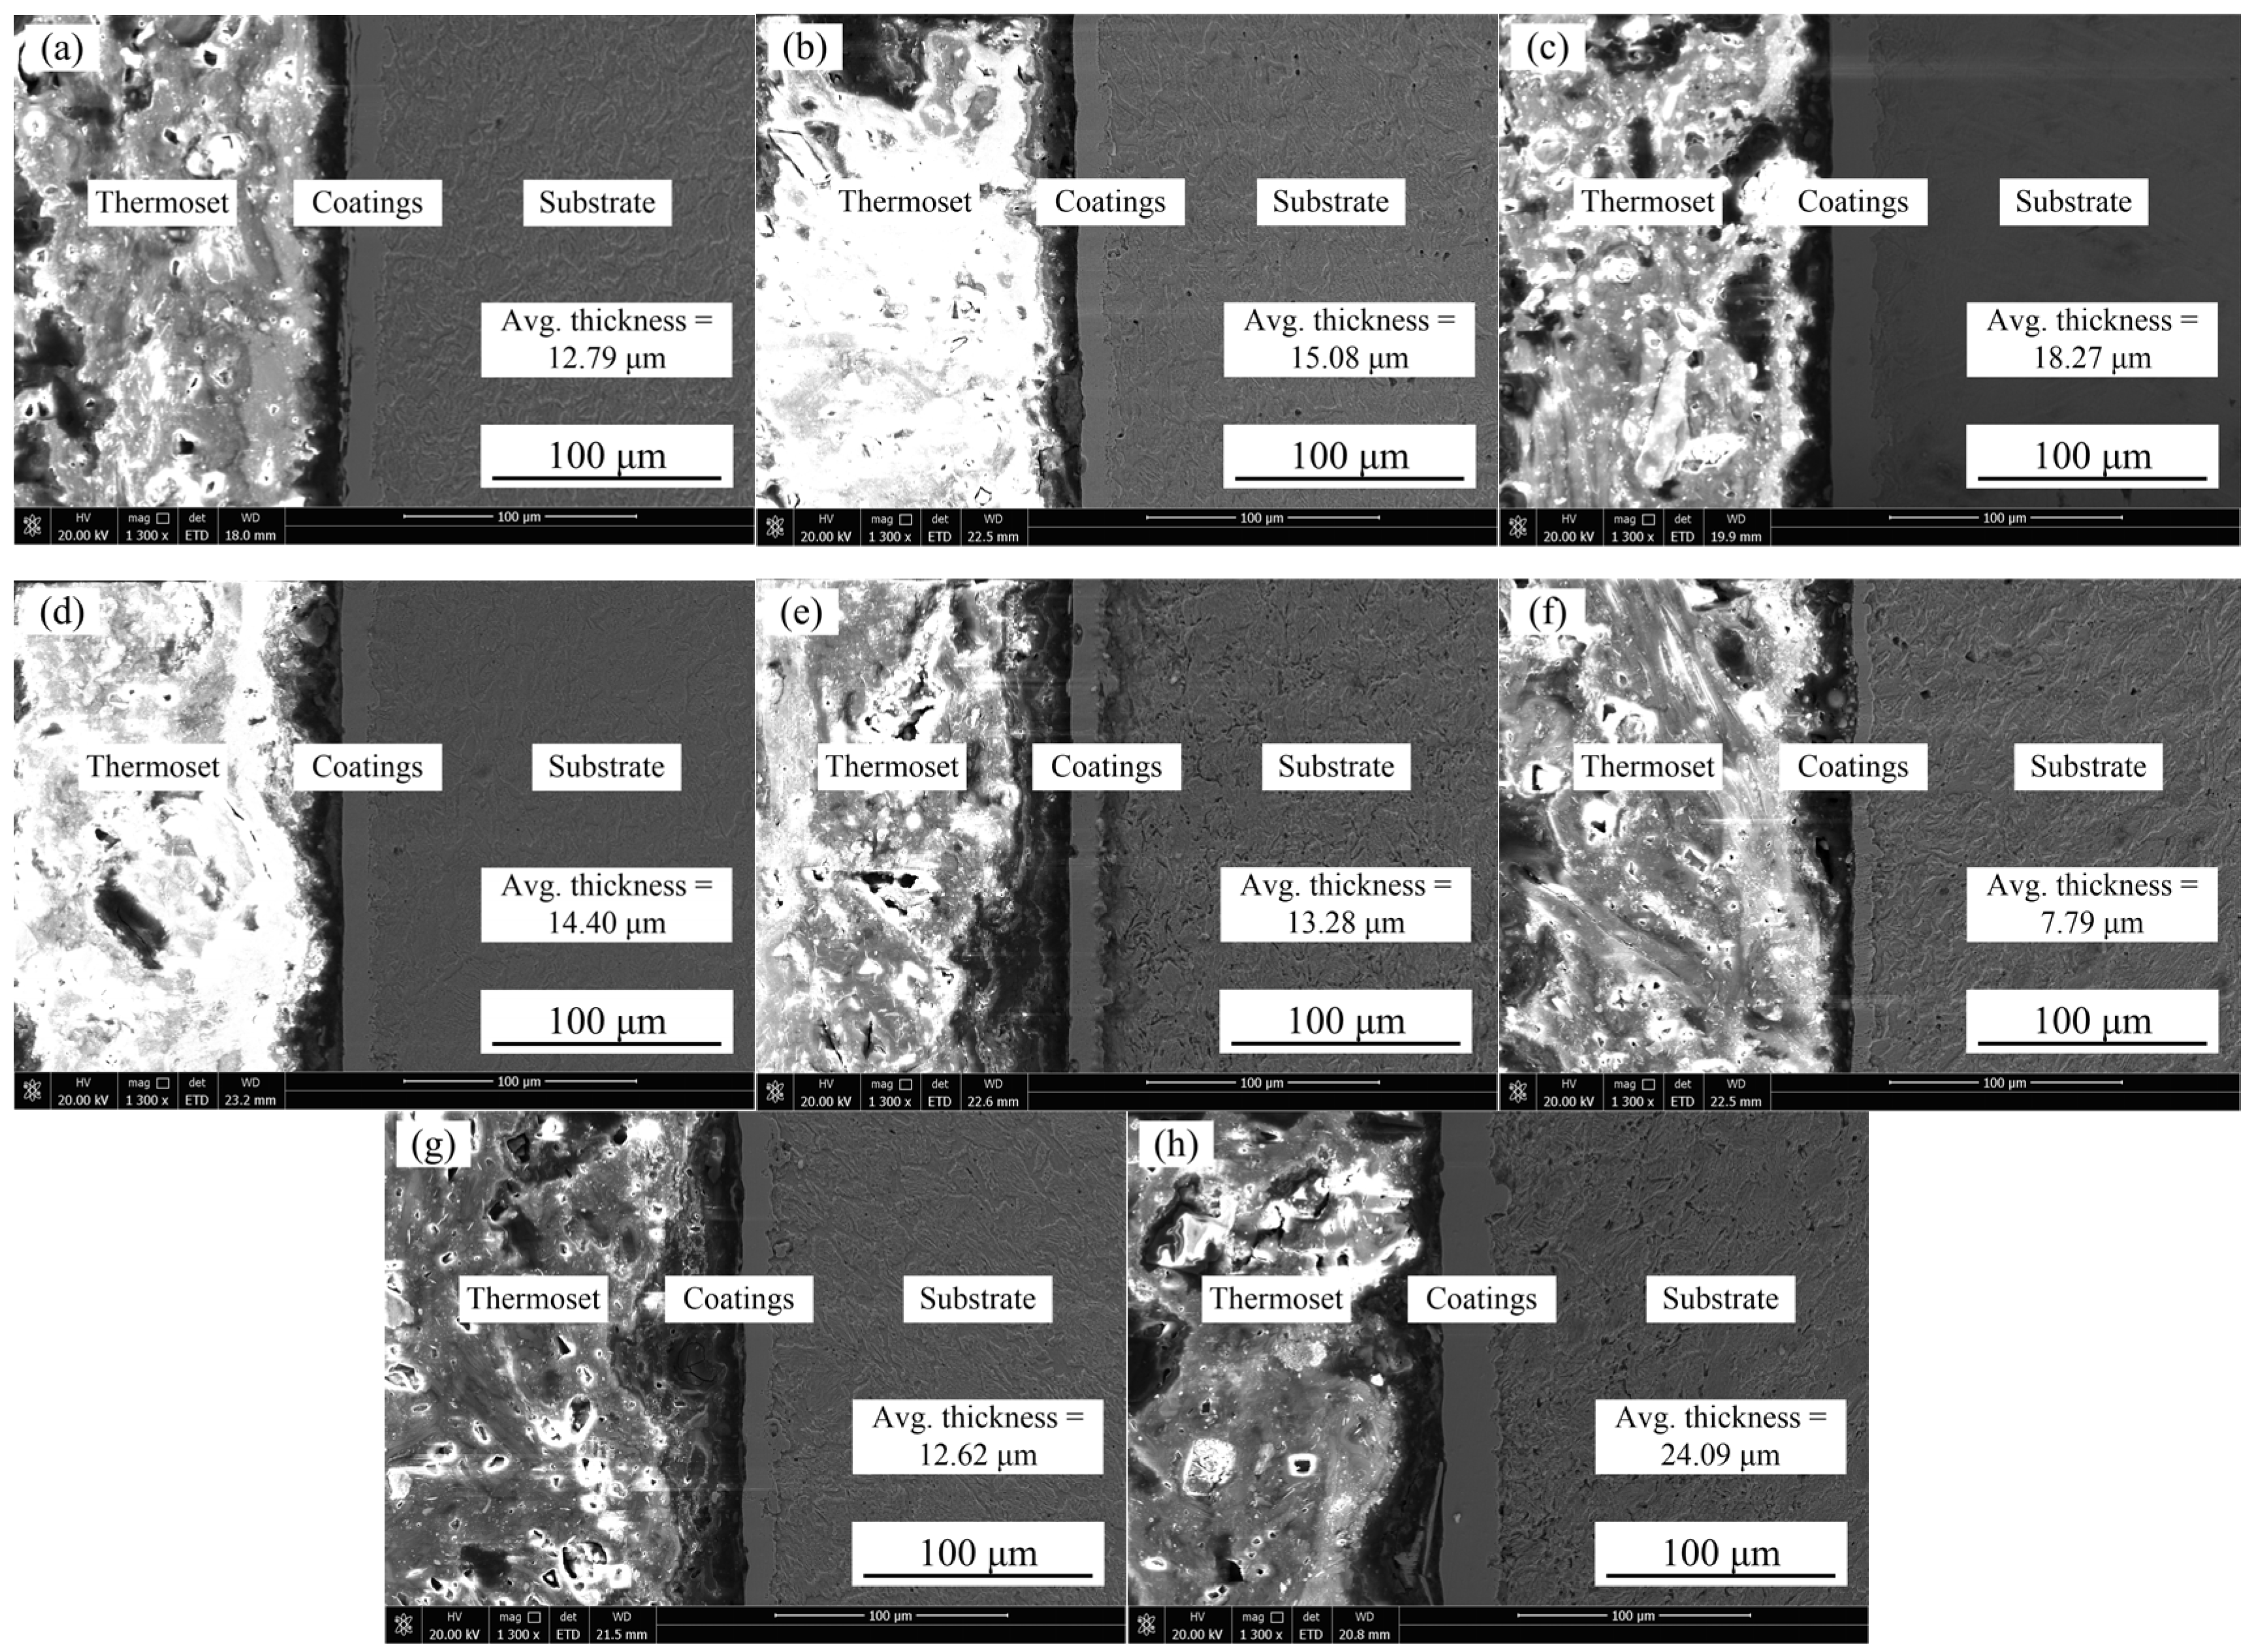
3.2. Cross-Section Morphologies of Samples

The cross-section morphologies of samples that were prepared with varying pulse frequencies and duty cycles are illustrated in Figure 3. The thickness of samples was greatly affected by pulse frequencies and duty cycles. It is evident that all the samples were uniform and defect-free under varying pulse frequencies, and the coatings adhered well to the steel C1045 substrates. As shown in Figure 3a–e, when the pulse frequency was 2 kHz, the thickness of samples corresponded to 12.79 µm, and when the pulse frequencies was 4 kHz, the thickness of samples corresponded to 18.27 µm. After further increase in pulse frequencies up to 6 kHz, the thickness of samples reached 13.28 µm. This can be attributed to an increase in the pulse frequencies, which decreased the duration of single pulse discharge, thereby decreasing pulse energy acting on the cathode surface, thereby causing a decrease in the deposition rate. Mei et al. [45] found that the deposition rate of Al–Ti–V–Cu–N coatings was slow when pulse frequency corresponded to 160 Hz. It was worth noting that the deposition rate of coatings increased linearly from 4.1 nm·min−1 at 160 Hz to 5.9 nm·min−1 at 300 Hz. However, further increase in pulse frequency caused a subsequent decrease in deposition rate. In addition, as reported previously by Li et al. [29], a larger thickness of Ni–Co–BN(h) nanocomposite coating means greater deposition efficiency. It was also reported that the thickness of Ni–Co–BN(h) nanocomposite coatings first increased and then decreased as the pulse frequency increased. In this work, the results are similar to their conclusions.
Moreover, as shown in Figure 3c,f–h, it is evident that the thickness of samples with duty cycles of 80%, 40%, 60%, and 99% increased to 18.27 µm, 7.79 µm, 12.62 µm, and 24.09 µm, respectively. This demonstrated that the thickness of samples increased linearly with an increasing duty cycle from 40% to 99%. The above phenomena may be due to the fact that the average current density (iave) increased with an increasing duty cycle at a constant peak current density (ip) [46]. What’s more, the thickness of samples increased as the average current density (iave) increased. At 40% duty cycle, the ON time was very short and the average current density (iave) was smaller. Therefore, the deposition time of metal ions was less leading to a decrease in the reduction process occurring on the cathode surface. The overall ON time during jet electrodeposition increased with an increasing duty cycle. At maximum duty cycle of 99%, the ON time was quite long. Hence, more metal ions were reduced, resulting in a subsequent increase in deposition rate. Concurrently, the thickness of samples became thicker as duty cycles increased.

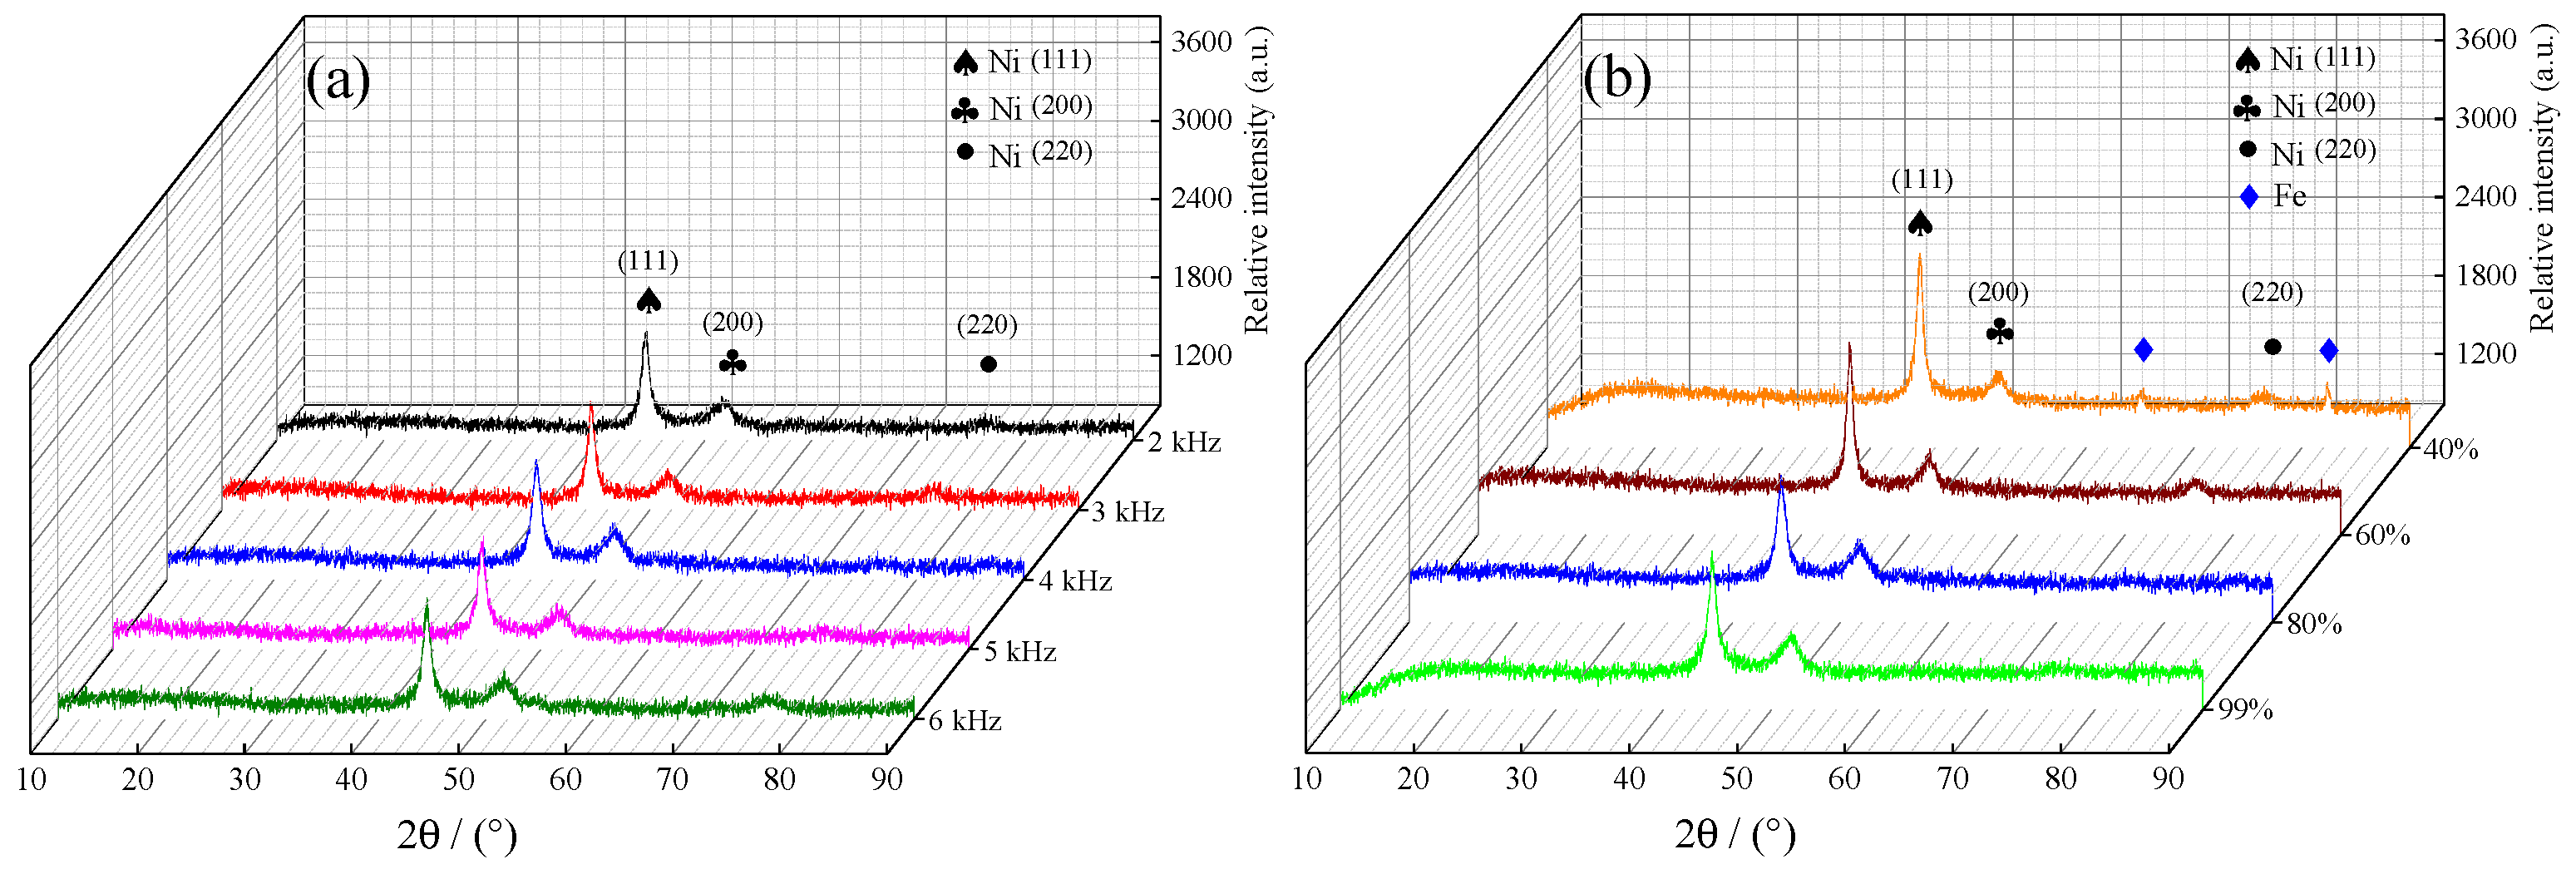
3.3. XRD Patterns of Samples

The XRD patterns of samples deposited with varying pulse frequencies and duty cycles are displayed in Figure 4a,b. At a constant duty cycle of 80%, it can be seen that the peak intensities and phase structure of samples have no obvious change with increase in pulse frequency. The peaks at 2θ = 44.37°, 51.82°, and 76.29° were indexed as Ni (111), (200), and (220), respectively. Moreover, the diffraction peak intensity for the Ni (111) plane at different pulse frequencies was more obvious compared with the Ni (200) and Ni (220) planes, which indicated that Ni tended to grow along the Ni (111) plane. It is clear that with the increase in pulse frequencies, the diffraction peaks of Co and P in the deposited coatings were absent in this study. This can be attributed to Co atoms displacing some Ni atoms that existed in the face-centered cubic (FCC) structure Ni lattice, and the Co and Ni atoms combined to form an α-phase solid solution [2,38]. On the other hand, at a constant pulse frequency of 4 kHz, it can be seen from Figure 4b that the peak intensities and phase structure of samples exhibited obvious change with an increase in the duty cycles. It is clear that the diffraction peak of the Fe matrix appeared at a 40% duty cycle. This phenomenon may be associated with the thickness of samples. The thickness of samples using jet electrodeposition corresponded to 12.79 µm when the duty cycle corresponded to 40%. Additionally, the thickness of samples became thicker as duty cycles increased, causing the diffraction peak of the Fe matrix to disappear. The peaks at 2θ = 44.65°, 51.72°, and 76.41° were indexed as Ni (111), Ni (200), and Ni (220), respectively. It is evident that the deposited coatings exhibited an FCC structure.

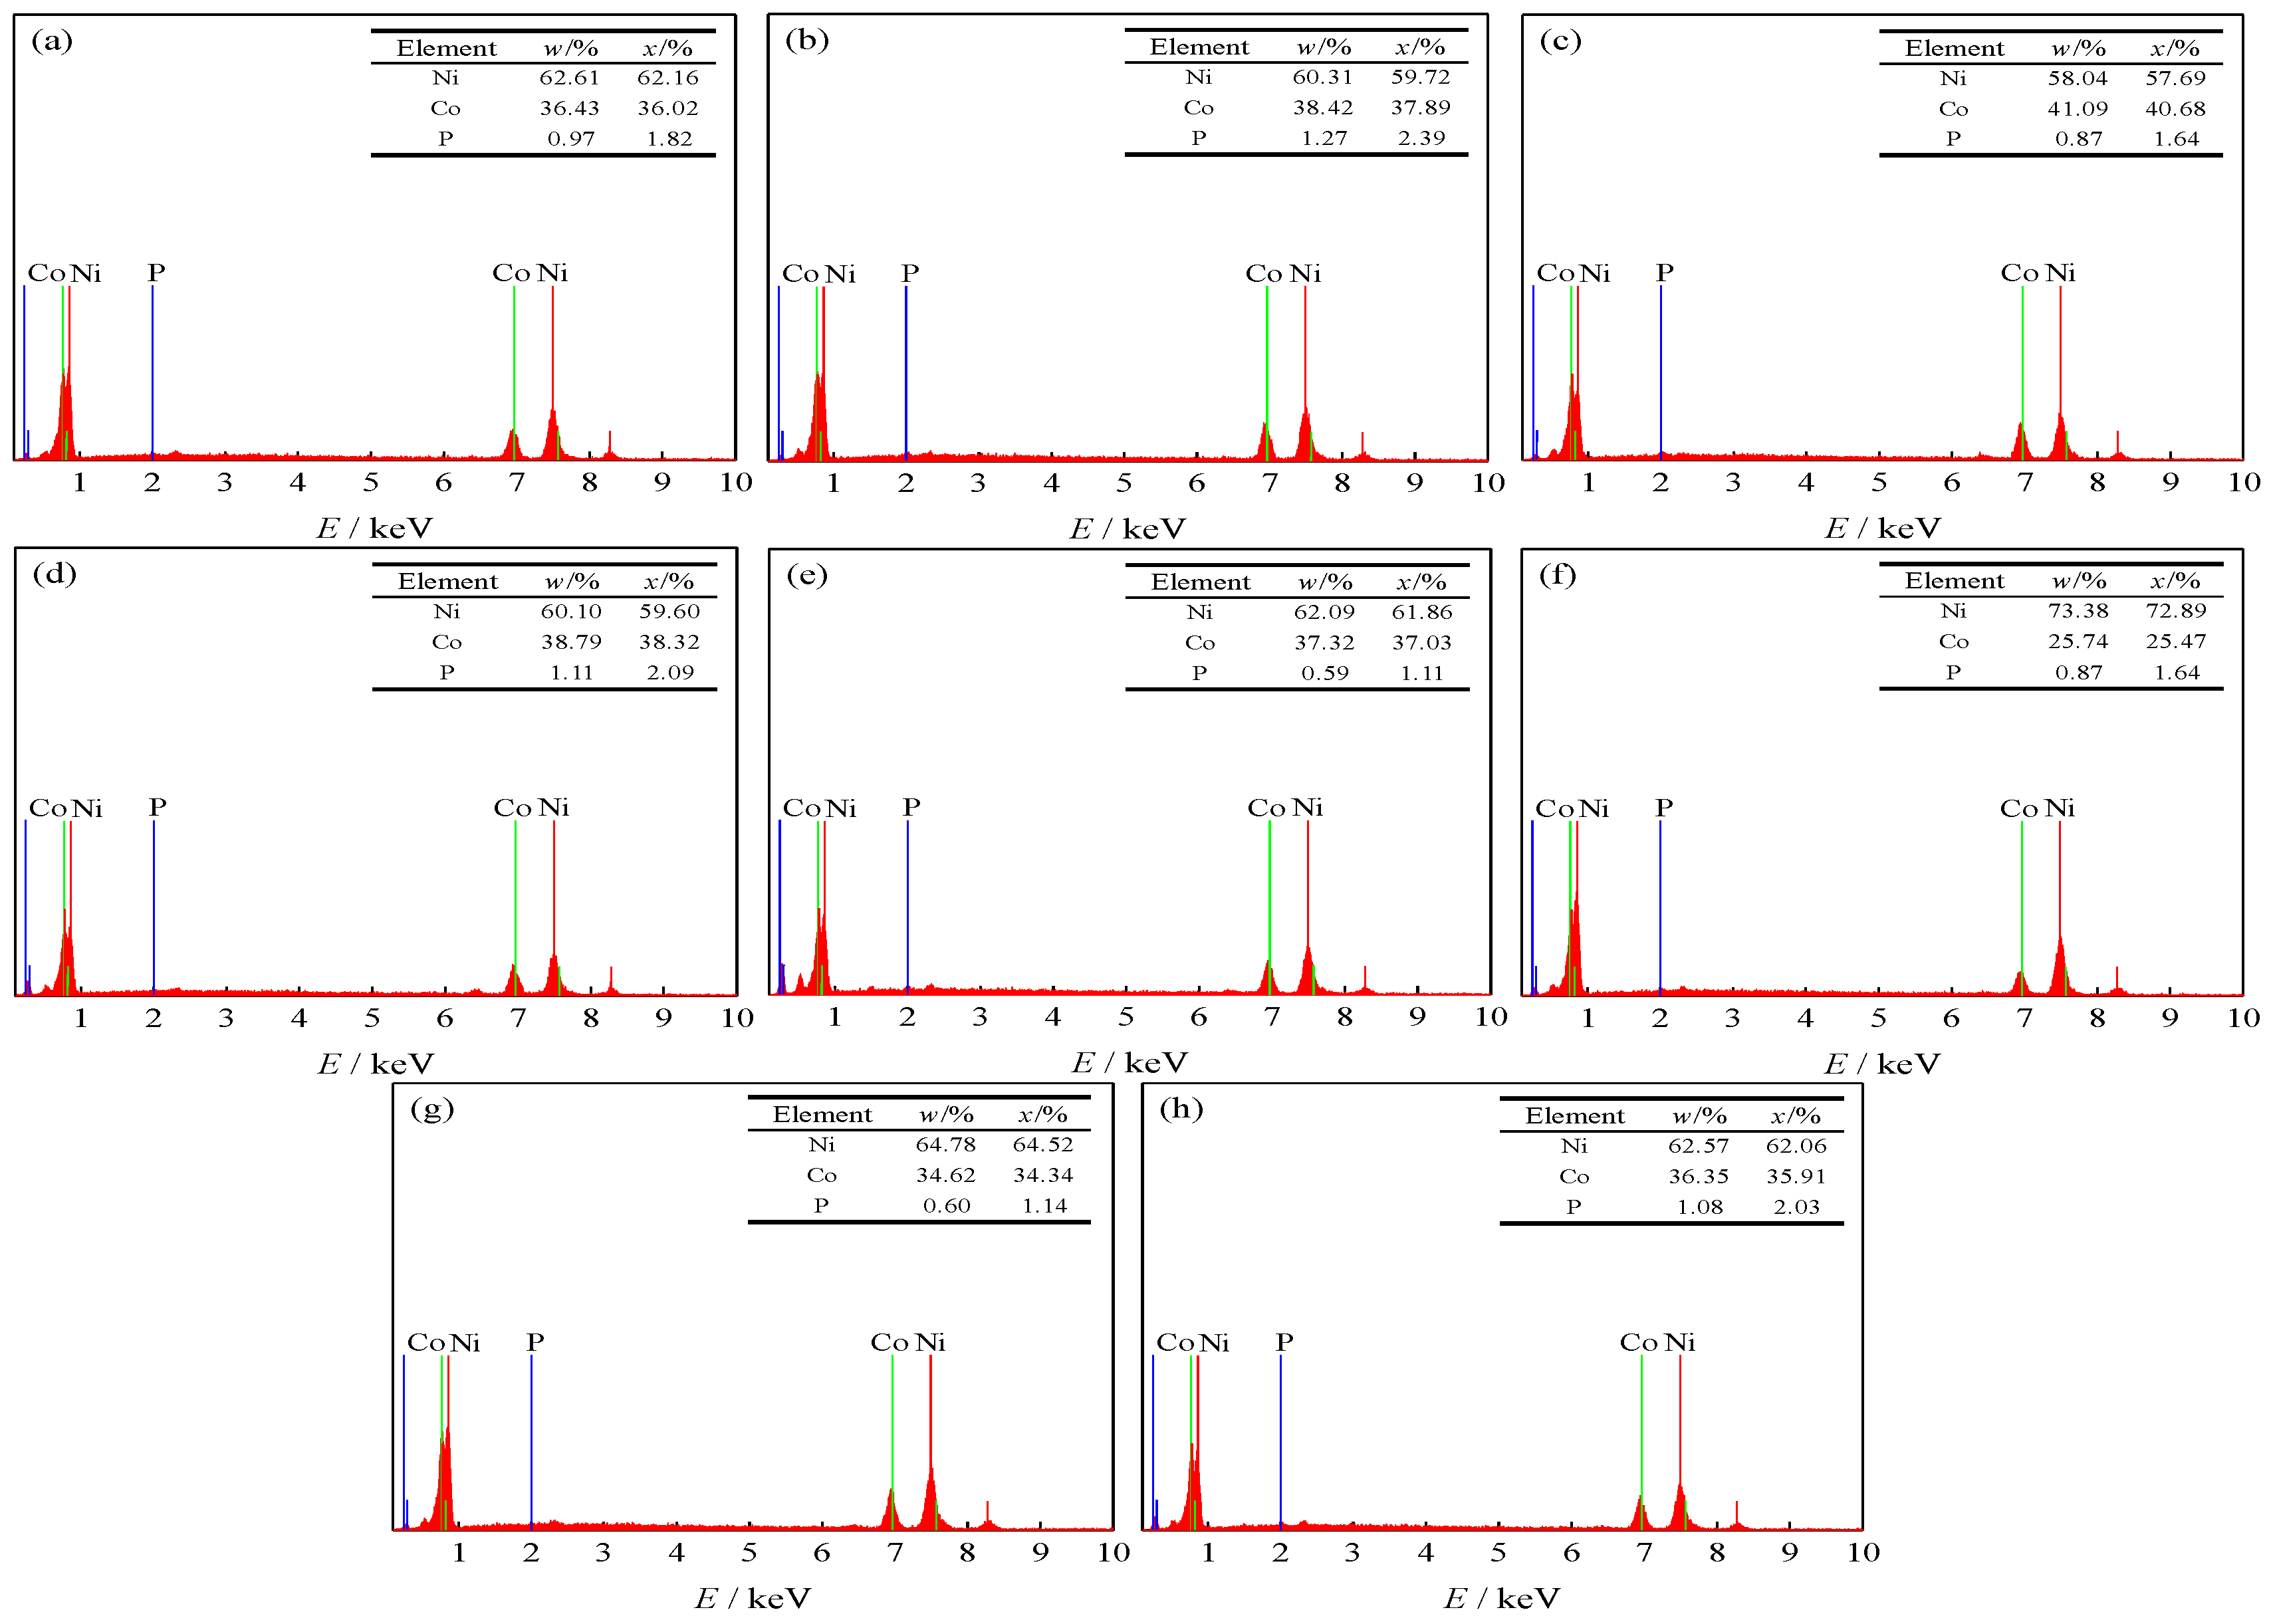
3.4. EDS Spectra of Samples

The EDS spectra of samples were prepared with various pulse frequencies and duty cycles, as illustrated in Figure 5. Additionally, Figure 5a–e presents the coatings deposited with varying pulse frequencies ranging from 2, 3, 4, 5, to 6 kHz at a constant duty cycle of 80%. The contents of the Ni element and Co element in samples at a pulse frequency of 2 kHz were 62.61 wt·% and 36.43 wt·%, respectively. It is clear that the content of the Co element in the deposit reached 41.09 wt·% at a 4 kHz pulse frequency and 80% duty cycle. Figure 5f–h shows the effects of duty cycles on EDS spectra of samples. The contents of the Ni element and Co element in samples at a duty cycle of 40% were 73.38 wt·% and 25.74 wt·%, respectively. It is clear that the content of the Co element reached 41.09 wt·% at an 80% duty cycle. The above phenomena may be associated with Co2+ ions from Co(OH)2 adsorption layers on the cathode surface, which effectively hindered the passage of Ni2+, thereby causing Co2+ to be preferentially deposited. Therefore, the content of the Co element became larger when the duty cycle was in a suitable range.

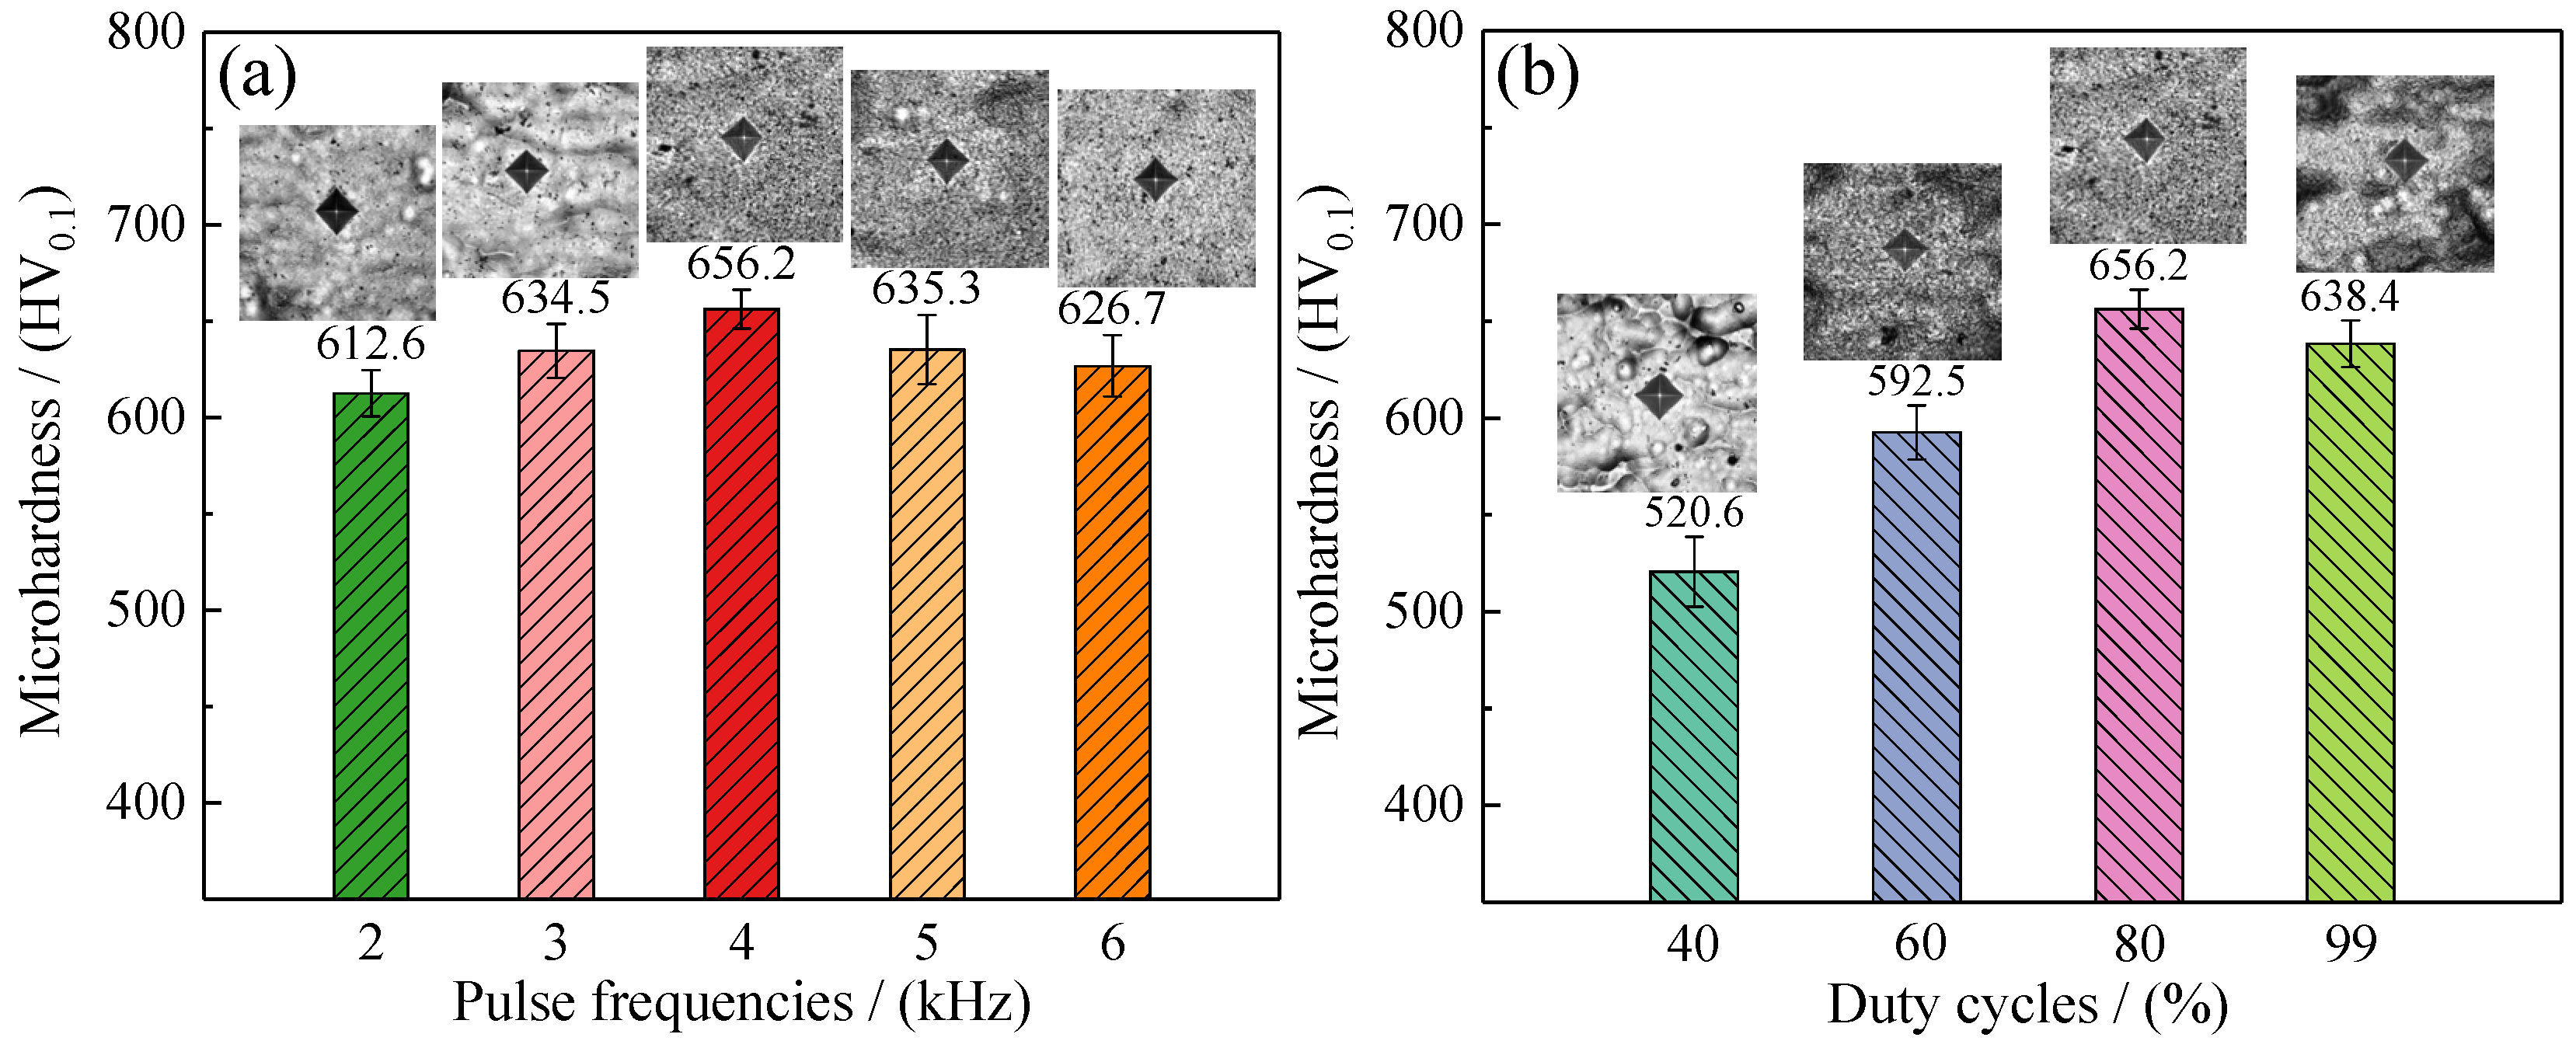
3.5. Microhardness of Samples

The microhardness of samples with varying pulse frequencies and duty cycles are displayed in Figure 6a,b. From Figure 6a, it can be seen that the pulse frequencies have an influence on the microhardness of samples deposited using jet electrodeposition. When the pulse frequency was set at 2 kHz, the microhardness of samples corresponded to 612.6 HV0.1. When the pulse frequency was set at 4 kHz, the microhardness of samples reached 656.2 HV0.1. With further increases in pulse frequencies, the microhardness of samples was observed to decrease, reaching a value of 626.7 HV0.1 at 6 kHz. In addition, the microhardness of steel C1045 substrates corresponded to 246.5 HV0.1, which was nearly 37.5% that of the samples at 4 kHz. Figure 6b shows the effect of duty cycles on the microhardness of samples. The effect of duty cycles on the microhardness of samples was observed to be greater than that of pulse frequencies. The microhardness of samples corresponded to 520.6 HV0.1 when the duty cycle corresponded to 40%. When the duty cycle was 80%, the microhardness of samples reached 656.2 HV0.1. Further increases in the duty cycle caused a subsequent decrease in microhardness.
The above phenomena may be associated with the content of Co and the grain size of samples. It is evident that the content of Co in the samples by jet electrodeposition reached the highest content of 41.09 wt·% at 4 kHz coupled with 80%. The material strength is directly related to the grain size, according to the Hall–Petch relationship. A higher grain boundary density corresponds to a smaller grain size, which indicates better microhardness [47]. Meanwhile, the grain size for samples in the (111) plane was derived from the Scherrer equation. The data showed that the grain size of samples reached 20.6 nm at 4 kHz coupled with 80%. As a result, the microhardness of samples obtained a maximum value.

3.6. Wear Resistance of Samples

Figure 7 displays the effect of pulse frequencies and duty cycles on the wear resistance of samples using jet electrodeposition. It was found that the wear scar width decreased from 437.1 µm at 2 kHz to 414.4 µm at 4 kHz. With a further increase in pulse frequency to 6 kHz, the wear scar width of samples increased slightly. Additionally, it was found that the effect of duty cycles on the wear resistance of samples was greater than that of pulse frequencies. It was evident that the wear scar width of samples decreased from 474.5 µm at 40% to 414.4 µm at 80%. With a further increase in duty cycle to 99%, the wear scar width of samples increased slightly. On the other hand, it was also observed that there were no obvious micro-pores or peeling in the coating surface after friction wear resistance tests. Furthermore, the scratch area was relatively flat and the edge of the wear scar presented a hill-like structure, which indicated that the wear mechanism of the samples with varying pulse frequencies was a combination of plastic deformation and adhesive wear. The above phenomena were due to the fact that the alloy coatings’ wear resistance was mainly determined by the friction coefficient and microhardness of the material [48]. Material friction coefficient is directly proportional to the wear loss of a material. In other words, the lower friction coefficient of the coatings coupled with higher microhardness means better wear resistance of the coatings [49]. The high-frequency reciprocating wear test results showed that the friction coefficient of samples with varying pulse frequencies and duty cycles had no considerable variation. Thus, the sample’s wear resistance was mainly determined by the microhardness.
Combined with Figure 6 and Table 1, it is found that the pulse frequencies or duty cycles affected the wear resistance of samples by changing the Co content. The effect of pulse frequencies on the wear resistance of samples is analyzed as follows. When the pulse frequency was small, the content of Co was relatively low, the strength of the samples was insufficient, the average grain size of the coatings was relatively large, and the coatings’ microhardness was low, indicating a worse wear resistance of samples. Within a certain range, the Co content increased with an increase in pulse frequency, and the lower average grain size of the coatings, coupled with higher microhardness, improved the wear resistance. Moreover, when the pulse frequency was 4 kHz, the content of Co reached 41.09 wt·%. The microhardness of samples reached 656.2 HV0.1, and the wear scar width reached 414.4 µm, which improved wear resistance of samples.
On the other hand, when the duty cycle was 40%, the content of the Co element was relatively low (25.74 wt·%), the strength of samples was insufficient, the average grain size was relatively large (30.7 nm), and the coatings’ microhardness was low (520.6 HV0.1), which indicated worse wear resistance of the coatings. In a certain range, the Co content increased with an increase in duty cycle. The lower average grain size (20.6 nm) of the samples, coupled with higher microhardness (656.2 HV0.1), indicated better wear resistance. With a further increase in the duty cycle up to 99%, it was found that the content of the Co element decreased and the microhardness of samples decreased, which increased the wear scar width and decreased the coatings wear resistance.

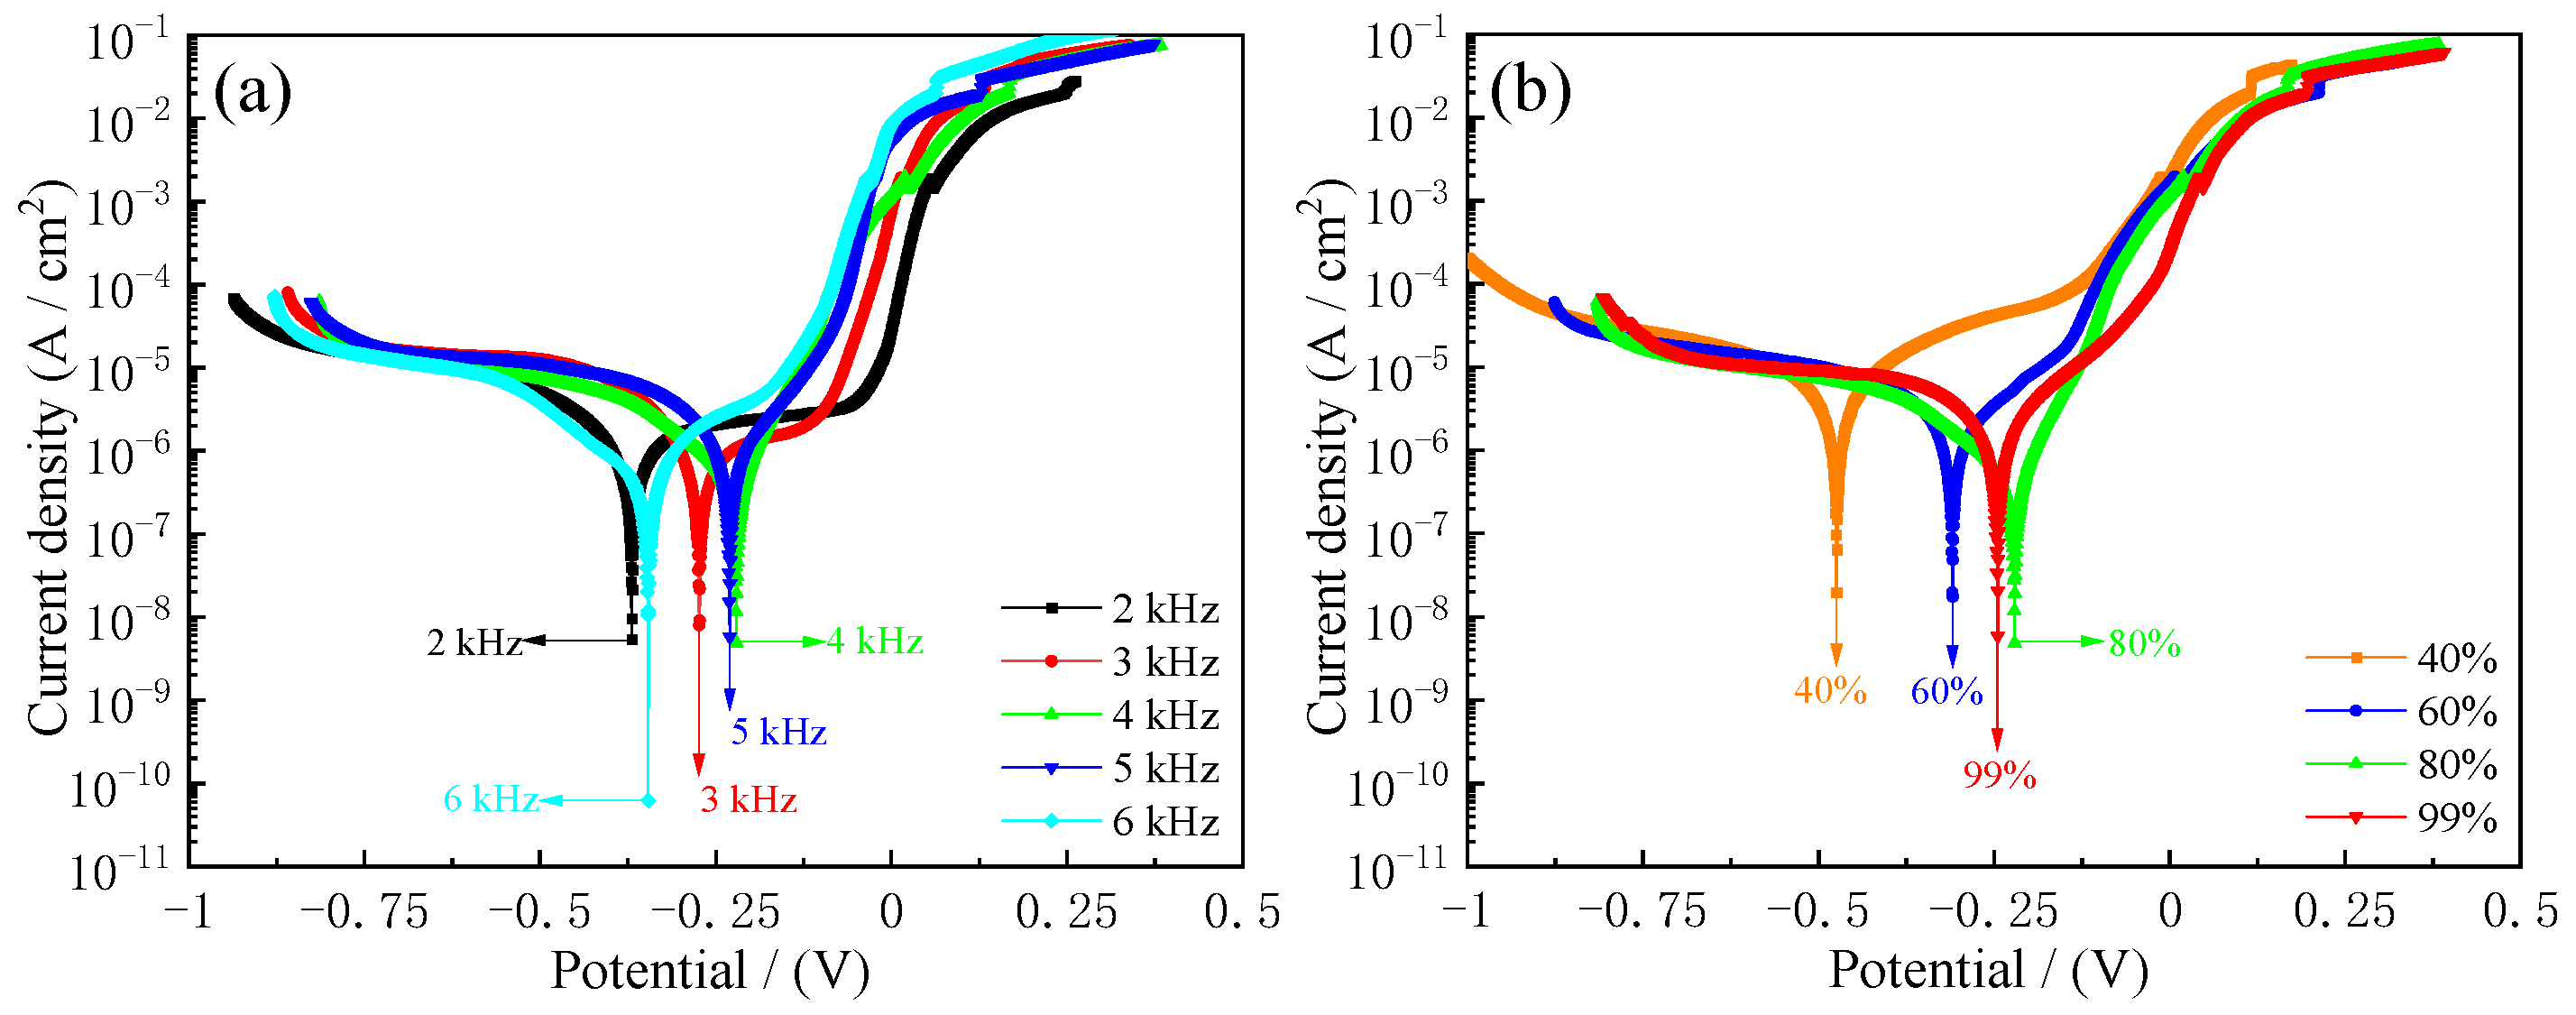
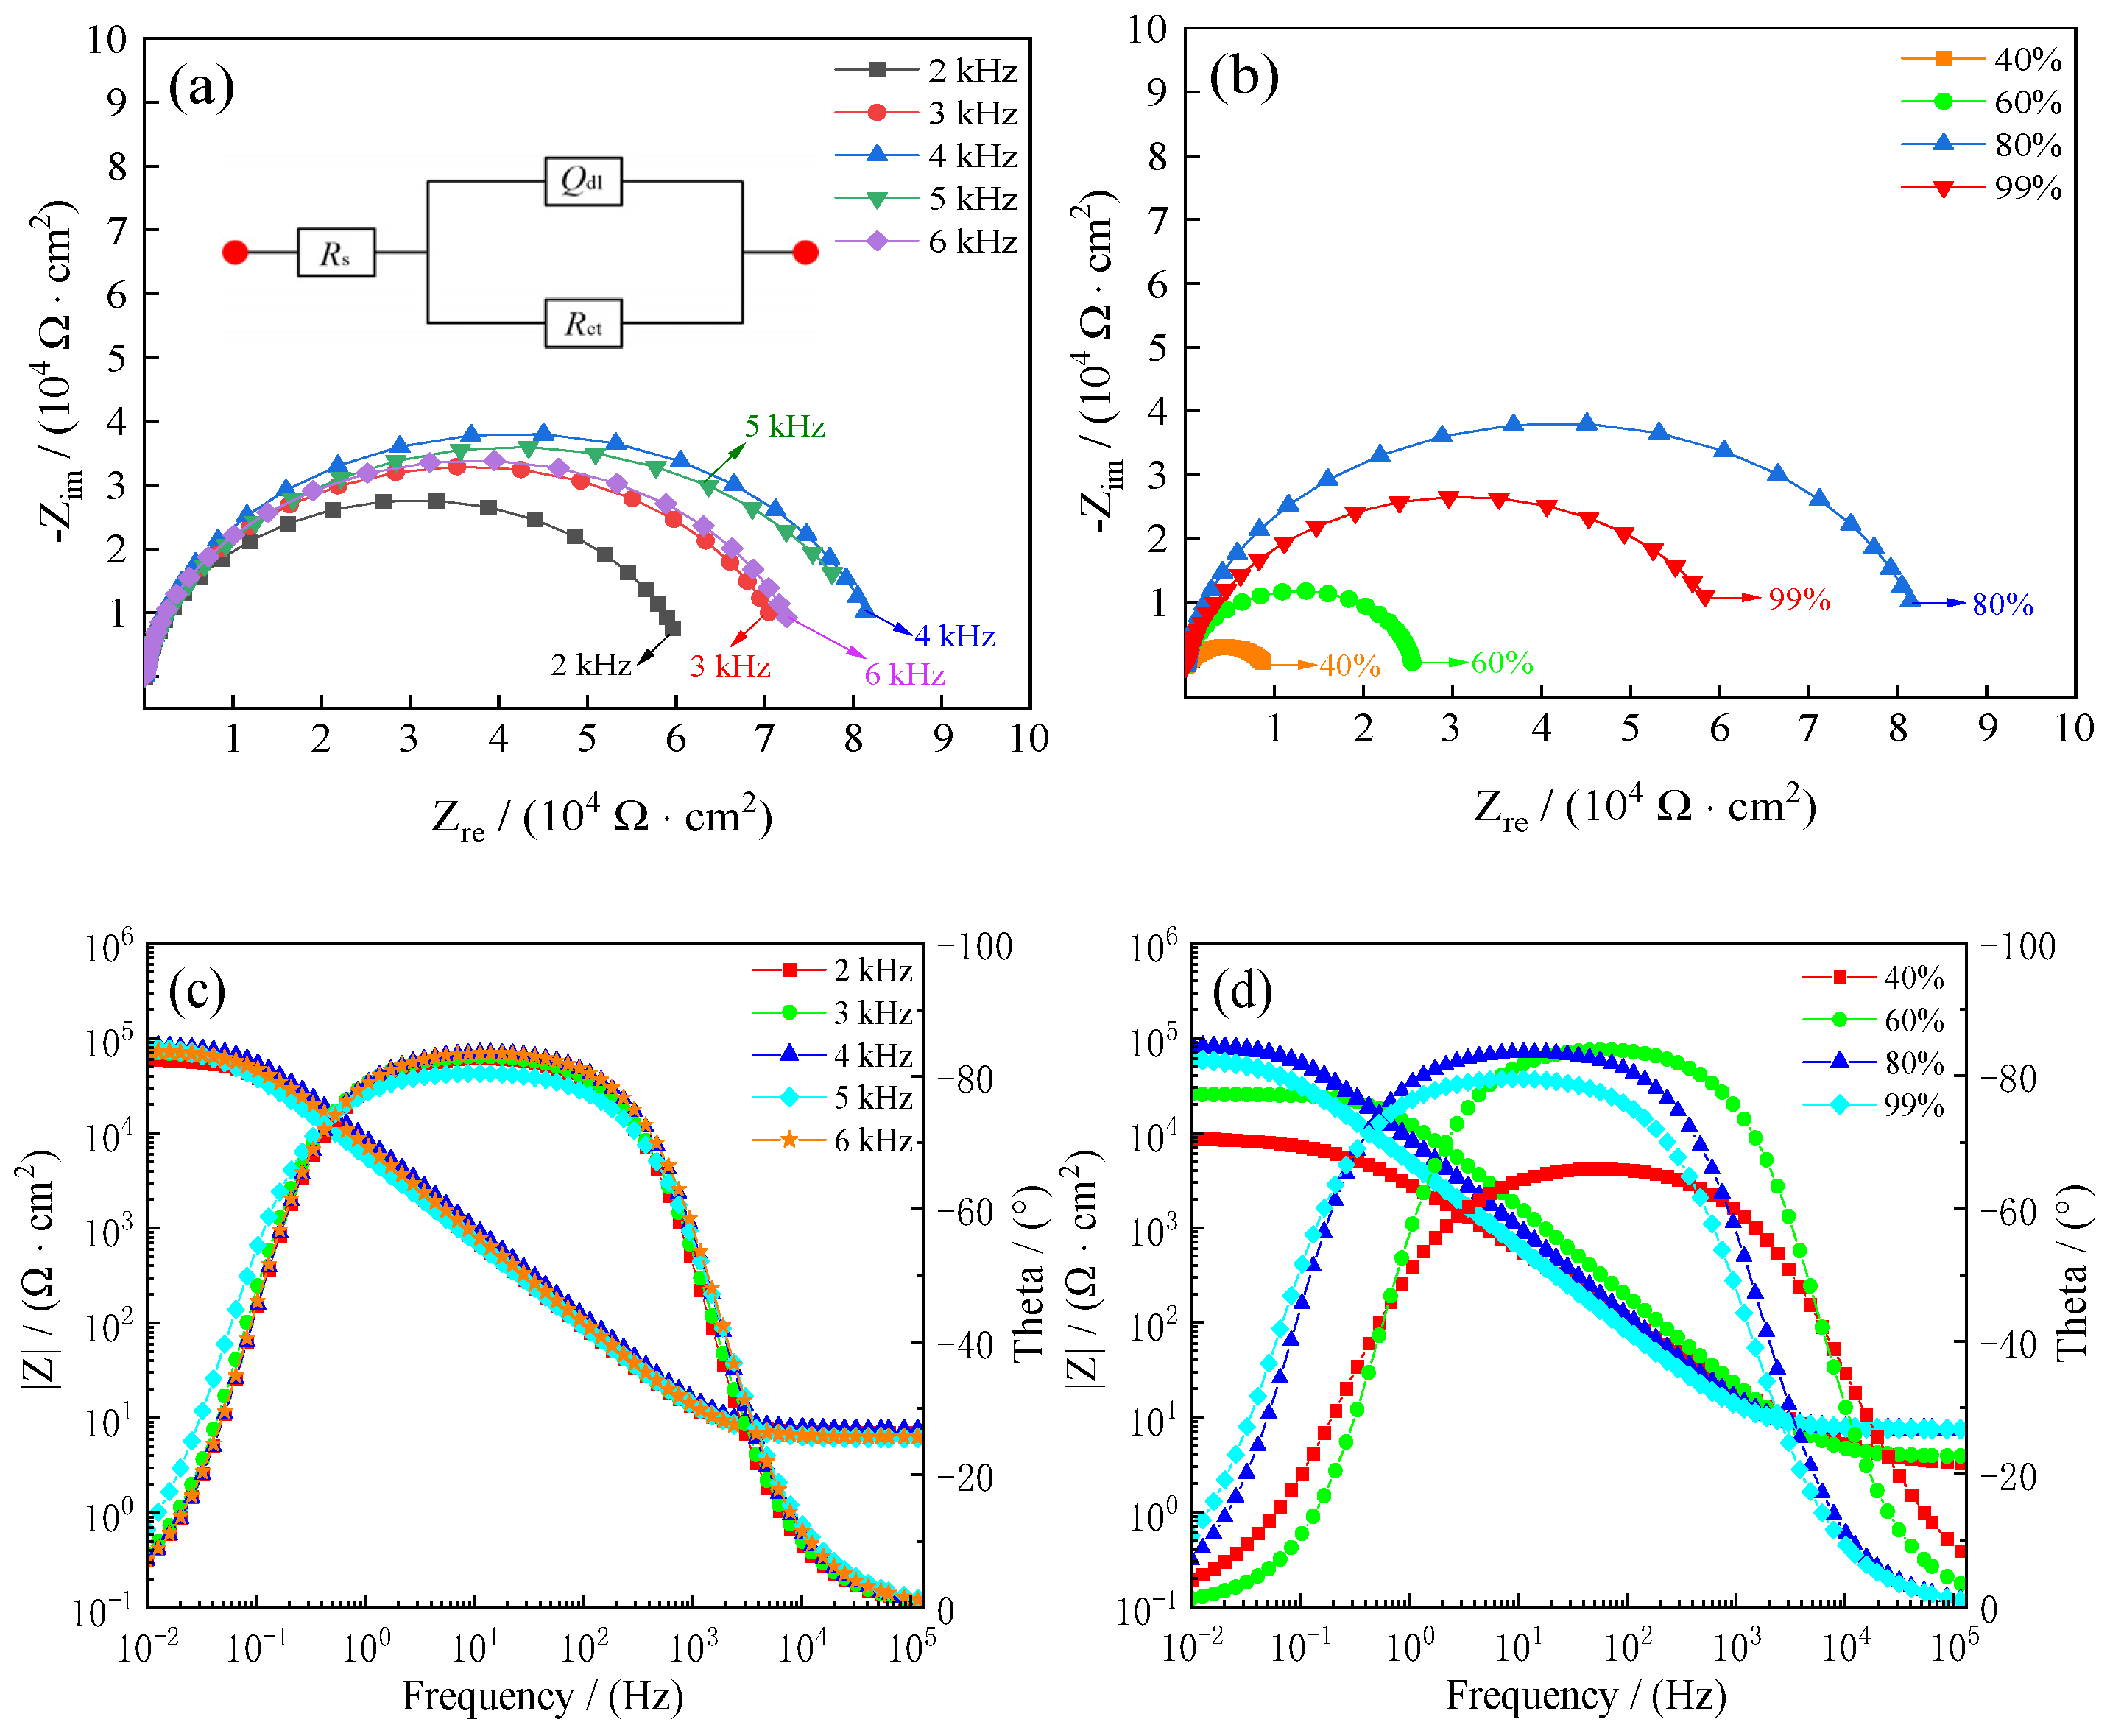
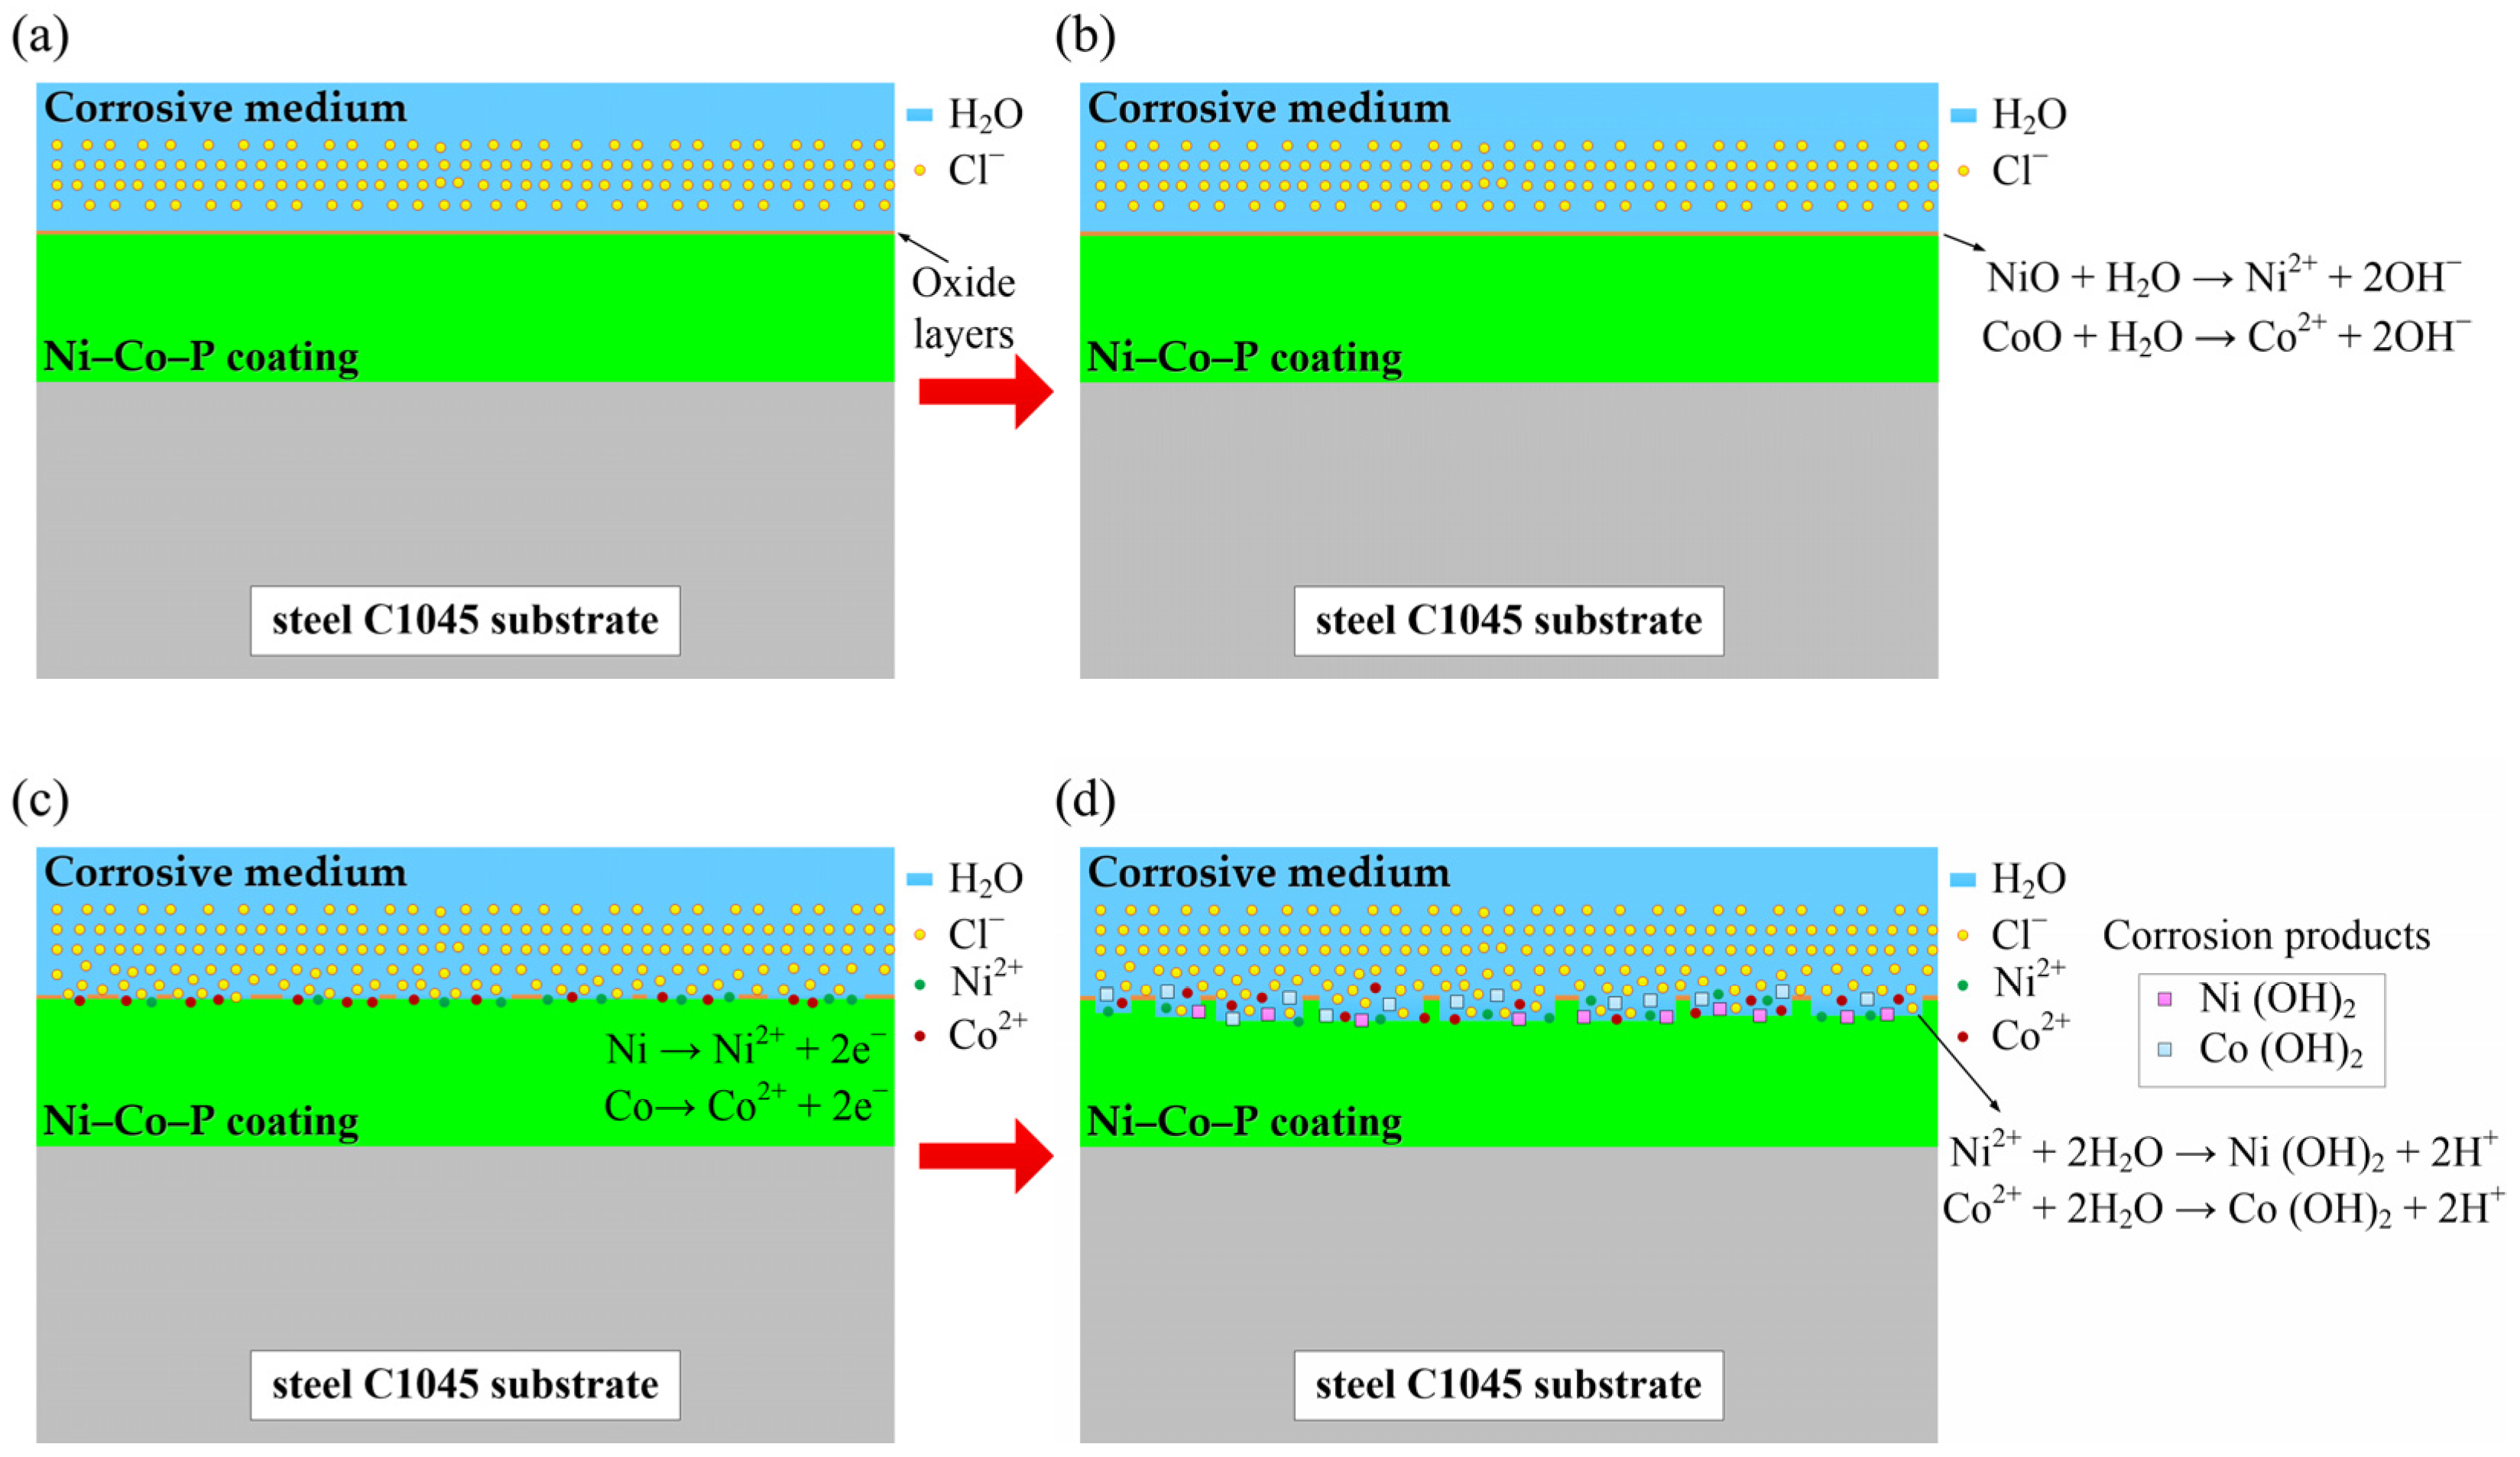
3.7. Seawater Corrosion Resistance of Samples

The potentiodynamic polarization curves of samples deposited with varying pulse frequencies and duty cycles are presented in Figure 8a,b. The extrapolation method was used to determine the corrosion potentials (Ecorr), corrosion current densities (Icorr), anodic Tafel slopes (βa), cathodic Tafel slopes (βc), and corrosion rates (Rcorr), as shown in Table 2. Generally, in a typical polarization curve, higher corrosion potential (Ecorr), coupled with lower corrosion current density (Icorr) and lower corrosion rates (Rcorr), corresponds to better corrosion properties of the coating surface [33]. It can be seen from the Figure 8a and Table 2 that the Ecorr of samples first increased from −369 mV at 2 kHz to −220 mV at 4 kHz and then decreased from −220 mV at 4 kHz to −346 mV at 6 kHz. Additionally, the Icorr reached 0.74 µA·cm−2, and the Rcorr reached 8.9 µm·year−1 at 4 kHz. Combined with Figure 4 and Figure 5, all the samples deposited with varying pulse frequencies showed an FCC, and the Co and Ni atoms combined to form an α-phase solid solution, which effectively hindered polarization and improved the seawater corrosion resistance of the coating. An increase in Co content was beneficial to the improvement of corrosion resistance. Similar results were reported by Fan et al. [50] and Li et al. [29]. Within a certain range, the higher Co content in samples translated to better corrosion resistance of samples in 3.5 wt·% NaCl solution.
It can be seen from the Figure 8b and Table 2 that the variation of duty cycles significantly improved the samples’ surface seawater corrosion resistance. Additionally, it is obvious that the effect of duty cycles on the seawater corrosion resistance of samples was greater than that of pulse frequencies on seawater corrosion resistance of samples. The above phenomena can be mainly described by two aspects. One, at 40% duty cycle, the ON time was very short and the average current density (iave) was smaller. Therefore, the deposition time of metal ions was less leading to a decrease in the reduction process occurring on the cathode surface. Additionally, there were many small pits and holes that appeared on the surface of samples at a low duty cycle, which reduced the seawater corrosion resistance of samples. Moreover, a higher duty cycle corresponds to a longer ON time, which can effectively accelerate the deposition of Ni and Co ions on the cathode surface. Thus, the seawater corrosion resistance of samples was improved. However, at a maximum duty cycle of 99%, the ON time was quite long. Hence, more metal ions got reduced, which meant a subsequent increase in deposition rate. This caused the concentration of metal ions near the cathode to be insufficient in unit time and the grain refinement effect to be weakened. Moreover, this may have increased the hydrogen evolution on the cathode surface, which, in turn, affected the quality of the coating and reduced the seawater corrosion resistance of the coating. On the other hand, it was found that the duty cycles affected the seawater corrosion resistance of samples by changing the content of Co. When the duty cycle was small, the content of Co was relatively low (25.74 wt·% at 40%), which decreased the seawater corrosion resistance of the samples. Within a certain range, the Co content increased (41.09 wt·% at 80%) with an increase in the duty cycle, which promoted the adsorption and aggregation of corrosion products (Co(OH)2), which enhanced the seawater corrosion resistance of samples. However, with further increases in duty cycles, the Co content decreased (36.35 wt·% at 99%). As a result, the coatings’ seawater corrosion resistance was lowered.
To further demonstrate the potentiodynamic polarization properties of samples in artificial seawater, additional research was done using a non-destructive electrochemical impedance spectroscopy (EIS). Figure 9 shows the corrosion resistance of samples deposited with varying pulse frequencies and duty cycles as measured using the EIS method. In addition, Figure 9a,b show the Nyquist plots of samples, while Figure 9c,d present the Bode plots of samples. Generally, the impedance semicircle diameter of Nyquist plots and impedance modulus (|Z|) value of Bode plots are used to evaluate the corrosion resistance. The larger impedance semicircle diameter of the samples coupled with the higher |Z| value indicates better corrosion resistance.
It can be seen that all Nyquist curves of samples showed a depressed semicircle in different dimensions. Moreover, the impedance semicircle diameter of samples showed first an increasing trend and then a slightly decreasing one with increases in the pulse frequencies and duty cycles. Additionally, the impedance semicircle diameter of the samples was largest at 4 kHz pulse frequency and 80% duty cycle, which translated to the highest corrosion resistance of samples. The |Z| in the Bode plots was very smooth. This indicated that all the samples deposited with increases in pulse frequencies exhibited uniform corrosion. It is evident that the |Z| in the Bode plots of samples for 40% was smallest at low frequency. The |Z| in the Bode plots was very smooth. This indicated that all the samples deposited with increases in pulse duty cycles exhibited uniform corrosion. Additionally, it was observed that the equivalent circuit model of samples had a one-time constant.
To further improve comparison and analysis, Table 3 lists the well-fitting results obtained from Figure 9. As shown in Table 3, Rs is the solution resistance and reflects the stable state of test system. CPEdl and ndl are the CPE of the double-layer capacitance. The bigger value of CPEdl indicates a larger exposed coating area, and ndl reflects the roughness of the coatings [51,52,53]. The CPEdl value for the samples at 4 kHz and 60% was smaller than other samples. Furthermore, the ndl value for the samples at 4 kHz and 80% was larger than other samples, indicating that the oxide layer/substrate interface became relatively smooth when the duty cycle reached 80%. In general, the bigger charge transfer resistance (Rct) of samples indicates better corrosion resistance of the samples [54,55]. It is evident that the Rct increased from 6.14 × 10⁴ Ω·cm−2 at 2 kHz to 8.36 × 10⁴ Ω·cm−2 at 4 kHz. With a further increase in pulse frequency to 6 kHz, the Rct of samples decreased, reaching a value of 7.45 × 10⁴ Ω·cm−2. On the other hand, at a duty cycle of 40%, the Rct of samples was 0.89 × 10⁴ Ω·cm−2. It is evident that the Rct of the samples increased from 0.89 × 10⁴ Ω·cm−2 at 40% to 8.36 × 10⁴ Ω·cm−2 at 80%. With a further increase in the duty cycle to 99%, the Rct of the samples decreased and reached 6.23 × 10⁴ Ω·cm−2.
Figure 10 shows the schematic illustration for corrosion evolution modes of samples in artificial seawater. When samples using jet electrodeposition were exposed to the air, Ni and Co elements both form oxide layers of which the main ingredients were NiO and CoO, which can effectively hinder corrosion at early immersion stages (see Figure 10a). It was observed that the original oxide layers were dissolved first in a corrosive environment (see Figure 10b). Then the extremely thin oxide layers were punctured under the attack of Cl at middle immersion stages. The samples’ surface in a corrosive environment underwent active dissolution (see Figure 10c). At late immersion stages (see Figure 10d), Ni2+ and Co2+ reacted further with water to produce corrosion products (Ni(OH)2 and Co(OH)2) on the samples’ surface, which enhanced the seawater corrosion resistance of samples.

4. Conclusions

In this study, Ni–Co–P alloy coatings were successfully fabricated on steel C1045 substrates by jet electrodeposition with varying pulse frequencies and duty cycles. The results showed that the microstructures and properties of samples were significantly affected by pulse frequencies and duty cycles. The following conclusions have been made:
  • All the samples fabricated by jet electrodeposition with varying pulse frequencies and duty cycles exhibited an FCC structure, and a distinct preferred orientation in the (111) plane. Under suitable jet electrodeposition process parameters, the content of Co in samples reached 41.09 wt·%. Additionally, the grain size of samples reached 20.6 nm.
  • The microhardness of samples first increased, and then decreased, with increases in pulse frequencies and duty cycles, while the wear scar width of samples presented the opposite rule. Additionally, the microhardness of samples reached 656.2 HV0.1 and the wear scar width of samples reached 414.4 µm at 4 kHz pulse frequency and 80% duty cycle.
  • Pulse frequencies and duty cycles significantly influenced the seawater corrosion resistance of samples. The corrosion current densities (Icorr) of samples reached 0.74 µA·cm−2, the corrosion rates (Rcorr) reached 8.9 µm·year−1, and the charge transfer resistance (Rct) reached 8.36 × 10⁴ Ω·cm−2 at 4 kHz pulse frequency and 80% duty cycle, which indicated that deposited coatings under these conditions can prolong the longevity of steel C1045 substrates.

Author Contributions

Conceptualization, Y.Z.; methodology, Y.Z. and N.S.M.; validation, Y.Z. and H.J.; formal analysis, Y.Z. and N.S.M.; investigation, H.J. and N.S.M.; resources, Y.Z.; writing—original draft preparation, Y.Z. and N.S.M.; writing—review and editing, Y.Z., N.S.M., and L.C.; visualization, Y.Z.; supervision, Y.Z.; project administration, Y.Z.; funding acquisition, Y.Z. All authors have read and agreed to the published version of the manuscript.

Funding

This research was funded by the Scientific Research Foundation for High-level Talents of Anhui University of Science and Technology, grant number (2022yjrc53).

Institutional Review Board Statement

Not applicable.

Informed Consent Statement

Not applicable.

Data Availability Statement

The data that support the findings of this study are available from the corresponding authors, upon reasonable demand.

Conflicts of Interest

The authors declare no conflict of interest. The funders had no role in the design of the study; in the collection, analyses, or interpretation of data; in the writing of the manuscript; or in the decision to publish the results.

References

  1. Zhang, W.; Li, B.; Ji, C. Synthesis and characterization of Ni-W/TiN nanocomposite coating with enhanced wear and corrosion resistance deposited by pulse electrodeposition. Ceram. Int. 2019, 45, 14015–14028. [Google Scholar] [CrossRef]
  2. Zhang, Y.; Kang, M.; Mbugua, N.S.; Yao, L.; Jin, M.; Zhu, J. Fabrication of Ni–Co–P alloy coatings using jet electrodeposition with varying reciprocating sweep speed and jet gap to improve wear and seawater corrosion resistance. Coatings 2020, 10, 924. [Google Scholar] [CrossRef]
  3. Li, H.; He, Y.; Luo, P.; Xue, S.; Song, J.; Zhang, Z.; Wang, Y.; He, T.; Fan, Y. Construction of ZrN enhanced Ni-W microcrystalline fflm and exploration of its wear and corrosion resistance. Colloid. Surf. A 2022, 647, 129002. [Google Scholar] [CrossRef]
  4. Walsh, F.C.; Larson, C. Towards improved electroplating of metal-particle composite coatings. Trans. IMF 2020, 98, 288–299. [Google Scholar] [CrossRef]
  5. Wu, Y.; Zhang, Z.; Xu, K.; Lu, J.; Dai, X.; Zhu, H.; Yang, S. Effect of laser single pulse energy on micro-structural, mechanical and corrosion properties of amorphous Ni-Fe-P alloy prepared by laser-assisted electrodeposition. Surf. Interfaces 2021, 22, 100811. [Google Scholar] [CrossRef]
  6. Wu, Y.; Xu, K.; Zhang, Z.; Dai, X.; Yang, S.; Zhu, H.; Gao, J.; Liu, Y. Effect of laser irradiation on the electrodeposition process, mechanical and corrosion properties of an amorphous Ni–P coating. Surf. Coat. Technol. 2022, 429, 127961. [Google Scholar] [CrossRef]
  7. Bakonyi, I.; Hansal, W.E.G. Development of pulse-plating technology for the preparation of coatings with varying composition along their thickness: A historical overview. Trans. Inst. Met. Finish 2018, 96, 237–243. [Google Scholar] [CrossRef]
  8. Zhang, Z.; Dai, L.; Yin, Y.; Xu, Z.; Lv, Y.; Liao, Z.; Wei, G.; Zhong, F.; Yuan, M. Electrodeposition and wear behavior of NiCoW ternary alloy coatings reinforced by Al2O3 nanoparticles: Inffuence of current density and electrolyte composition. Surf. Coat. Technol. 2022, 431, 128030. [Google Scholar] [CrossRef]
  9. Agnieszka, B.; Monika, W.; Marta, J.; Zbigniew, S.; Maciej, J.S.; Rafal, B.; Ewa, B.L. Citrate-based baths for electrodeposition of nanocrystalline nickel coatings with enhanced hardness. J. Alloys Comp. 2021, 850, 156857. [Google Scholar]
  10. Mohammad, S.; Seyyed, M.; Saleh, H.; Vahid, T.; Nader, S.; Ali, H.; Amirhossein, M.; Saman, H. Wear behavior of alkaline pulsed electrodeposited nickel composite coatings reinforced by ZnO nanoparticles. Wear 2021, 468, 203591. [Google Scholar]
  11. Tian, S.; Gao, K.; Zhang, H.; Cui, H.; Zhang, G. Corrosion resistance and anti-wear properties: Ni–W–GO nanocomposite coating with lamellar structure. Trans. Indian Inst. Met. 2020, 73, 713–724. [Google Scholar] [CrossRef]
  12. Zhang, Z.; Shen, Z.; Wu, H.; Li, L.; Fu, X. Study on preparation of superhydrophobic Ni-Co coating and corrosion resistance by sandblasting–electrodeposition. Coatings 2020, 10, 1164. [Google Scholar] [CrossRef]
  13. Deo, Y.; Guha, S.; Sarkar, K.; Mohanta, P.; Pradhan, D.; Mondal, A. Electrodeposited Ni-Cu alloy coatings on mild steel for enhanced corrosion properties. Appl. Surf. Sci. 2020, 515, 146078. [Google Scholar] [CrossRef]
  14. Mohammadpour, Z.; Zare, H.R. The effect of graphene oxide nanosheets (GONSs) and graphene oxide quantum dots (GOQDs) on corrosion resistance enhancement of Ni–Fe nanocomposite coatings. JOM 2020, 72, 4495–4504. [Google Scholar] [CrossRef]
  15. Meng, X.; Wang, X.; Zhang, D.; Luo, H.; Xu, C.; Liu, S. Electrodeposition of Ni-Mo/TiO2 nanocomposite coatings on low-carbon steels for improving corrosion resistance. Int. J. Electrochem. Sci. 2020, 15, 6198–6206. [Google Scholar] [CrossRef]
  16. Tozar, A.; Karahan, S.H. Effect of octylphenyl ether group nonionic surfactant on the electrodepositon of the hexagonal boron nitride reinforced Ni-B matrix composite coatings. Surf. Coat. Technol. 2020, 381, 125131. [Google Scholar] [CrossRef]
  17. Demir, M.; Kanca, E.; Karahan, S.H. Characterization of electrodeposited Ni–Cr/hBN composite coatings. J. Alloys Compd. 2020, 844, 155511. [Google Scholar] [CrossRef]
  18. Wasekar, N.P.; Hebalkar, N.; Jyothirmayi, A.; Lavakumar, B.; Ramakrishna, M.; Sundararajan, G. Influence of pulse parameters on the mechanical properties and electrochemical corrosion behavior of electrodeposited Ni-W alloy coatings with high tungsten content. Corros. Sci. 2020, 165, 108409. [Google Scholar] [CrossRef]
  19. Xu, Y.; Gao, Y.; Fan, M.; Lu, X.; Chen, Y.; Zhao, Q. Preparation and investigation of pulse co-deposited duplex nanoparticles reinforced Ni-Mo coatings under different electrodeposition parameters. Ceram. Int. 2022, 48, 29629–29640. [Google Scholar] [CrossRef]
  20. Wasekar, N.P.; Haridoss, P.; Sundararajan, G. Solid particle Erosion of nanocrystalline nickel coatings: Influence of grain size and adiabatic shear bands. Metall. Mater. Trans. A 2018, 49, 476–489. [Google Scholar] [CrossRef]
  21. Ramaprakash, M.; Deepika, Y.; Balamurugan, C.; Nagaganapathy, N.; Sekar, R.; Panda Subhendu, K.; Rajasekaran, N. Pulse electrodeposition of nano-crystalline Ni-W alloy and the inffuence of tungsten composition on structure, microhardness and corrosion propertes. J. Alloys Compd. 2021, 866, 158987. [Google Scholar] [CrossRef]
  22. Chung, C.K.; Chang, W. Effect of pulse frequency and current density on anomalous composition and nanomechanical property of electrodeposited Ni–Co films. Thin Solid Films 2009, 517, 4800–4804. [Google Scholar] [CrossRef]
  23. Yang, Y.; Cheng, Y.F. Fabrication of Ni–Co–SiC composite coatings by pulse electrodeposition—Effects of duty cycle and pulse frequency. Surf. Coat. Technol. 2013, 216, 282–288. [Google Scholar] [CrossRef]
  24. Xia, F.F.; Jia, W.C.; Ma, C.Y.; Yang, R.; Wang, Y.; Potts, M. Synthesis and characterization of Ni-doped TiN thin films deposited by jet electrodeposition. Appl. Surf. Sci. 2018, 434, 228–233. [Google Scholar] [CrossRef]
  25. Jiang, W.; Shen, L.; Qiu, M.; Wang, X.; Fan, M.; Tian, Z. Preparation of Ni-SiC composite coatings by magnetic field-enhanced jet electrodeposition. J. Alloys Compd. 2018, 762, 115–124. [Google Scholar] [CrossRef]
  26. Shen, L.; Wang, Y.; Jiang, W.; Liu, X.; Wang, C.; Tian, Z. Jet electrodeposition multilayer nickel on the surface of sintered NdFeB and corrosion behaviors. Corros. Eng. Sci. Technol. 2017, 52, 311–316. [Google Scholar] [CrossRef]
  27. Zheng, X.; Wang, M.; Song, H.; Wu, D.; Liu, X.; Tan, J. Effect of ultrasonic power and pulse-on time on the particle content and mechanical property of Co-Cr3C2 composite coatings by jet electrodeposition. Surf. Coat. Technol. 2017, 325, 181–189. [Google Scholar] [CrossRef]
  28. Li, H.; Kang, M.; Zhang, Y.; Niu, X.; Liu, C.; Jin, M. Influences of jet parameters on structure and wear resistance of Ni-Co-BN (h) nanocomposite coatings. China Surf. Eng. 2018, 2, 103–112. (In Chinese) [Google Scholar]
  29. Li, H.; Kang, M.; Zhang, Y.; Liu, Y.; Jin, M.; Mbugua, N.S.; Zhu, G.; Liu, C. Fabrication of Ni-Co-BN (h) nanocomposite coatings with jet electrodeposition in different pulse parameters. Coatings 2019, 9, 50. [Google Scholar] [CrossRef]
  30. Tang, Z.; Ye, X.; Tan, J.; Zhang, Q. Effect of flow of bath on properties of Co-Ni alloy coating prepared by jet electrodeposition. Electroplat. Pollut. Control 2020, 3, 11–14. (In Chinese) [Google Scholar]
  31. Liu, X.; Shen, L.D.; Qiu, M.B.; Tian, Z.J.; Wang, Y.H.; Zhao, K.L. Jet electrodeposition of nanocrystalline nickel assisted by controllable friction. Surf. Coat. Technol. 2016, 305, 231–240. [Google Scholar] [CrossRef]
  32. Xia, F.; Jia, W.; Jiang, M.; Cui, W.; Wang, J. Microstructure and corrosion properties of Ni-TiN nanocoatings prepared by jet pulse electrodeposition. Ceram. Int. 2017, 43, 14623–14628. [Google Scholar] [CrossRef]
  33. Qiao, G.; Jing, T.; Wang, N.; Gao, Y.; Zhao, X.; Zhou, J.; Wang, W. High-speed jet electrodeposition and microstructure of nanocrystalline Ni-Co alloys. Electrochim. Acta 2005, 51, 85–92. [Google Scholar] [CrossRef]
  34. Pang, J.; Li, Q.; Wang, W.; Xu, X.; Zhai, J. Preparation and characterization of electroless Ni-Co-P ternary alloy on fly ash cenospheres. Surf. Coat. Technol. 2011, 205, 4237–4242. [Google Scholar] [CrossRef]
  35. Fetohi, A.E.; Hameed, R.M.A.; El-Khatib, K.M.; Souaya, E.R. Ni-P and Ni-Co-P coated aluminum alloy 5251 substrates as metallic bipolar plates for PEM fuel cell applications. Int. J. Hydrogen Energy 2012, 37, 7677–7688. [Google Scholar] [CrossRef]
  36. Khan, M.R.; Nicholson, E.L. Magnetic properties and microstructure of electroless plated Co-Ni-P and Co-P thin films for longitudinal recording. J. Magn. Magn. Mater. 1986, 54, 1654–1656. [Google Scholar] [CrossRef]
  37. Behboudi-Khiavi, S.; Javanbakht, M.; Mozaffari, S.A.; Ghaemi, M. Facile pulse elecrodeposition of LixMnO2 nano-structures as high performance cathode materials for lithium ion battery. Electrochim. Acta 2018, 261, 491–502. [Google Scholar] [CrossRef]
  38. Zhang, Y.; Kang, M.; Yao, L.; Mbugua, N.S.; Jin, M.; Zhu, J. Study on the wear and seawater corrosion resistance of Ni-Co-P alloy coatings with jet electrodeposition in different jet voltages and temperatures of plating solution. Coatings 2020, 10, 639. [Google Scholar] [CrossRef]
  39. Wang, C.; Shen, L.; Qiu, M.; Tian, Z.; Jiang, W. Characterizations of Ni-CeO2 nanocomposite coating by interlaced jet electrodeposition. J. Alloys Compd. 2017, 737, 269–277. [Google Scholar] [CrossRef]
  40. Yu, Y.D.; Lou, J.W.; Li, W.; Sun, L.X.; Ge, H.L.; Wei, G.Y. Study on preparation of CoPt-W alloy films by electrodeposition. Mater. Sci. Technol. 2013, 28, 448–453. [Google Scholar] [CrossRef]
  41. Guglielmi, N. Kinetics of the deposition of inert particles from electrolytic baths. J. Electrochem. Soc. 1972, 119, 1009–1012. [Google Scholar] [CrossRef]
  42. Bahadormanesh, B.; Dolati, A. The kinetics of Ni-Co/SiC composite coatings electrodeposition. J. Alloys Compd. 2010, 504, 514–518. [Google Scholar] [CrossRef]
  43. Calderon, J.A.; Henao, J.E.; Gomez, M.A. Erosion-corrosion resistance of Ni composite coatings with embedded SiC nanoparticles. Electrochim. Acta 2014, 124, 190–198. [Google Scholar] [CrossRef]
  44. Jiang, W.; Shen, L.; Xu, M.; Wang, Z.; Tian, Z. Mechanical properties and corrosion resistance of Ni-Co-SiC composite coatings by magnetic field-induced jet electrodeposition. J. Alloys Compd. 2019, 791, 847–855. [Google Scholar] [CrossRef]
  45. Mei, H.; Ding, J.; Xiao, X.; Luo, Q.; Wang, R.; Zhang, Q.; Gong, W.; Wang, Q. Influence of pulse frequency on microstructure and mechanical properties of Al-Ti-V-Cu-N coatings deposited by HIPIMS. Surf. Coat. Technol. 2021, 405, 126514. [Google Scholar] [CrossRef]
  46. Karimzadeh, A.; Sabour Rouhaghdam, A.; Aliofkhazraei, M.; Miresmaeili, R. Sliding wear behavior of Ni–Co–P multilayer coatings electrodeposited by pulse reverse method. Tribol. Int. 2020, 141, 105914. [Google Scholar] [CrossRef]
  47. Shi, X.; Kang, M.; Fu, X.; Feng, H.; Zhang, C.; Liu, Y. Wear resistance of electrodeposited Ni–Mn–SiC composite coatings. Coatings 2021, 11, 72. [Google Scholar] [CrossRef]
  48. Archard, J.F. Contact and rubbing of flat surfaces. J. Appl. Phys. 1953, 24, 981–988. [Google Scholar] [CrossRef]
  49. Zhang, Y.; Kang, M.; Fu, X.; Li, H.; Liu, Y. Surface structure and wear resistance of Ni-Co-P-BN(h)-Al2O3 binary nano composite coatings. Mater. Sci. Technol. 2019, 6, 55–66. (In Chinese) [Google Scholar]
  50. Fan, J.; Liu, Z.; Zhai, H.; Wang, X.; Wang, Y.; Li, Y.; Zhou, X.; Wu, S.; Liu, J. Effect of Co content on the microstructure, spreadability, conductivity and corrosion resistance of Sn-0.7Cu alloy. Microelectron. Reliab. 2020, 107, 113615. [Google Scholar] [CrossRef]
  51. He, D.; Li, G.; Shen, D.; Guo, C.; Ma, H.; Cai, J. Effect mechanism of ultrasound on growth of micro-arc oxidation coatings on A96061 aluminum alloy. Vacuum 2014, 107, 99–102. [Google Scholar] [CrossRef]
  52. Kaseem, M.; Zehra, T.; Khan, M.A.; Saffra, A.R.; Cho, H.; Lee, J.; Lee, G.; Yang, H.W.; Park, N. Guar gum-driven high-energy plasma electrolytic oxidation for concurrent improvements in the electrochemical and catalytic properties of Ti-15 Zr alloy. Surf. Interfaces 2022, 34, 102403. [Google Scholar] [CrossRef]
  53. Kaseem, M.; Choe, H.C. Synchronized Improvements in the Protective and Bioactive Properties of Plasma-Electrolyzed Layers via Cellulose Microcrystalline. ACS Biomater. Sci. Eng. 2023, 9, 197–210. [Google Scholar] [CrossRef] [PubMed]
  54. Jayaraj, J.; Raj, A.S.; Srinivasan, A.; Ananthakumar, S.; Pillai, U.T.S.; Dhaipule, N.G.K.; Mudali, U.K. Composite magnesium phosphate coatings for improved corrosion resistance of magnesium AZ31 alloy. Corros. Sci. 2016, 113, 104–115. [Google Scholar] [CrossRef]
  55. Ji, X.J.; Luan, G.F.; Lyu, J.C.; Cui, L.Y.; Li, S.Q.; Zeng, R.C.; Wang, Z.L. Corrosion resistance and tunable release of ciproflfloxacin-loaded multilayers on magnesium alloy: Effects of SiO2 nanoparticles. Appl. Surf. Sci. 2020, 508, 145240. [Google Scholar] [CrossRef]
  56. Li, B.; Zhang, W.; Li, D. Synthesis and properties of a novel Ni-Co and Ni-Co/ZrO2 composite coating by DC electrodeposition. J. Alloys Compd. 2020, 821, 153258. [Google Scholar] [CrossRef]
Figure 1. Pretreatment solution preparation process and experimental procedure.
Crystals 13 00303 g001
Figure 2. Schematic diagram of a Ni–Co–P alloy coating fabricated by jet-electrodeposition.
Crystals 13 00303 g002
Figure 3. The cross-section morphologies of samples prepared at different pulse frequencies and duty cycles: (a) 2 kHz, 80%; (b) 3 kHz, 80%; (c) 4 kHz, 80%; (d) 5 kHz, 80%; (e) 6 kHz, 80%; (f) 40%, 4 kHz; (g) 60%, 4 kHz; (h) 99%, 4 kHz.
Crystals 13 00303 g003
Figure 4. The XRD patterns of Ni–Co–P alloy coatings prepared at different (a) pulse frequencies and (b) duty cycles.
Crystals 13 00303 g004
Figure 5. EDS spectra of samples prepared at different duty cycles and pulse frequencies: (a) 2 kHz, 80%; (b) 3 kHz, 80%; (c) 4 kHz, 80%; (d) 5 kHz, 80%; (e) 6 kHz, 80%; (f) 40%, 4 kHz; (g) 60%, 4 kHz; (h) 99%, 4 kHz.
Crystals 13 00303 g005
Figure 6. The microhardness of samples prepared at different (a) pulse frequencies, and (b) duty cycles.
Crystals 13 00303 g006
Figure 7. The wear scar width of samples prepared at different duty cycles and pulse frequencies: (a) 2 kHz, 80%; (b) 3 kHz, 80%; (c) 4 kHz, 80%; (d) 5 kHz, 80%; (e) 6 kHz, 80%; (f) 40%, 4 kHz; (g) 60%, 4 kHz; (h) 99%, 4 kHz.
Crystals 13 00303 g007
Figure 8. The potentiodynamic polarization curves of samples prepared at different (a) pulse frequencies and (b) duty cycles.
Crystals 13 00303 g008
Figure 9. Nyquist plots of samples prepared at different (a) pulse frequencies and (b) duty cycles; Bode diagrams of Ni–Co–P alloy coatings prepared at different (c) pulse frequencies and (d) duty cycles; inset of (a) the equivalent electrical circuit for modeling the EIS data. (Rs, Qdl, and Rct are the solution resistance, electric double-layer capacitance, and charge transfer resistance, respectively [56]).
Crystals 13 00303 g009
Figure 10. Schematic illustration for corrosion evolution modes of samples in artificial seawater: (a) and (b) early immersion stages; (c) middle immersion stages, and (d) late immersion stages.
Crystals 13 00303 g010
Table 1. Partial data of samples with varying pulse frequencies and duty cycles.
Pulse Frequencies/(kHz)Duty Cycles/(%)Ni/(wt·%)Co/(wt·%)Grain Size/(nm)Microhardness/(HV0.1)
28062.6136.4324.7612.6
38060.3138.4222.3634.5
48058.0441.0920.6656.2
58060.1038.7921.9635.3
68062.0937.3223.5626.7
44073.3825.7430.7520.6
46064.7834.6226.4592.5
49962.5736.3522.1638.4
Table 2. Analyzing results of potentiodynamic polarization curves of samples with varying pulse frequencies and duty cycles in artificial seawater.
Pulse Frequencies/(kHz)Duty Cycles/(%)Ecorr/
(mV)
Icorr/
(µA·cm−2)
βa/
(mV·dec−1)
βc/
(mV·dec−1)
Rcorr/
(µm·year−1)
280−3692.06494−22024.5
380−2731.65766−14819.6
480−2200.7479−2518.9
580−2300.98121−11011.8
680−3461.12173−41113.6
440−47414.22380−629172.3
460−3095.16403−33262.5
499−2452.59174−24631.3
Table 3. Fitting parameters of the elements in equivalent circuit with varying pulse frequencies and pulse duty cycles.
Pulse Frequencies/(kHz)Duty Cycles/(%)Rs/
(Ω·cm−2)
CPEdl/
(μF·cm−2)
ndlRct/
(104 Ω·cm−2)
2806.982.780.936.14
3806.822.630.937.29
4807.402.040.948.36
5806.093.180.908.32
6806.312.330.947.45
4403.077.180.750.89
4603.881.170.942.55
4997.493.800.896.23
Disclaimer/Publisher’s Note: The statements, opinions and data contained in all publications are solely those of the individual author(s) and contributor(s) and not of MDPI and/or the editor(s). MDPI and/or the editor(s) disclaim responsibility for any injury to people or property resulting from any ideas, methods, instructions or products referred to in the content.

