Abstract
Yttrium-doped barium zirconate (BZY) has emerged as an attractive candidate for application as a proton (H+)-conducting solid electrolyte due to its high ionic conductivity and excellent chemical stability. In this study, the conductivities of BaZr(1−x)YxO3−δ (BZY, x = 0, 0.037, 0.074, 0.148, and 0.22) with different carriers were studied based on density functional theory (DFT) and experiments. The results revealed that yttrium doping can effectively reduce the energy barrier for the migration of protons and oxygen ions (O2−). When comparing the energy barriers for protons and oxygen ions, the energy barriers for proton migration were found to be lower than those for oxygen ion migration, which indicates that a proton conductor can offer the advantages of lower activation energy and, possibly, higher conductivity. An analysis of the electronic structure of the BZYs found that the top of the valence band exceeded the Fermi energy level following yttrium doping. As a result, the electron conductivity increased as the yttrium content increased. Furthermore, this study also tested the total conductivity of BaZr(1−x)YxO3−δ (BZY, x = 0.1, 0.2, 0.3, and 0.4) and found the trend of the total conductivity to be consistent with the results of the DFT calculations.
1. Introduction
In recent years, solid oxide fuel cells (SOFCs) have been widely used in the conversion of chemical energy into electrical energy [1,2,3]. An SOFC is composed of three main components: the cathode, electrolyte, and anode [4,5]. As a core component, the electrolyte is key to the performance of SOFCs [6].
Typically, zirconia-, ceria-, bismuth-oxide-, and perovskite-oxide-based electrolytes are used in SOFCs [7,8]. The zirconia-based electrolyte is represented by 8 mol% Y2 O3-stabilized ZrO2 (8-YSZ), which is the earliest, most mature, and most widely used SOFC electrolyte [9]. Its ionic conductivity is higher than 0.1 S/cm at 1000 °C. X.J. Chen et al. [10] reported a SOFC based on YSZ electrolyte, which showed a conductivity of 0.12 S/cm at 1000 °C. However, this conduction of ions is a thermal activation process, and high conductivity can only be obtained at high temperatures, which leads to a high cost with regard to the jointing material and hinders the long-term stability of SOFCs [5,11]. A new solid proton-conducting electrolyte, such as yttrium-doped barium zirconate (BZY), exhibits lower working temperatures and higher conductivity than YSZ between 300 °C and 600 °C, meaning that it can facilitate the development of intermediate- to low-temperature fuel cell technology [12,13,14]. We call it a proton ceramic fuel cell (PCFC).
As BZY is a protonic, oxygen ionic, and electronic mixed conductor, yttrium doping will directly affect these conductivities, thereby altering the performance of the fuel cell [15,16,17,18]. To reveal the mechanism of BZY conductance, X.J. Li et al. [19] used reactive molecular dynamics (RMD) to simulate the O2− transport properties and mechanisms of BZY coexisting oxygen vacancies, dopants, and edge dislocations. F.M. Draber et al. [20] combined DFT calculations and KMC techniques to simulate the macroscopic oxygen ion conductivity of BZY; the change in the average proton mobility with dopant fraction was also studied by the same method. The average proton mobility first decreases and then increases with the increase in dopant fraction [21]. B. Merinov et al. [22] used density functional theory (DFT) to investigate the proton diffusion paths and rates in Y-doped BaZrO3. Y. Yamazali et al. [23] explored the effect of proton trapping on proton transport in BZY. Protons must overcome a certain association energy and general activation energy to achieve long-range transport, and it has been proposed that proton conductivity can be improved by determining a suitable alternative dopant to reduce the association energy. Although there are many theoretical studies to reveal the mechanism of BZY conductance, and while it is common for authors to report on some of these aspects in isolation, we consider all three aspects in complete research to achieve a greater understanding of this electrolyte material. V.P. Gorelov et al. [24] measured the ionic, proton, and oxygen conductivities as functions of air humidity (pH2O = 0.04 ~ 3.57 kPa) in the BaZr(1-x)YxO3-δ (BZY, x = 0.02 ~ 0.15) over a temperature range of 600 ~ 900 °C. This represents a cumbersome way of revealing the mixed conductivity of BZY coexisting protons, oxygen ions, and electrons through experimental means, where the theoretical calculation is a reliable technology with which to understand the relevant mechanism.
In this work, we combine the computational and experimental methods to analyze the conductive mechanism of BaZr(1-x)YxO3-δ (BZY, x = 0 ~ 0.22) using DFT to clarify the contributions of the protons, oxygen ions, and electrons to the total conductivity under the condition of different yttrium contents. Furthermore, we also explain the dependence of the BZY conductivities on the Y content. First, we calculate the proton energy barriers for reorientation and intra-octahedral hopping in BZY with different yttrium contents. Second, we calculate the migration energy barrier for oxygen ions to investigate the effect on the oxygen ion conductivity in the different BZYs. Third, we calculate the energy band to reflect the electronic conductivities by analyzing the relationship between the valence band and Fermi energy level. Finally, we test the total conductivity of BZY by means of experiments. The influence of yttrium doping on the performance of BZY electrolytes is determined based on the experimental tests, which provide findings consistent with the calculation results.
2. Computational Methods and Materials
2.1. Calculation Details
The works were implemented on the basis of density functional theory (DFT) calculations with Vienna Ab initio simulation package (VASP), and the exchange–correlation functional was described using the Perdew–Burke–Ernzerhof (PBE) parametrization within the generalized gradient approximation (GGA) [25,26,27,28]. The core electrons of each atom were described using the projector-augmented wave method (PAW) [29,30]. The energy cutoff was chosen to be 520 eV. The valence electrons of the pseudopotentials were 2s2 2p4 for O, 5s2 5p6 6s2 for Ba, 4s2 4p6 5s2 4d2 for Zr, 4s2 4p6 5s2 4d1 for Y, and 1s1 for H. All structures were relaxed using the conjugate gradient method until the forces on each atom were less than 0.02 eV/Å. The on-site Coulomb-U correction was adopted for Zr 4d2 and Y 4d1 electrons [31]. A 3 × 3 × 3 Monkhorst-Pack k-point mesh was used to optimize the supercells of BaZrO3, consisting of 3 × 3 × 3 cubic unit cells (135 atoms), and treat the diffusion behavior for protons in the compound. The minimum energy path connecting the initial and final configuration of proton rotation and migration was found using the climbing image nudged elastic band (CI-NEB) method [32,33]. Three images were linearly interpolated between the initial and final states. The formation energy calculation Equation (1) is as follows:
, Ni, and are the total energies of the substrate, the number of the atoms of element i in the BZY structure, and the total energies of the bulk atom of element i, respectively.
BZO was cubic in the space group Pmm [34]. The optimized lattice parameter = 4.27 Å, which is essentially the same as the lattice parameter obtained in previous theoretical studies (a = 4.25 Å) [35,36] and in agreement with the experimental value (a = 4.19 Å).
2.2. Fabrication and Testing of Samples
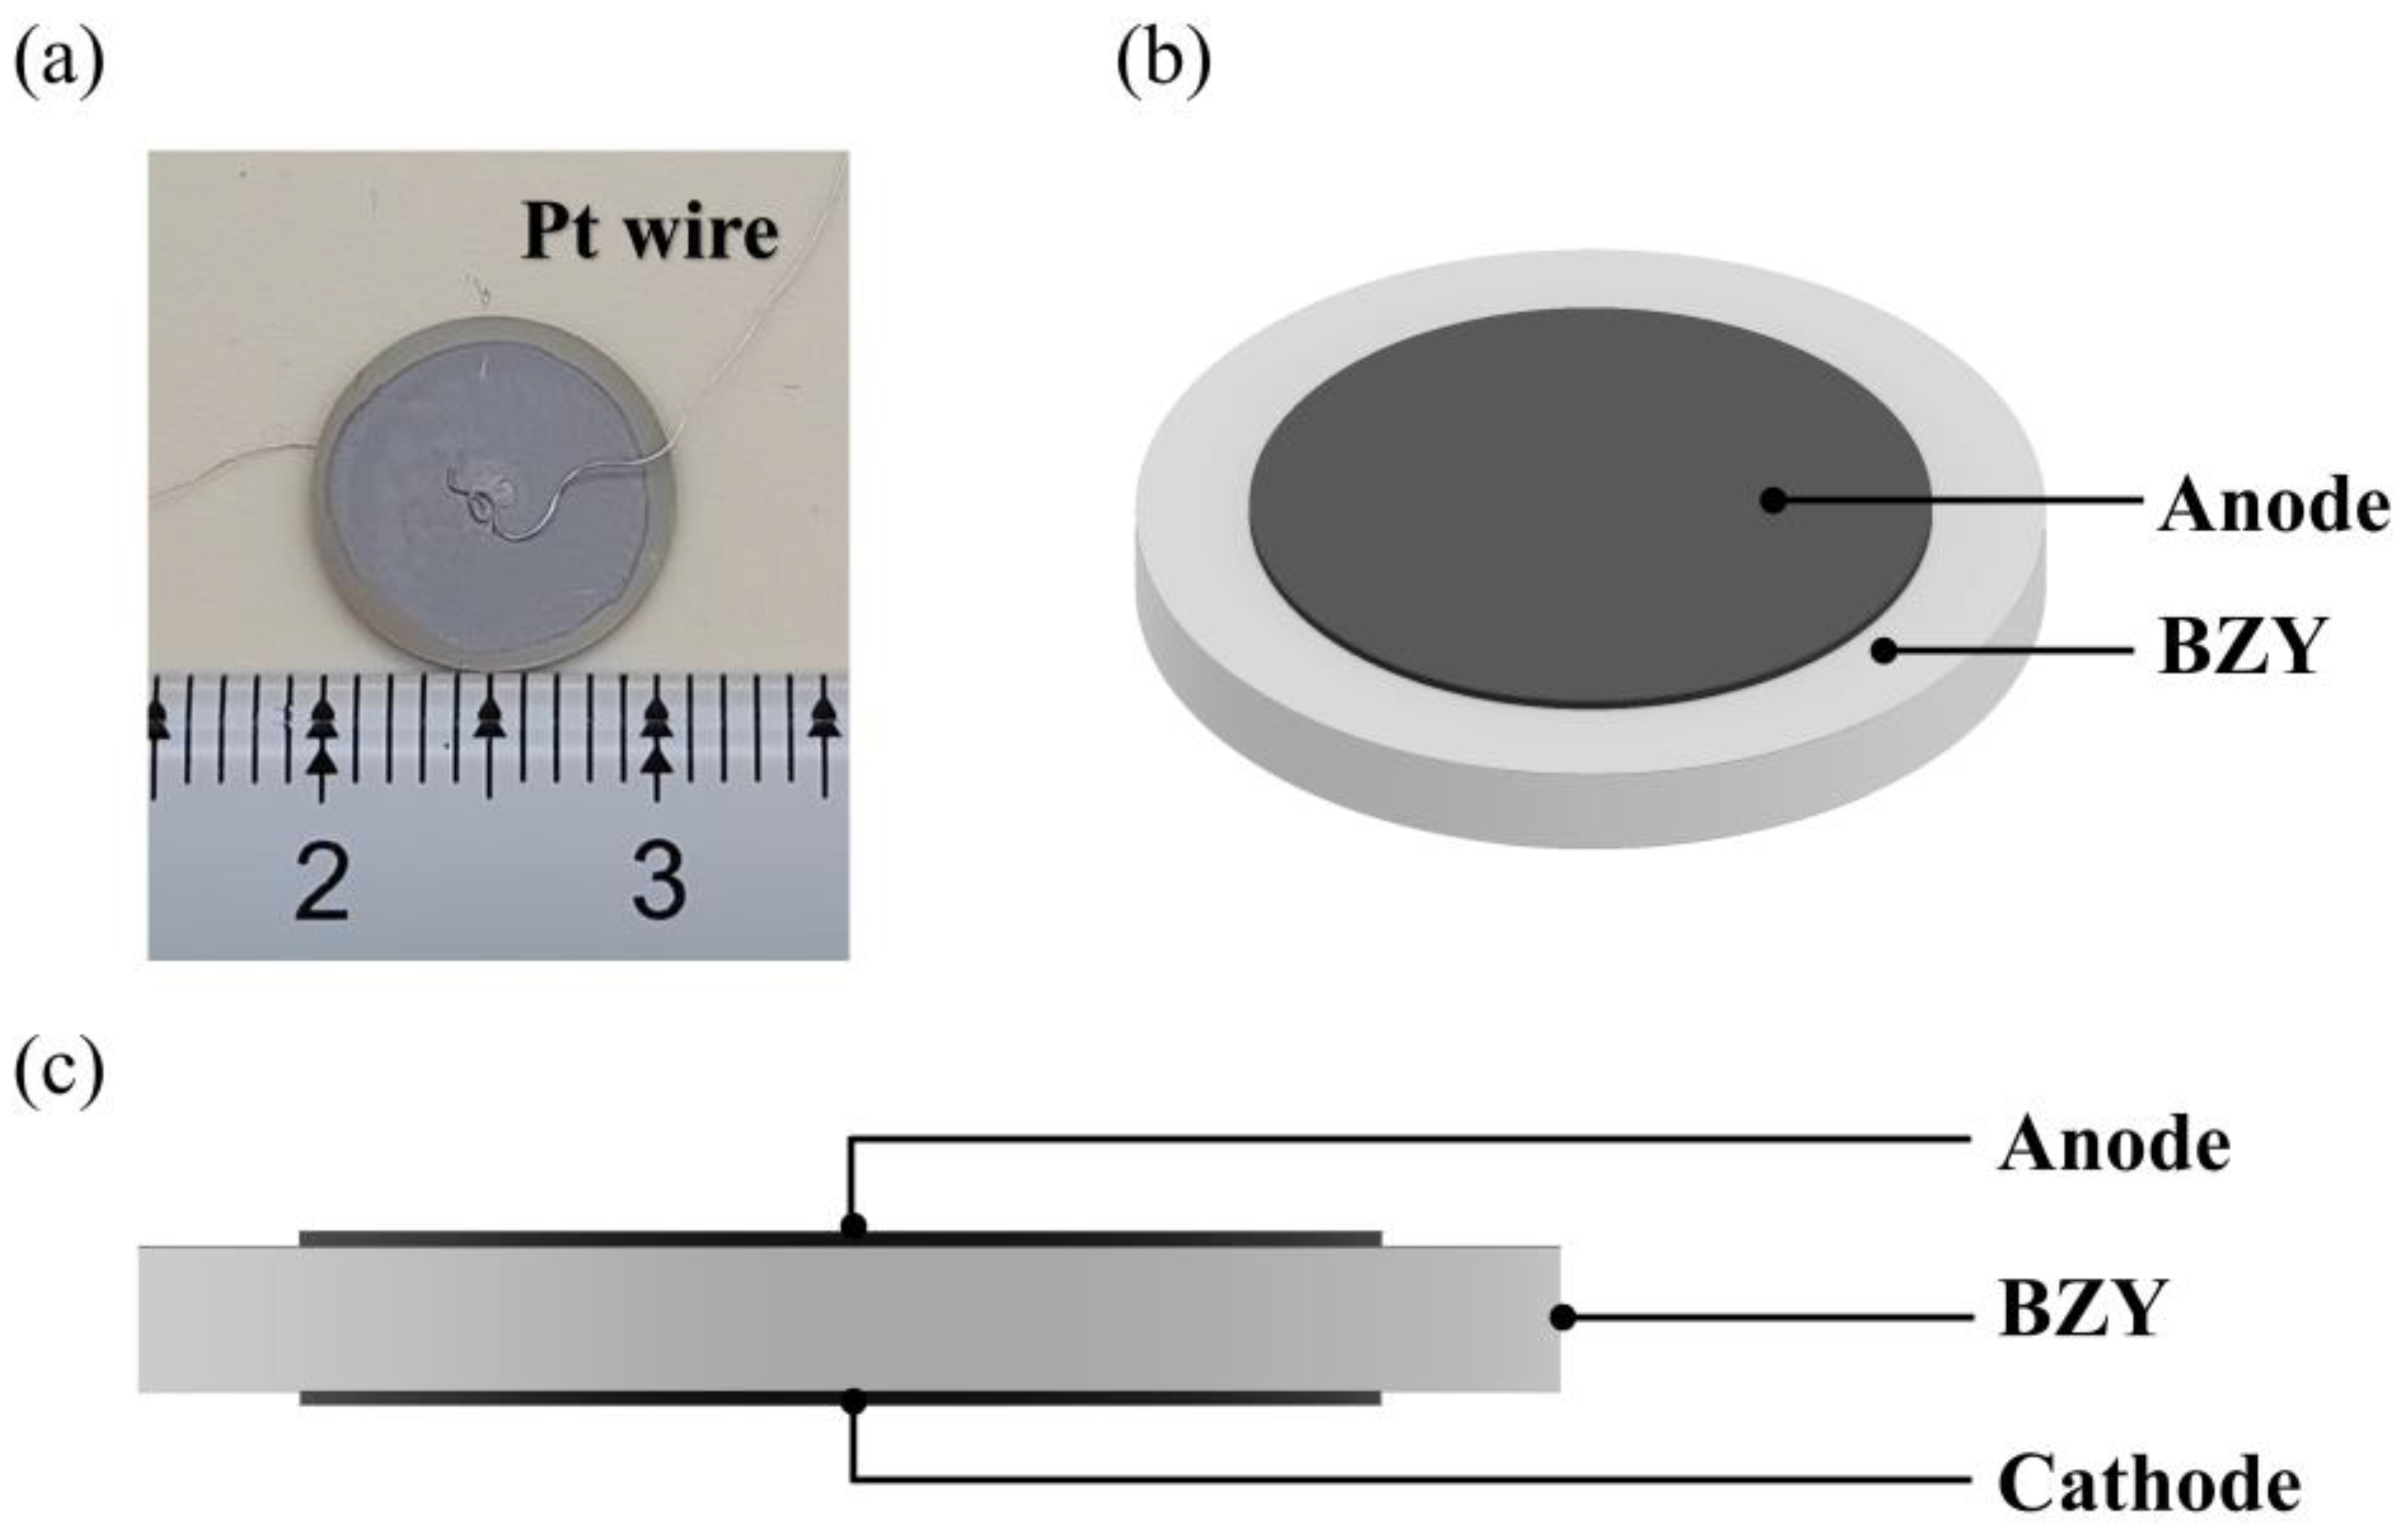
BaZr(1-x)YxO3-δ (BZY, x = 0 ~ 0.4) powders were synthesized via the sol–gel method, and the chelating agent was citric acid. According to stoichiometric ratio, the starting commercial materials Y(NO3)3·6H2O (Macklin, 99.9%), BaCO3 (Macklin, 99.95%), and Zr(NO3)4·5H2O (Macklin, 99.5%) were sequentially added to deionized water. The molar ratio of metal cations to citric acid was controlled at 1: 1.5, and the transparent solution was obtained. Then, the solution was continuously heated and stirred at 100 °C, and 25% NH3 solution was dripped into the solution until it reached neutral (pH ~ 7). The water was continuously evaporated during the heating process, and opaline gel was obtained. After that, the gel was heated at 280 °C in air for 12 h. Whereafter, the obtained ash was ground in an agate mortar and calcined at 1100 °C for 2 h in air. The dry pressing method was used to fabricate the bulk electrolyte, and the binder solution was 3 wt % polyvinyl alcohol and mixed with the calcined powders. The disk-shaped samples were obtained by uniaxial pressing in a cylindrical mold at a pressure of 120 MPa. Then, the electrolyte samples were sintered at 1600 °C for 12 h in air. The platinum paste (Pt-7840, Sino-Platinum Metals, Guiyang, China) was screen-printed on both sides of the sample and calcinated at 900 °C for 2 h in air to prepare electrodes. Platinum wires were used as leads with a small amount of Pt paster as binder. Schematic diagrams of samples are shown in Figure 1.
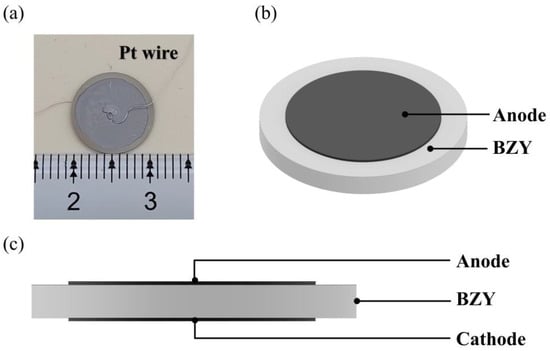
Figure 1.
(a) Sample photograph. (b) The front view of the sample. (c) The side view of the sample.
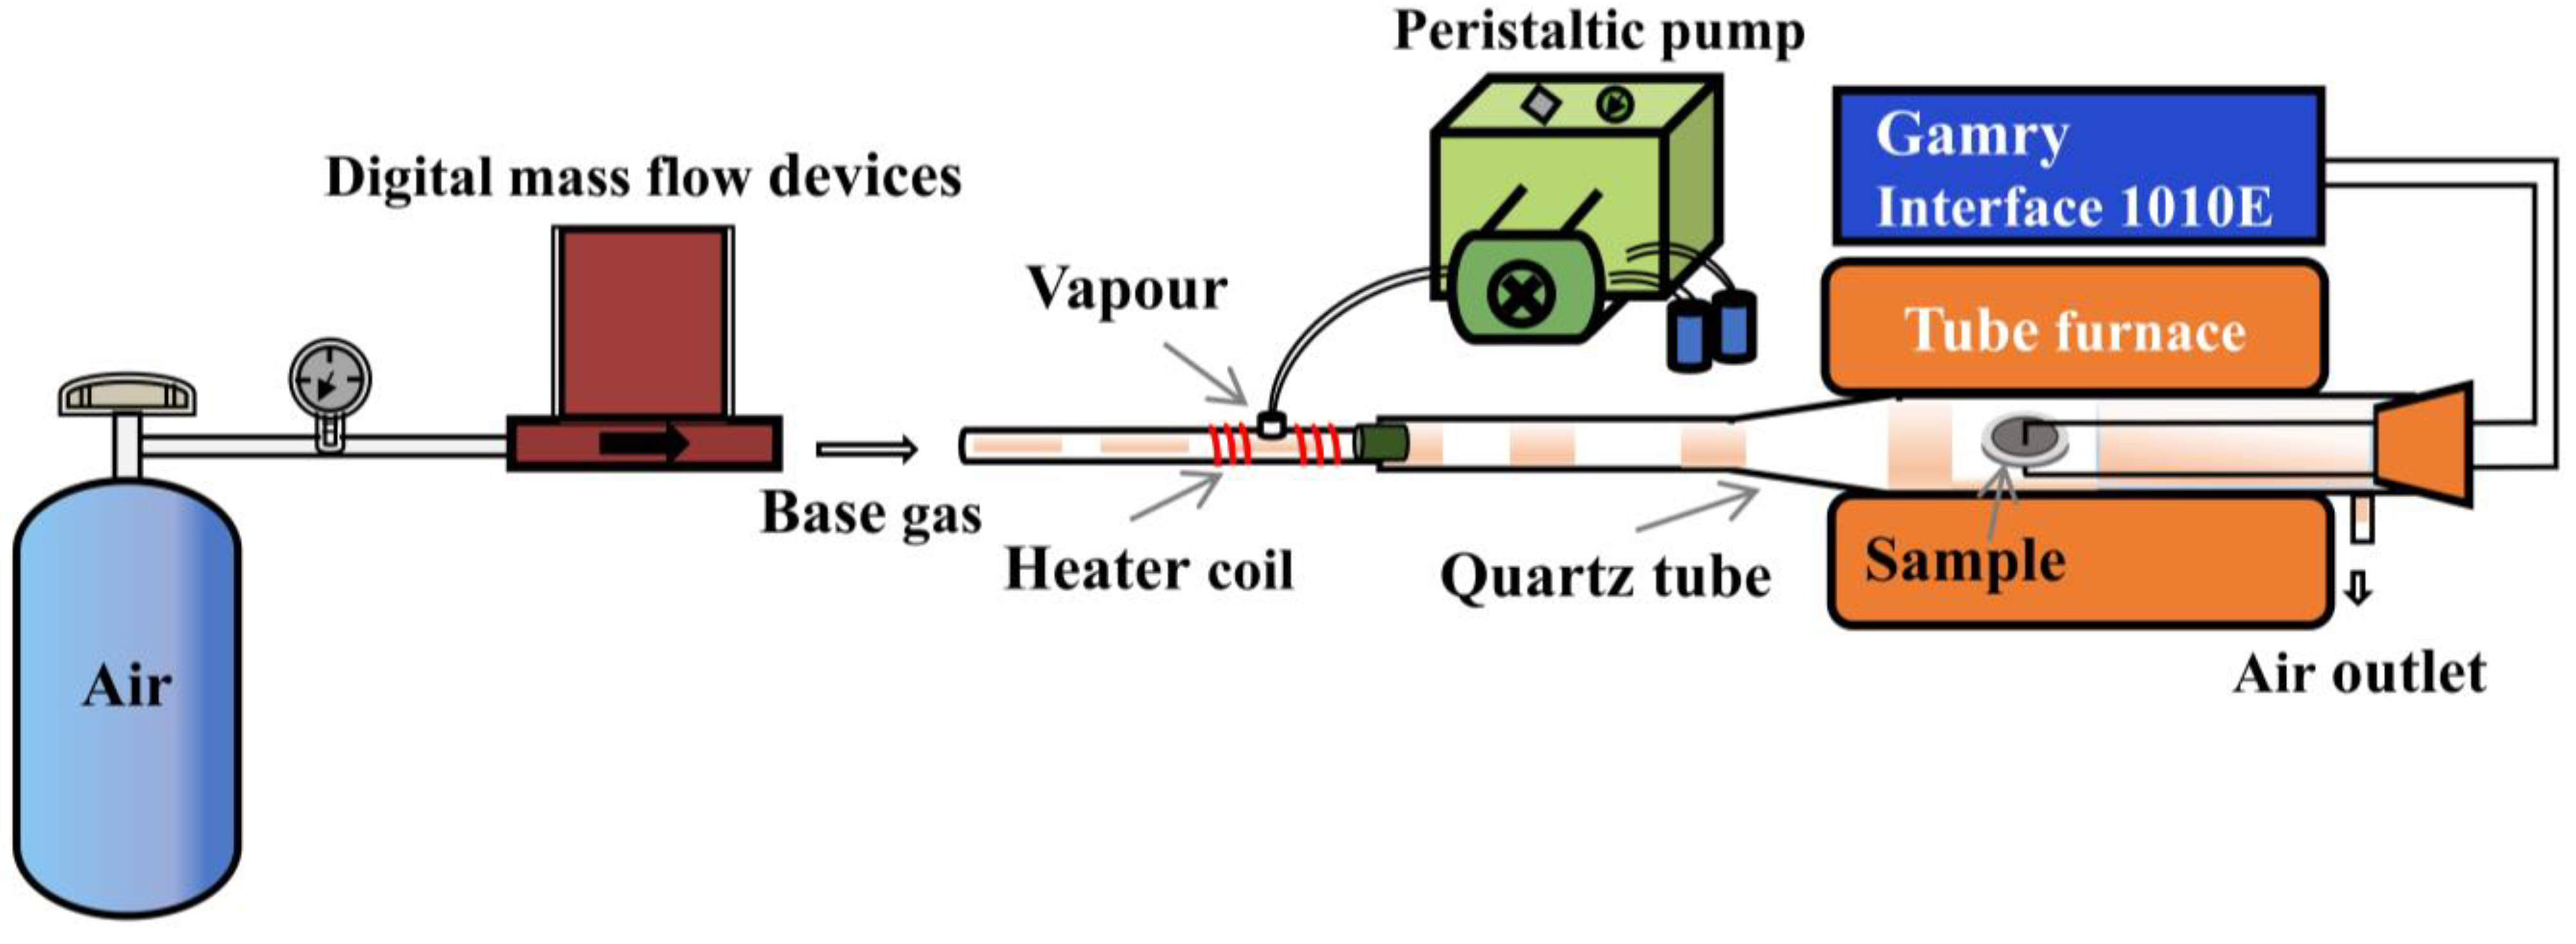
X-ray diffraction (XRD) patterns of the BZY powders were analyzed on a D8 ADVANCE X-ray diffractometer (Bruker, Billerica, MA, USA) using Cu Kα radiation. The testing system for conductivity testing is shown in Figure 2, which consisted of a tube furnace and mass flow controllers. The content of water vapor in the simulated gas was controlled by a peristaltic pump, and the water was vaporized with a heating coil around the stainless-steel tube. Flow rates of the gases were kept at 100 mL min−1. The conductivities were measured using an electrochemical workstation (Interface 1010E, Gamry, Warminster, PA, USA) in the electrochemical impedance spectroscopy (EIS) model. During the tests, the frequency range was from 0.1 Hz to 1 MHz, and the perturbation voltage was 50 mV. Testing temperature was fixed at 450 °C. The testing environment for the conductivity measurements of BZY was 3% H2O +air.
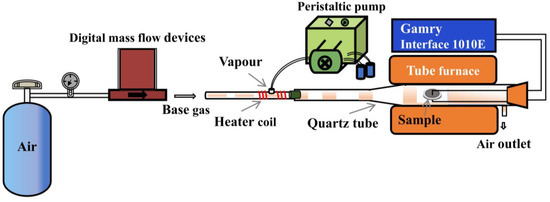
Figure 2.
Conductivity testing system.
3. Results and Discussion
3.1. Computational Analysis
3.1.1. Supercell Structures
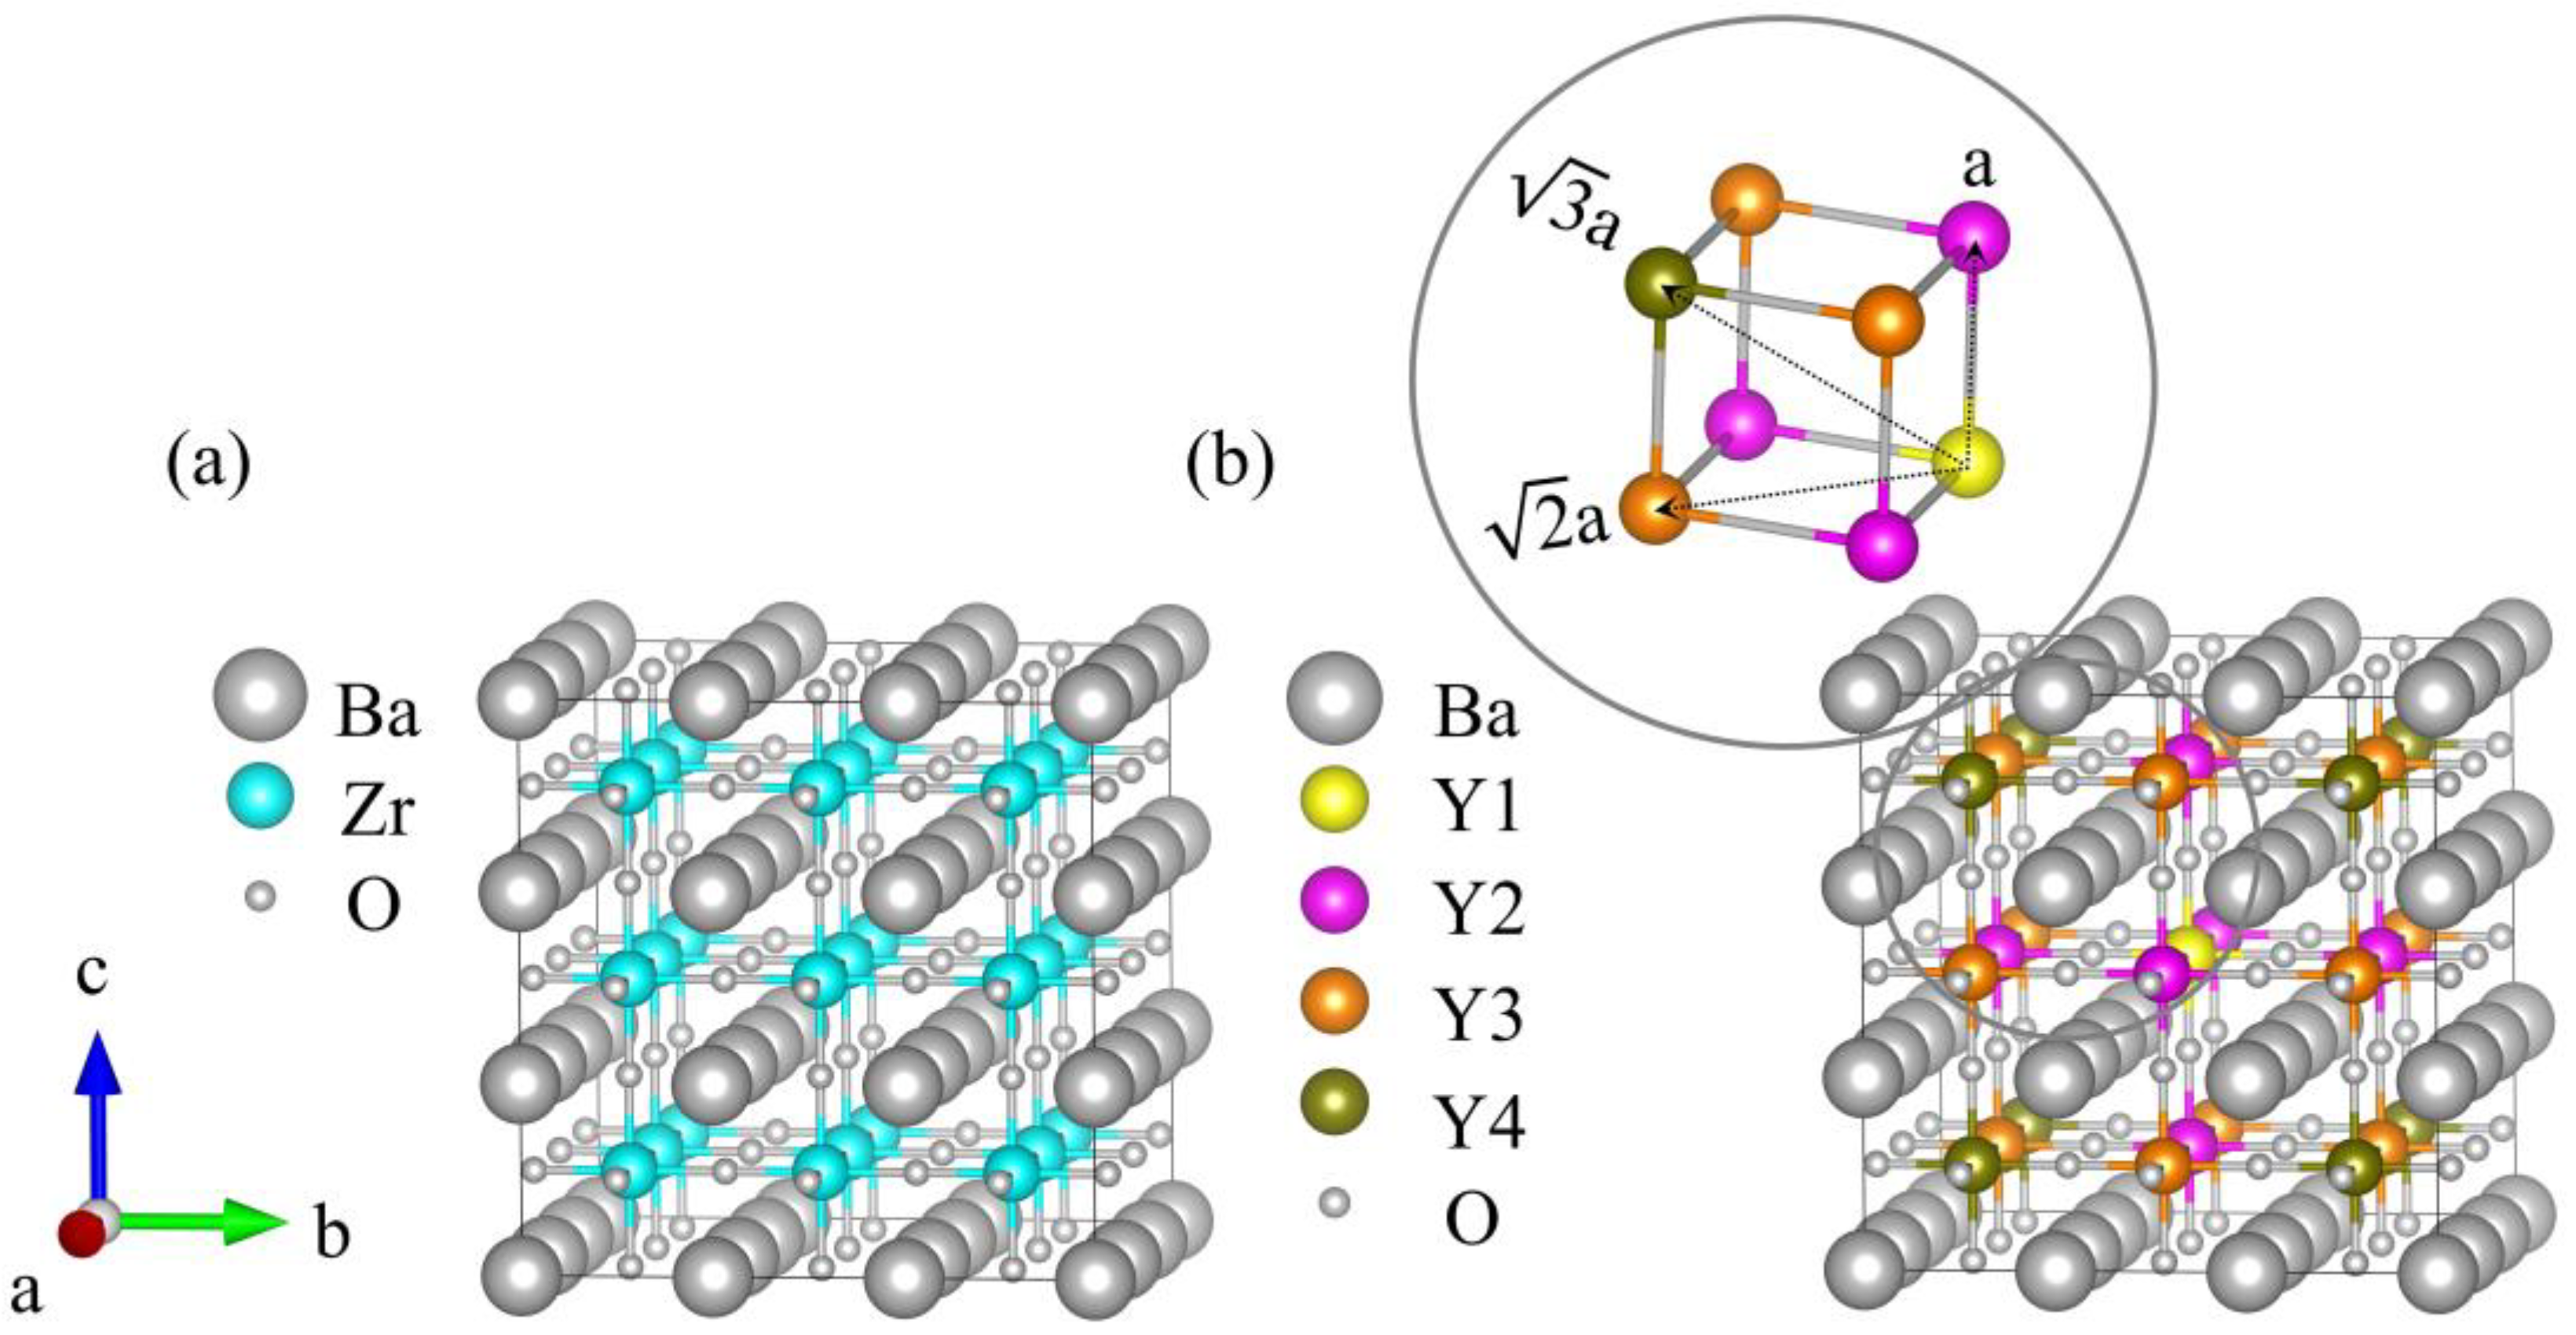
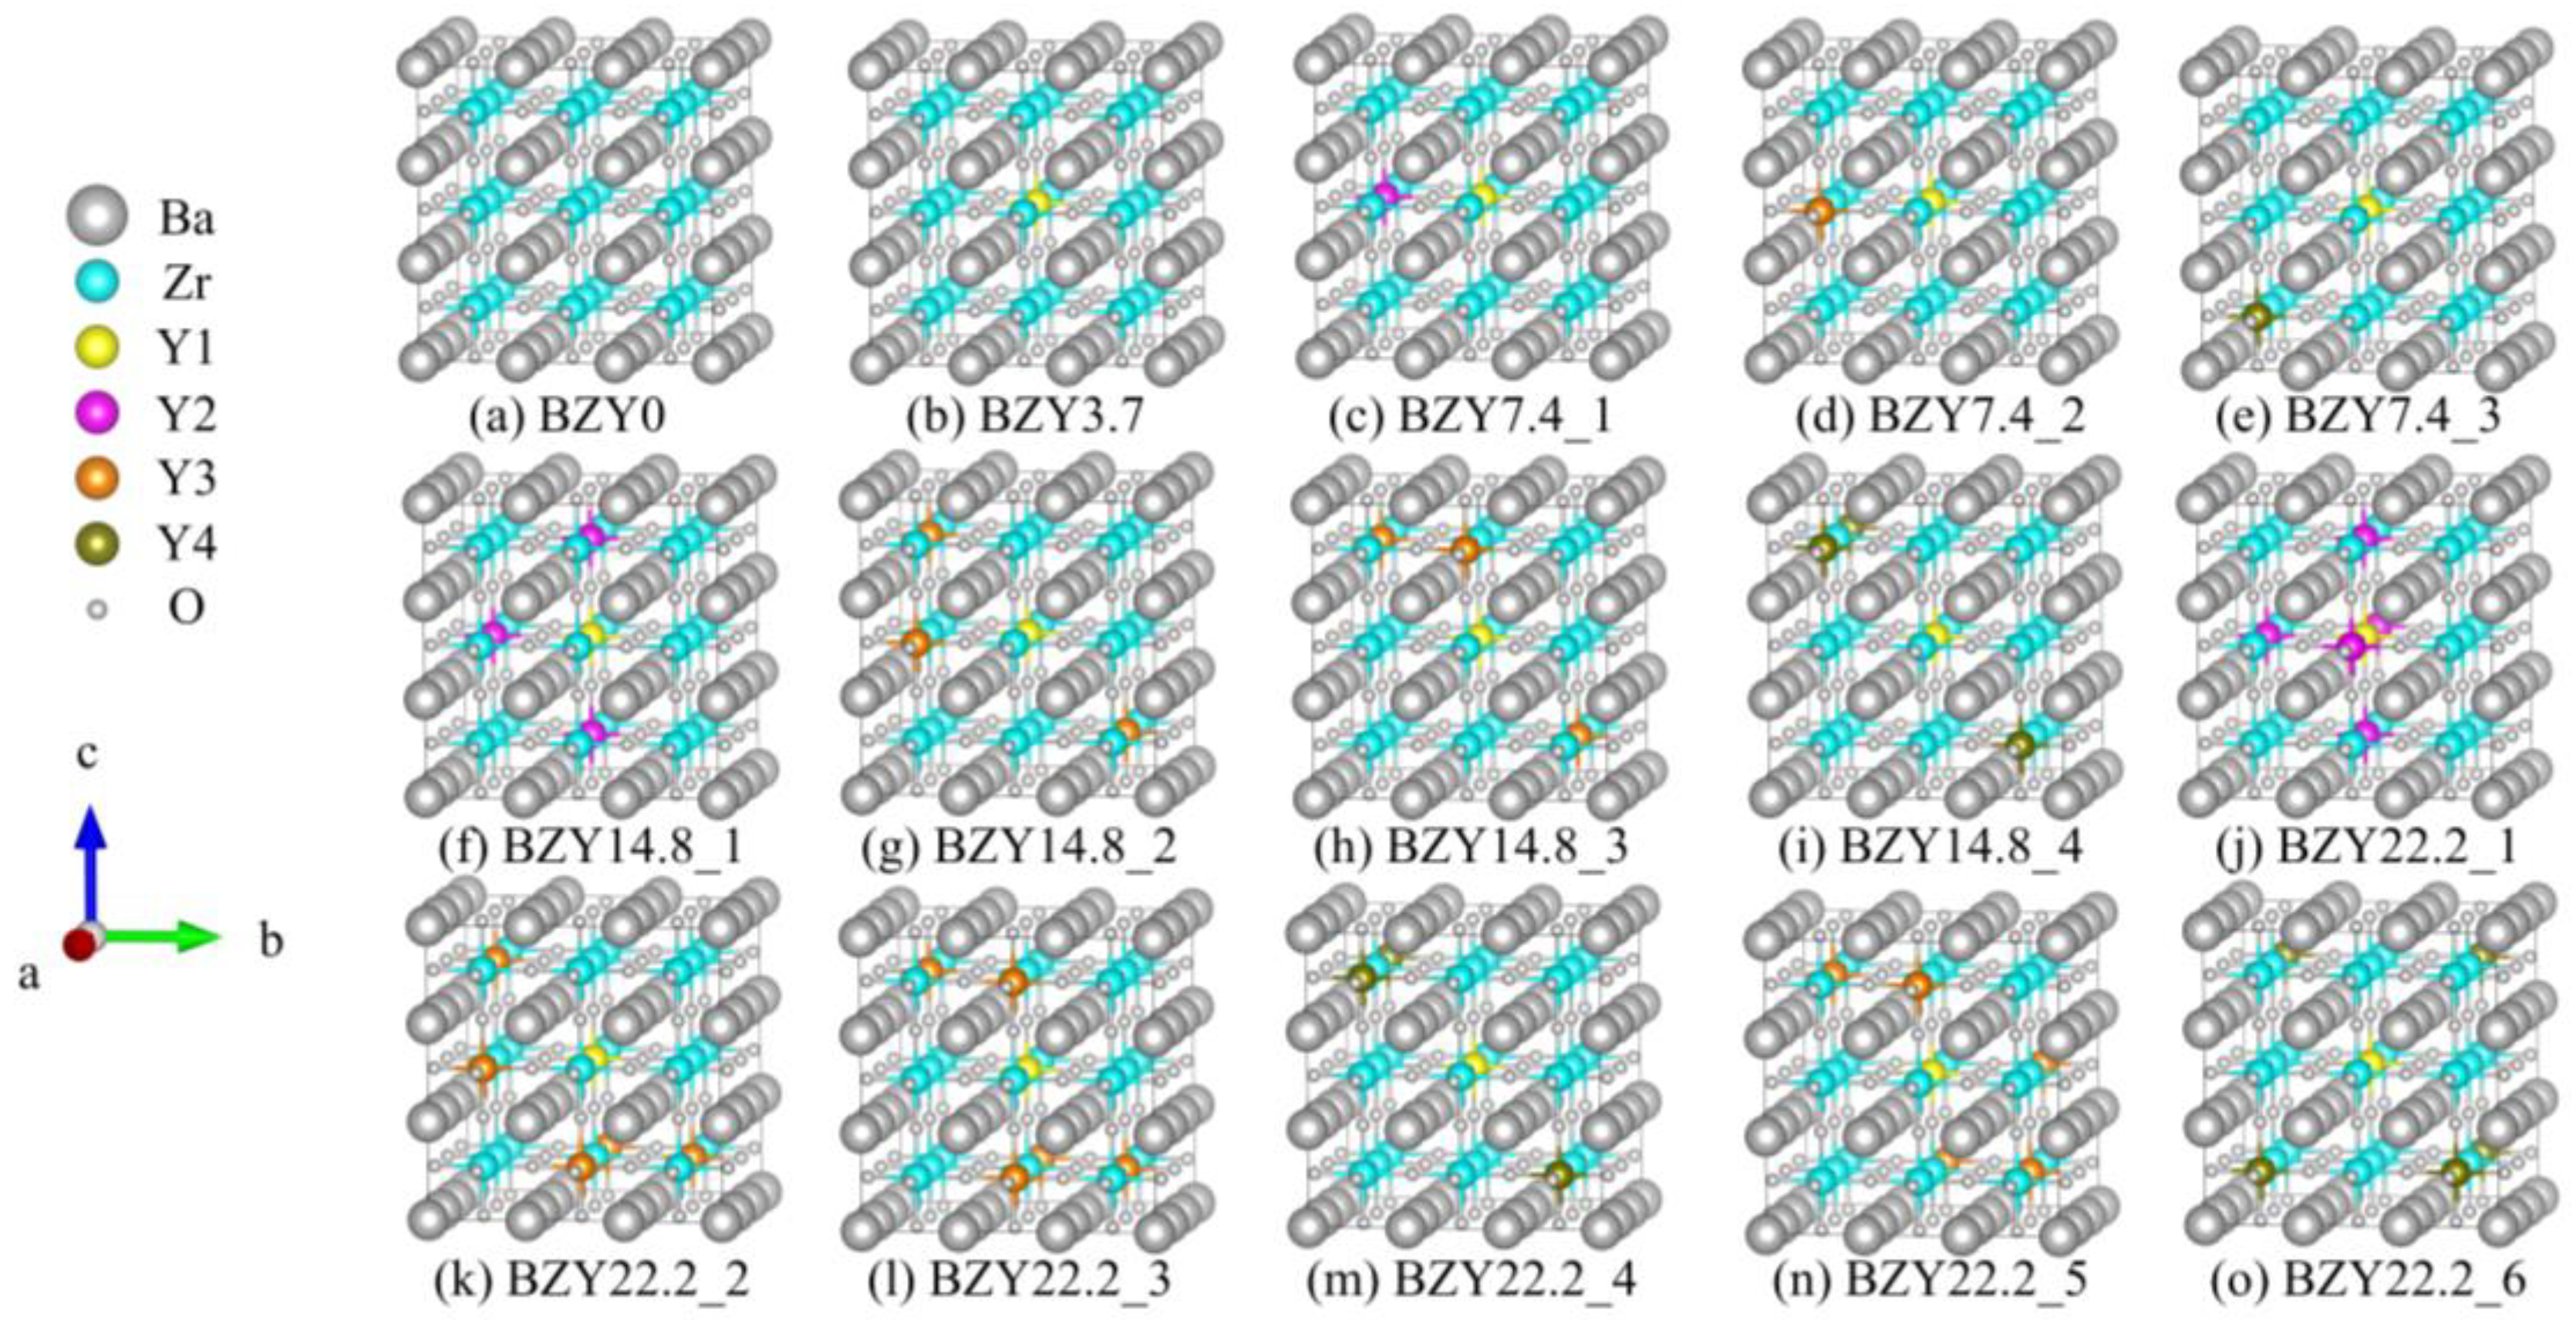
As shown in Figure 3a, the 3 × 3 × 3 supercell of BaZrO3 (BZO) consisted of 27 Ba atoms, 27 Zr atoms, and 81 oxygen atoms. The 27 Zr atoms constructed a 3 × 3 × 3 array, which was used for the next Y atom’s replacement. Obviously, different yttrium doping contents have various crystal configurations. In this work, four models were employed with one, two, four, and six Y atoms to replace Zr atoms, corresponding to yttrium doping of 3.7%, 7.4%, 14.8%, and 22.2% in mole ratios. We refer to each of these systems as BZY3.7, BZY7.4, BZY14.8, and BZY22.2. In order to exhaust the most possible configurations of the above supercell, two situations were taken into account in the calculation models: Firstly, the types of B-site atoms were classified according to the distance between the atoms, as shown in Figure 3b. Y1 (yellow B-site atom) is fixed in the center of the supercell as the original point. Moreover, the distance between Y1 and Y2 (purple B-site atom) is a, the distance from Y3 (orange B-site atom) is a, and the distance from Y4 (brown B-site atom) is a, as shown in the amplified picture on the top left of Figure 3b. Secondly, according to the practical situations, a dispersed distribution of Y atoms in the Bravais lattice is most possible. When the number of doping atoms is more than 3, it can be ensured that B-site atoms are replaced in each (100) face. Typical configurations of BaZr(1-x)YxO3-δ (BZY, x = 0, 0.037, 0.074, 0.148, and 0.22) are shown in Figure 4. BZY0 (BaZrO3) represents the BZY without Y atom replacement. BZY3.7 represents the BZY with one Y atom replacement, where the atom is set in the center of the supercell. In Figure 4c–e, the supercell with two Y atoms is illustrated. It can be seen that the distance between the two of them is a, a, and a. The next step is four Zr atoms, which are replaced by four Y atoms, as can be seen in Figure 4f–i. The total distances between the three surrounding Y atoms to the centered Y atom are 3 × a, 3 × a, and 3 × a, which cover all conditions of the four Y atoms’ replacement. Furthermore, the six Y atoms’ replacements are shown in Figure 4j–o. As well as the situations in the four Y atoms’ replacement, we covered all arrangements by controlling the total atoms distance from 5 × a to 5 × a.
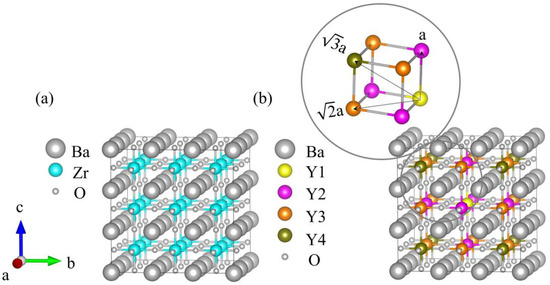
Figure 3.
(a) Schematic 3 × 3 × 3 supercell structure of BZO. (b) Color diagram of B-site atoms according to the doping site distance distribution. The Y1 (yellow B-site atom) is the center, with Y2 (purple B-site atoms) as the nearest neighbor, Y3 (orange B-site atoms) as the next closest neighbor, and Y4 (brown B-site atoms) as the farthest.
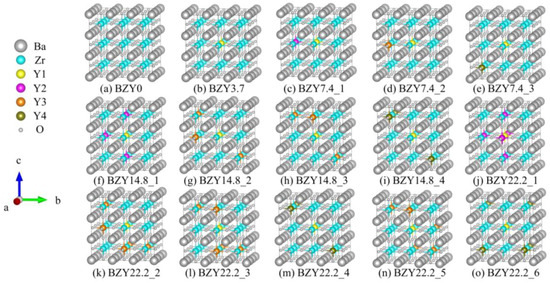
Figure 4.
Typical configurations of BaZr(1-x)YxO3-δ (BZY, x = 0, 0.037, 0.074, 0.148, and 0.22).
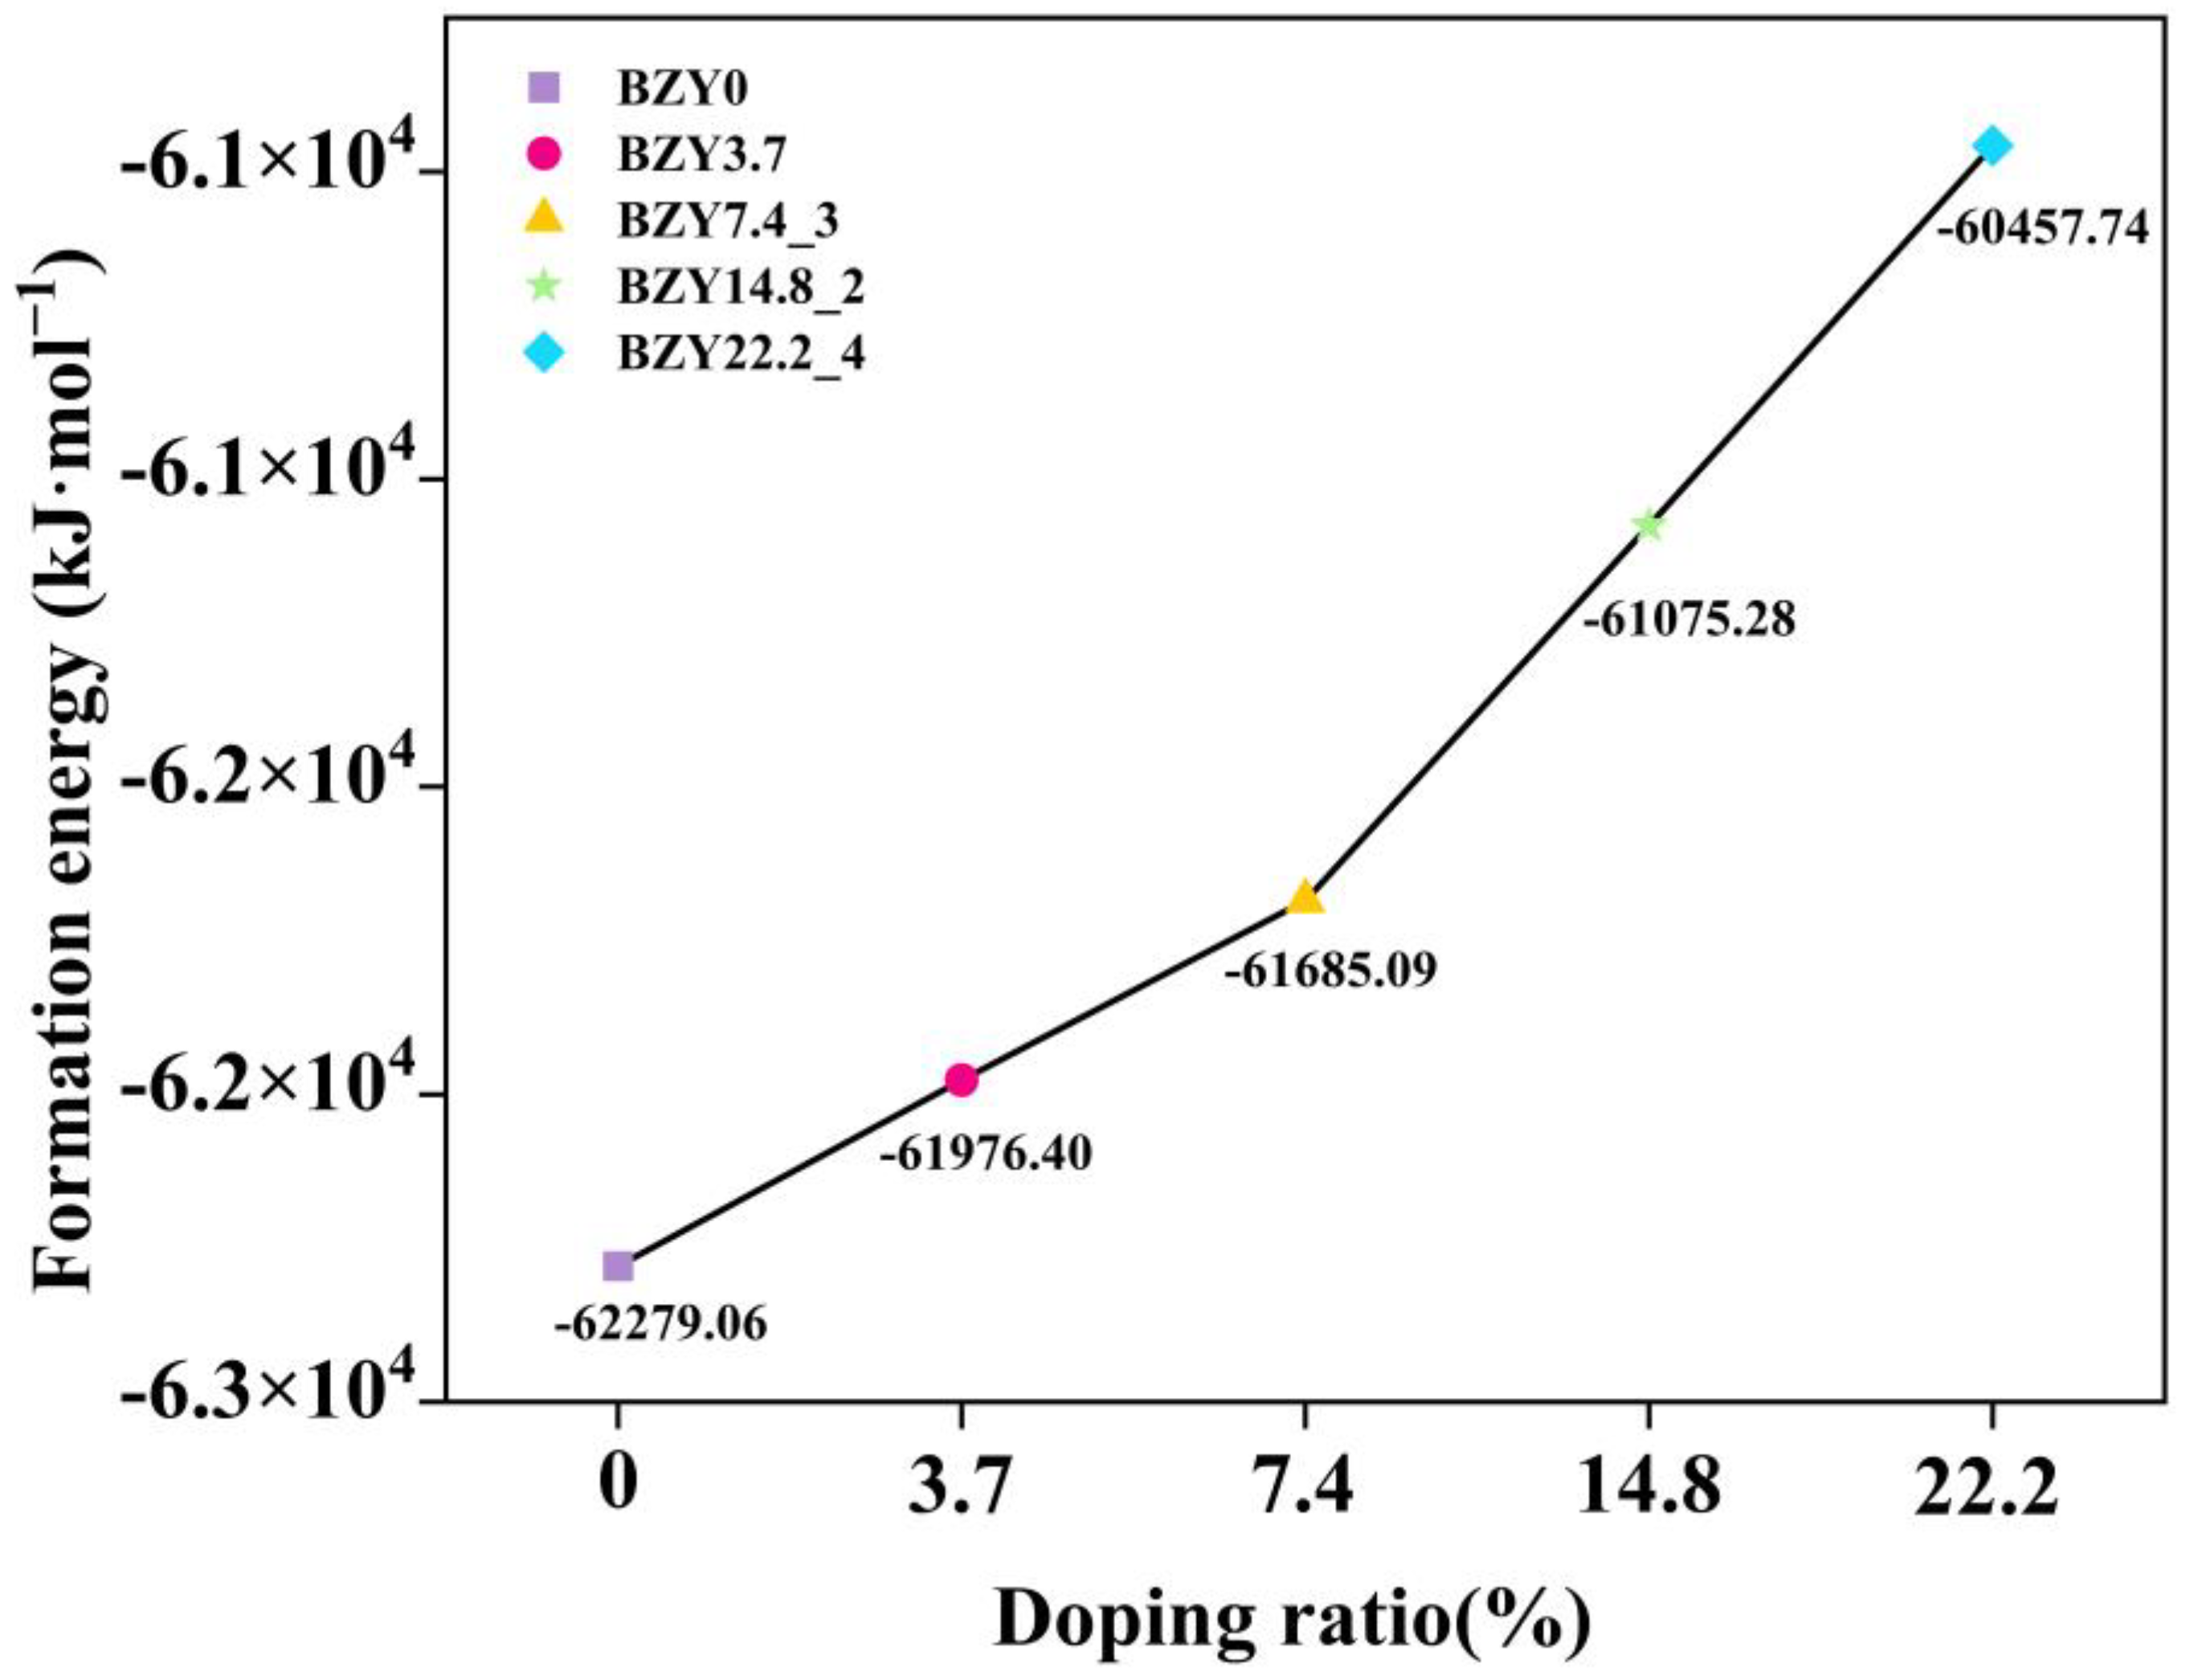
On the basis of these considerations, the formation energy of each BZY structure was computed according to Equation (1). The calculated formation energies of those structures are tabulated in Table 1. Obviously, the BZY7.4_3, BZY14.8_2, BZY14.8_3, and BZY22.2_4 configurations have the lowest formation energy in each replacement, which are −61685.09, −61075.28, −61075.28, and −60457.74 kJ·mol−1, respectively. It is indicated that these doped configurations are the most possible among our considered ones. Among them, BZY14.8_2 and BZY14.8_3 have the same formation energy, which is caused by the periodicity and symmetry of the structure, indicating that these two doped structures can be regarded as one situation. In the following work, we used the BZY14.8_2 structure for analysis. The relationship between the doping ratio and formation energies is shown in Figure 5.

Table 1.
Formation energy of BZY structures with different doping contents; the structures screened out by the behaviors marked in gray are used for calculation.
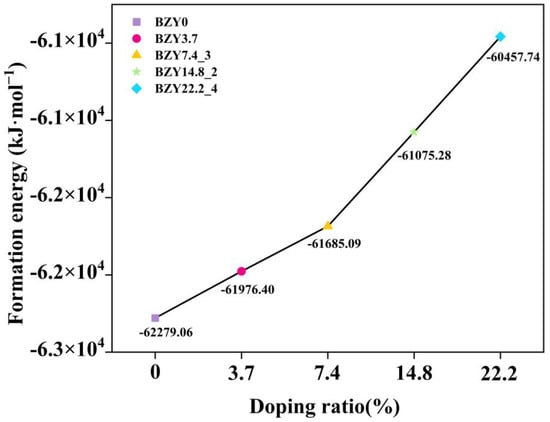
Figure 5.
Relationship between doping ratio and formation energies in BaZr(1-x)YxO3-δ (BZY, x = 0, 0.037, 0.074, 0.148, and 0.22).
3.1.2. Proton Migration in BZYs
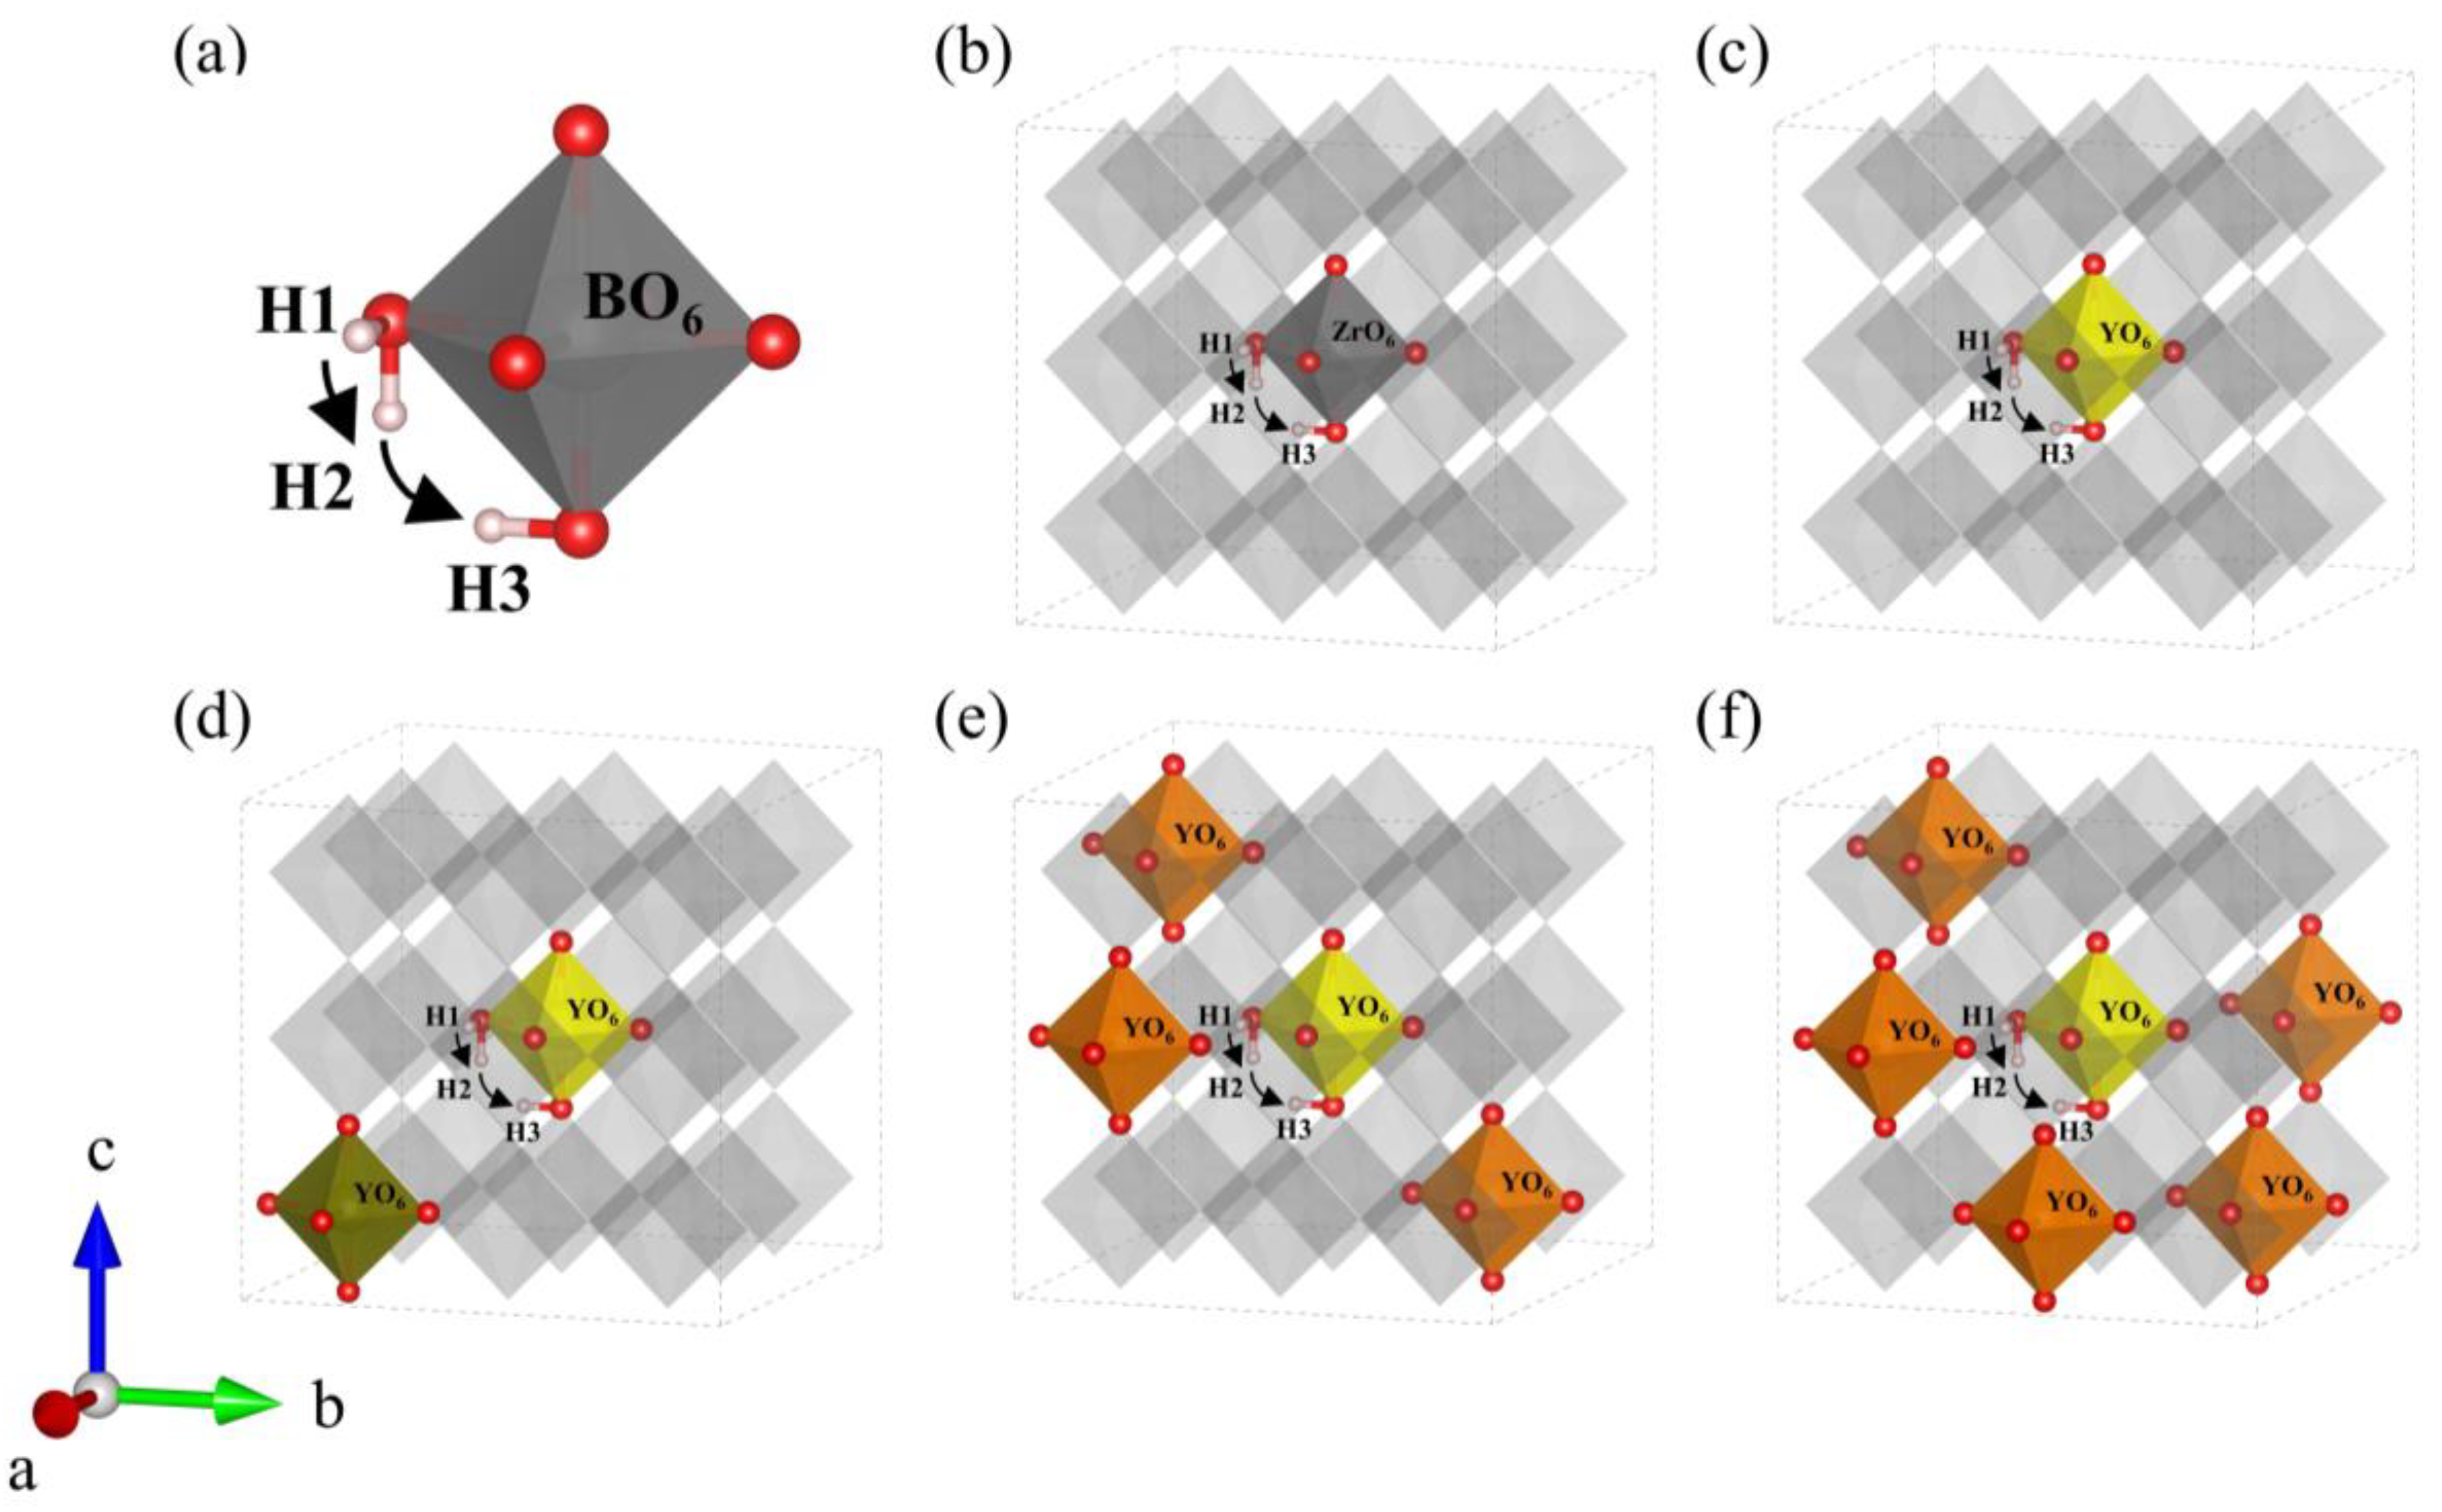
Using the ideal structures obtained above, we explore the effect of yttrium content on energy barriers of proton migration and Bader charge. Because of the lack of oxygen vacancy, proton transfer can only proceed in H-form, the proton hopping between adjacent oxygen atoms at normal lattice positions is attributed to the Grotius mechanism [37,38]. On the basis of the analysis in Section 3.1.1, the same migration path around the central orthorhombic cell was selected to compare the proton migration energy barriers in every configuration, and the migration path (H1-H2-H3) was selected at the central octahedron of the BZY supercells, as shown in Figure 6b–f. In detail, as shown in Figure 6a, the energy barriers of reorientation (H1-H2) and intra-octahedral hopping (H2-H3) were calculated step by step. Note that it has been reported in previous works that Ba perovskites are unfavorable for proton inter-octahedral hopping, which will not be the focus in our work [39,40,41].
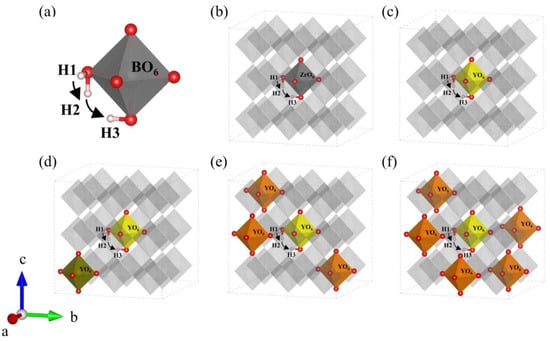
Figure 6.
(a) Schematic diagram of the proton migration pathway in BO6 (B = Zr, Y). Migration pathway of protons in (b) BZY0, (c) BZY3.7, (d) BZY7.4_3, (e) BZY14.8_2, and (f) BZY22.2_4.
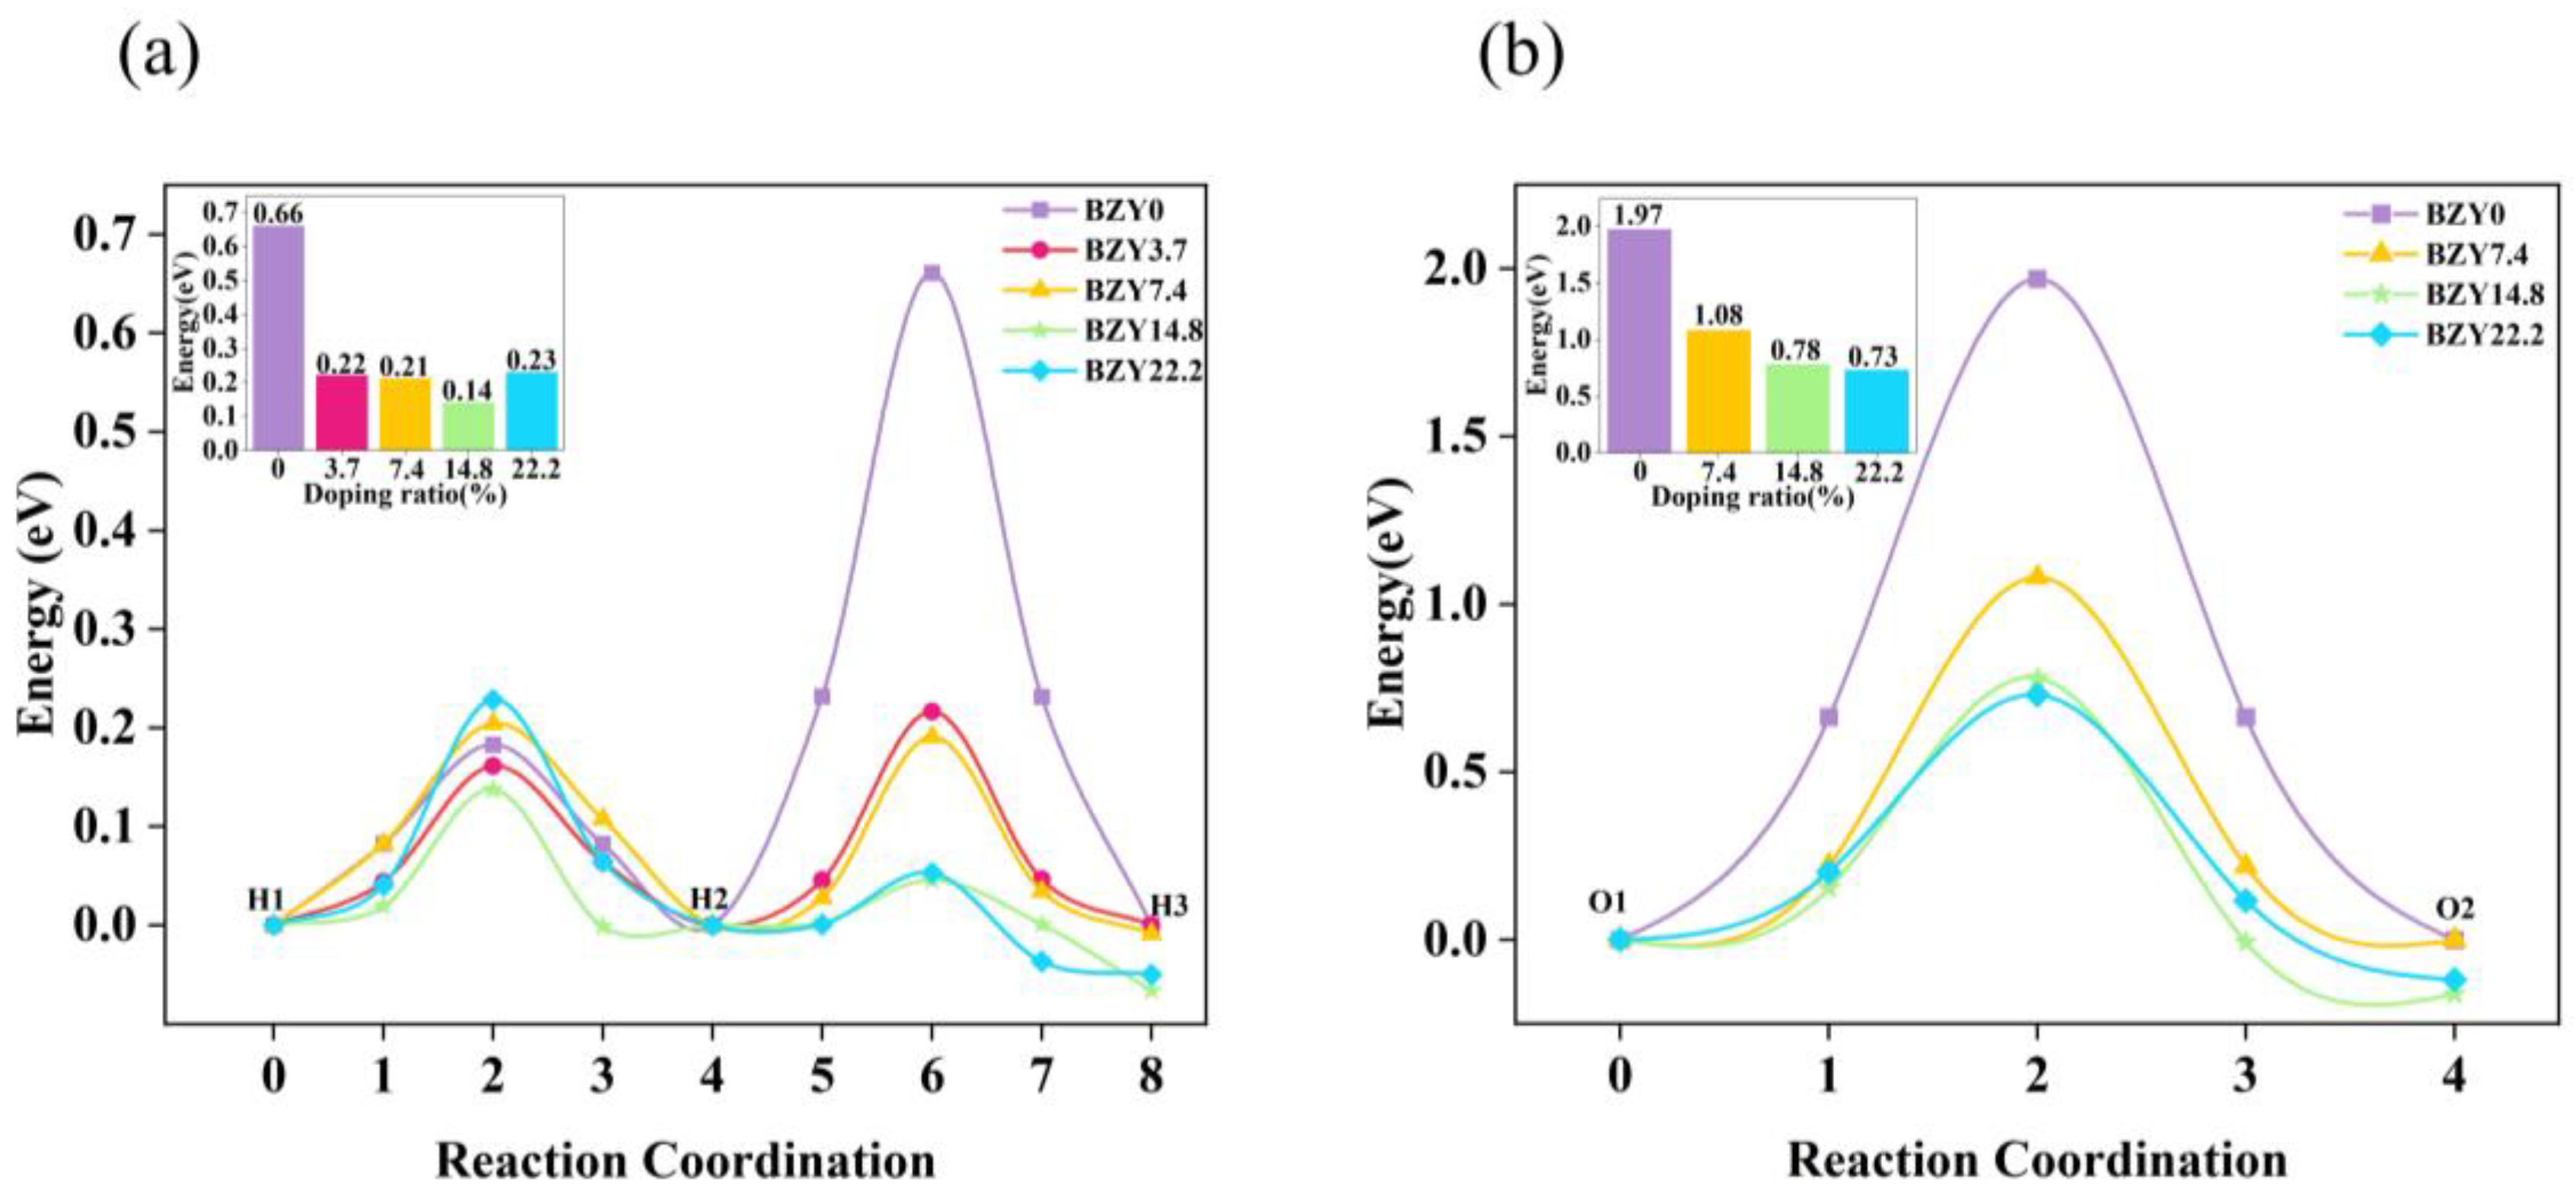
The energy curves of BZYs are shown in Figure 7a, which were calculated by the CI-NEB method along the above paths in Figure 6b–f. The calculated results show that the energy barriers of proton rotation and migration in BZY0 are 0.18 and 0.66 eV, respectively, which are consistent with other literature [42,43]. The energy barriers of proton rotation and migration in BZY3.7, BZY7.4, BZY14.8, and BZY22.2 are 0.16 and 0.22 eV, 0.21 and 0.19 eV, 0.14 and 0.05 eV, and 0.23 and 0.05 eV, respectively. Similar work by F.M. Draber et al. [21] considered all eight and all three possible permutations of the occupation of the zirconium sites in the first nearest neighborhood of the initial and final positions of the translation jumps and the reorientation jumps, respectively. When all three sites are occupied by Zr, the proton migration barrier is 0.41 eV, which is slightly lower than our calculated value of 0.66 eV. When one site and two sites are occupied by Y atoms, the value of our energy barrier is roughly consistent with that reported in the reference. From the point of thermodynamics, the higher the energy barrier, the more difficult the proton migration. Therefore, when the proton migrates from the initial state H1 to the final state H3 in BZYs, the energy barrier is actually attributed to the higher local barrier in the reorientation (H1-H2) step and the intra-octahedral hopping (H2-H3) step. Similarly, the energy barriers of proton migration in BZY3.7, BZY7.4, BZY14.8, and BZY22.2 are 0.22, 0.21, 0.14, and 0.23 eV, respectively, as shown in the inset of Figure 7a. In terms of these energy barrier values, they are much smaller than those in the case of BZY0. This difference strongly suggests that proton migration is much easier for BZY3.7 ~ BZY22.2 than for BZY0. In other words, doping can significantly improve the migration of protons. More descriptions of several, such as defects proton–proton repulsion and vacancy–vacancy repulsion, can be referred to in the research of F.M. Draber et al. [20,21]. Furthermore, we calculated the effective Bader charge of the atoms in BZYs. The Bader charge value of Zr in BZY0 is predicted to be +2.25e, and Y in BZY3.7, BZY7.4, BZY14.8, and BZY22.2 is predicted to be +2.10e, +2.11e, +2.13e, and +2.15e, respectively. These indicate that a smaller Coulomb exclusion barrier and a weaker electrostatic potential field for proton migration may exist, as the yttrium-doped Bader charge value was lower than Zr when Y atoms lost less electronic charge than the Zr atoms at the replacement site.
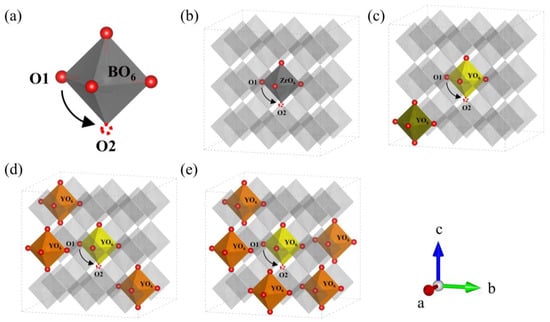
Figure 7.
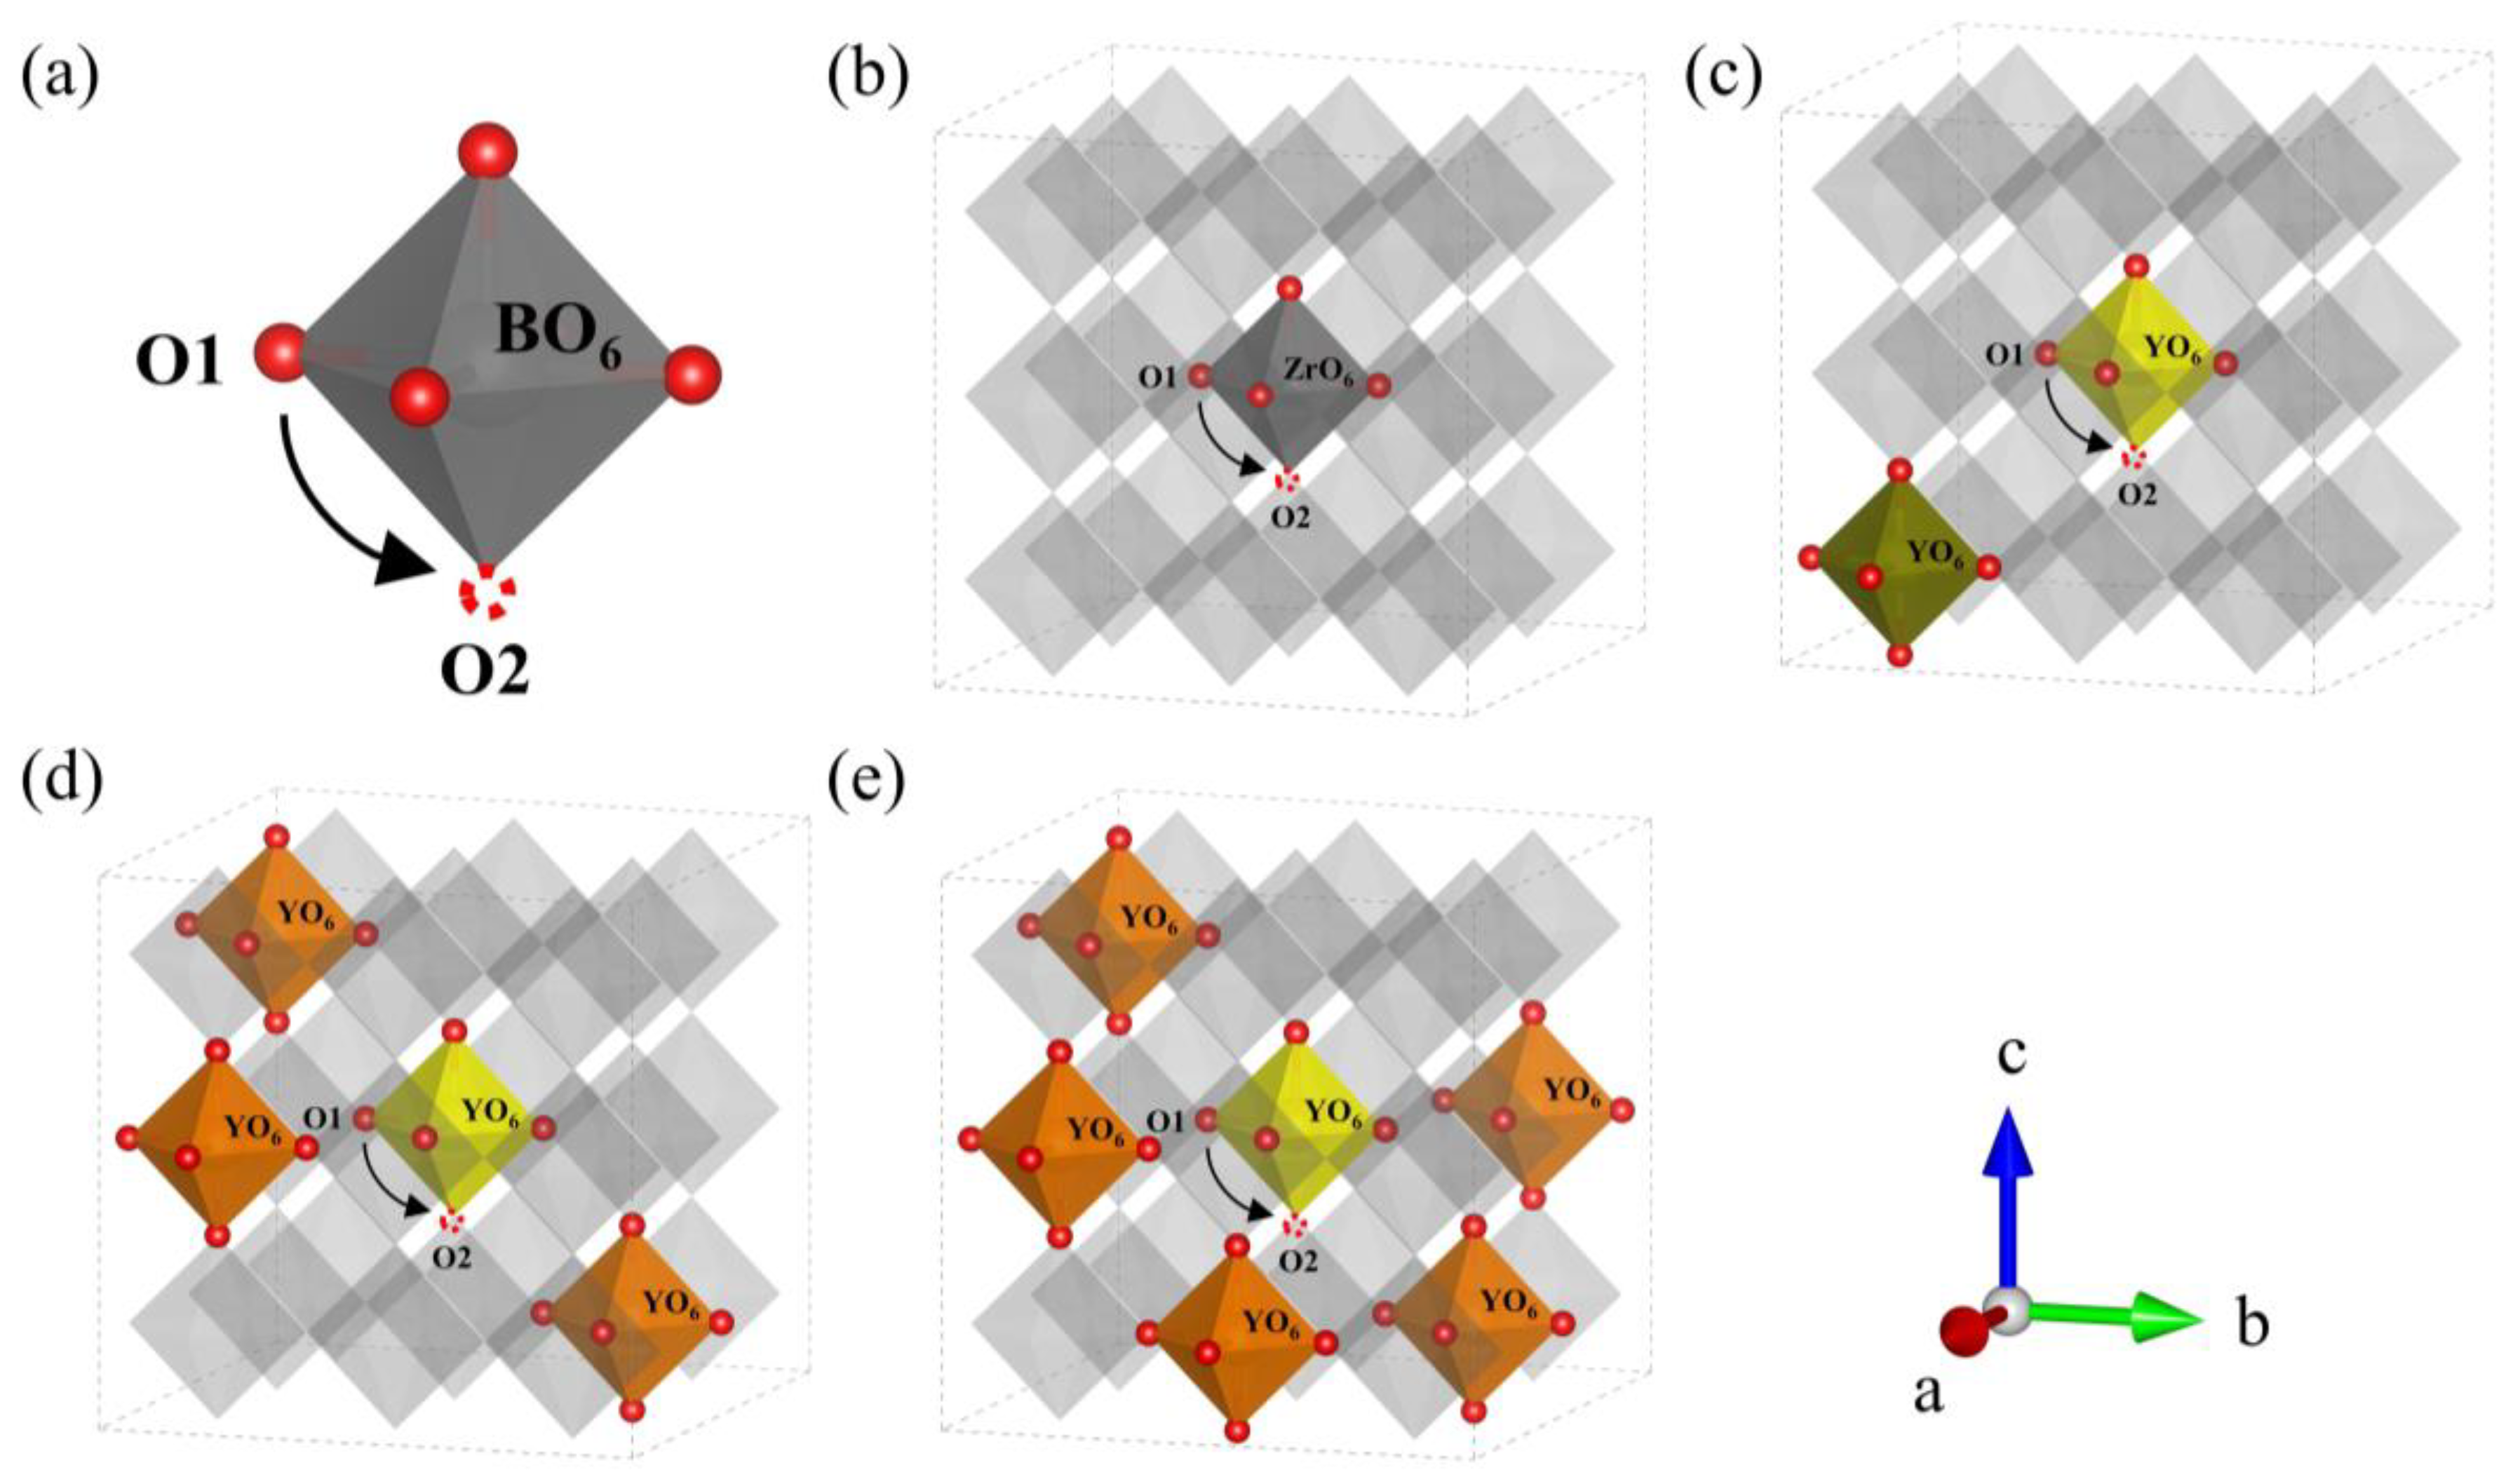
(a) Schematic diagram of the oxygen ion migration pathway in BO6 (B = Zr, Y). Migration pathway of oxygen ion in (b) BZY0, (c) BZY7.4_3, (d) BZY14.8_2, and (e) BZY22.2_4.
From the results of the proton energy barrier, it can be seen that the energy barrier of the H2 to H3 step varies with the Y content, while the energy barrier of the H1 to H2 step changes slightly. Therefore, we analyzed the saddle point in transition states in the H2 to H3 step. The distance between the proton and the nearest oxygen atom (dOH) is given in Table 2. With the transition state changes, the dOH length also changes, and the longest dOH corresponds to the saddle point. The dOH length at the saddle point of BZY0 is 1.94 Å, and the dOH at the saddle points of each content is significantly reduced with the increase in Y content. Meanwhile, the lowest length of 1.19 Å is obtained at BZY14.8. As can be seen, the dOH length at the saddle point also exhibits the same trend as the energy barrier. One of the possible reasons is that yttrium doping leads to the change in dOH, which leads to the change in structural energy, thus, affecting the migration energy barrier.

Table 2.
Distance between Hydrogen and the Nearest Oxygen Atom (dOH) at Transition States of Proton Transfer Step H2-H3 in BZY.
3.1.3. Oxygen Ion Migration in BZYs
Similar to the strategy of studying proton migration, the ideal doping structures with the lowest formation energy were used to explore the energy barrier of oxygen ion migration in BZYs. Similarly, the number of oxygen vacancies created by doping is not considered. In order to form a system with the study of proton migration, the oxygen ion migration path in each doping content is still selected at the central octahedron of the BZY supercell. A schematic diagram of the oxygen ions migration path in BO6 (B = Zr, Y) is shown in Figure 6a. The diffusion paths and the energy curves of oxygen ion migration from the initial state O1 to oxygen vacancy O2 are shown in Figure 7b–e and Figure 8b, respectively, which were obtained using CI-NEB. The energy barriers for oxygen ion migration in BZY0, BZY7.4, BZY14.8, and BZY22.2 are 1.97, 1.08, 0.78, and 0.73 eV, respectively. This shows that Y doping can also reduce the energy barrier of oxygen ion migration. Initially, the energy barrier decreases rapidly with the increase in Y content. Specifically, from BZY0 to BZY7.4, the change in the energy barrier is 0.89 eV when the Y content reached 7.4 mol%. Then, the change in energy barrier decreases to 0.3 eV from BZY7.4 to BZY14.8. However, the change in the energy barrier between BZY14.8 and BZY22.2 is only 0.05 eV, which is without a significant difference. Therefore, the energy barrier of oxygen ion migration between BZY14.8 and BZY22.2 reached the lowest value, which is consistent with other literature [19]. Moreover, the doping of Y will create lots of oxygen vacancies, which increase the concentration of charge carriers, and the increase can also improve ionic conductivity. Similar work by F.M. Draber et al. [20] considered the possible occupations of the initial and final B-site positions during a vacancy jump, and eight configurations were obtained, and the migration energies of oxygen vacancies in these eight cases were calculated; among them, the energy barrier of oxygen ion migration in BZY7.4 is about the same as that reported in the reference.
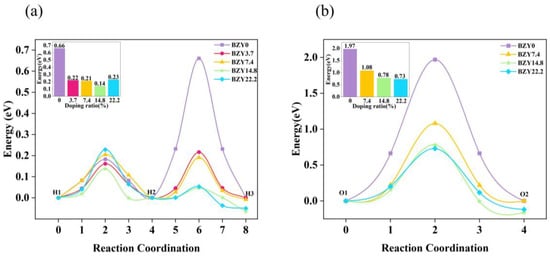
Figure 8.
Energy curves of (a) proton and (b) oxygen ion migration in BZYs.
3.1.4. Electronic Structure Analysis
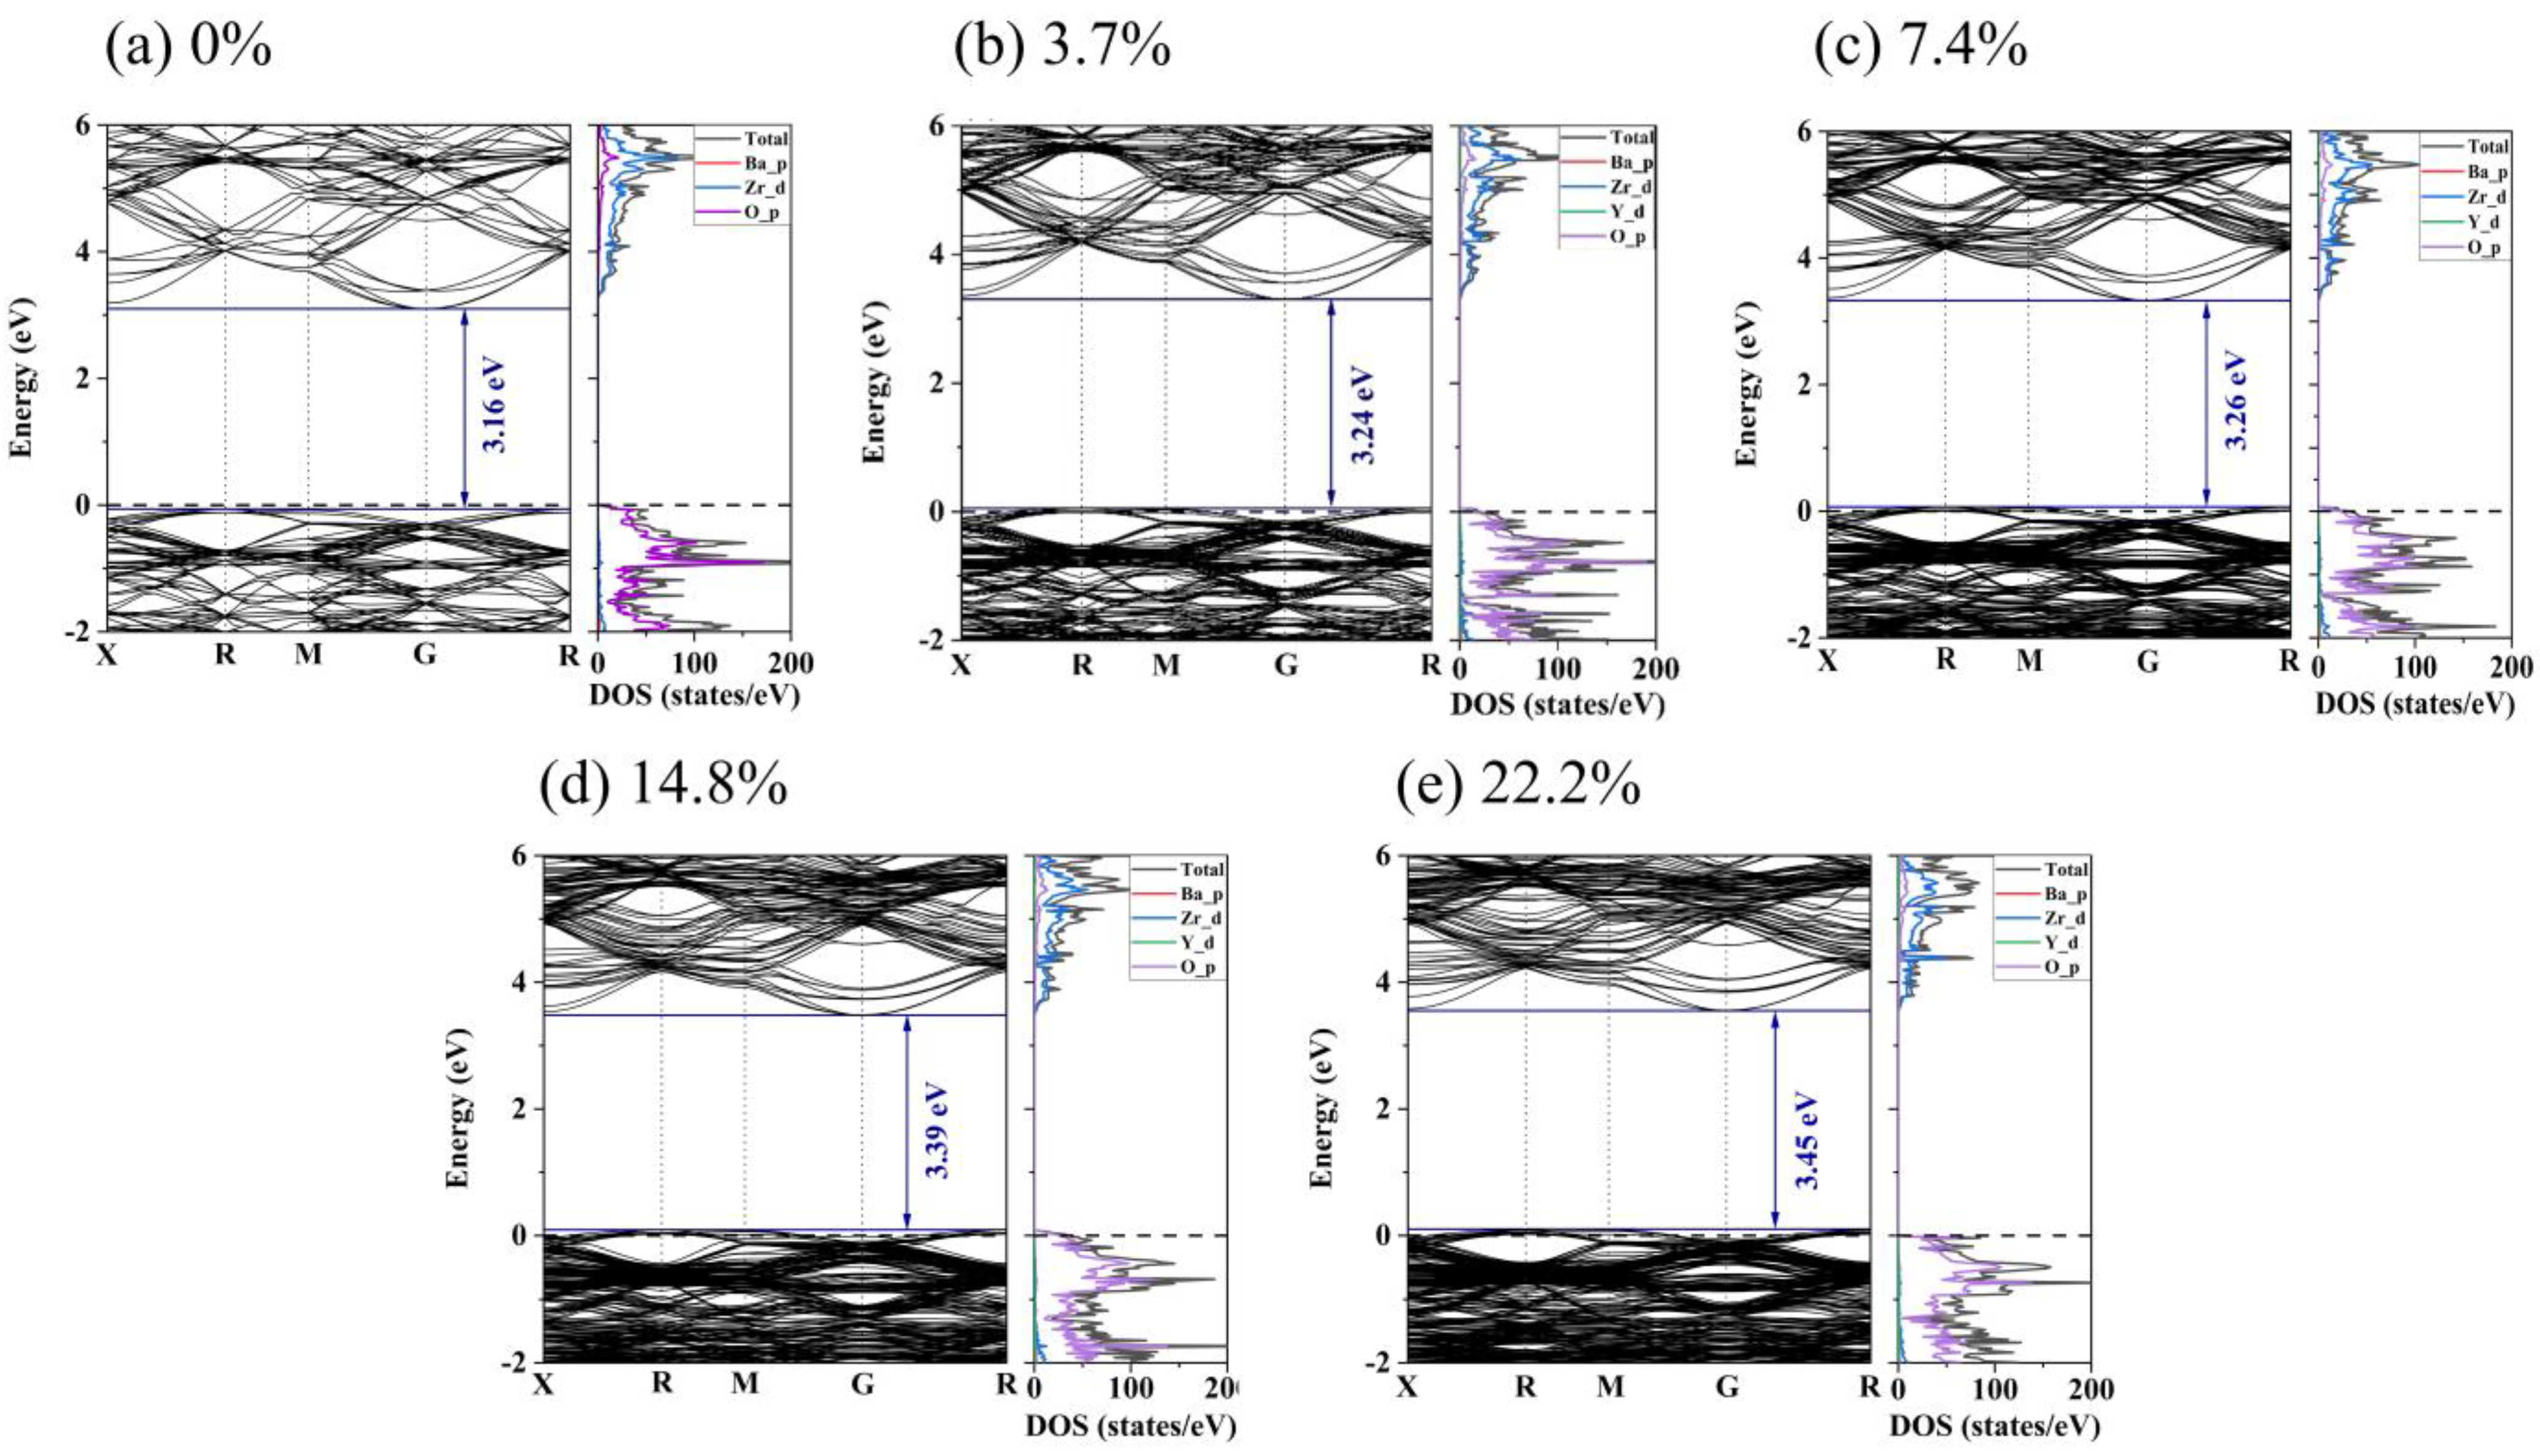
For deep insight into the effect of yttrium content on the electronic conductivity of BZY, the density of states (DOS) and electronic band structure for BZY were explored, as shown in Figure 9. It is evident that pure BZO exhibited an indirect band gap at R-G. The band gap is 3.16 eV, which shows consistency with previously reported results [44,45]. In Figure 9a, the TDOS of BZO is mainly contributed to by Zr_d and O_p electrons, as shown in the energy range from −2 eV to 6 eV. In the valence band, the DOS of Zr_d electrons is lower than that of O_p electrons. While in the conduction band, the DOS of Zr_d electrons is higher than that of O_p electrons, which indicates that some O_p electrons transfer to the conduction band and hybridize with the Zr_d electron orbitals. The DOS of Zr_d and O_p electrons indicates that Zr interacts covalently with O atoms. In contrast, the difference between the DOS peaks of the Ba and O atoms is relatively large, which indicates a weak bonding interaction between the two atoms, forming an ionic bond. Comparing Figure 9a with Figure 9b–e, the top of the valence band of BZO is below the Fermi energy level, and the DOS of BZO is changed by yttrium doping. Due to the yttrium-doped BZO, a donor level was formed, resulting in the Fermi level moving closer to the valence band in the BZY3.7 ~ BZY22.2. This facilitates electron conduction and, in turn, decreases the activation energy of electron conduction. The DOS of d electrons for the B-site ions increased around the Fermi level and overlapped with the oxygen p electrons under the situation of yttrium doping, which may imply an increase in charge carrier concentration. Both of these conditions can enhance electron conduction.
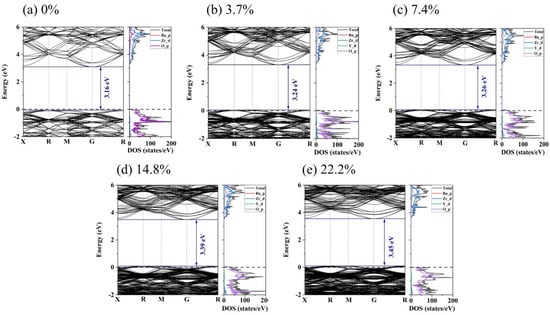
Figure 9.
Electronic band structure and density of states for BZYs.
3.2. Experimental Analysis
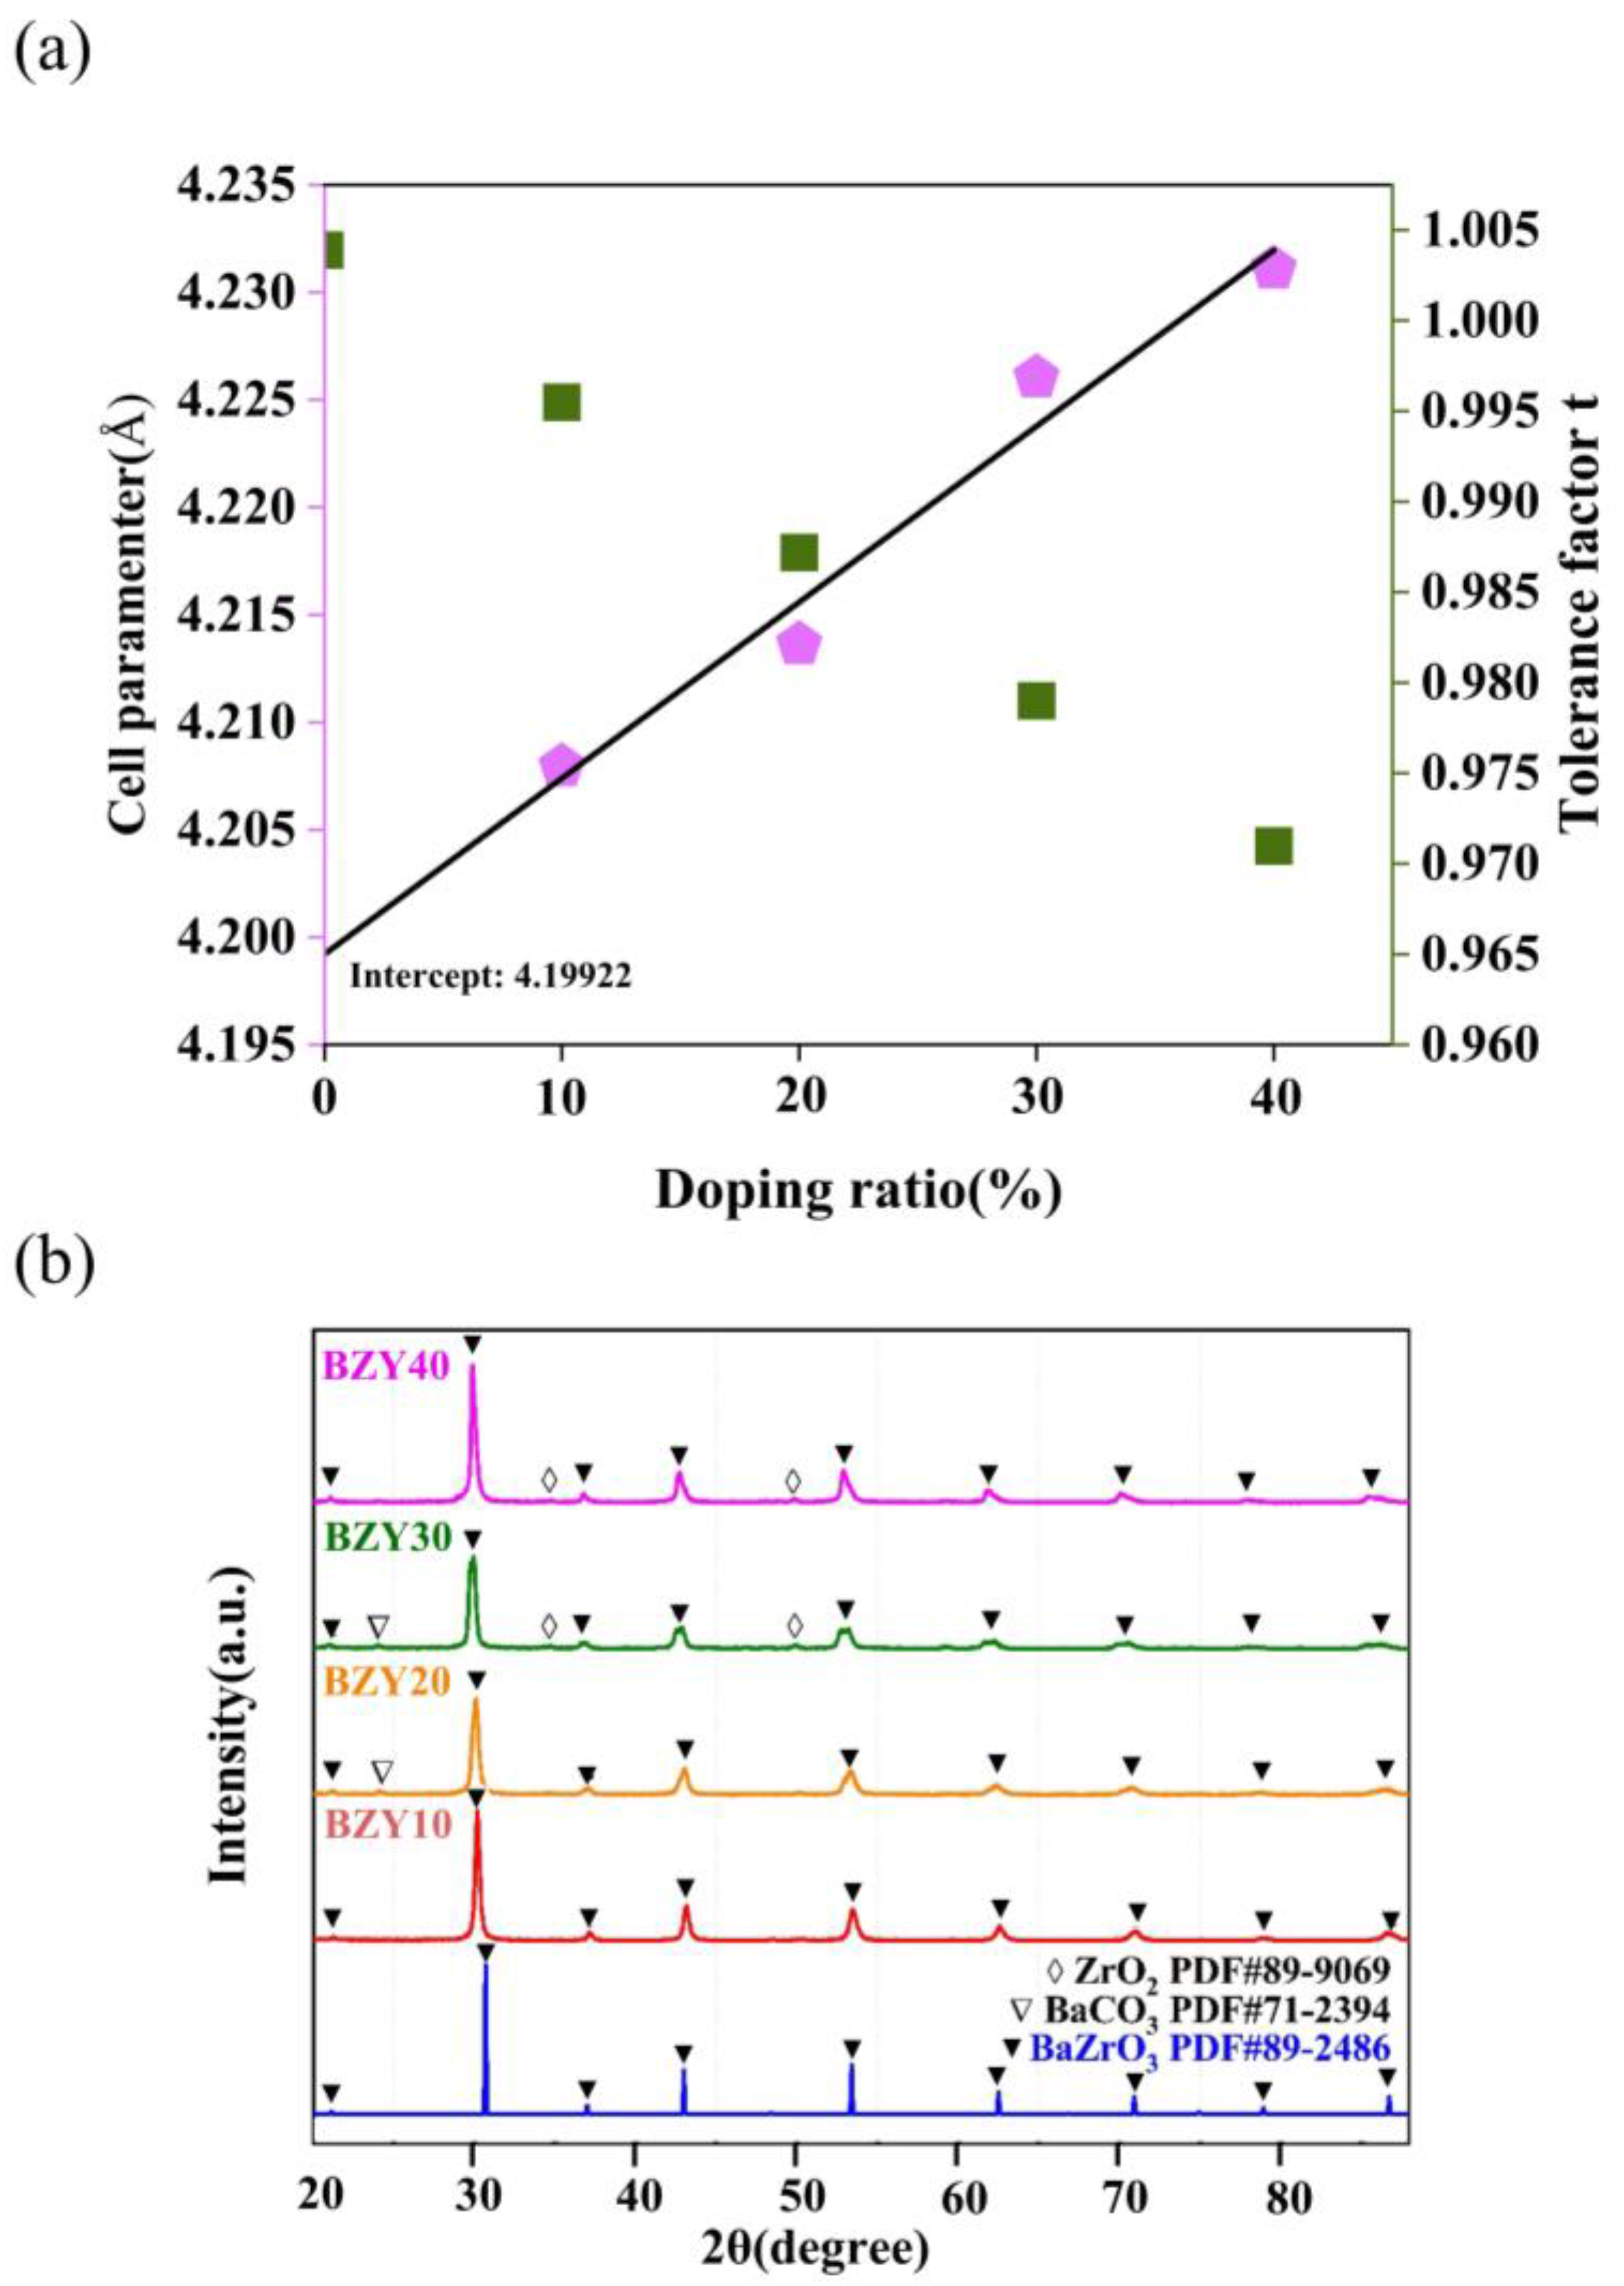
We also evaluated the total conductivities of BaZr(1-x)YxO3-δ (BZY, x = 0.1, 0.2, 0.3, and 0.4) using experiments. The influence of the yttrium doping content on the performance of BZY electrolytes was analyzed. The crystalline structure of the samples and XRD patterns of BZY powders with different yttrium contents are shown in Figure 10b. Using the standard PDF card, the peaks, which are marked with solid triangles, correspond to BaZrO3, and some impurity peaks, including ZrO2 and BaCO3, were also identified and marked with open diamonds and open triangles, respectively. In addition, there was a slight shift in the main peak positions to lower angles with the increase in yttrium contents. The relationship between Goldschmidt tolerance factor (t) and ionic radius can explain this phenomenon, which can be defined by the following Equation (2):
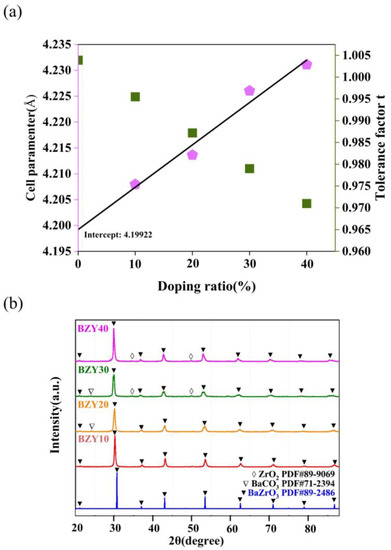
Figure 10.
(a) Relationship between the calculated lattice parameter and the yttrium content for BZYs. (b) XRD patterns of calcined BZYs powders.
In the perovskite structure (ABO3), RA, RB, and RO are the radii of cation A, cation B, and oxygen, respectively. As shown in Figure 10a, the lattice parameter increases linearly with an increase in yttrium content due to the replacement of the Zr4+- sites by the bigger Y3+ ions, which is consistent with other literature [46,47]. The intercept in the y-axis is 4.19922 Å, which is consistent with the lattice parameter of BaZrO3 (4.1987 Å). This suggests that yttrium was completely doped into the BaZrO3 lattice and forms a pure perovskite oxide in all conditions.
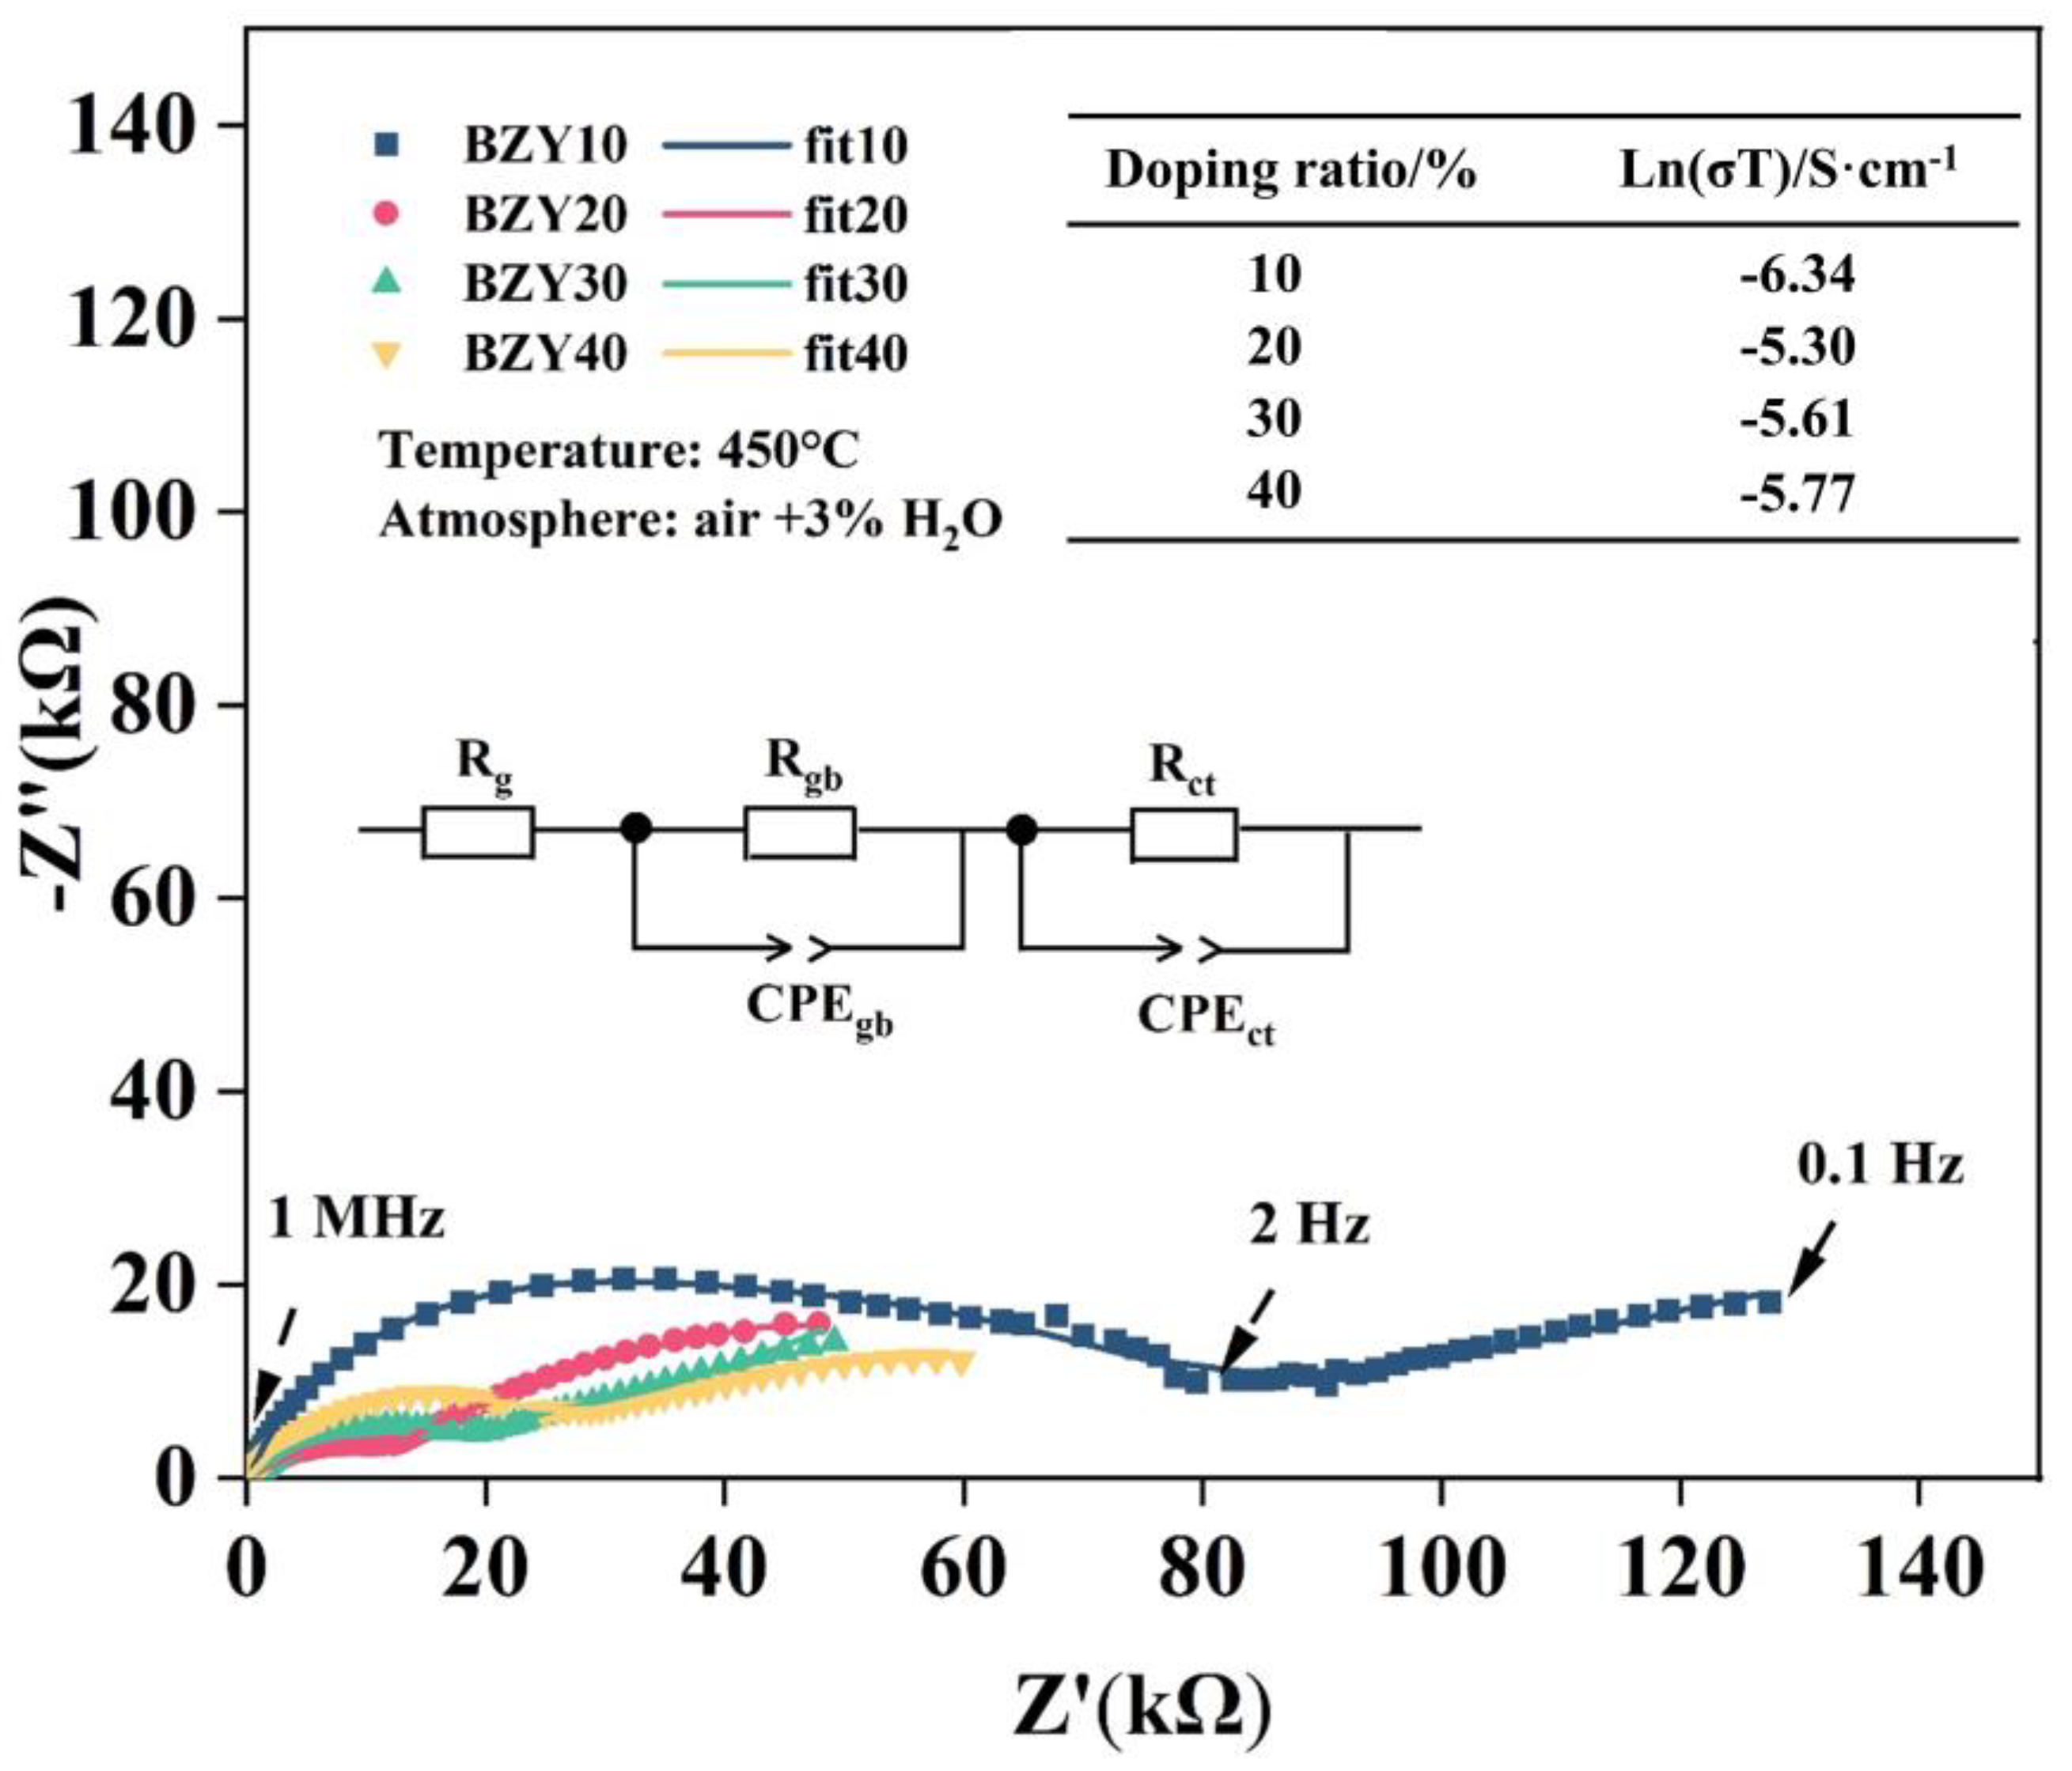
The conductivities of the above-synthesized BZY electrolytes were measured using the EIS method in moist air (3% H2O + air), and the testing temperature was 450 °C. All spectra include a recessed arc and a tail; these spectra were fitted using ZView2 software and analyzed with an equivalent circuit, which consisted of a resistor (R) and two pairs of parallel resistor (R)–constant phase elements (CPE) connected in a series, as shown in the inset of Figure 11. The intercept point at high frequency (1 MHz) represents the grain resistance (Rg) of the electrolyte, with the first semicircular arc extended to intersect the x-axis and the value of the horizontal coordinate being the sum of the grain (Rg) and grain boundary (Rgb) resistances. The gas phase diffusion occurring at the electrode and the electrochemical reactions occurring at the TPBs can be revealed by the low-frequency tails. They were also described by the charge transfer resistance (Rct) and the constant phase angle element (CPEct). As the yttrium contents increased from 10 to 40 mol%, the conductivity of BZYs increased first and then decreased, and the maximum value was obtained at BZY20, which can be seen in the inset table in Figure 11. These results showed the same regulation with the barrier energies in the calculation results and are consistent with other literature [47].
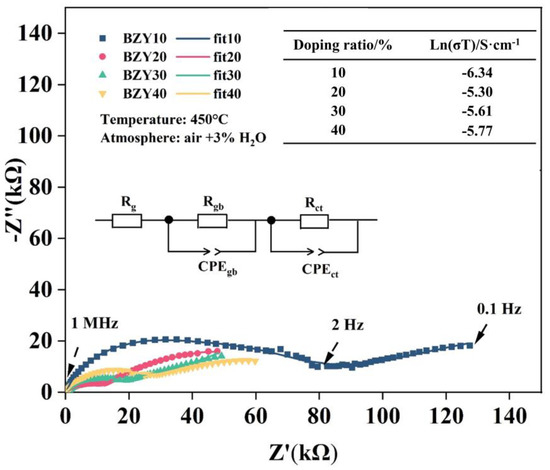
Figure 11.
Nyquist plot of BZYs in a humid air atmosphere and at 450℃. The conductivity of BZYs with different yttrium doping contents is shown in the top right table.
4. Conclusions
The evolution of protonic, oxygen ionic, and electronic conductivities in BZY electrolyte were measured using DFT calculations and experimental tests. Firstly, the energy barriers of proton and oxygen ion migration were effectively reduced by Yttrium doping, and the lowest values were 0.14 eV (Proton) for BZY14.8 and 0.73 eV (oxygen ion) for BZY22.2. The electronic band structure indicates that unfavorable electronic conductivity emerged with the Y doping. Secondly, as the yttrium content increased from 10 to 40 mol%, the total conductivity of BZYs increased first and then decreased, and the maximum value was obtained in BZY20. Finally, the tendency of the tested total conductivity is consistent with the result from the DFT calculation. This work provides support to promote the wide application of BZY in PCFC.
Author Contributions
Conceptualization, H.H., J.Z. and J.J.; methodology, H.H., J.Z. and S.W.; software, H.H. and Y.N.; investigation, H.H., W.Z., X.L., X.J., L.S., W.C. and X.Q.; writing, H.H.; review and revision of the thesis, J.Z., W.Z. and Y.Z. All authors have read and agreed to the published version of the manuscript.
Funding
This work was supported by the National Natural Science Foundation of China (no. 61971251), the Zhejiang Provincial Basic Public Welfare Research Program Project (no. LGG22F010017), the Ningbo Key Research and Development Project of (2022Z093 and 2022Z092), and the China Postdoctoral Science Foundation (No. 2019M663474).
Data Availability Statement
The data that support the findings of this study are available from the corresponding author upon reasonable request.
Acknowledgments
The calculations were performed at the Supercomputer Center of Ningbo University.
Conflicts of Interest
The authors declare no competing financial interests.
References
- Ding, D.; Li, X.; Lai, S.Y.; Gerdes, K.; Liu, M. Enhancing SOFC cathode performance by surface modification through infiltration. Energy Environ. Sci. 2014, 7, 552–575. [Google Scholar] [CrossRef]
- Stambouli, A.B.; Traversa, E. Fuel cells, an alternative to standard sources of energy. Renew. Sust. Energ. Rev. 2002, 6, 295–304. [Google Scholar] [CrossRef]
- Stambouli, A.B.; Traversa, E. Solid oxide fuel cells (SOFCs): A review of an environmentally clean and efficient source of energy. Renew. Sust. Energ. Rev. 2002, 6, 433–455. [Google Scholar] [CrossRef]
- Haile, S.M. Fuel cell materials and components. Acta Mater. 2003, 51, 5981–6000. [Google Scholar] [CrossRef]
- Taylor, F.H.; Buckeridge, J.; Catlow, C.R.A. Defects and oxide ion migration in the solid oxide fuel cell cathode material LaFeO3. Chem. Mater. 2016, 28, 8210–8220. [Google Scholar] [CrossRef]
- Han, D.; Uda, T. The best composition of an Y-doped BaZrO3 electrolyte: Selection criteria from transport properties, microstructure, and phase behavior. J. Mater. Chem. A 2018, 6, 18571–18582. [Google Scholar] [CrossRef]
- Jacobson, A.J. Materials for Solid Oxide Fuel Cells. Chem. Mater. 2009, 22, 660–674. [Google Scholar] [CrossRef]
- Shi, H.; Su, C.; Ran, R.; Cao, J.; Shao, Z. Electrolyte materials for intermediate-temperature solid oxide fuel cells. Prog. Nat. Sci. 2020, 30, 764–774. [Google Scholar] [CrossRef]
- Yang, Y.; Zhang, Y.; Yan, M. A review on the preparation of thin-film YSZ electrolyte of SOFCs by magnetron sputtering technology. Sep. Purif. Technol. 2022, 298, 121627. [Google Scholar] [CrossRef]
- Chen, X.J.; Khor, K.A.; Chan, S.H.; Yu, L.G. Influence of microstructure on the ionic conductivity of yttria-stabilized zirconia electrolyte. Mater. Sci. Eng. A 2002, 335, 246–252. [Google Scholar] [CrossRef]
- Pavone, M.; Ritzmann, A.M.; Carter, E.A. Quantum-mechanics-based design principles for solid oxide fuel cell cathode materials. Energy Environ. Sci. 2011, 4, 4933. [Google Scholar] [CrossRef]
- Chen, G.; Luo, Y.; Sun, W.; Liu, H.; Ding, Y.; Li, Y.; Geng, S.; Yu, K.; Liu, G. Electrochemical performance of a new structured low temperature SOFC with BZY electrolyte. Int. J. Hydrog. Energy. 2018, 43, 12765–12772. [Google Scholar] [CrossRef]
- Fabbri, E.; Bi, L.; Pergolesi, D.; Traversa, E. Towards the next generation of solid oxide fuel cells operating below 600 °C with chemically stable proton-conducting electrolytes. Adv. Mater. 2012, 24, 195–208. [Google Scholar] [CrossRef]
- Fabbri, E.; Pergolesi, D.; Traversa, E. Materials challenges toward proton-conducting oxide fuel cells: A critical review. Chem. Soc. Rev. 2010, 39, 4355–4369. [Google Scholar] [CrossRef]
- Poulidi, D.; Metcalfe, I.S. Electrochemical promotion of a metal catalyst supported on a mixed-ionic conductor. Solid State Ion. 2006, 177, 2211–2215. [Google Scholar] [CrossRef]
- Iwahara, H.; Yajima, T.; Hibino, T.; Ozaki, K.; Suzuki, H. Protonic conduction in calcium, strontium and barium zirconates. Solid State Ion. 1993, 61, 65–69. [Google Scholar] [CrossRef]
- Kreuer, K.D. Proton-conducting oxides. Annu. Rev. Mater. Sci. 2003, 33, 333–359. [Google Scholar] [CrossRef]
- Steele, B.C.H.; Heinzel, A. Materials for fuel-cell technologies. Nature 2001, 414, 345–352. [Google Scholar] [CrossRef] [PubMed]
- Li, X.; Zhang, L.; Tang, Z.; Liu, M. Fast oxygen transport in bottlelike channels for y-doped BaZrO3: A reactive molecular dynamics investigation. J. Phys. Chem. C 2019, 123, 25611–25617. [Google Scholar] [CrossRef]
- Draber, F.M.; Denninger, J.R.; Müller, P.C.; Sommerfeld, I.K.; Martin, M. The Impact of Nanoscale Percolation in Yttrium-Doped BaZrO3 on the Oxygen Ion and Proton Conductivities: A Density Functional Theory and Kinetic Monte Carlo Study. Adv. Energy Sustain. Res. 2022, 3, 2200007. [Google Scholar] [CrossRef]
- Draber, F.M.; Ader, C.; Arnold, J.P.; Eisele, S.; Grieshammer, S.; Yamaguchi, S.; Martin, M. Nanoscale percolation in doped BaZrO3 for high proton mobility. Nat. Mater. 2020, 19, 338. [Google Scholar] [CrossRef]
- Merinov, B.; Goddard, W.A. Proton diffusion pathways and rates in Y-doped BaZrO3 solid oxide electrolyte from quantum mechanics. J. Chem. Phys. 2009, 130, 194707. [Google Scholar] [CrossRef] [PubMed]
- Yamazaki, Y.; Blanc, F.; Okuyama, Y.; Buannic, L.; Lucio-Vega, J.C.; Grey, C.P.; Haile, S.M. Proton trapping in yttrium-doped barium zirconate. Nat. Mater. 2013, 12, 647–651. [Google Scholar] [CrossRef] [PubMed]
- Gorelov, V.P.; Balakireva, V.B.; Kuz’min, A.V. Ionic, Proton, and Oxygen conductivities in the BaZr1–xYxO3–α system (x = 0.02–0.15) in humid air. Russ. J. Electrochem. 2010, 46, 890–895. [Google Scholar] [CrossRef]
- Perdew, J.P.; Chevary, J.A.; Vosko, S.H.; Jackson, K.A.; Pederson, M.R.; Singh, D.J.; Fiolhais, C. Atoms, molecules, solids, and surfaces: Applications of the generalized gradient approximation for exchange and correlation. Phys. Rev. B Condens. Matter Mater. Phys. 1992, 46, 6671. [Google Scholar] [CrossRef]
- Perdew, J.P.; Burke, K.; Ernzerhof, M. Generalized gradient approximation made simple. Phys. Rev. Lett. 1996, 77, 3865. [Google Scholar] [CrossRef] [PubMed]
- Kresse, G.; Furthmuller, J. Efficiency of ab-initio total energy calculations for metals and semiconductors using a plane-wave basis set. Comput. Mater. Sci. 1996, 6, 15–50. [Google Scholar] [CrossRef]
- Stolbov, S.; Ortigoza, M.A.; Rahman, T.S. Application of density functional theory to CO tolerance in fuel cells: A brief review. J. Phys. Condens. Matter. 2009, 21, 474226. [Google Scholar] [CrossRef]
- Blochl, P.E. Projector augmented-wave method. Phys. Rev. B Condens. Matter Mater. Phys. 1994, 50, 17953–17979. [Google Scholar] [CrossRef]
- Kresse, G.; Joubert, D. From ultrasoft pseudopotentials to the projector augmented-wave method. Phys. Rev. B Condens. Matter Mater. Phys. 1999, 59, 1758–1775. [Google Scholar] [CrossRef]
- Anisimov, V.I.; Zaanen, A. Band theory and mott insulators: Hubbard U instead of stoner I. Phys. Rev. B Condens. Matter Mater. Phys. 1991, 44, 943–954. [Google Scholar] [CrossRef] [PubMed]
- Henkelman, G.; Jonsson, H. Improved tangent estimate in the nudged elastic band method for finding minimum energy paths and saddle points. J. Chem. Phys. 2000, 113, 9978–9985. [Google Scholar] [CrossRef]
- Henkelman, G.; Uberuaga, B.P.; Jonsson, H. A climbing image nudged elastic band method for finding saddle points and minimum energy paths. J. Chem. Phys. 2000, 113, 9901–9904. [Google Scholar] [CrossRef]
- Helal, M.A.; Kojima, S. Structural instability and phase transition in BaZrO3 single crystals: Brillouin scattering and DFT study. Mater. Sci. Eng. B 2021, 271, 115314. [Google Scholar] [CrossRef]
- Bilic, A.; Gale, J.D. Ground state structure of BaZrO3: A comparative first-principles study. Phys. Rev. B 2009, 79, 174107. [Google Scholar] [CrossRef]
- Bjorketun, M.E.; Sundell, P.G.; Wahnstrom, G.; Engberg, D. A kinetic Monte Carlo study of proton diffusion in disordered perovskite structured lattices based on first-principles calculations. Solid State Ion. 2005, 176, 3035–3040. [Google Scholar] [CrossRef]
- Nowick, A.S.; Du, Y. High-temperature protonic conductors with perovskite-related structures. Solid State Ion. 1995, 77, 137–146. [Google Scholar] [CrossRef]
- Agmon, N. The Grotthuss mechanism. Chem. Phys. Lett. 1995, 244, 456. [Google Scholar] [CrossRef]
- Gomez, M.A.; Griffin, M.A.; Jindal, S.; Rule, K.D.; Cooper, V.R. The effect of octahedral tilting on proton binding sites and transition states in pseudo-cubic perovskite oxides. J. Chem. Phys. 2005, 123, 094703. [Google Scholar] [CrossRef] [PubMed]
- Islam, M.S.; Davies, R.A.; Gales, J.D. Proton migration and defect interactions in the CaZrO3 orthorhombic perovskite: A quantum mechanical study. Chem. Mater. 2001, 13, 2049–2055. [Google Scholar] [CrossRef]
- Munch, W.; Kreuer, K.D.; Seifert, G.; Maier, J. Proton diffusion in perovskites: Comparison between BaCeO3, BaZrO3, SrTiO3, and CaTiO3 using quantum molecular dynamics. Solid State Ion. 2000, 136, 183–189. [Google Scholar] [CrossRef]
- Lei, X.; Huang, K.; Qin, C. Enhanced interfacial proton migration on BaZr(Y)O3 by molten carbonate: A first principles study. Solid State Ion. 2016, 289, 48–54. [Google Scholar] [CrossRef]
- Munch, W.; Seifert, G.; Kreuer, K.D.; Maier, J. A quantum molecular dynamics study of the cubic phase of BaTiO3 and BaZrO3. Solid State Ion. 1997, 97, 39–44. [Google Scholar] [CrossRef]
- Rizwan, M.; Aleena, S.; Shakil, M.; Mahmood, T.; Zafar, A.A.; Hussain, T.; Farooq, M.H. A computational insight of electronic and optical properties of Cd-doped BaZrO3. Chinese J. Phys. 2020, 66, 318–326. [Google Scholar] [CrossRef]
- Yuan, Y.; Zhang, X.; Liu, L.; Jiang, X.; Lv, J.; Li, Z.; Zou, Z. Synthesis and photocatalytic characterization of a new photocatalyst BaZrO3. Int. J. Hydrog. Energy 2008, 33, 5941–5946. [Google Scholar] [CrossRef]
- Fabbri, E.; Pergolesi, D.; Licoccia, S.; Traversa, E. Does the increase in Y-dopant concentration improve the proton conductivity of BaZr1–xYxO3-δ fuel cell electrolytes? Solid State Ion. 2010, 181, 1043–1051. [Google Scholar] [CrossRef]
- Uthayakumar, A.; Pandiyan, A.; Moorthy, S.B.K. Yttrium dependent space charge effect on modulating the conductivity of barium zirconate electrolyte for solid oxide fuel cell. Int. J. Hydrog. Energy 2018, 43, 23488–23499. [Google Scholar] [CrossRef]
Disclaimer/Publisher’s Note: The statements, opinions and data contained in all publications are solely those of the individual author(s) and contributor(s) and not of MDPI and/or the editor(s). MDPI and/or the editor(s) disclaim responsibility for any injury to people or property resulting from any ideas, methods, instructions or products referred to in the content. |
© 2023 by the authors. Licensee MDPI, Basel, Switzerland. This article is an open access article distributed under the terms and conditions of the Creative Commons Attribution (CC BY) license (https://creativecommons.org/licenses/by/4.0/).

