Article

Comparison of the Laser-Repairing Features of TC4 Titanium Alloy with Different Repaired Layers

1
State Key Laboratory of Materials Processing and Die and Mould Technology, Huazhong University of Science and Technology, Wuhan 430074, China
2
Zhengzhou Research Institute, Harbin Institute of Technology, Zhengzhou 450000, China
3
State Key Laboratory of Advanced Welding and Joining, Harbin Institute of Technology, Harbin 150001, China
*
Authors to whom correspondence should be addressed.
Crystals 2023, 13(3), 438; https://doi.org/10.3390/cryst13030438
Submission received: 4 February 2023 / Revised: 22 February 2023 / Accepted: 28 February 2023 / Published: 3 March 2023
(This article belongs to the Special Issue Laser Melting of Metals and Metal Matrix Composites)

Abstract

:
The laser repairing of TC4 holes was successfully performed with three and five layers under 2.5 mm and 1.0 mm diameters of laser spot, respectively. Experimental and numerical simulations were employed to clarify the influence of the repaired layers on microstructure, residual stress and strength. Optimized parameters were selected based on satisfactory formations. For the laser-repairing process with three layers, optimized parameters were selected as 1100 W laser power, 0.6 m/min scanning speed and 5 g/min powder feeding rate. For the laser-repairing process with five layers, optimized parameters were 800 W laser power, 0.9 m/min scanning speed and 3.5 g/min powder feeding rate. Numerical simulation showed that higher residual stress and larger repairing deformation would be produced when five repairing layers were adopted due to a more severe thermal accumulation effect. The microstructure from the TC4 matrix to the repaired area was orderly lamellar α phase + intercrystalline β phase-basketweave structure-martensite structure-widmannstatten structure. Tensile test results showed that higher tensile strength (910.5 MPa) would be obtained when three repaired layers were adopted.

1. Introduction

Lightweight design is a great attribute in transportation, aeronautics and astronautics since it improves the carrying capacity [1,2] and reduces cost. The past decades have seen the rapid development of titanium alloy for its wonderful stability in high-temperature environments, great specific strength and corrosion resistance properties [3,4]. Therefore, it has been widely used in aviation fields, for example as compressor disks and aero-engine casing, for its superior service performance [5].
Fabricating holes and casting defects encountered in the manufacturing process as well as wearing damage during service are considered to be urgent common problems with the growth in demand for titanium alloy components [6,7]. Traditional studies about repairing technology have mainly focused on argon arc welding [8]. However, this method needs large heat input and produces a large heat-effect-zone (HAZ), which may cause dramatic residual stress, large deformation and finally reduce mechanical properties [7]. With the development of laser technology, lasers are supposed to be one of the most promising methods for metal component repair [9]. The literature reported that laser-repairing technology had great advantages in repair quality, precision and distortion control compared to conventional manual arc welding [10]. Researchers [11] successfully repaired turbine blades using laser-repairing technology and the repaired accuracy was up to 0.1 mm. Huang et al. [12] found that laser-repairing parameters had a deep effect on microstructure and finally led to the variation of mechanical properties. Wang et al. [13] repaired BT20 titanium alloy cups using pulsed laser-repairing technology and they found that the diffusive behaviors of elements were attributed to different performances between the repaired zone and substrate. Researchers from EWI [14] also used the Finite Element Model to predict the stress and distortion of blades repaired by laser repairing and they discovered that preheating and layer cooling are effective methods to reduce the cracking tendency and residual stress.
Previous studies established the relationship between laser power, scanning speed and powder feed rate and the quality of laser-repaired Ti6Al4V components [15]. Generally, the grain size was considered to be closely tied to the incident energy, which could be controlled by changing the parameter combination of laser power and scanning speed [16]. Lower incident energy principally resulted in finer β-grain from 0.2 mm to 4 mm in width and 1 mm to 20 mm in height, for example, by decreasing laser power and/or increasing scanning speed [17]. Nevertheless, a faster scanning speed might lead to porosity and defects during the laser-repairing process. It was also reported that the powder feeding rate had a positive relativity to the columnar microstructure while the correlation faded in high laser power situations [18].
Therefore, the aim of this research was to optimize the laser-repairing parameters for TC4 holes under three and five repaired layers. Then, residual stress under these two conditions was compared. After that, the microstructure and mechanical properties for the repaired samples were observed and evaluated.

2. Experimental Procedures
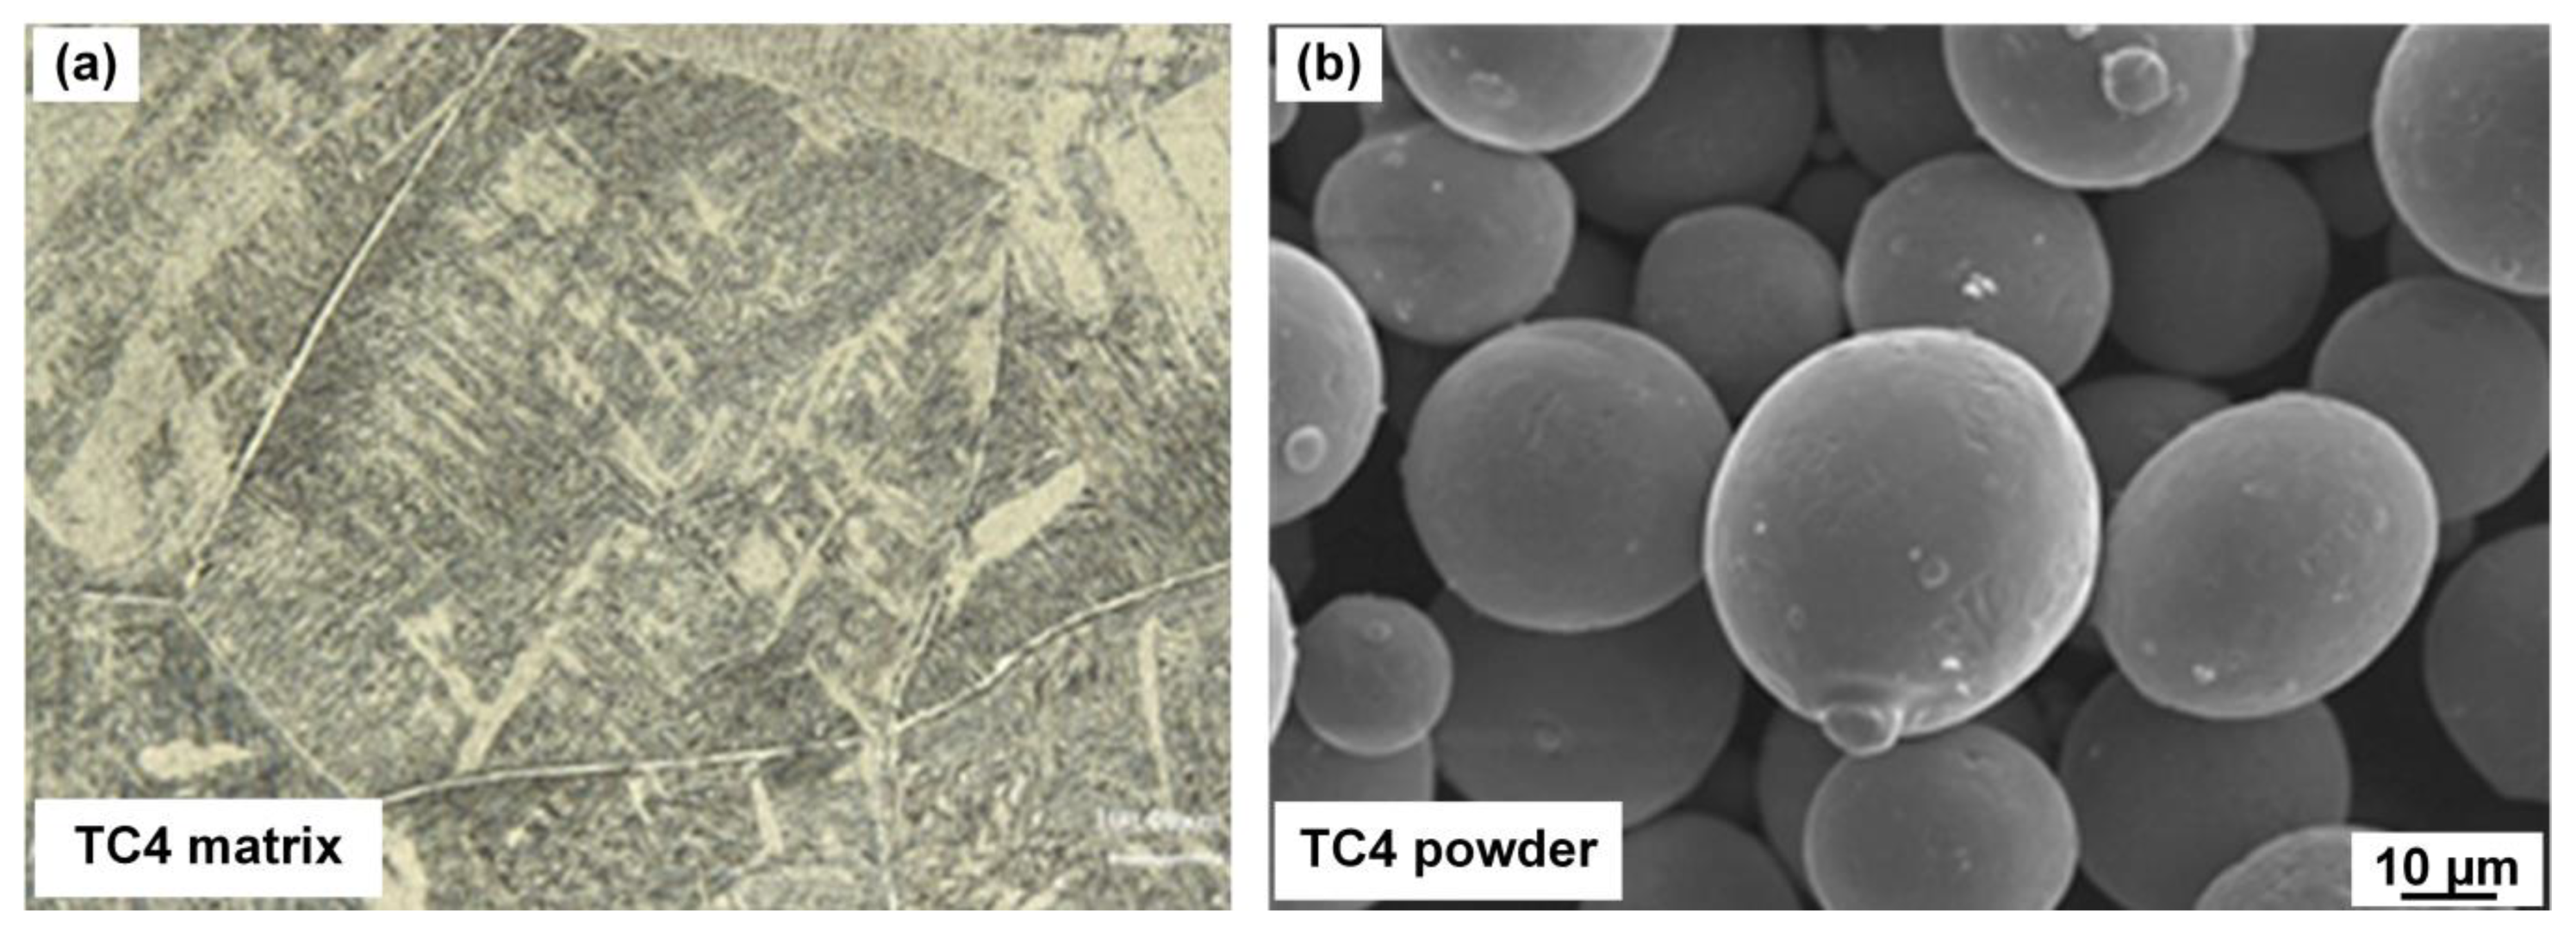
2.1. Materials

In this research, the repaired material was selected as TC4 titanium alloy. Dimension of base metal was 100 mm (length) × 100 (width) mm × 5.5 mm (thickness). Tensile strength, yield strength and fractured strain for TC4 were 899.7 MPa, 820.0 MPa and 6.6%, respectively. Corresponding nominal compositions of TC4 matrix are listed in Table 1. TC4 powder with the diameter of 45–105 μm was selected as repairing material. The microstructure for TC4 matrix and powder are shown in Figure 1.

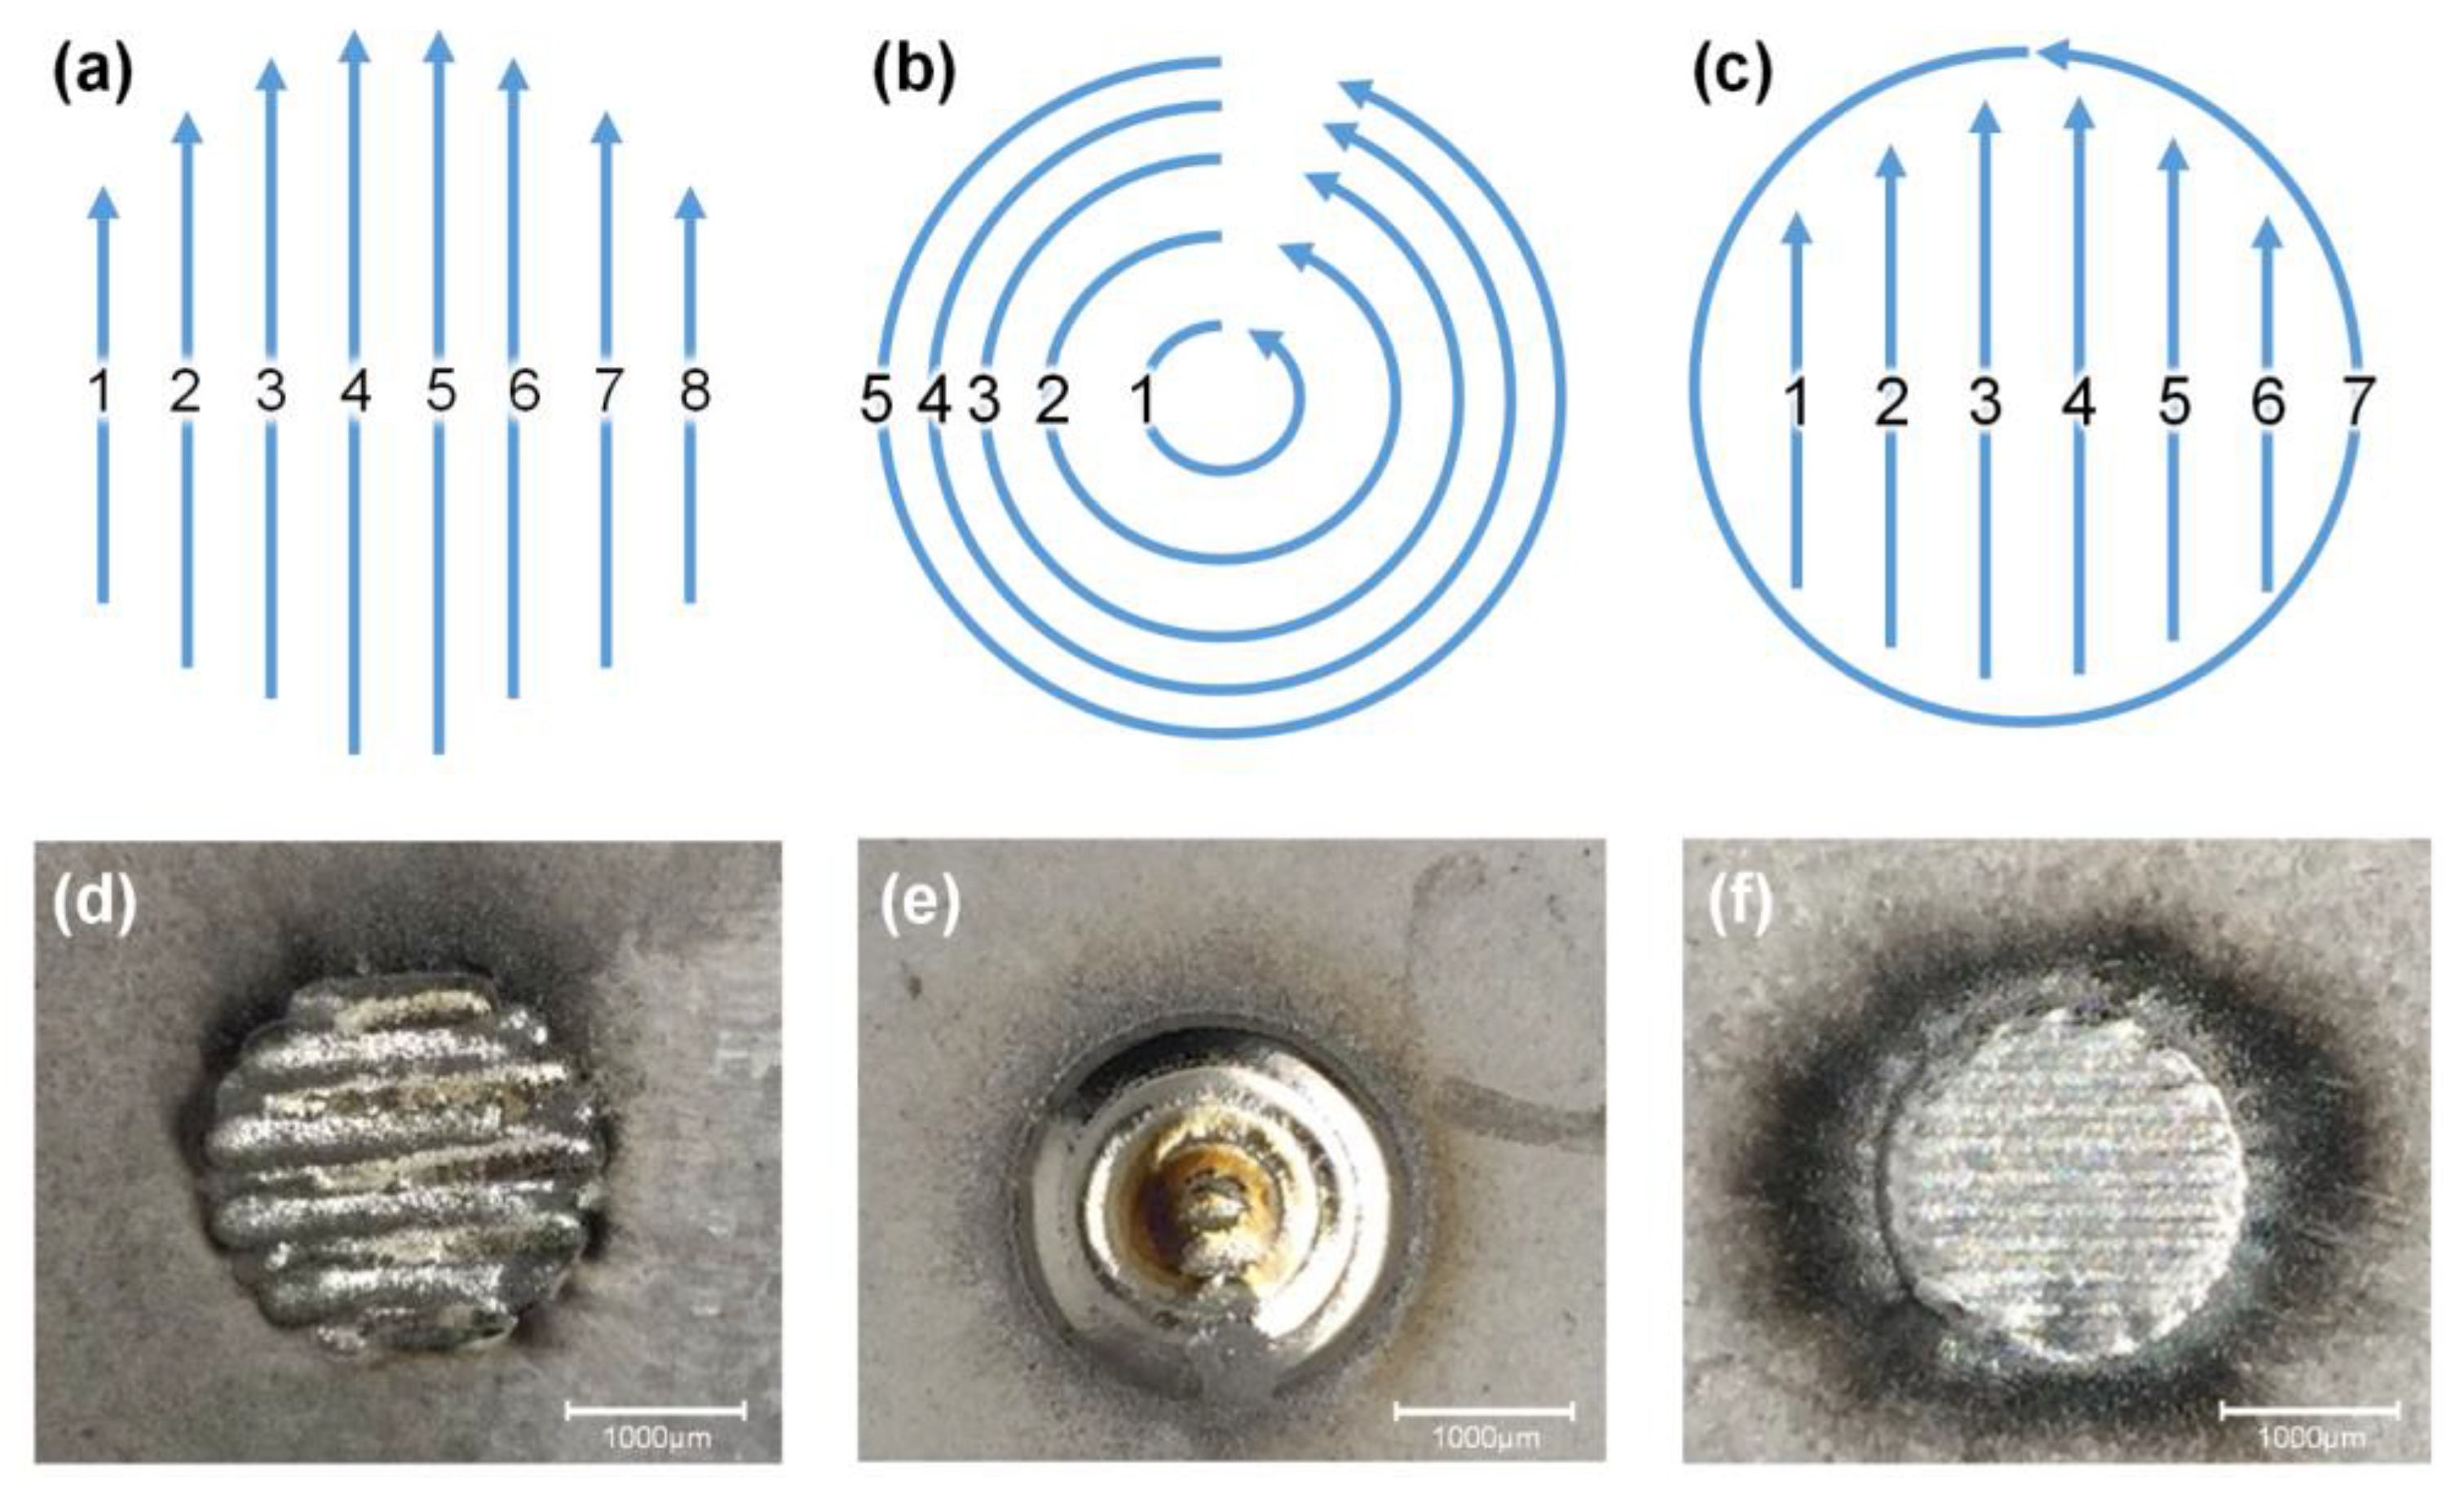
2.2. Experimental Process

IPG–YLR–4000 IPG fiber laser, YC50 cladding head, GTV powder feeder, KUKA six-axis robot and coaxial nozzle were assembled as laser-repairing system as seen in Figure 2a. The repairing hole was located in the center of matrix. The depth, diameter at bottom region were 3 mm, 10 mm while inclined angle at side wall was 45° as seen in Figure 2c. Before repairing process, TC4 matrix was immersed in mixed solution of 1% HF and 3% HNO3 for 5 min. Then, the surficial oxide film and oil were flushed by wire brush and then flushed in water to remove residual contaminants. After that, the fleshed TC4 matrix was dried in oven for 1 h under 120°. Finally, dried plate was further cleared by acetone and then set in chamber for repairing. The TC4 powders were also dried and then set into powder feeder.
During the laser-repairing process, the focused distances of laser were selected as −15 mm and −5 mm to obtain laser diameters of 2.5 mm and 1.0 mm in order to reduce repairing defects. To control the experimental deformation, constraints were employed to fix the edge of TC4 matrix. The repaired sample and scanning order along thickness direction are presented in Figure 3. Before repairing process, argon flow into chamber prevented repaired samples from oxidation. When argon flow was completed, a water oxygen content of 0.1–10 ppm was maintained. Before finally commencing laser-repairing process, single-pass scanning experiments were conducted to optimize laser-repairing parameters under the judgment of satisfactory appearance (without porosities or cracks, etc.). The final optimized parameters are listed in Table 2. The scanning times were 5, 6 and 7 along 1st, 2nd and 3rd layers when repaired layers were 3. The scanning times were 6, 7, 8, 9 and 10 for 1st, 2nd, 3rd, 4th and 5th layers when repaired layers were 5 as seen in Figure 3b.
Before final repairing process, comparison between different repairing paths was conducted. In this research, three kinds of repairing paths were employed, namely sequential, annular and sequential + outer annular as seen in Figure 4. Then, sequential + outer annular repairing path was selected since the most satisfactory formation was obtained as seen in Figure 4f.

2.3. Analysis Methods

When repairing process was finished, sample with the length of 40 mm was cut from the center of repairing area. A standard grinding process was carried out on selected samples and finally obtained mirror-like surface. Then, this mirror-like surface was etched by Kroll reagent (HF:HCl:HNO3:H2O = 1:3:7:89) for 15 s. When etching process was finished, the surface of sample was flushed by deionized water and alcohol and finally dried. The optical micrograph (OM) was photographed by VHX-1000E super-depth microscope (Keyence, Osaka, Japan).
The tensile strength of repairing area was evaluated under AG-X Plus 50 kN tensile machine (Keyence). The dimension for tensile-tested samples is seen in Figure 5. Then, tensile test was carried out at the cross-speed of 5 mm/min under room temperature.

2.4. Numerical Simulation

To compare the residual stress distribution under different repairing layers, commercial finite element method (FEM) software MSC. Marc (MSC, Newport Beach, CA, USA) was employed. The material properties for TC4 are presented in Table 3 while developed numerical models are presented in Figure 6. Finer meshes with dimensions of 0.4 mm × 0.4 mm and coarser meshes with dimensions of 0.8 mm × 0.8 mm were, respectively, divided in repairing area and outer region in order to shorten the calculation duration based on acceptable accuracy.
In this research, double ellipsoidal heat source was employed to describe heat distribution for laser energy in space [20], which is presented Equations (1) and (2).
q ( x , y , z ) = 6 3 f 1 Q π a 1 b c π exp ( 3 x 2 a 1 2 ) exp ( 3 y 2 b 2 ) exp ( 3 z 2 c 2 )
q ( x , y , z ) = 6 3 f 2 Q π a 2 b c π exp ( 3 x 2 a 2 2 ) exp ( 3 y 2 b 2 ) exp ( 3 z 2 c 2 )
Q was the laser power; a, b, c were the parameters for double ellipsoid; f1 and f2 were distributed functions for ahead and rear ellipsoidal heat distribution and f1 + f2 = 2. During numerical simulation, the temperature of all nodes was set as 20 °C. Heat convection existed at side and top surfaces while a larger heat convection coefficient was set at bottom surface of matrix since it was directly contacted with substrate. Six-node constraint was set for the workpiece during repairing process, which was same with practical experiment.

3. Results

3.1. Initial Parameter Optimization

During the laser-repairing process, the laser spot diameter had a great effect on the repairing quality. In this research, laser spot diameters of 2.5 mm and 1.0 mm were selected. To optimize the repairing parameters, trial experiments were conducted. During the optimization of the repairing parameters under a single pass, satisfactory formation (without cracks, porosities or other defects) and the appreciable height(h)-width(w) ratio were two important indices of the repairing layer. These values had a great relationship with the defocused spot distance, laser power, scanning speed and powder feeding speed, etc. [21]. Therefore, the repairing formation, height and width under different repairing parameters were observed and are summarized in Table 4 and Table 5.
When spot diameters of 1.0 mm and 2.5 mm were adopted, the repairing formations under a single pass were observed and are listed in Table 4 and Table 5. Lower and narrower formations with coarse morphology would be obtained when lower laser power, powder feeding rate and higher scanning speed were adopted. A greater defect formed under lower laser power, higher scanning speed and powder feeding rate due to the insufficient melting of the fed powder. Meanwhile, burned powder and the excessive oxidation of the repairing zone would occur when higher laser power and a lower scanning speed and powder rate were employed, which was induced by excessive heat input.
When 1.0 mm and 2.5 mm laser spot diameters were adopted, the relationships between repairing parameters and formation features were observed and are presented in Figure 7 and Figure 8. With the increase in laser power, the TC4 matrix and fed powders would absorb more energy and a larger molten pool was produced. Therefore, more powders would be dropped into the molten pool and larger height and width values would be obtained under surficial tension [22]. Meanwhile, smaller height and width values were acquired with the enhancement of scanning speed, which resulted from the smaller molten pool dimension under lower laser energy density. Under this condition, less fed powder was dropped into the molten pool and the utilization rate of powder was reduced.
When a higher powder feeding rate was used, height values under a single pass were obviously increased while width values showed little variation. This could be analyzed as follows: when laser linear energy was constant, the dimension of the molten pool changed little. With the increase in the powder feeding rate, a larger volume of powder would be dropped into the molten pool and tacked along the height direction. With the enhancement of the repairing height, the molten pool would be downstream in a certain scale under the effect of surface tension. Therefore, the width values of the repairing layer would become larger.
From the above experimental results, it could be concluded that the repairing width values were mainly determined by laser power and scanning speed. A wider molten pool was produced under a higher laser power and smaller scanning speed. The repairing height values were determined by comprehensive factors of laser power, scanning speed and powder feeding rate. Greater repairing height values in a single pass would be obtained under a larger laser power, smaller scanning speed and higher powder feeding rate.
In addition, the following aspects should be taken into consideration to obtain suitable parameters. Excessive high and low scanning speed under certain laser powers should be avoided. When excessive high scanning speed was adopted, it would cause the reduction of wettability in connective layers and hence induce worse melting between layers. When excessive low scanning speed was adopted, it would cause the deformation of the repairing nozzle and affect the powder feeding accuracy, which finally resulted in a bad repairing formation.
Taking the above factors into consideration, optimized parameters for laser spot diameters of 1.0 mm and 2.5 mm were summarized and are listed in Table 6. Then, the laser-repairing process was conducted according to these parameters.

3.2. Residual Stress

To evaluate the influence of repairing layers on residual stress, numerical simulation was conducted to calculate the von Mises stress. First, the verification of the developed model was carried out by the comparison of experimental and numerical deformation, and the corresponding results are presented in Figure 8. From Figure 8, it can be seen that little difference exists between the numerical and experimental results, suggesting the acceptable accuracy of the developed model.
Figure 9 presents the residual stress distribution when a 1.0 mm laser spot diameter was adopted. Residual stress distribution along the first, second, third, fourth and fifth layers were extracted as seen in Figure 10a–e. It was found that when the repairing process was finished the largest von Mises stress was located at the starting point and its value was 920.0 MPa. During the laser-repairing process, the peak temperature along TC4 matrix was relatively lower. Therefore, a large temperature gradient existed at the starting point and TC4 matrix. When the next layer was repaired, the temperature gradient was further increased and a larger residual stress was produced when the repairing process was finished. Furthermore, the residual stress at the top layer was much larger than that of the bottom layer along the edge region of the repairing region. At the center region, residual stress was larger at the bottom layer than at the top layer, which was caused by its more severe thermal accumulation effect with the enhancement of the repaired layer.
Figure 11 presents the residual stress distribution when a 2.5 mm laser spot diameter was adopted. In this sample, residual stress along the first, second and third repairing layers was extracted. A similar residual stress distribution was discovered in this sample; namely, the largest von Mises stress of 872.6 MPa was generated at the starting point.
To further compare the influence of repairing layers on the residual stress distribution, residual stress along the top, middle and bottom layers was compared and the corresponding results are shown in Figure 12. It can be seen that higher residual stress was obtained when the repairing layers were five. In this condition, the repairing height and width values were smaller in the single repairing process and more repairing numbers and layers should be adopted. In this case, the sample would be subject to longer laser irradiation durations, which would lead to a more severe thermal accumulation effect. Under this condition, a higher temperature gradient was generated and hence larger residual stress was left when the repairing process was finished.
The repairing deformation for two samples is illustrated in Figure 13. It can be seen that the largest deformations of 0.20 mm and 0.26 mm (as seen in Figure 13b,e) were produced when repairing layers were three and five, respectively. Furthermore, a larger whole deformation level was generated when repairing layers were five, which was also induced by its more severe thermal accumulation effect [23].

3.3. Microstructure

The microstructures for repaired samples under three and five layers are presented in Figure 14, which shows the whole morphology. It can be seen that repaired samples have satisfactory formations and few defects, such as cracks and porosities, were found in these two samples as seen in Figure 14a,b. This indicated that the repairing parameters adopted in this research were reasonable. Figure 14c,d present the widths of the heat-affected zones (HAZ) for the two samples. A wider HAZ would be produced under larger repairing layers (0.98 mm under three repaired layers and 1.50 mm under five repaired layers) as the result of a longer heating effect duration. For further analysis of the microstructure, three HAZ(α+β), HAZ(β) and the repairing region were separated for observation.
In the HAZ(α+β) region, little influence of heat was exerted and the peak temperature in this region was lower than Tβ (the transition temperature from α-Ti to β-Ti). During the cooling process, the lamellar α phase and intercrystalline β phase were subject to a large heat variation. The pristine β phase was broken and the α phase with a small length-width ratio was produced, which favored the generation of a basketweave microstructure as seen in Figure 14e. The β phase with small volumes appeared nearby the pristine lamellar α phase and these β phases nucleated along the phase boundary of the α phase. Under these conditions, this structure finally appeared with an island structure. These β phases were named as the intercrystalline β phase as seen in Figure 14f. At the middle region between HAZ(α+β) and HAZβ, the peak temperature was near or even higher than Tβ. Therefore, it was discovered that cluster structures with a large volume appeared in the vicinity of the pristine lamellar α phase as seen in Figure 14g. During the cooling process, the pristine β phase between HAZ(α+β) and HAZβ was subject to larger supercooling and cooling rates. The newly formed α phase was nucleated along the interior of the basketweave microstructure and this favored the transition from basketweave to cluster.
At HAZβ, peak temperature was larger than Tβ since it was nearby the repairing area and therefore the phase transition from α to β occurred here. A larger cooling rate was also generated and the pristine β phase cooled rapidly at the MS location. Needle α martensite was formed as seen in Figure 14h. This needle-shaped α’ martensite had greater hardness and less toughness and plasticity compared with those of the TC4 matrix [24].
At the repairing region, peak temperature was higher than Tβ. The diffusion coefficient of the β phase became larger and this induced the clarification of the β phase and finally resulted in a coarser β phase. This coarser β phase grew along the opposite direction of the temperature gradient and penetrated several repaired layers to form a columnar grain penetrating through the whole repairing layer as seen in Figure 14i.
During the cooling and crystallization processes, the repairing region had a lower cooling rate compared with HAZβ. When peak temperature was lower than Tβ, the α phase was nucleated along the interior of the β phase. The formed α phase along this approach was short and coarse. Due to the high energy density of the laser spot, the HAZ was focused on a tiny region and element diffusion behavior during the cooling process was not obvious. Therefore, the newly formed phase was mainly composed of the needle and basketweave α phase, namely the widmannstatten structure as seen in Figure 14j. The formation of the widmannstatten structure was related to the cooling rate of materials. It was reported that when the cooling rate was larger than 410 °C/s, the formed phase was whole α’ martensite. When the cooling rate was between 20 °C/s and 410 °C/s, the formed phase was α’ martensite and a tiny secondary α phase. When the cooling rate was smaller than 20 °C/s, the formed phase was the widmannstatten structure [25]. In addition, a lower laser scanning speed resulted in a denser widmannstatten structure [26] and higher heat input produced more widmannstatten structure [24].
The OM for the bottom, middle and top regions of the repairing area was observed and the corresponding results are shown in Figure 14k–m. It was found that a slender widmannstatten structure was formed at the top region while a short and coarse α phase was formed at the bottom region. At the bottom region, partial α martensite was transformed into the β phase due to the re-melting effect from subsequent laser heating. The α phase was eroded by these newly formed and pristine β phases. Therefore, the α phase was shortened and finally grew into a short and coarse structure.

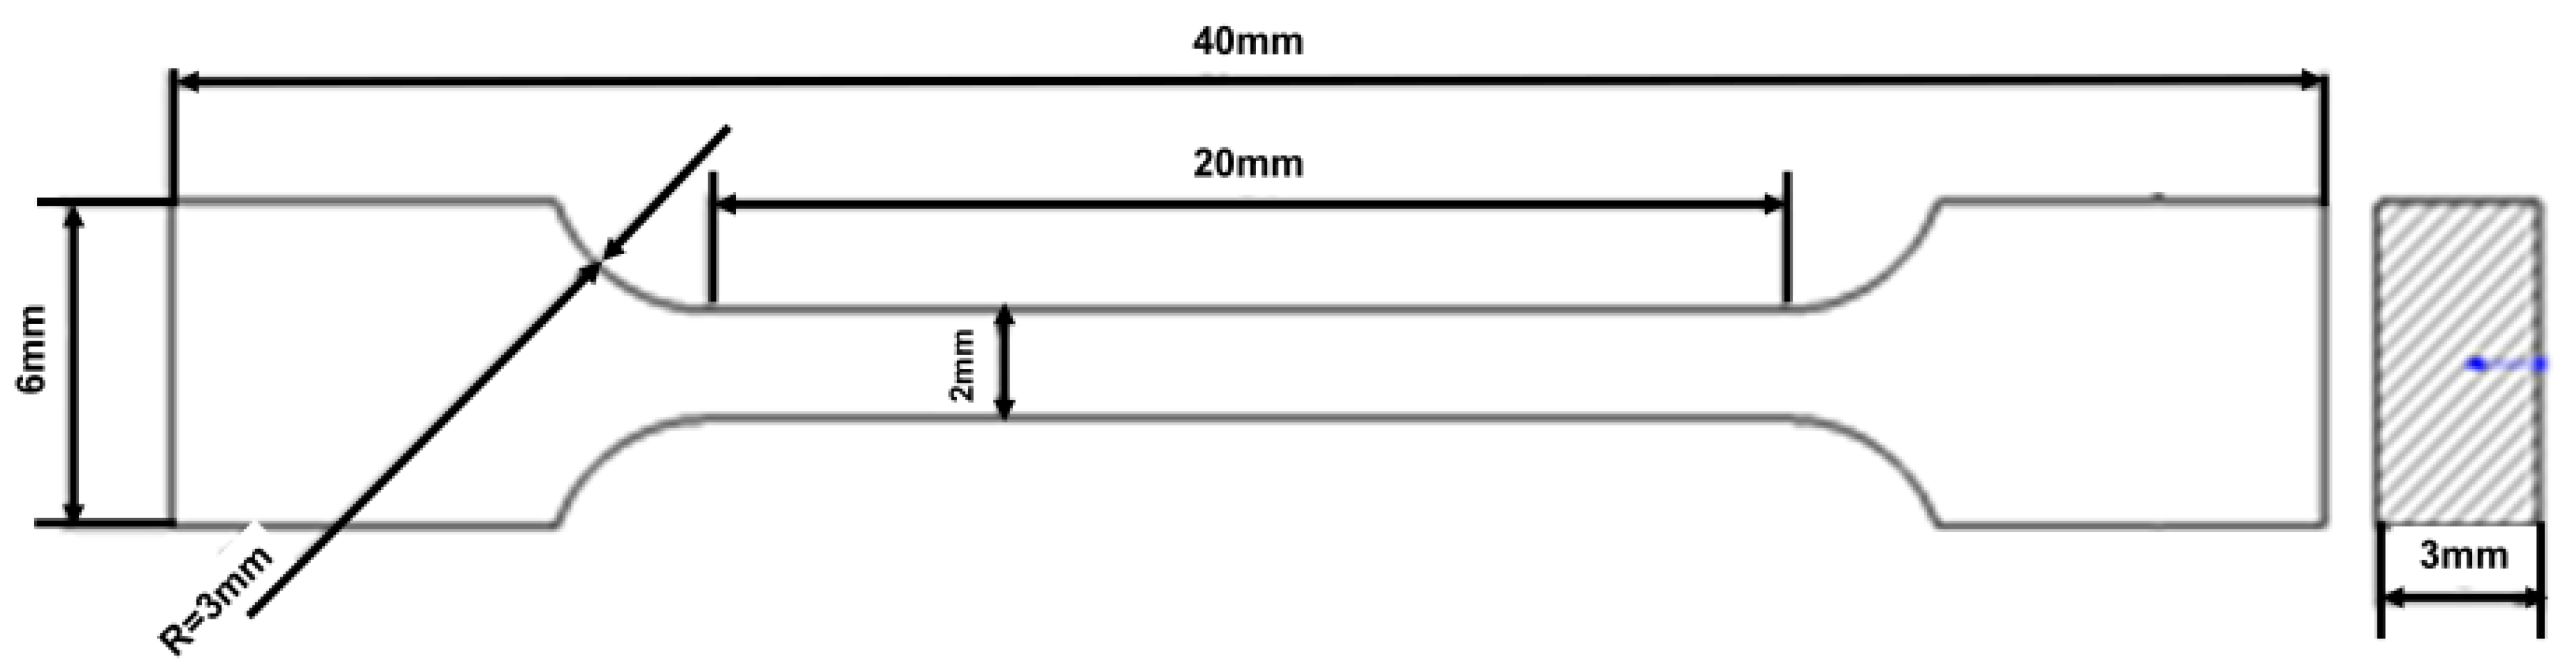
3.4. Mechanical Properties

To clarify the influence of repairing layers on mechanical properties, tensile tests were conducted for these two samples and the corresponding results are presented in Figure 15. It can be seen that the fractured location was, respectively, the TC4 matrix and the HAZ when the repaired layers were three and five. The tensile curves are shown in Figure 15c and fractured surfaces for these samples are presented in Figure 15d,e. When the repaired layers were three, the average tensile strength was 910.5 MPa (908 MPa/2 + 913 MPa/2) while it was reduced to 847.5 MPa (821 MPa/2 + 874 MPa/2) when the repaired layers increased to five. From Figure 15d, it can be seen that there were many dimples left on the fractured surface, which suggested a cleavage fracture [27].
During the fracturing process, the samples were subjected to load and easily evolved as they fractured and finally became dimples under the effect of dislocation movement [12]. This also indicated that the tensile strength of the repairing area was higher than the TC4 matrix and tiny defects (unmelted layers) had little influence on the final strength of the sample. It was found that samples at the fractured surface of the TC4 matrix were composed of two sections, namely an interior and outer protrusion. The interior of the dimple was the α phase with lower plasticity while outer protrusion was the intercrystalline β phase with higher plasticity and lower strength.
When repaired layers were five, it could be seen that the sample was fractured along the HAZ. At the fractured surface of the sample, many smaller dimples were discovered, which suggests it was also a ductile fracture. Under this condition, a larger residual tensile stress was produced at the HAZ. This region evolved from a fractured origination when tensile stress was loaded to failure [27]. Comparing the fractured dimples in these two samples, it was found that a longer fractured cleavage and larger fractured samples were formed in the TC4 matrix compared with those of the repairing zone. This indicated that larger energy absorption ability could be produced in the TC4 and this resulted in its more satisfactory tensile strength as seen in Figure 15a.

4. Conclusions

In this research, the laser repairing of TC4 3 mm-depth holes was successfully conducted by different repairing layers. Laser-repairing parameters were firstly optimized. Residual stress, repaired deformation, microstructure and tensile strength were observed and tested. The corresponding results are listed as follows:
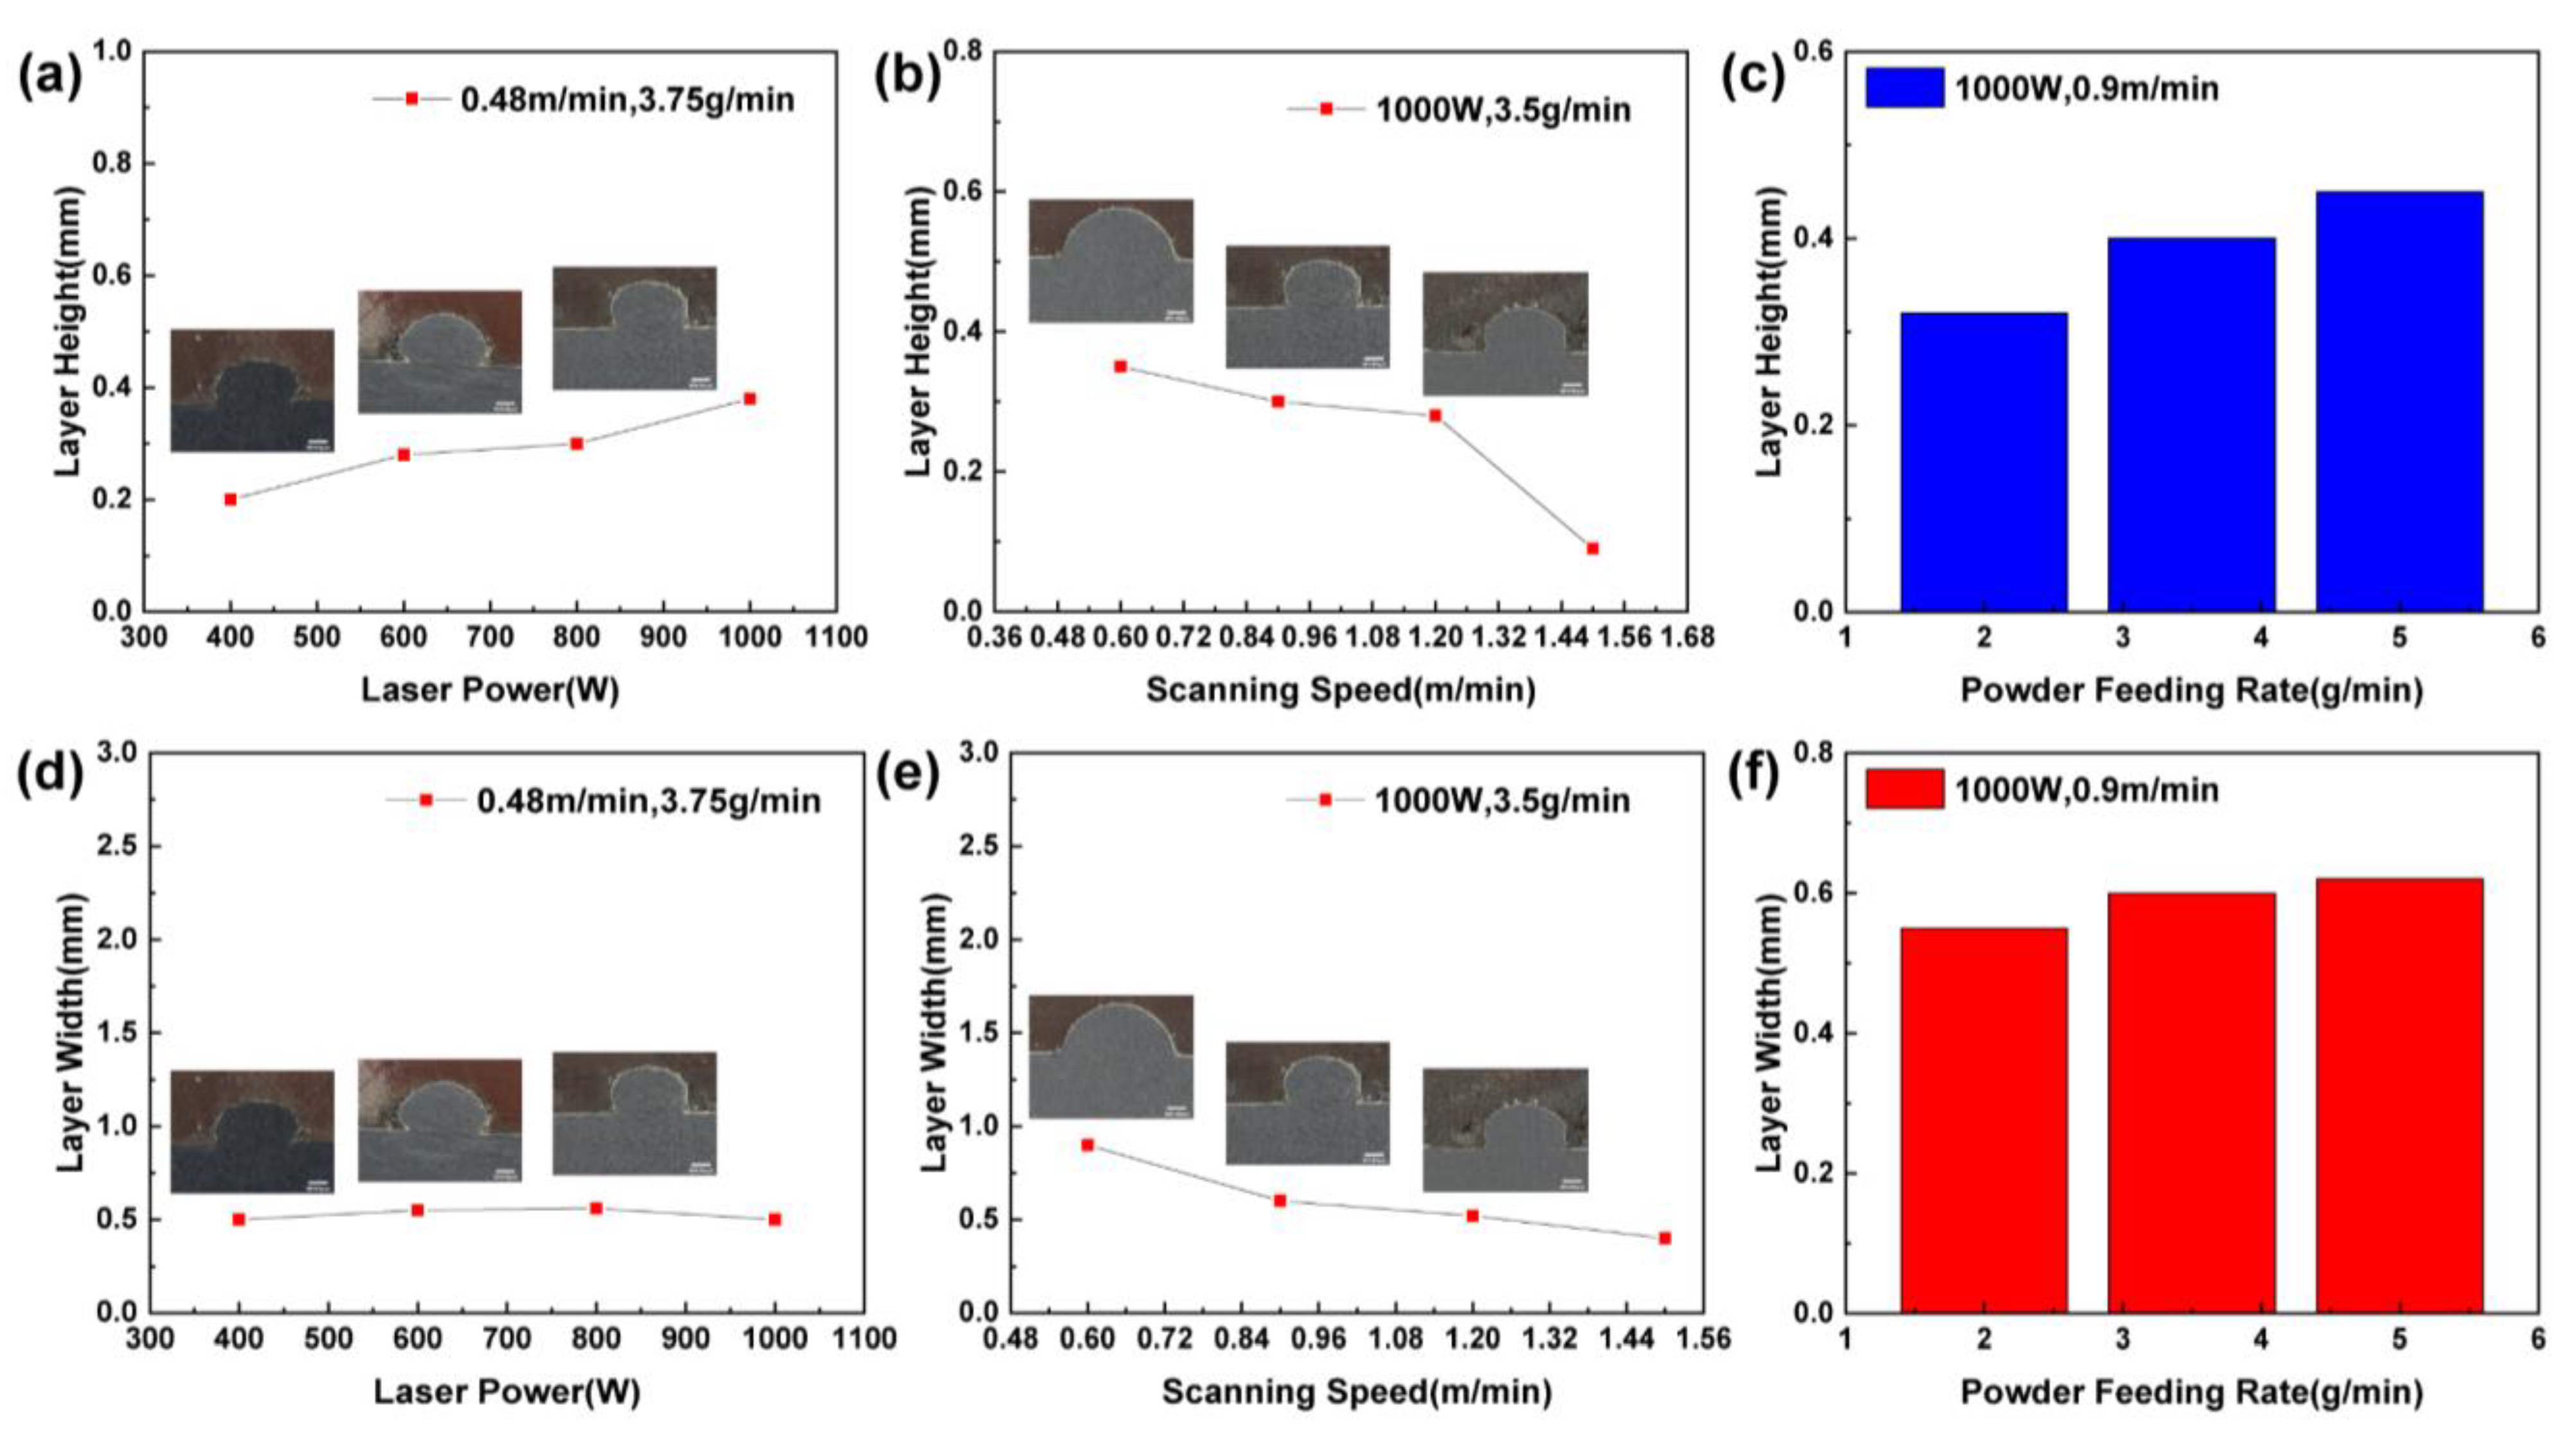
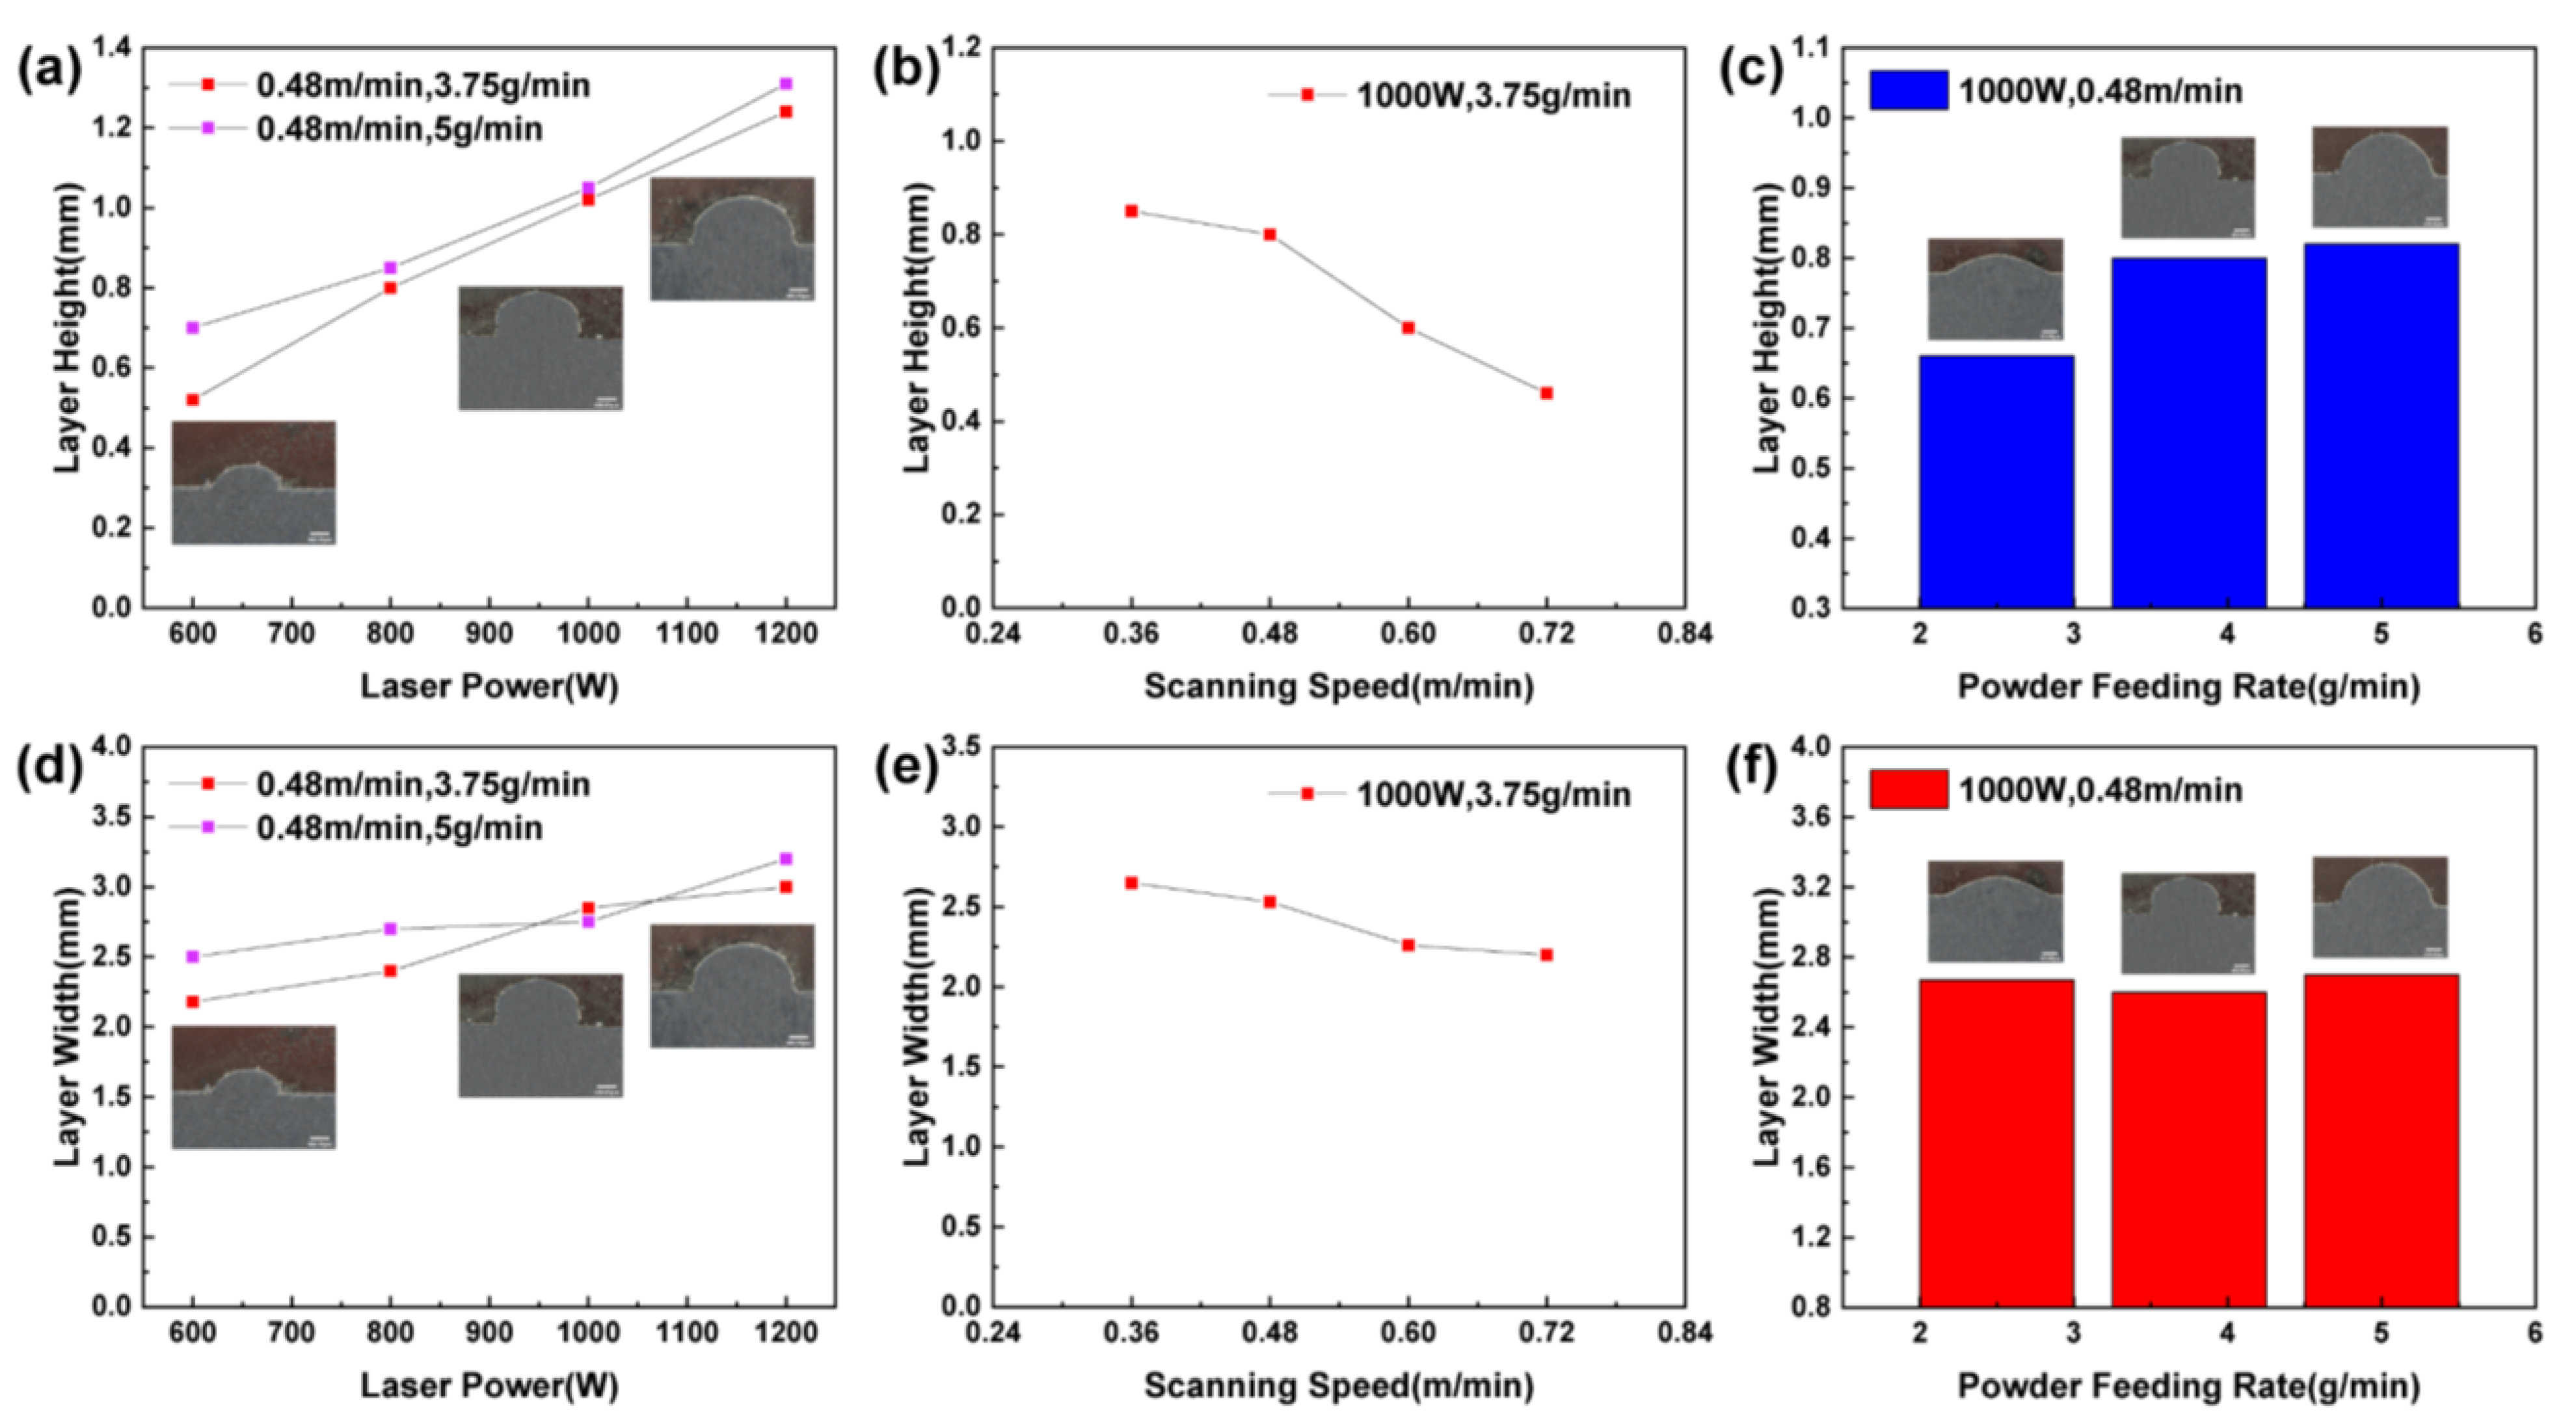
  • The relationship between repairing parameters and repaired formation was explored under a single laser-repairing process. With the increase in laser power, repairing height and width values became larger. With the increase in scanning speed, repairing height and width values became smaller. The repairing height values became larger while the repairing width values varied little under a higher powder feeding rate.
  • Optimized parameters obtained under different repaired layers were explored. When the repaired layers were three, laser power was 1100 W, scanning speed was 0.6 m/min and powder feeding rate was 5 g/min. When the repaired layers were five, laser power was 800 W, scanning speed was 0.9 m/min and powder feeding rate was 3.5 g/min.
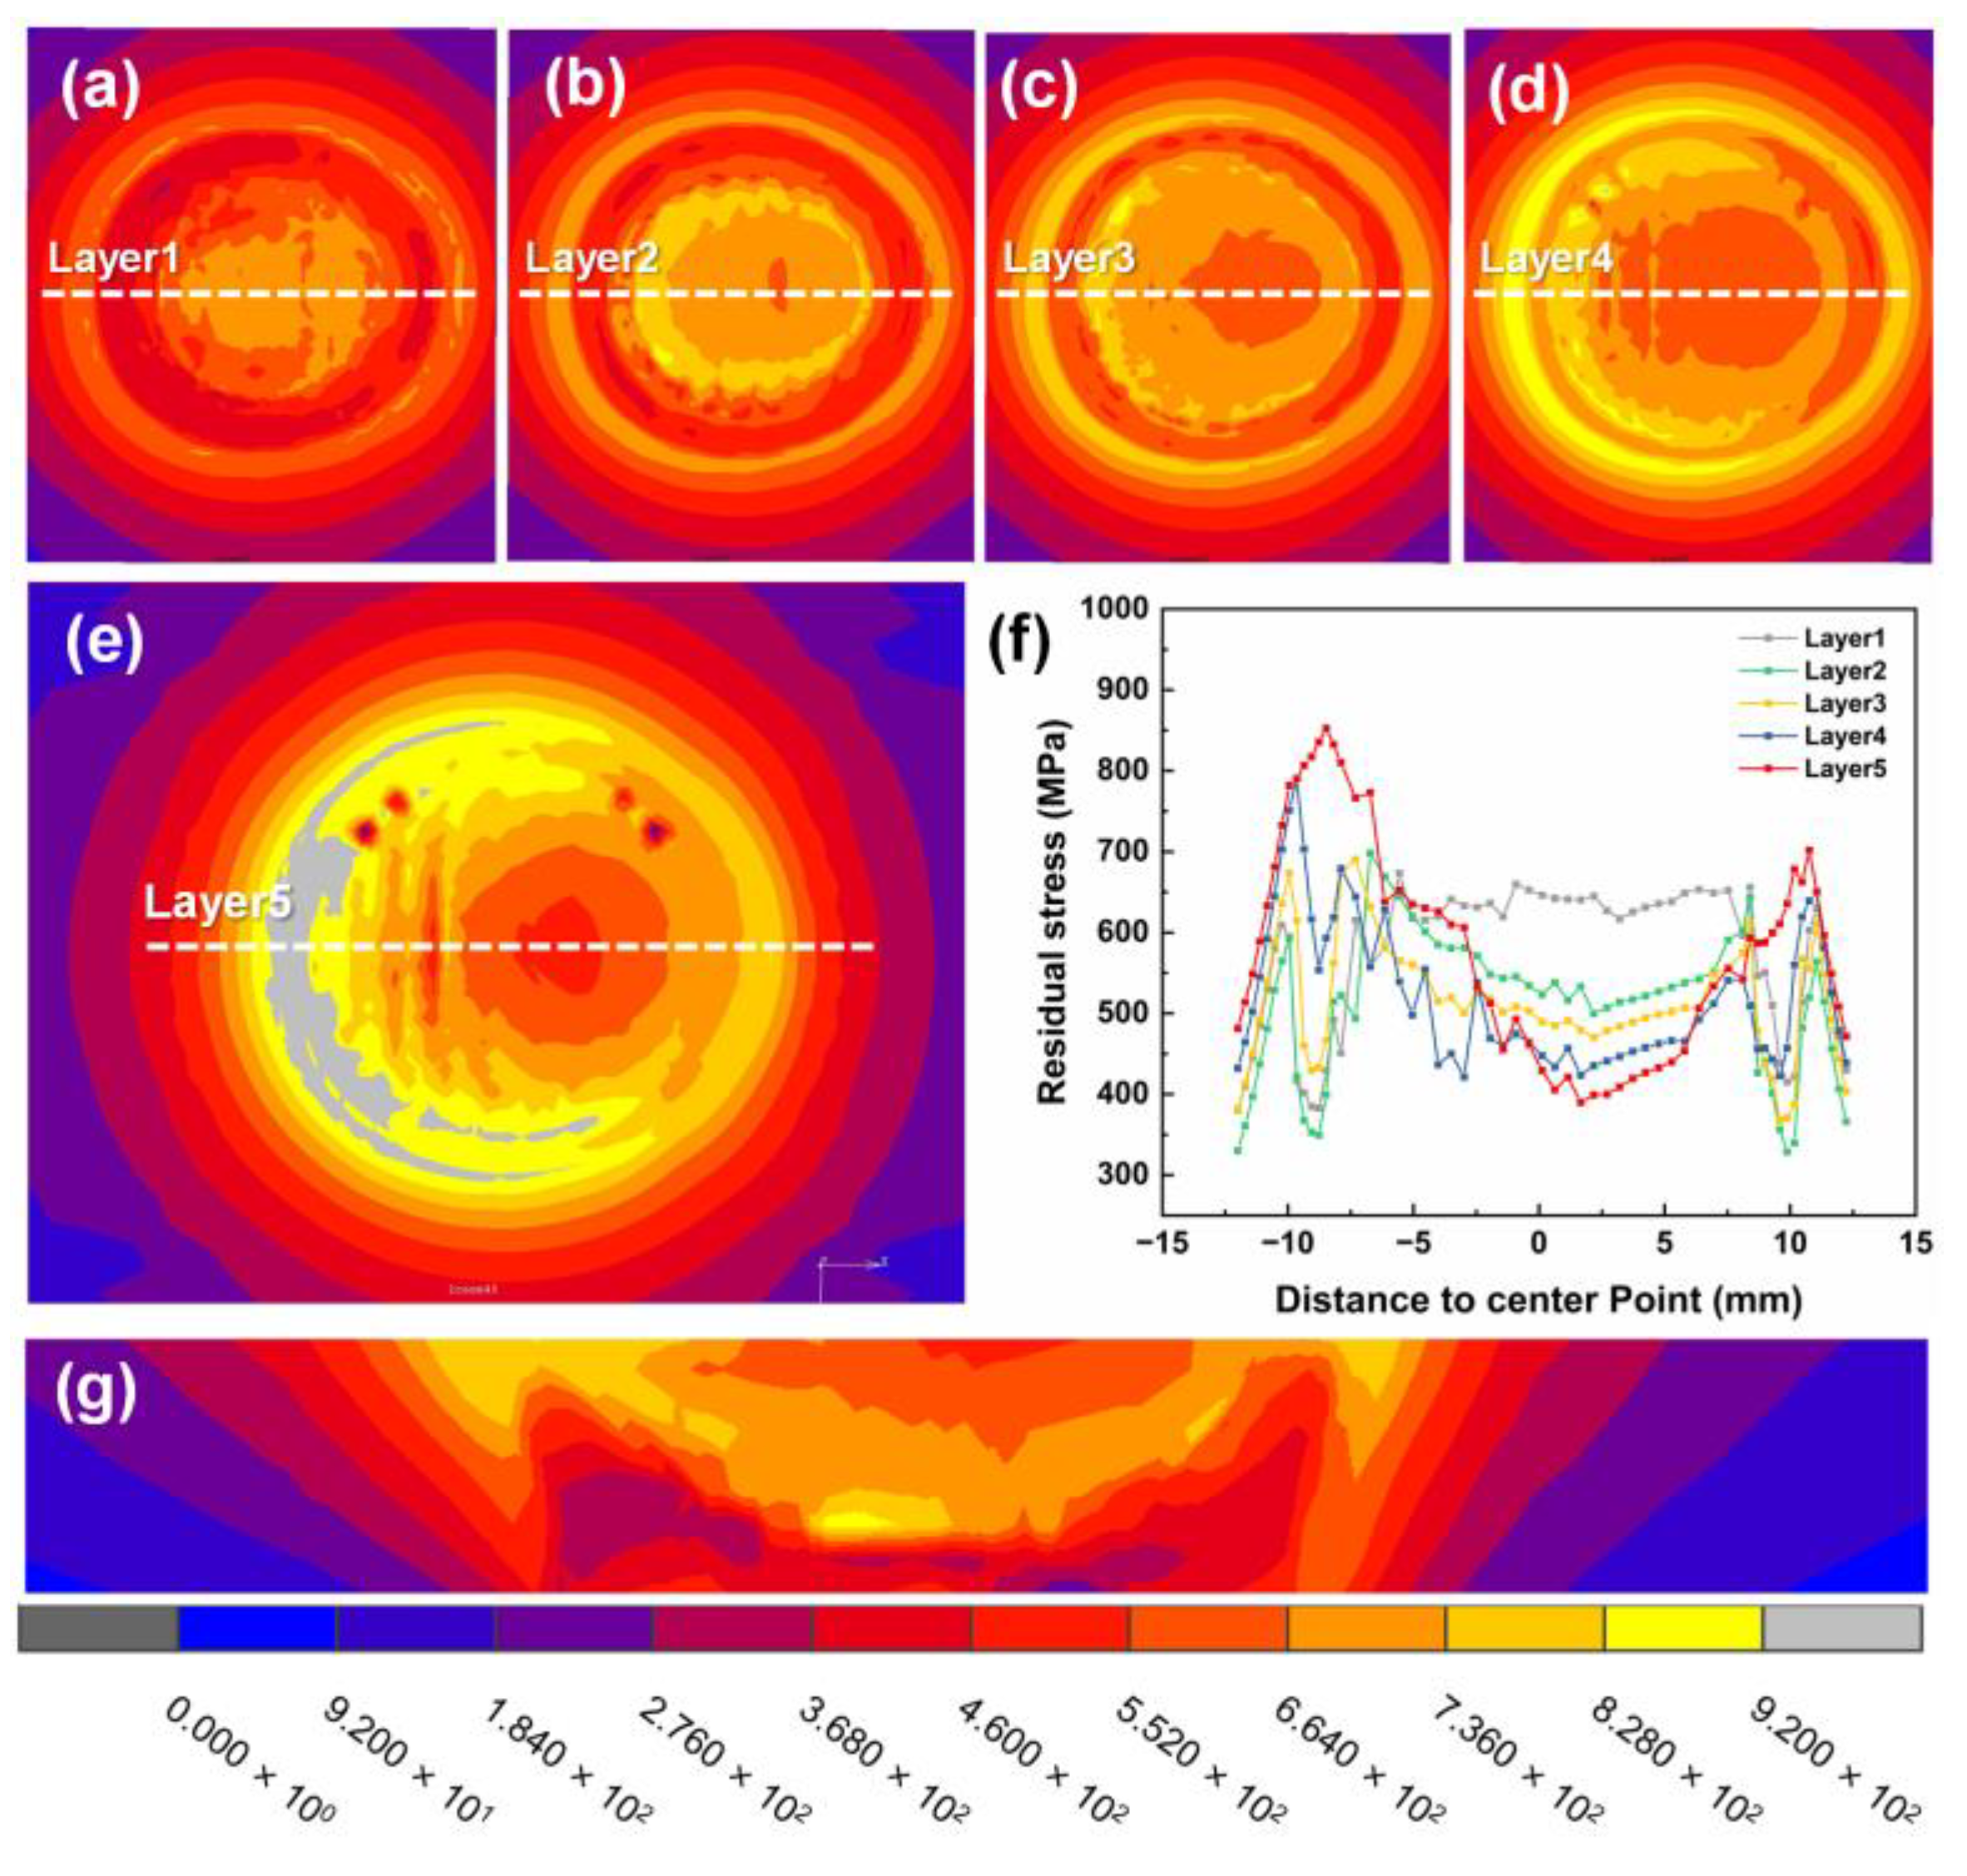
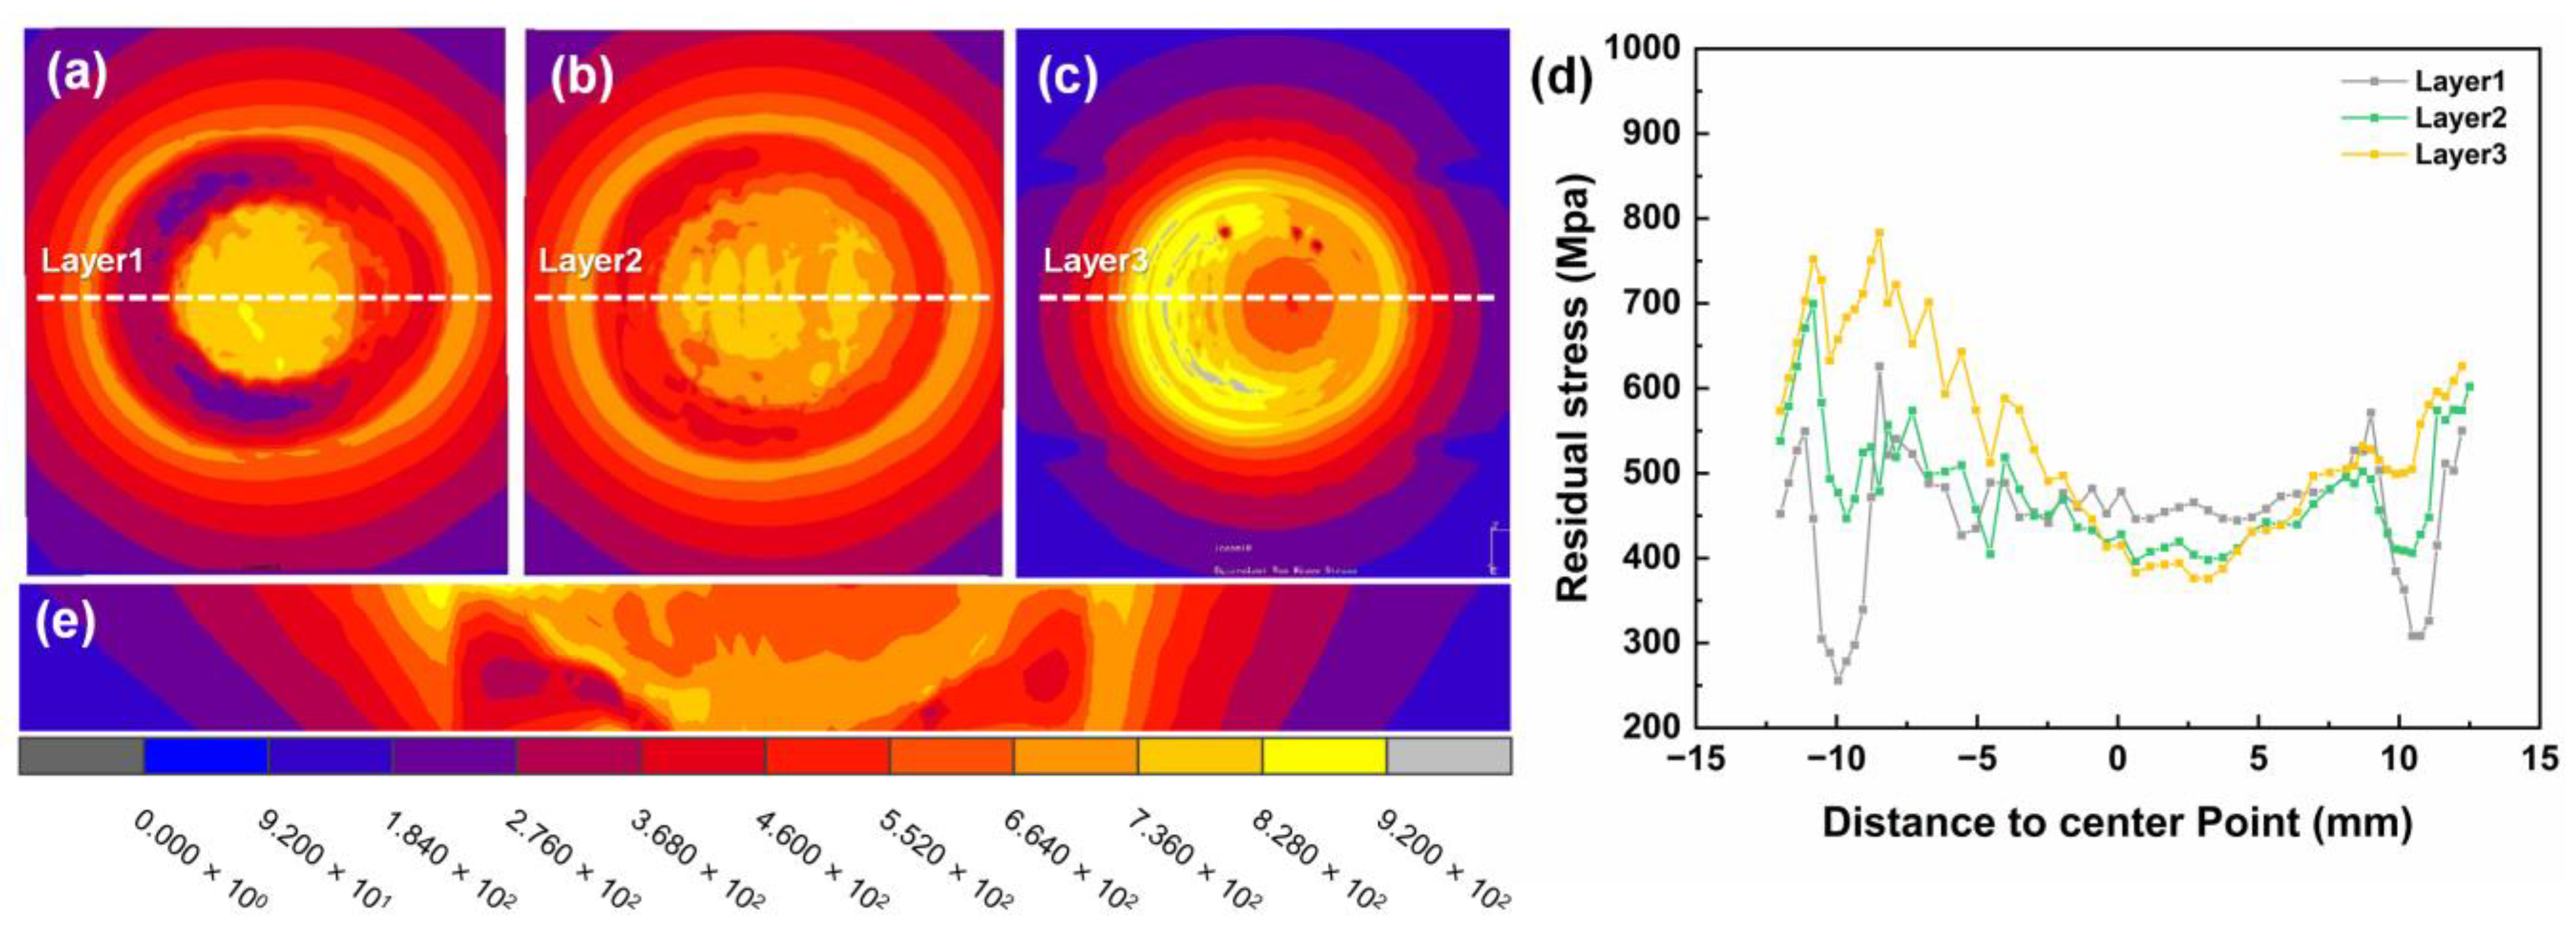
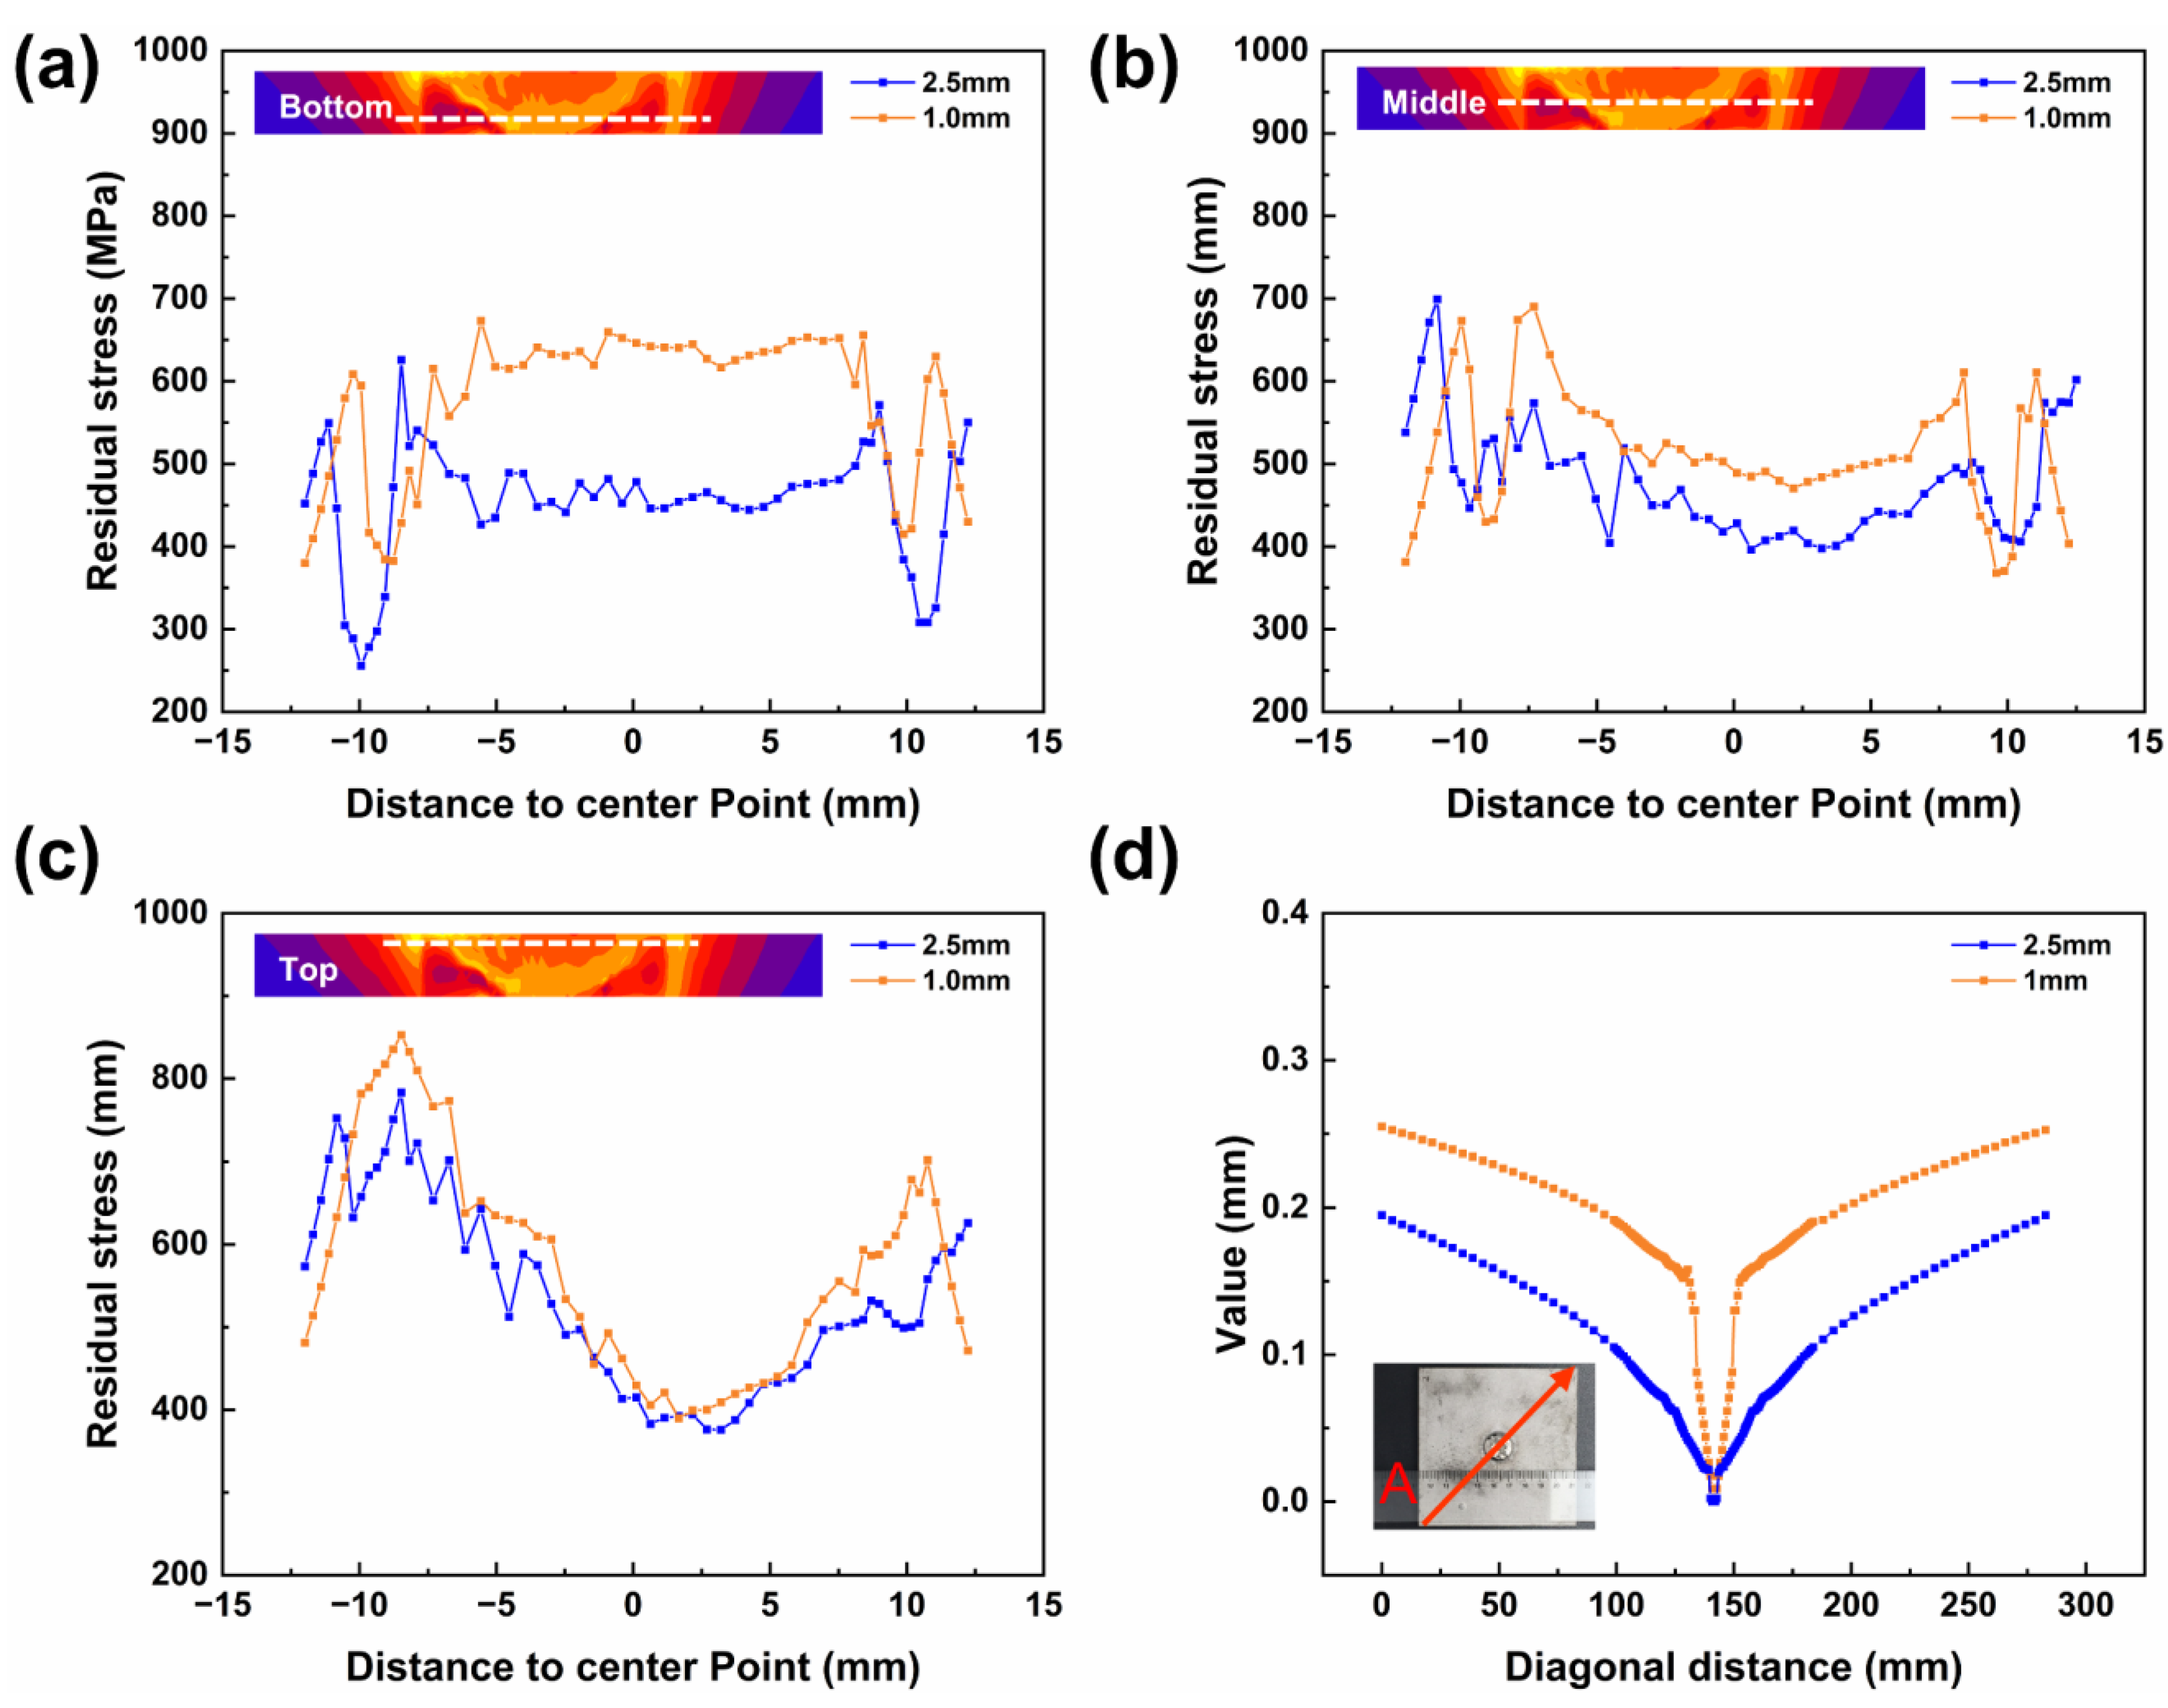
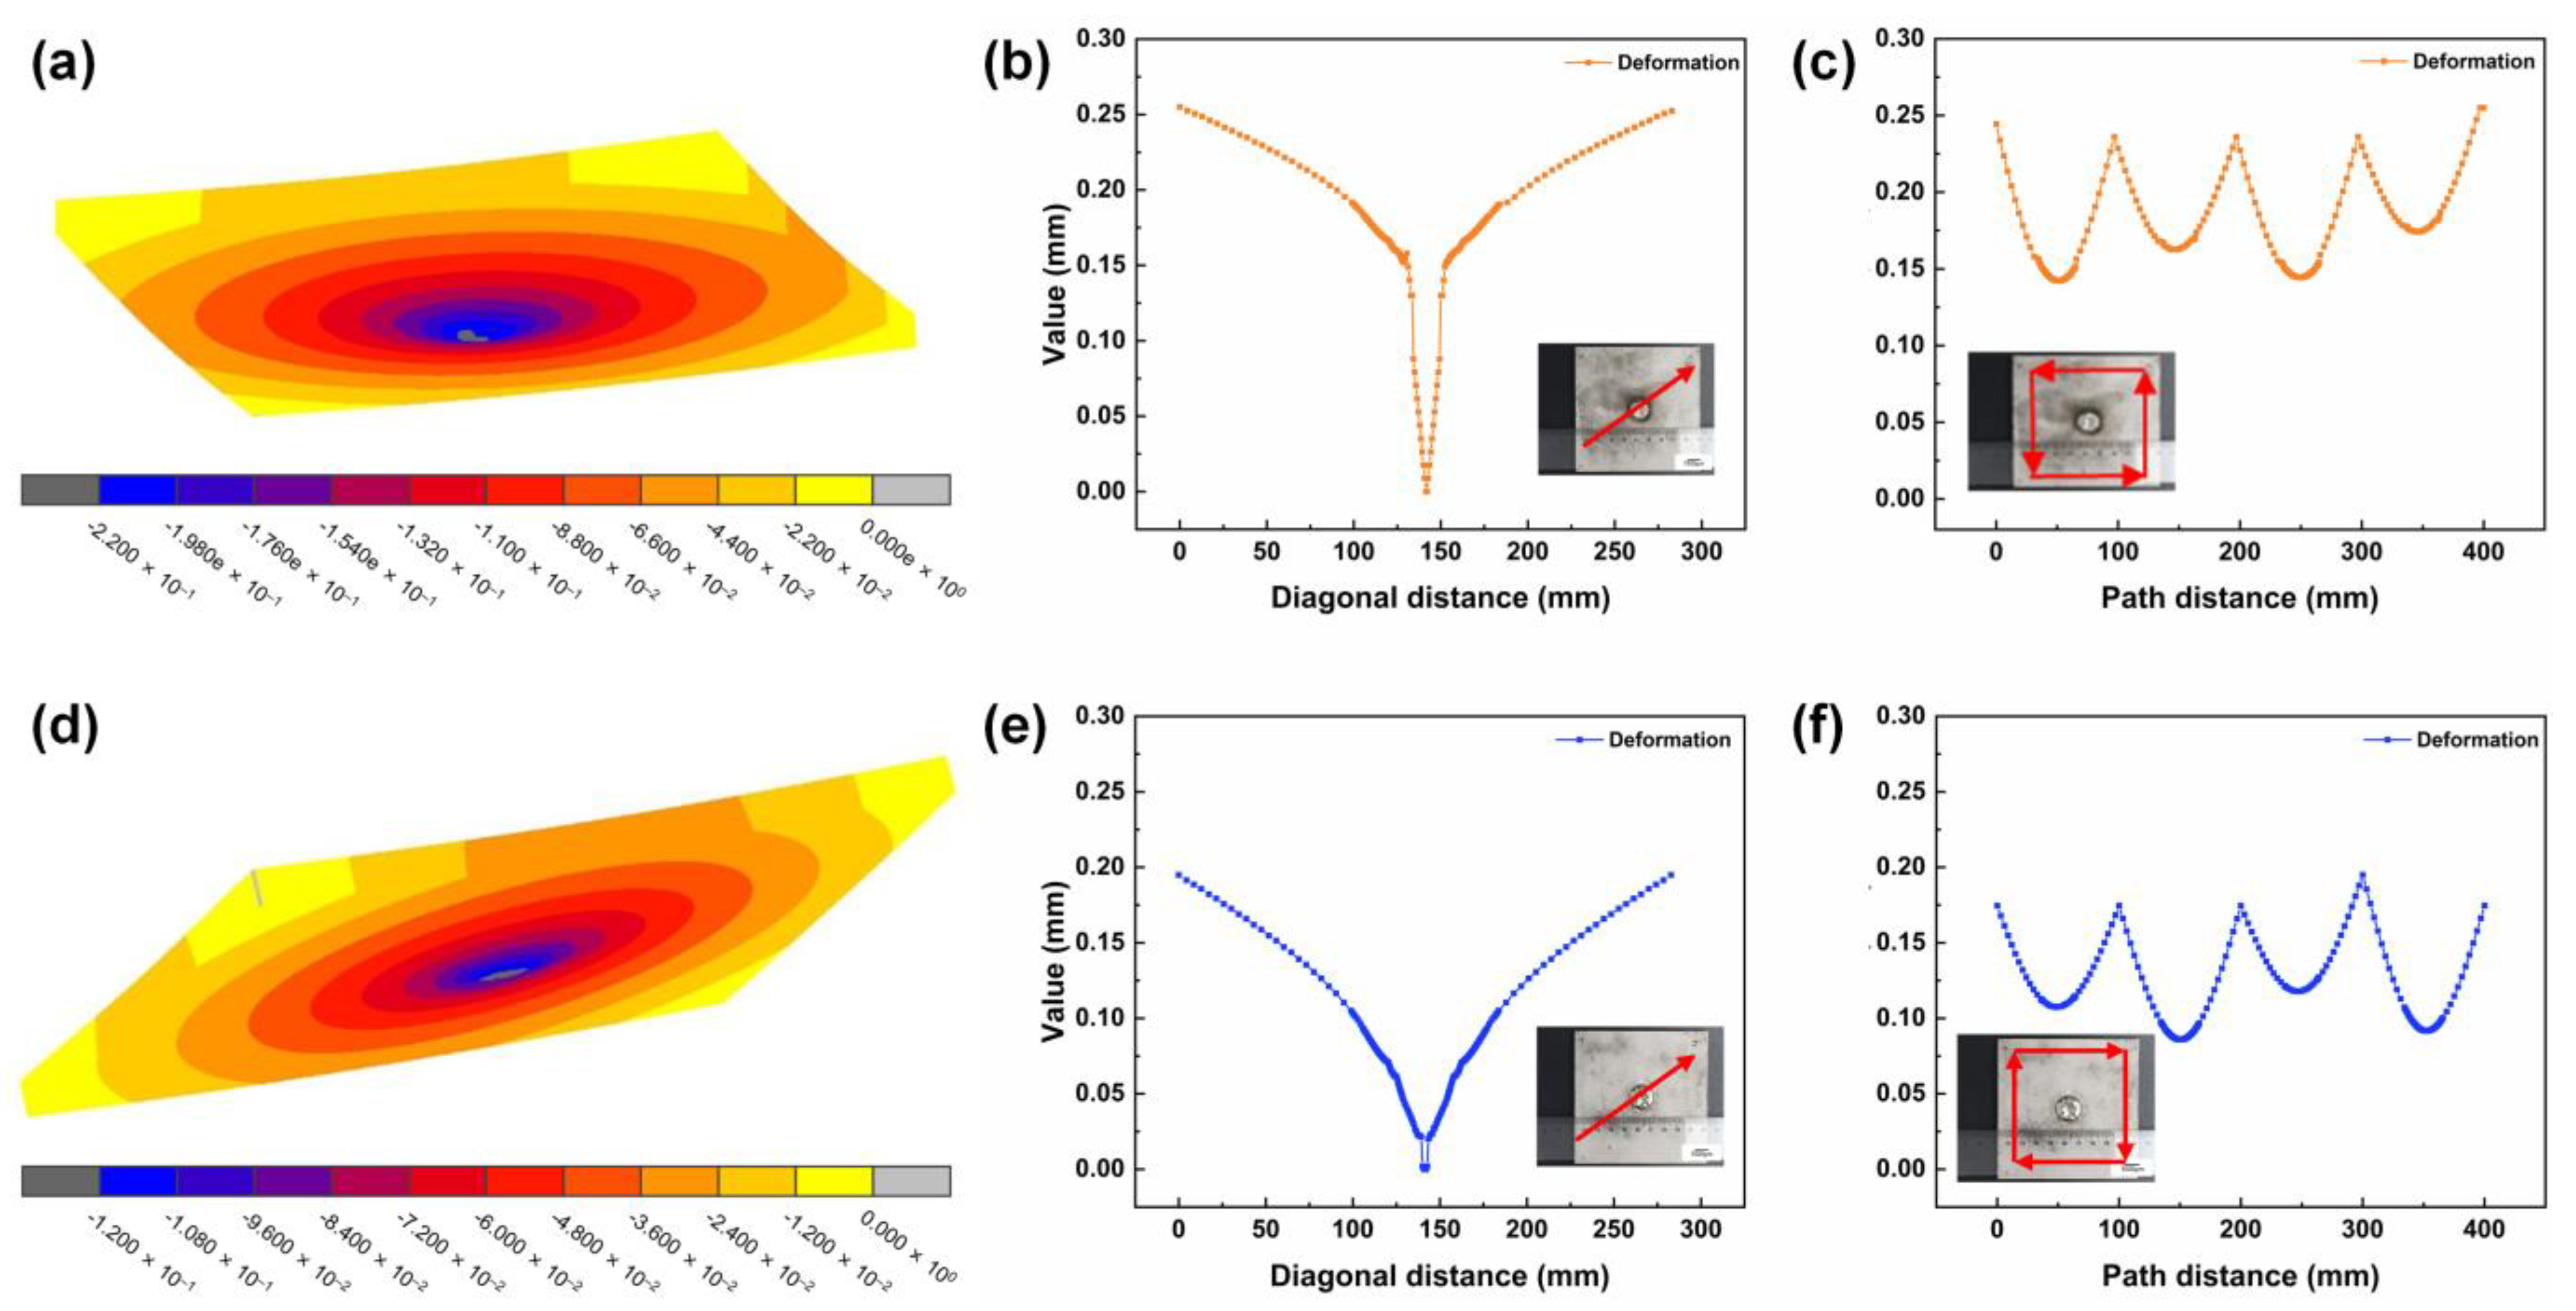
  • The numerical simulation results showed that more repaired layers would result in larger residual stress and repaired deformation. It was found that the von Mises and repairing deformation were 872.6 MPa and 0.20 mm when repaired layers were three while they increased to 911 MPa and 0.26 mm when repaired layers were five.
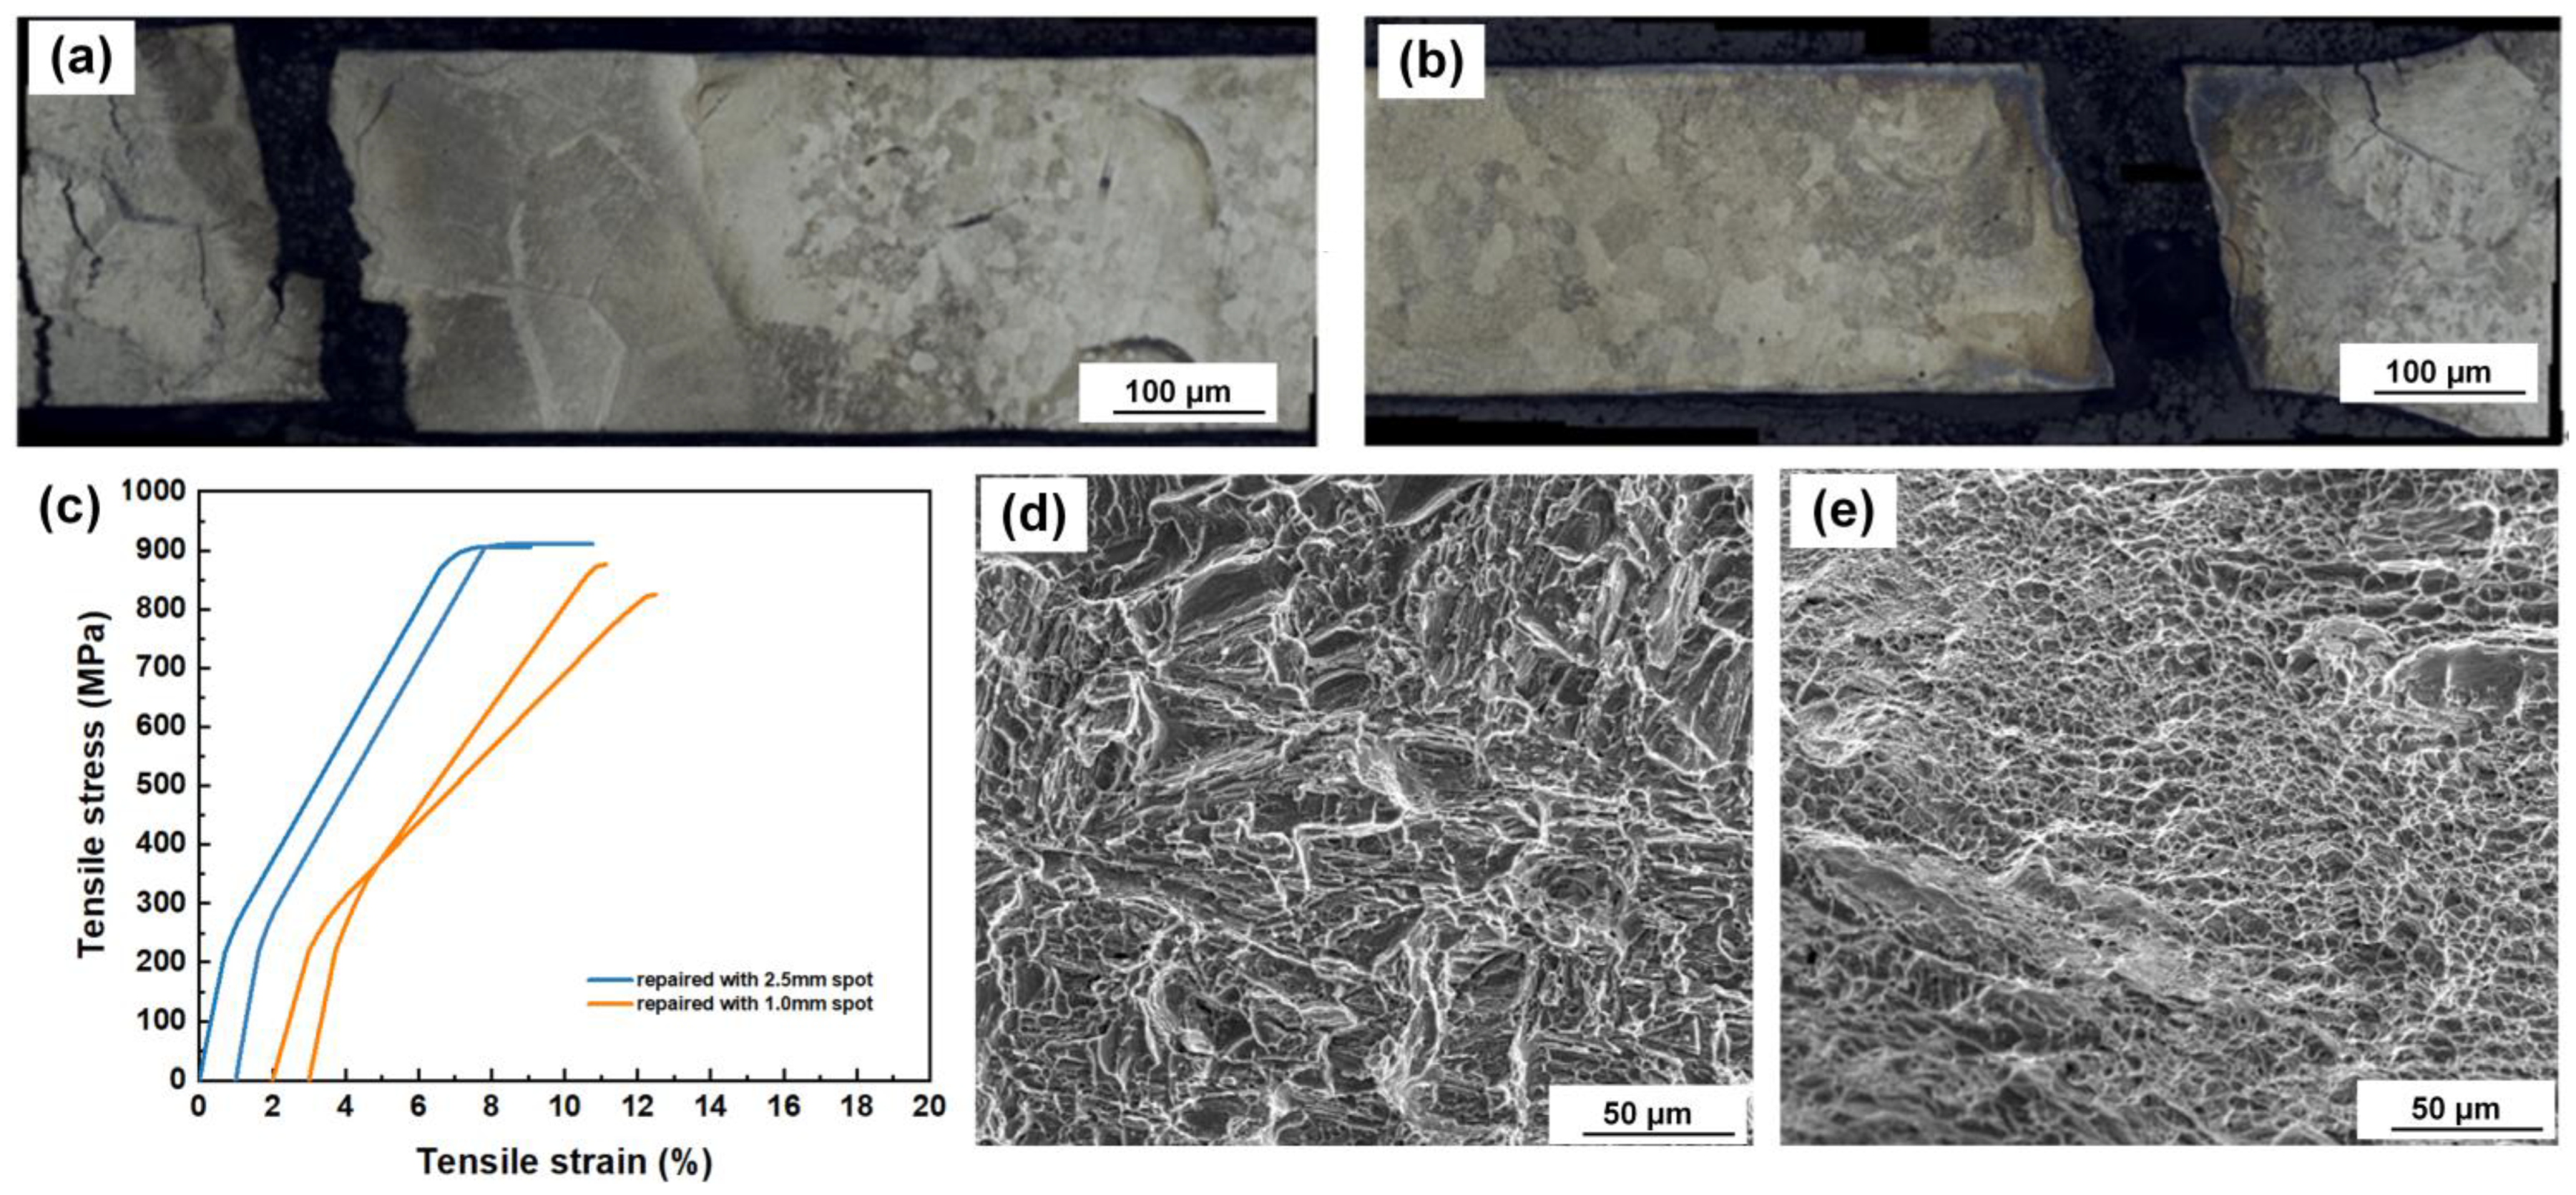
  • With the enhancement of repaired layers, a wider HZA was produced. The microstructures from the TC4 matrix to the repaired area transited from lamellar α phase + intercrystalline β phase—basketweave structure—martensite structure—widmannstatten structure.
  • Tensile tests for these two samples showed that ductile fractured models occurred when repaired layers were three and five layers. A higher tensile strength of 910.5 MPa was obtained when repaired layers were three, which resulted from lower residual stress and deformation.

Author Contributions

Conceptualization, L.L.; Methodology, Y.H.; Software, Y.H.; Validation, P.G.; Investigation, X.Q. and P.G.; Resources, J.Z.; Data curation, J.Z.; Writing—original draft, X.Q.; Writing—review and editing, L.L.; Funding acquisition, L.L. and J.Z. All authors have read and agreed to the published version of the manuscript.

Funding

This research received no external funding.

Data Availability Statement

The research data is unavailable generated and analyzed during the current study are unavailable since this project was still in process.

Acknowledgments

The authors would like to acknowledge the financial support of the National Natural Science Foundation of China.

Conflicts of Interest

The authors declare no conflict of interest.

References

  1. Liu, Z.; He, B.; Lyu, T.; Zou, Y. A Review on Additive Manufacturing of Titanium Alloys for Aerospace Applications: Directed Energy Deposition and Beyond Ti-6Al-4V. JOM 2021, 73, 1804–1818. [Google Scholar] [CrossRef]
  2. Huang, R.; Riddle, M.; Graziano, D.; Warren, J.; Das, S.; Nimbalkar, S.; Cresko, J.; Masanet, E. Energy and Emissions Saving Potential of Additive Manufacturing: The Case of Lightweight Aircraft Components. J. Clean. Prod. 2016, 135, 1559–1570. [Google Scholar] [CrossRef] [Green Version]
  3. Xia, H.; Li, L.; Tan, C.; Yang, J.; Li, H.; Song, W.; Zhang, K.; Wang, Q.; Ma, N. In Situ SEM Study on Tensile Fractured Behavior of Al/Steel Laser Welding-Brazing Interface. Mater. Des. 2022, 224, 111320. [Google Scholar] [CrossRef]
  4. Boyer, R.R. An Overview on the Use of Titanium in the Aerospace Industry. Mater. Sci. Eng. A 1996, 213, 103–114. [Google Scholar] [CrossRef]
  5. Dutta, B.; Froes, F.S. The Additive Manufacturing (AM) of Titanium Alloys. Met. Powder Rep. 2017, 72, 96–106. [Google Scholar] [CrossRef]
  6. Liu, Q.; Wang, Y.; Zheng, H.; Tang, K.; Li, H.; Gong, S. TC17 Titanium Alloy Laser Melting Deposition Repair Process and Properties. Opt. Laser Technol. 2016, 82, 1–9. [Google Scholar] [CrossRef]
  7. Zhuang, Z.; Jing, C.; Hua, T.; Xiaolin, Z.; Weidong, H. Microstructure and Mechanical Properties of Laser Repaired TC4 Titanium Alloy. Rare Met. Mater. Eng. 2017, 46, 1792–1797. [Google Scholar] [CrossRef] [Green Version]
  8. Liu, L.; Du, X.; Zhu, M.; Chen, G. Research on the Microstructure and Properties of Weld Repairs in TA15 Titanium Alloy. Mater. Sci. Eng. A 2007, 445–446, 691–696. [Google Scholar] [CrossRef]
  9. Yan, L.; Chen, Y.; Liou, F. Additive Manufacturing of Functionally Graded Metallic Materials Using Laser Metal Deposition. Addit. Manuf. 2020, 31, 100901. [Google Scholar] [CrossRef]
  10. Saboori, A.; Aversa, A.; Marchese, G.; Biamino, S.; Lombardi, M.; Fino, P. Application of Directed Energy Deposition-Based Additive Manufacturing in Repair. Appl. Sci. 2019, 9, 3316. [Google Scholar] [CrossRef] [Green Version]
  11. Ünal-Saewe, T.; Gahn, L.; Kittel, J.; Gasser, A.; Schleifenbaum, J.H. Process Development for Tip Repair of Complex Shaped Turbine Blades with IN718. Procedia Manuf. 2020, 47, 1050–1057. [Google Scholar] [CrossRef]
  12. Ren, Y.M.; Lin, X.; Fu, X.; Tan, H.; Chen, J.; Huang, W.D. Microstructure and Deformation Behavior of Ti-6Al-4V Alloy by High-Power Laser Solid Forming. Acta Mater. 2017, 132, 82–95. [Google Scholar] [CrossRef]
  13. Wang, W.; Wang, M.; Jie, Z.; Sun, F.; Huang, D. Research on the Microstructure and Wear Resistance of Titanium Alloy Structural Members Repaired by Laser Cladding. Opt. Lasers Eng. 2008, 46, 810–816. [Google Scholar] [CrossRef]
  14. Yang, Y.-P.; Babu, S.S. An Integrated Model to Simulate Laser Cladding Manufacturing Process for Engine Repair Applications. Weld World 2010, 54, R298–R307. [Google Scholar] [CrossRef]
  15. Azarniya, A.; Colera, X.G.; Mirzaali, M.J.; Sovizi, S.; Bartolomeu, F.; Wits, W.W.; Yap, C.Y.; Ahn, J.; Miranda, G.; Silva, F.; et al. Additive Manufacturing of Ti–6Al–4V Parts through Laser Metal Deposition (LMD): Process, Microstructure, and Mechanical Properties. J. Alloys Compd. 2019, 804, 163–191. [Google Scholar] [CrossRef]
  16. Liu, S.; Shin, Y.C. Additive Manufacturing of Ti6Al4V Alloy: A Review. Mater. Des. 2019, 164, 107552. [Google Scholar] [CrossRef]
  17. Wu, X.; Liang, J.; Mei, J.; Mitchell, C.; Goodwin, P.S.; Voice, W. Microstructures of Laser-Deposited Ti–6Al–4V. Mater. Des. 2004, 25, 137–144. [Google Scholar] [CrossRef]
  18. Shipley, H.; McDonnell, D.; Culleton, M.; Coull, R.; Lupoi, R.; O’Donnell, G.; Trimble, D. Optimisation of Process Parameters to Address Fundamental Challenges during Selective Laser Melting of Ti-6Al-4V: A Review. Int. J. Mach. Tools Manuf. 2018, 128, 1–20. [Google Scholar] [CrossRef]
  19. Zhao, H.; Yu, C.; Liu, Z.; Liu, C.; Zhan, Y. A Novel Finite Element Method for Simulating Residual Stress of TC4 Alloy Produced by Laser Additive Manufacturing. Opt. Laser Technol. 2023, 157, 108765. [Google Scholar] [CrossRef]
  20. Goldak, J.; Chakravarti, A.; Bibby, M. A New Finite Element Model for Welding Heat Sources. Metall. Trans. B 1984, 15, 299–305. [Google Scholar] [CrossRef]
  21. Lin, C.-M. Parameter Optimization of Laser Cladding Process and Resulting Microstructure for the Repair of Tenon on Steam Turbine Blade. Vacuum 2015, 115, 117–123. [Google Scholar] [CrossRef]
  22. Liu, S.; Liu, J.; Chen, J.; Liu, X. Influence of Surface Tension on the Molten Pool Morphology in Laser Melting. Int. J. Therm. Sci. 2019, 146, 106075. [Google Scholar] [CrossRef]
  23. Fang, J.X.; Dong, S.Y.; Li, S.B.; Wang, Y.J.; Xu, B.S.; Li, J.; Liu, B.; Jiang, Y.L. Direct Laser Deposition as Repair Technology for a Low Transformation Temperature Alloy: Microstructure, Residual Stress, and Properties. Mater. Sci. Eng. A 2019, 748, 119–127. [Google Scholar] [CrossRef]
  24. Paydas, H.; Mertens, A.; Carrus, R.; Lecomte-Beckers, J.; Tchuindjang, J.T. Laser Cladding as Repair Technology for Ti–6Al–4V Alloy: Influence of Building Strategy on Microstructure and Hardness. Mater. Des. 2015, 85, 497–510. [Google Scholar] [CrossRef]
  25. Kelly, S.M. Thermal and Microstructure Modeling of Metal Deposition Processes with Application to Ti-6Al-4V; Virginia Tech: Blacksburg, VA, USA, 2004. [Google Scholar]
  26. Cottam, R.; Brandt, M. Laser Cladding of Ti-6Al-4 V Powder on Ti-6Al-4 V Substrate: Effect of Laser Cladding Parameters on Microstructure. Phys. Procedia 2011, 12, 323–329. [Google Scholar] [CrossRef] [Green Version]
  27. Wang, Y.; Ma, H.; Zhang, Y. Effect of the Notch Depth on Fracture Behavior of TC4 Titanium Alloy Sheets. Eng. Fract. Mech. 2023, 277, 108947. [Google Scholar] [CrossRef]
Figure 1. Microstructure for TC4 matrix and repairing powder: (a) TC4 matrix, (b) TC4 powder.
Crystals 13 00438 g001
Figure 2. Experimental process: (a) Laser-repairing system, (b) Laser-repairing process, (c) Repaired dimension for hole.
Crystals 13 00438 g002
Figure 3. Repairing needed for TC4 and repairing paths: (a) Hole in TC4 matrix, (b) Laser-repairing paths.
Crystals 13 00438 g003
Figure 4. Repairing formation under different repairing paths: (a,d) Sequential, (b,e) Annular, (c,f) Sequential + outer annular.
Crystals 13 00438 g004
Figure 5. Dimension for the tensile test.
Crystals 13 00438 g005
Figure 6. Developed model for numerical simulation, the colors indicate different repairing paths: (a) Repaired paths for three layers, (b) Top view for developed model, (c) Repaired paths for five layers, (d) Top view for developed model.
Crystals 13 00438 g006
Figure 7. The formation features under different parameters with laser spot diameter of 1.0 mm: (a) Laser power and layer height, (b) Scanning speed and layer height, (c) Powder feeding rate and layer height, (d) Laser power and layer width, (e) Scanning speed and layer width, (f) Powder feeding rate and layer width.
Crystals 13 00438 g007
Figure 8. The formation features under different parameters with laser spot diameter of 2.5 mm: (a) Laser power and layer height, (b) Scanning speed and layer height, (c) Powder feeding rate and layer height, (d) Laser power and layer width, (e) Scanning speed and layer width, (f) Powder feeding rate and layer width.
Crystals 13 00438 g008
Figure 9. Comparison between numerical and experimental deformations.
Crystals 13 00438 g009
Figure 10. Von Mises stress distribution along different layers with focused diameter of 1.0 mm: (a) First layer, (b) Second layer, (c) Third layer, (d) Fourth layer, (e) Fifth layer, (f) Von Mises stress values, (g) Along vertical direction.
Crystals 13 00438 g010
Figure 11. Von Mises stress distribution along different layers with focused diameter of 2.5 mm: (a) First layer, (b) Second layer, (c) Third layer, (d) Von Mises stress values, (e) Along vertical direction.
Crystals 13 00438 g011
Figure 12. Comparison of residual stress and deflect deformation along different regions: (a) Bottom layer, (b) Middle layer, (c) Top layer, (d) Deflect deformation along Diagonal.
Crystals 13 00438 g012
Figure 13. Deflect deformation for the samples with different repaired layers: (ac) Deflect deformation contour, deflect deformation along diagonal, deflect deformation along edge distribution under 1.0 mm focus laser diameter, (df) Deflect deformation contour, deflect deformation along diagonal, deflect deformation along edge distribution under 2.5 mm focus laser diameter.
Crystals 13 00438 g013
Figure 14. Microstructure comparison for the samples under different repaired layers: (a) three repaired layers, (b) five repaired layers, (c) HAZ width under three repaired layers, (d) HAZ width under five repaired layers, (e) Basketweave microstructure at HAZ, (f) Pristine lamellar α phase and intercrystalline β phase at HAZ, (g) Cluster structures at HAZ, (h) Needle martensite at HAZ, (i) Columnar grain at repairing zone, (j) Widmannstatten structure at repairing zone, (k) Widmannstatten structure at bottom region, (l) Widmannstatten structure at middle region, (m) Widmannstatten structure at top region.
Crystals 13 00438 g014
Figure 15. Fractured behaviors for two samples: (a) Fractured location for the samples obtained under three repaired layers, (b) Fractured location for the samples under five repaired layers, (c) Tensile curves for two samples, (d) Quasi-cleavage fractured surface for sample obtained under three repaired layers, (e) Cleavage fractured surface for sample obtained under five repaired layers.
Crystals 13 00438 g015
Table 1. Nominal chemical compositions (wt%) for TC4.
ElementAlVFeCONHTi
TC46.1%4.05%0.30%0.01%0.02%0.03%0.005%Margin
Table 2. Detailed process parameters employed in this research.
Adopted Parameters2.5 mm Laser Diameter1.0 mm Laser Diameter
Laser power800 W1100 W
Scanning speed0.5 m/min0.6 m/min
Powder feeding speed9.0 L/min9.0 L/min
Defocused distance, mm+20+20
Flowing volume of protecting gas, L/min1515
Table 3. Thermal-mechanical properties for TC4 [19].
Temperature
(°C)
Specific Heat
(J · kg−1·°C−1)
Thermal
Conductivity
(W·m−1·°C−1)
Linear Expansion Coefficient
(10−6 °C−1)
Yong’s
Modulus
(GPa)
Yield Strength
(MPa)
Passion Rate
75549.675.148.90116.058200.32
85551.695.278.90115.797500.32
100555.575.528.93115.273400.32
200572.586.719.08112.661300.32
300589.627.999.26109.50900.32
500616.1110.099.59103.68660.33
800652.1013.0310.1094.57310.33
1000675.0714.8310.4088.60120.34
1200699.6816.5910.7082.5720.34
1500872.0919.5210.8074.270.10.35
Table 4. Repairing formation in single pass under laser spot diameter of 1.0 mm.
No.Laser PowerScanning SpeedPowder Feeding Rate Cladding Formation
1400 W0.9 m/min2 g/minCrystals 13 00438 i001
2600 W0.9 m/min3.5 g/minCrystals 13 00438 i002
3700 W0.9 m/min3.5 g/minCrystals 13 00438 i003
4800 W0.9 m/min3.5 g/minCrystals 13 00438 i004
5900 W0.9 m/min3.5 g/minCrystals 13 00438 i005
6900 W1.2 m/min3.5 g/minCrystals 13 00438 i006
Table 5. Repairing formation in single pass under laser spot diameter of 2.5 mm.
No.Laser PowerScanning SpeedPowder Feeding Rate Cladding Formation
1700 W1.2 m/min5 g/minCrystals 13 00438 i007
2700 W0.6 m/min2.5 g/minCrystals 13 00438 i008
3700 W0.6 m/min5 g/minCrystals 13 00438 i009
4900 W0.6 m/min5 g/minCrystals 13 00438 i010
51000 W0.6 m/min5 g/minCrystals 13 00438 i011
61100 W0.6 m/min5 g/minCrystals 13 00438 i012
71200 W0.6 m/min5 g/minCrystals 13 00438 i013
Table 6. Selected optimized repairing parameters in single pass under laser spot diameters of 1.0 and 2.5 mm.
NO.Laser PowerScanning SpeedPowder Feeding RateDiameter of Laser SpotDefocused
Distance
Powder Feed Gas
(L/min)
Shield Gas
11100 W0.6 m/min5 g/min2.5 mm0.6 mm9 L/min15 L/min
2800 W0.9 m/min3.5 g/min1.0 mm0.4 mm9 L/min15 L/min
Disclaimer/Publisher’s Note: The statements, opinions and data contained in all publications are solely those of the individual author(s) and contributor(s) and not of MDPI and/or the editor(s). MDPI and/or the editor(s) disclaim responsibility for any injury to people or property resulting from any ideas, methods, instructions or products referred to in the content.

