Article

Plasma Electrolytic Oxidation Treatment of AZ31 Magnesium Alloy for Biomedical Applications: The Influence of Applied Current on Corrosion Resistance and Surface Characteristics

1
Department of Chemical Engineering, Materials and Industrial Production, University of Napoli Federico II, Piazzale Tecchio 80, 80125 Napoli, Italy
2
Institute for Polymers, Composites and Biomaterials, National Research Council, 80078 Pozzuoli, Italy
*
Author to whom correspondence should be addressed.
Crystals 2023, 13(3), 510; https://doi.org/10.3390/cryst13030510
Submission received: 21 February 2023 / Revised: 13 March 2023 / Accepted: 14 March 2023 / Published: 16 March 2023

Abstract

:
Magnesium alloys are an exciting challenge for the biomaterials field given their well-established biodegradability and biocompatibility. However, when exposed to biological fluids, their rapid degradation and hydrogen release are the main drawbacks for clinical applications. This work aimed to investigate the influence of the current density applied during the plasma electrolytic oxidation (PEO) treatment on the durability of an AZ31 magnesium alloy. In particular, specific interest was directed to the degradation rate undergone by the PEO coating, obtained under two different current density conditions, when exposed to Hank’s solution at 37 °C to simulate the physiological environment, employing the techniques of potentiodynamic polarization and electrochemical impedance spectroscopy. Experimental results highlighted that the plasma electrolytic oxidation technique resulted in an improvement in the corrosion resistance of the magnesium alloy in the test solution. The current density affected the morphology of the coating. In particular, the anodic oxide coating obtained by applying the highest current density showed a higher thickness and fewer but larger pores, while the lowest current density generated a thinner PEO coating characterized by several but smaller pores. Surprisingly, the best corrosion resistance has been exhibited by the anodic oxide coating grown at the highest current density.

1. Introduction

Magnesium (Mg) is a material suitable for all applications that require the temporary use of a medical device. The use of Mg alloys, which degrade inside the human body, avoids the need for a second surgery for their removal. In addition, the released magnesium ions have no allergic potential, do not cause distinct inflammatory reactions [1], and are removed by phagocytosis [2]. Currently, the use of materials based on Mg and its alloys in the biomedical sector is already widely practiced for the realization of cardiovascular stents and bone implants thanks to their good biocompatibility [3,4]. However, the main drawbacks of the clinical use of magnesium-based alloys are their fast corrosion, hydrogen release, and the increase in the alkalinity of body fluid during the degradation process. Therefore, great interest is directed to the control of the degradation rate of Mg alloys including through the application of bio-inspired [5] or biodegradable polymeric coatings [6,7] or an oxide layer obtained by electrochemical treatments [8]. In addition to the increased corrosion resistance, Plasma electrolytic oxidation (PEO) treatment, also known as micro-arc oxidation (MAO), is a flexible and environmental friendliness process [9]. Basically, it is an electrochemical treatment that, operating above the breakdown voltage, induces the formation of protective oxide coatings capable of increasing the corrosion resistance of the treated surface and, simultaneously, promoting cell adhesion and proliferation on the surface [10]. This treatment also has the advantage of being able to be applied for complex-shaped medical devices. Many publications have addressed the effect of electrolytes on the composition of the coating and resultant properties [11,12,13]. In particular, the current density plays a key role in electrochemical treatments. Zhuang et al. [14] coated AZ31 magnesium alloy with an oxide layer through PEO treatment in a phosphate-based electrolyte varying the current density from 5 to 20 A/dm2. Research showed that the best corrosion resistance is offered by the coating produced using a current density of 10 A/dm2. Lee et al. [15] produced PEO coatings on AZ31 magnesium alloy in an acid electrolyte containing K2ZrF6 applying three different current densities, 100, 150, and 200 mA/cm2. The best result in terms of corrosion resistance was obtained by applying 100 mA/cm2. Kajanek et al. [16] studied the influence of four different values of current density, 25 mA/cm2, 50 mA/cm2, 100 mA/cm2, and 150 mA/cm2, using a phosphate-based electrolyte to treat an AZ31 magnesium alloy. In this case, the higher corrosion resistance was exhibited by the PEO coating obtained by applying a current density of 50 mA/cm2. Conversely, Bala Srinivasan et al. [17] carried out PEO treatment on AM50 magnesium alloy by applying three current density values, 15 mA/cm2, 75 mA/cm2, and 150 mA/cm2. They found better electrochemical performance for the sample coated adopting the lowest current density. All the authors above mentioned performed the electrochemical characterization in a NaCl aqueous solution, which has a concentration higher than in the real biological environment. To the best of the authors’ knowledge, no investigations studied the influence of applying a different current density to obtain PEO coatings in silicate-based solutions, characterizing them in a simulated body environment and at body temperature. To rectify this, this work investigated the effect of the current density applied during the PEO coating treatments of a magnesium alloy on its degradation rate when it is in contact with a simulated body fluid to verify its potential use in biomedical applications.

2. Materials and Methods

AZ31 magnesium alloy sheets (50 mm × 20 mm × 3 mm), the composition of which is given in Table 1, were used as coupons. Sodium silicate and sodium hydroxide were purchased from Sigma-Aldrich (Sigma-Aldrich, Milan, Italy). The chemical composition of Hank’s solution, used as a fluid simulating the body environment, was 0.185 g/L CaCl2·2H2O, 0.09767 g/L MgSO4, 0.4 KCl g/L, 0.06 KH2PO4 g/L, 0.35 g/L NaHCO3, 8.0 g/L NaCl, 0.04788 g/L Na2HPO4, 1.0 g/L D-Glucose, without Phenol Red and sodium bicarbonate [18].

2.1. Preparation of the Substrate

The metallic samples were prepared by polishing with SiC paper from P240 to P1200 [19] to remove contamination layers and native oxides. Subsequently, the samples were ultrasonically cleaned in a bath of acetone and ethanol and finally dried in air. An insulating scotch tape was used to shield the samples leaving an exposed area of 1 cm2 to the electrolyte.

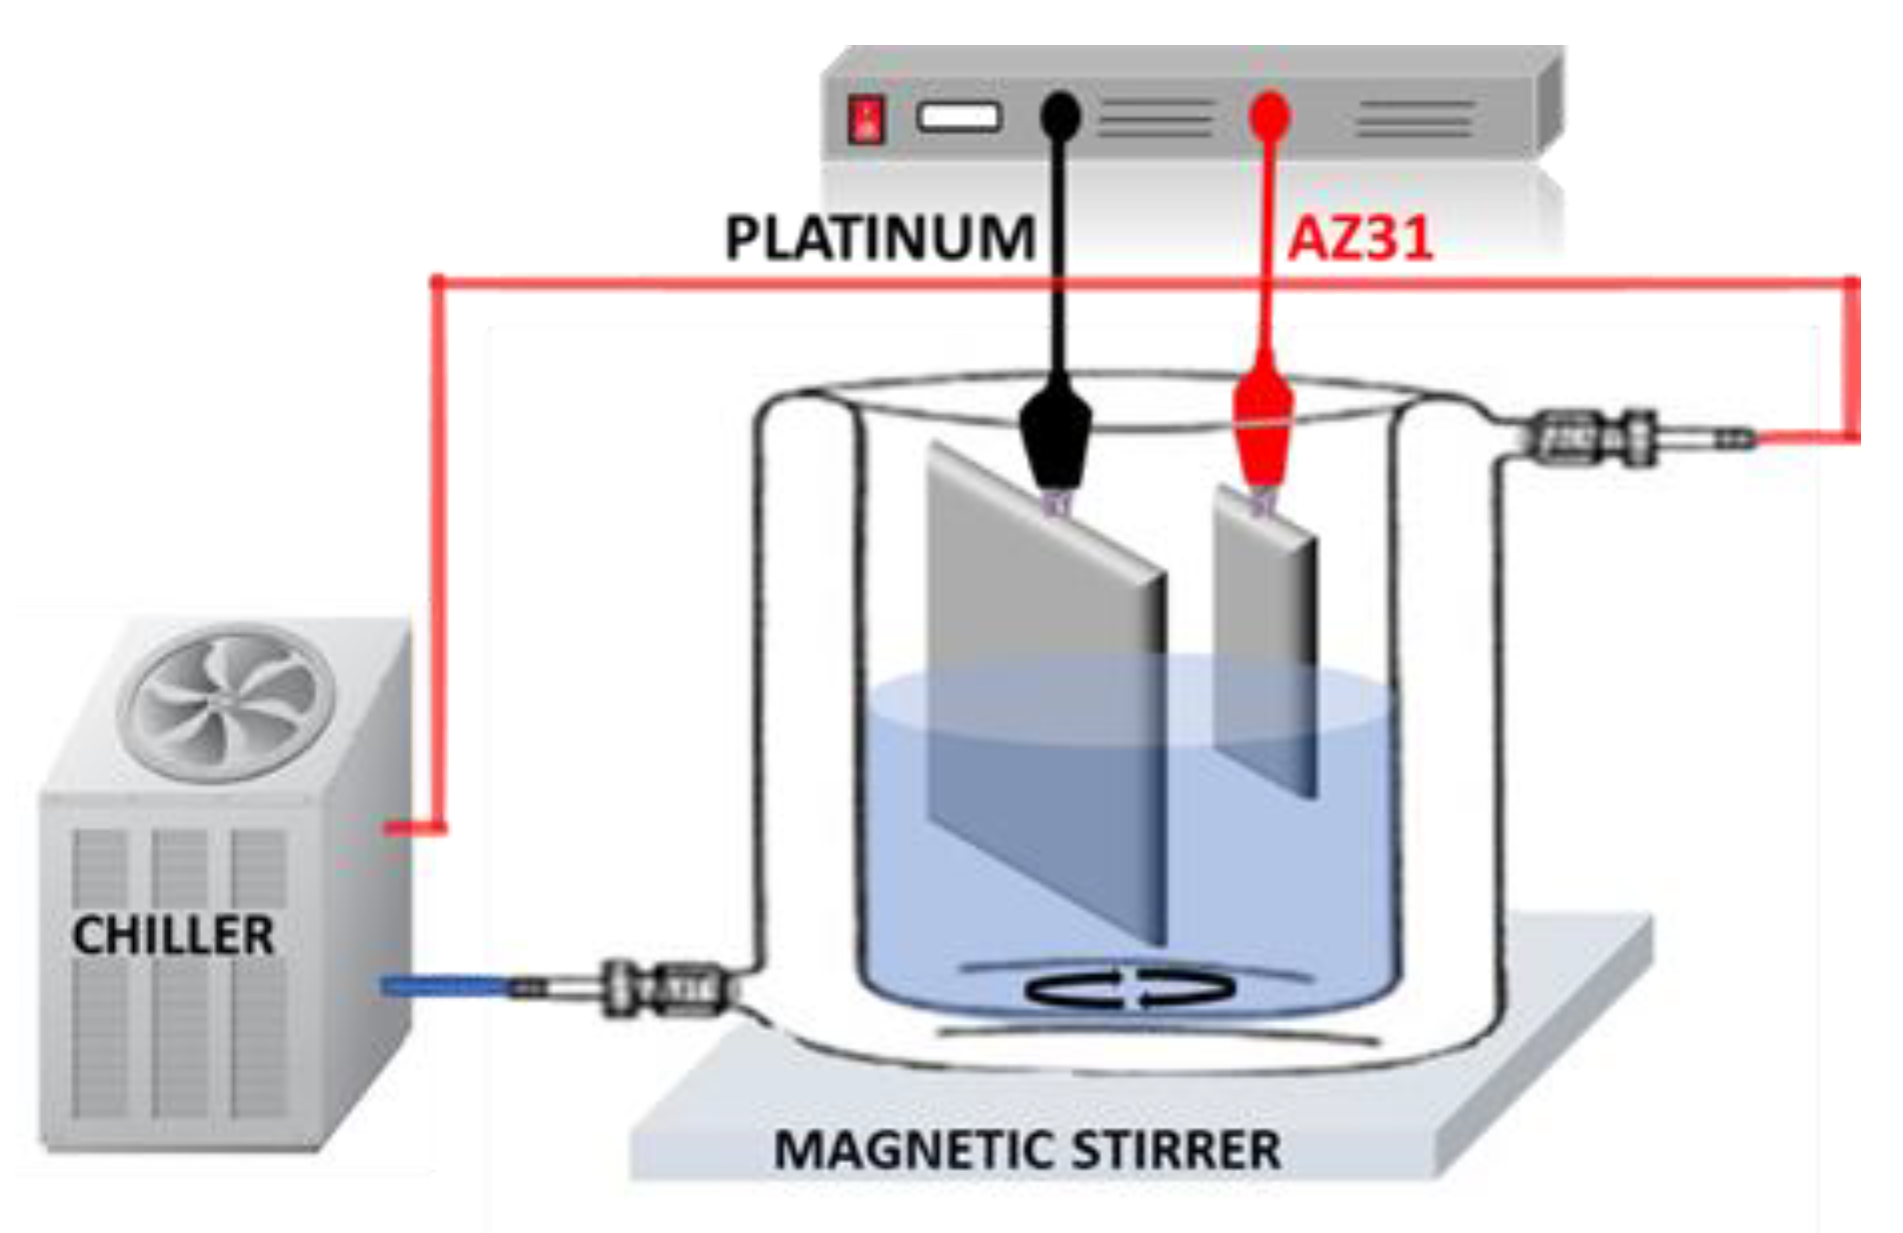
2.2. Plasma Electrolytic Oxidation

Plasma electrolytic oxidation was performed using the cell setup shown in Figure 1.
AZ31 alloy specimens and a platinum sheet were used as the anode and cathode, respectively, and connected to a power source (TDK-Lambda, Milan, Italy). A magnetic stirrer operating at 200 rpm continuously mixed the electrolytic solution during PEO treatment. A circulating system of cooling water was employed to keep the temperature at 18 °C. The PEO treatment was conducted by applying two current density values, i.e., 15 and 30 mA/cm2, for 20 min in an electrolytic solution consisting of 5 g/L Na2SiO3 and 2 g/L NaOH. This procedure ensures greater resistance to corrosion of the substrate than that obtained using a phosphate-based solution [20], at pH 12 and with an electrical conductivity of 20.3 mS/cm.
The abbreviations used to identify the samples are listed in Table 2.

2.3. Characterization Techniques

The morphological analysis of the surfaces of the magnesium alloy, bare and PEO coated, was performed using a field emission Scanning Electron Microscope (SEM, Mod. FEI QUANTA 200 F). The observations were collected by operating in a high vacuum, at the voltage of 20 kV, on previously metalized surfaces with a thin layer of a gold-palladium alloy to make them electrically conductive. The PEO coatings thickness was calculated non-destructively at 10 different points by an eddy current thickness instrument (DUALSCOPE® MP0R, Fisher, Milan, Italy), and the average value was reported. They were observed using a Confocal Laser Scanning Microscope (Olympus 5100, Milan, Italy). A structural analysis was performed by grazing incidence X-ray diffraction (GIXRD) measurements over the range of 2θ from 20° to 60° and a scan rate of 0.02°/min with the aid of a Panalytical X’Pert system. The electrochemical properties of samples were analyzed by potentiodynamic polarization and electrochemical impedance spectroscopy (EIS) by using Gamry Interface 1000 (Gamry Instruments, Warminster, PA, USA). The potentiodynamic polarization tests were performed in DC and were destructive characterizations, while the EIS measurements were performed in AC and were non-destructive techniques. The former is useful to determine the corrosion current density, while the latter allows the identification of possible electrochemical mechanisms driving the degradation process. The electrochemical tests were performed in Hank’s solution at 37 °C ± 0.5 °C employing a conventional three-electrode electrochemical cell, including a saturated calomel electrode (SCE) as a reference electrode, a platinum electrode as a counter electrode and the tested samples as the working electrode. The exposed area of samples was 1 cm2. Before measurements, the open circuit potential (OCP) was recorded for 10 min. The potentiodynamic polarization tests were performed starting from −0.3 V vs. OCP to a current density value of 102 mA/cm2 and applying a scanning rate of 0.166 mV/s. EIS analysis was conducted by imposing a sinusoidal potential of 10 mV in the frequency range of 50 kHz to 0.02 Hz. All measurements were performed three times to ensure the tests’ repeatability, and the mean values are reported.

3. Results and Discussion

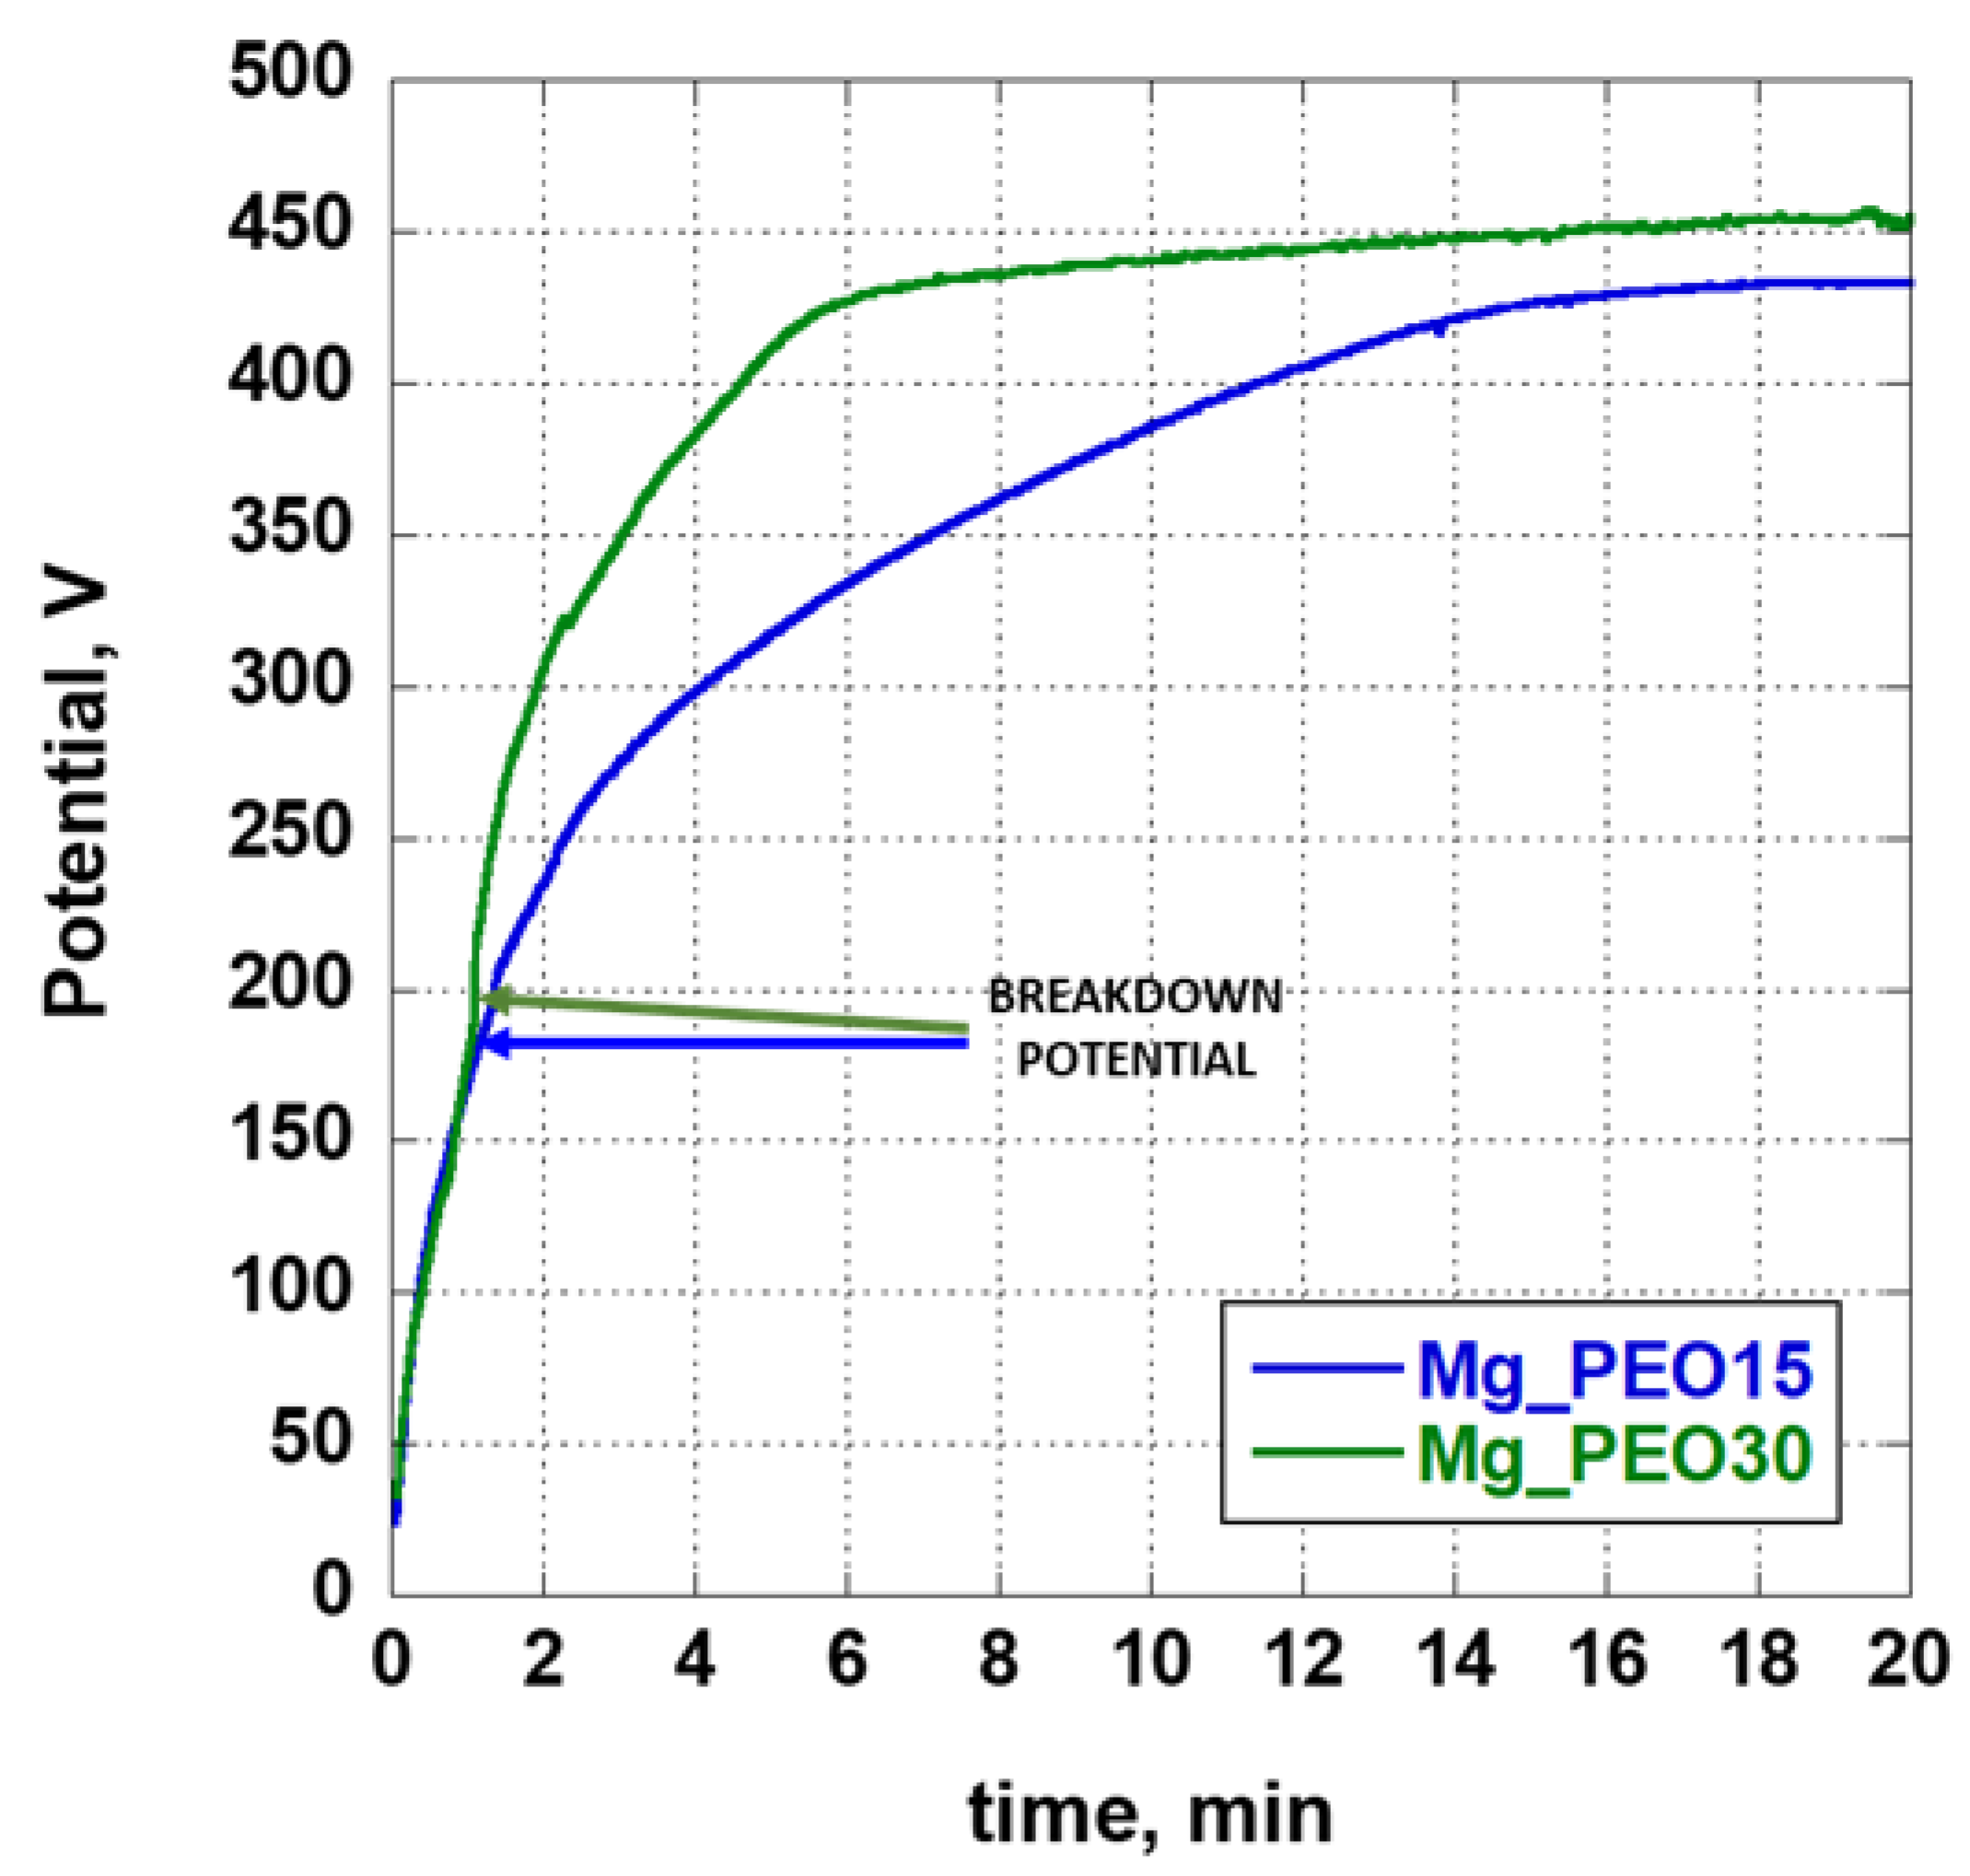
3.1. Potential-Time Curves

Studying the coating formation process and predicting its characteristics can be useful to record the variation in voltage during the PEO process [21]. The voltage-time curve recorded in this study is presented in Figure 2.
The potential–time responses during the PEO process, carried out in DC constant current mode, can be characterized by four steps [21]. In the first step, the voltage increases linearly with time, and the substrate’s dissolution is accompanied by the formation of a thin transparent passive barrier layer on the surface of AZ31 Mg alloy. In the second step, when the so-called breakdown potential is reached, many visible small white micro-sparks appear at the anodic site (Figure 3a). In the third stage, the size of micro-sparks gradually increases, becoming orange, and the spark density on the surface decreases significantly (Figure 3b). In the fourth stage, intense arc discharges appear partially destroy the oxide layer.
The breakdown potential was recorded at about 170 V, after less than 2 min for the Mg_PEO15 sample, and at about 200 V, after more than 2 min for the Mg_PEO30 sample. The change in the micro-sparks’ color, from light grey to orange, was recorded at 420 V, after 4 min, and after about 13 min for the Mg_PEO30 and Mg_PEO15 samples, respectively.
The PEO coating developed at a higher current density experienced a higher final voltage than that detected for the coating produced at a lower current density [11]. The final voltage of the coatings produced at the current density of 15 or 30 mA/cm2 was 430 and 450 V, respectively.
The trend in the curves indicates a different thickness of the surface coating. In particular, the higher breakdown potential value of the Mg_PEO30 sample could be expected to result in a thicker anodic oxide coating. Thus, the current density value plays an important role in the PEO treatment and results in differences in the oxide layer growth and morphology.

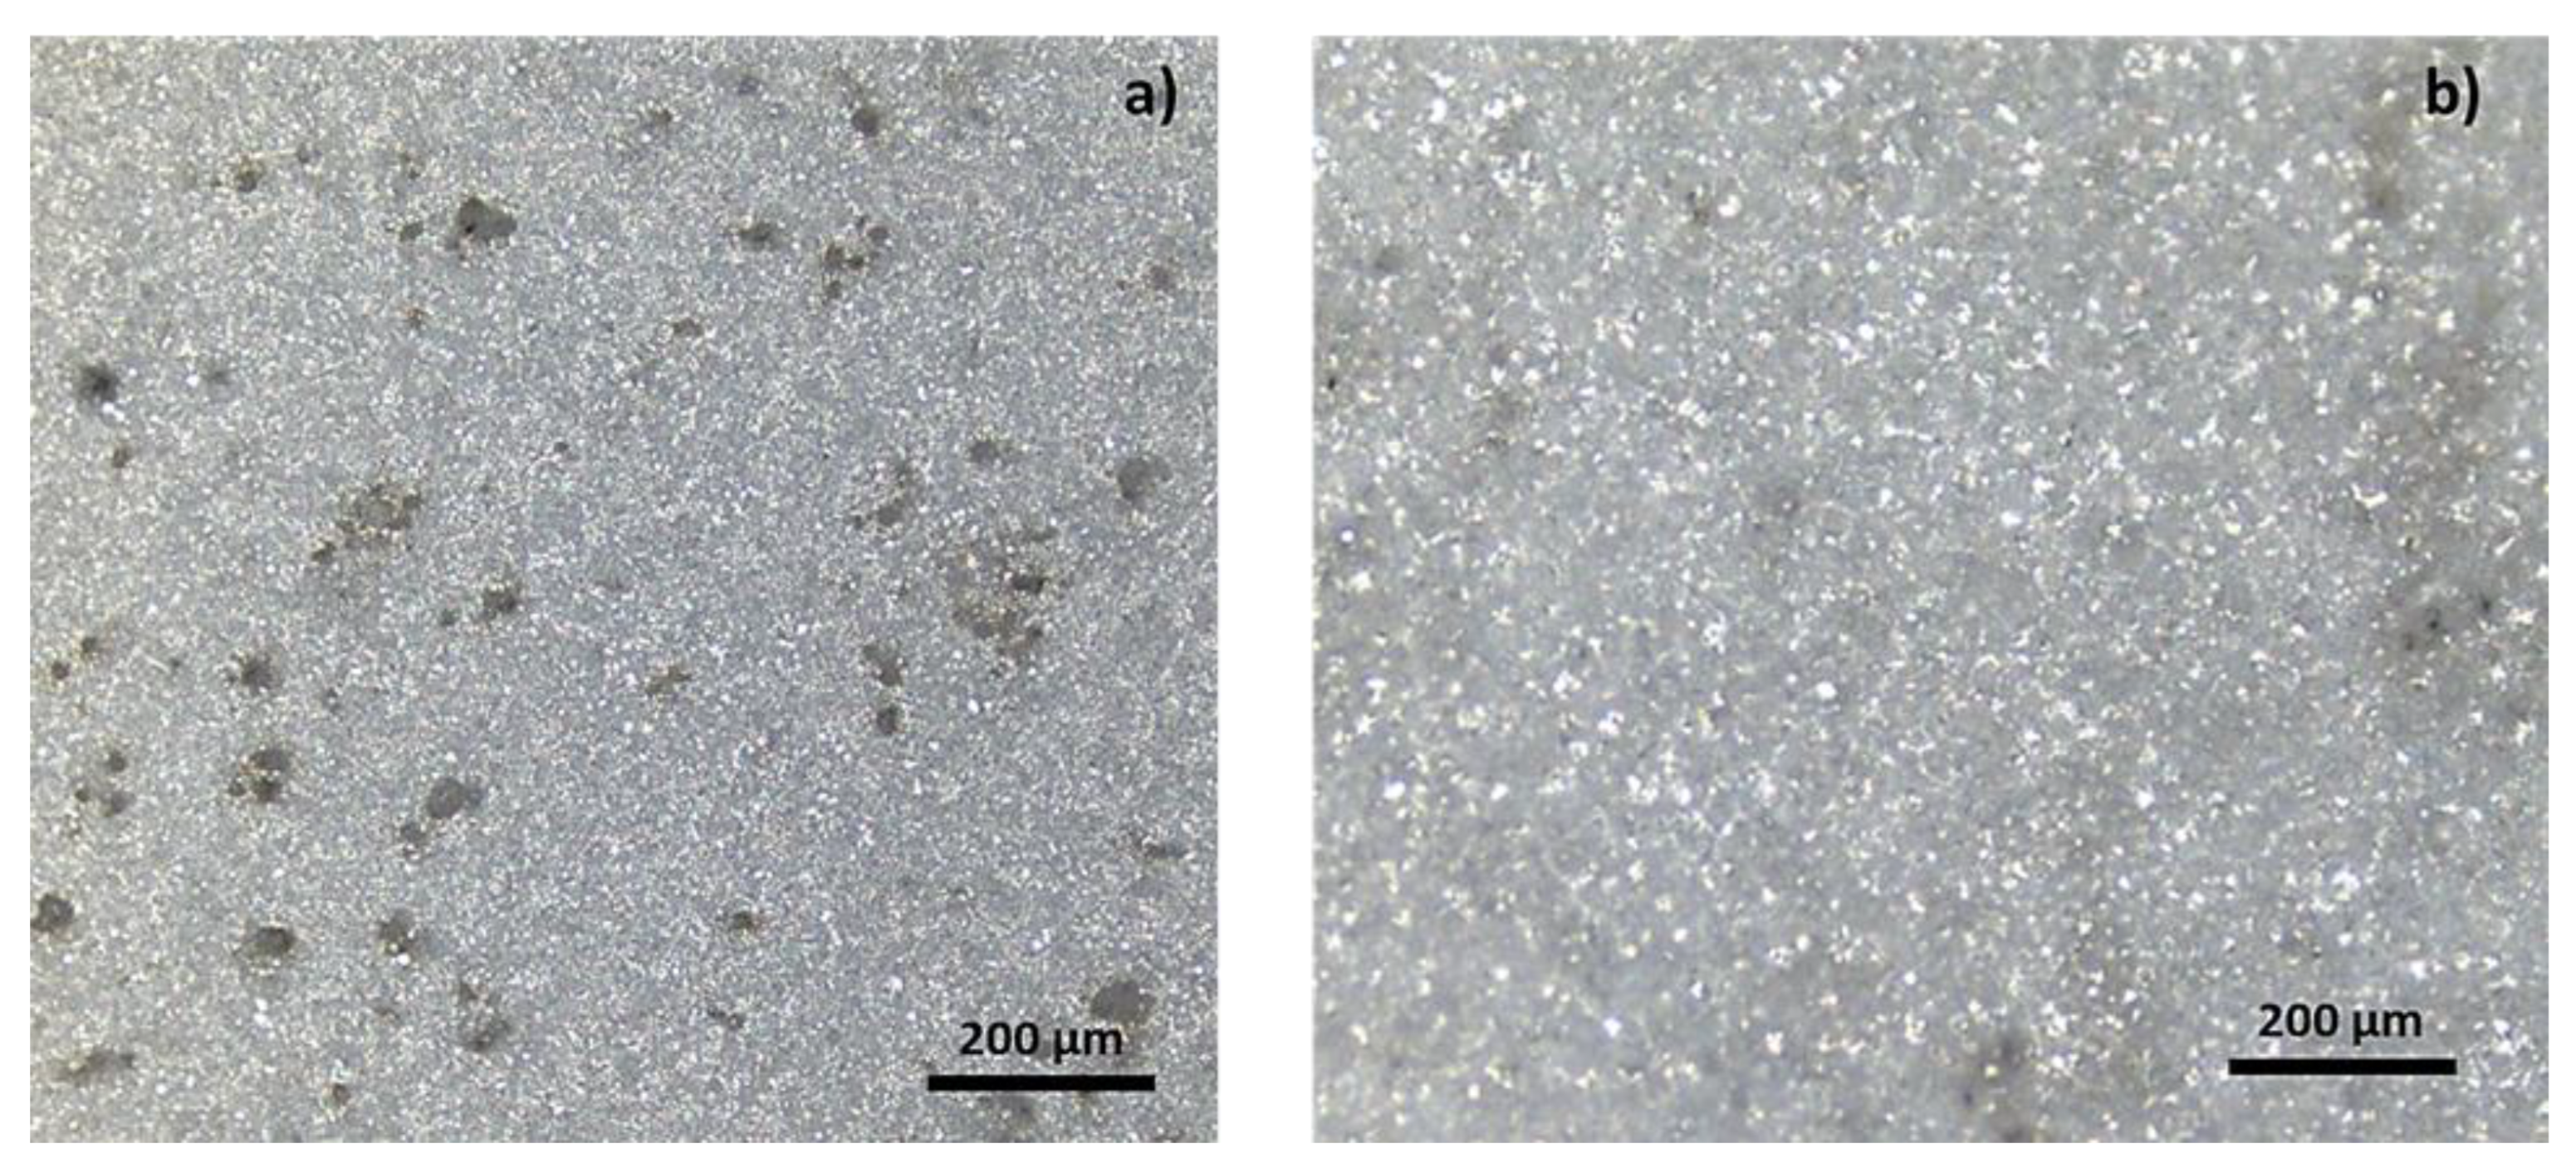
3.2. Morphological Analysis
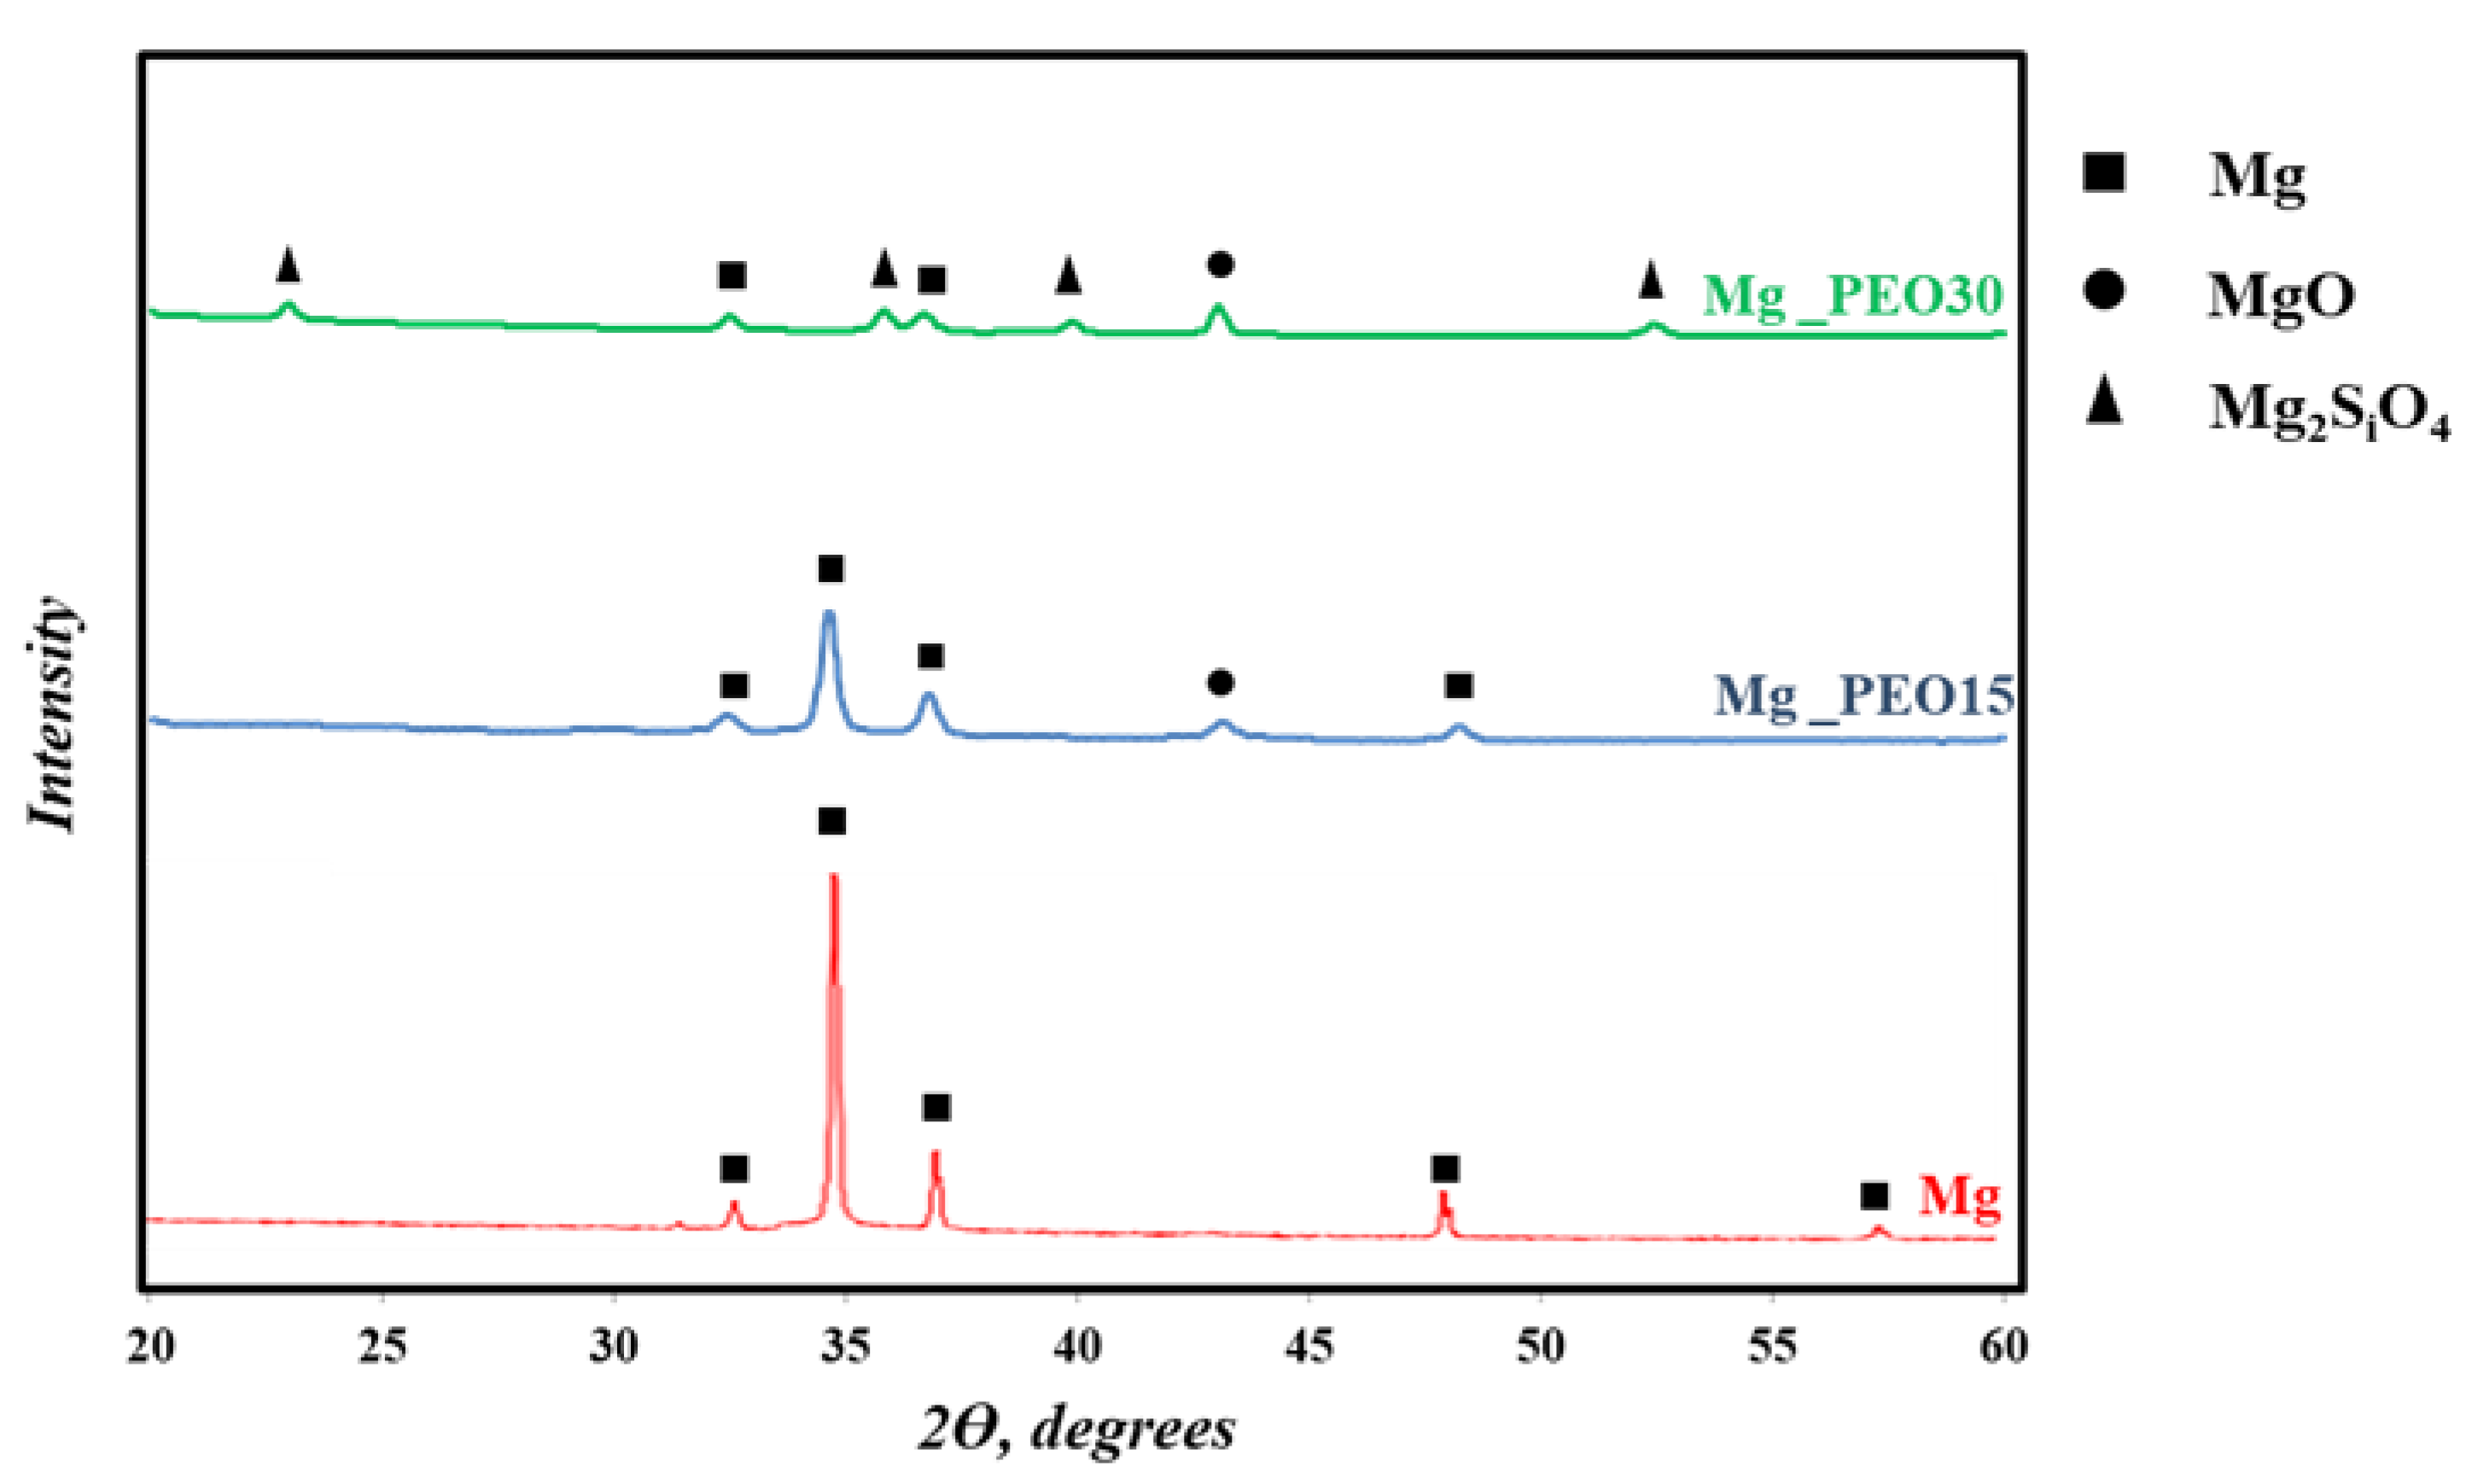
The morphological analysis was conducted on the magnesium alloy AZ31 samples before and after the PEO treatment through scanning electron microscope analysis. The results are reported in Figure 4.
All surfaces examined showed a “pancake-like” porous structure attributable to the emission of gas bubbles from the discharge channels during the deposition of the molten oxide. The presence of pores with different shapes and sizes, randomly distributed on each coated surface, is clearly seen. In particular, the Mg_PEO15 samples showed numerous pores much smaller than those presented by the Mg_PEO30 samples. The average pore size for the Mg_PEO15 samples was about 500 nm. While the Mg_PEO30 samples presented an average pore size of about 2 µm. The reduction in the number of pores as the current density increases can be easily explained by the pores tending to merge as they grow.
The different thicknesses of the coatings have been confirmed by experimental measurements. The results obtained were 6.1 ± 0.8 µm and 10.2 ± 1.5 µm for Mg_PEO15 and Mg_PEO30, respectively, in line with previous results [10,13]. A duration of 20 min means that the average growth rate values of the coatings formed at 15 mA/cm2 and 30 mA/cm2 were about 0.3 µm/min and 0.2 µm/min, respectively. Thus, a high current density leads to a high growth rate.
Hussein et al. [22] showed the structure of a PEO coating consisting of three layers: a porous outer layer, a dense middle layer, and a thin dense inner layer; while Zhang et al. [23] highlighted the different thicknesses of the individual layers depending on the applied current density. In light of these considerations, the coating obtained under the highest current density could be composed of a thicker inner dense layer than the coating grown by applying the lowest current density. The latter information can be deduced by the potential-time curve, in particular from the value of the breakdown potential. The higher the value of this parameter, the thicker the inner dense layer. In addition, the substrate’s dissolution can be shown from the cross-section images, shown in Figure 5, in which the interface between the substrate and the coating was wavy and jagged, as indicated by [10].

3.3. XRD Analysis

Figure 6 shows the GIXRD spectra of the PEO coatings. The Mg peaks are visible in both patterns, although they are more intense for the Mg_PEO15 samples (blue line). This result can be ascribed to the thickness of MG_PEO15, which is thinner than that of Mg_PEO30, and, therefore, probably more penetrable by X-rays, as also observed by [17,20].
Peaks attributed to the orthorhombic and insoluble Mg2SiO4 phase (JCPDS No. 85-1364) [22] due to the reaction between SiO32− ions from Na2SiO3 present in the electrolyte, and Mg2+ ions from the substrate, were identified only in the Mg_PEO30 samples, according to the reaction:
2 Mg2+ + SiO32− + 2 OH → Mg2SiO4 + H2O
Conversely, MgO phase (JCPDS No. 78-0430) formation was displayed by both samples, resulting from the dehydration of Mg (OH)2 due to the high temperature during the sparking discharge process [8].

3.4. Electrochemical Analysis

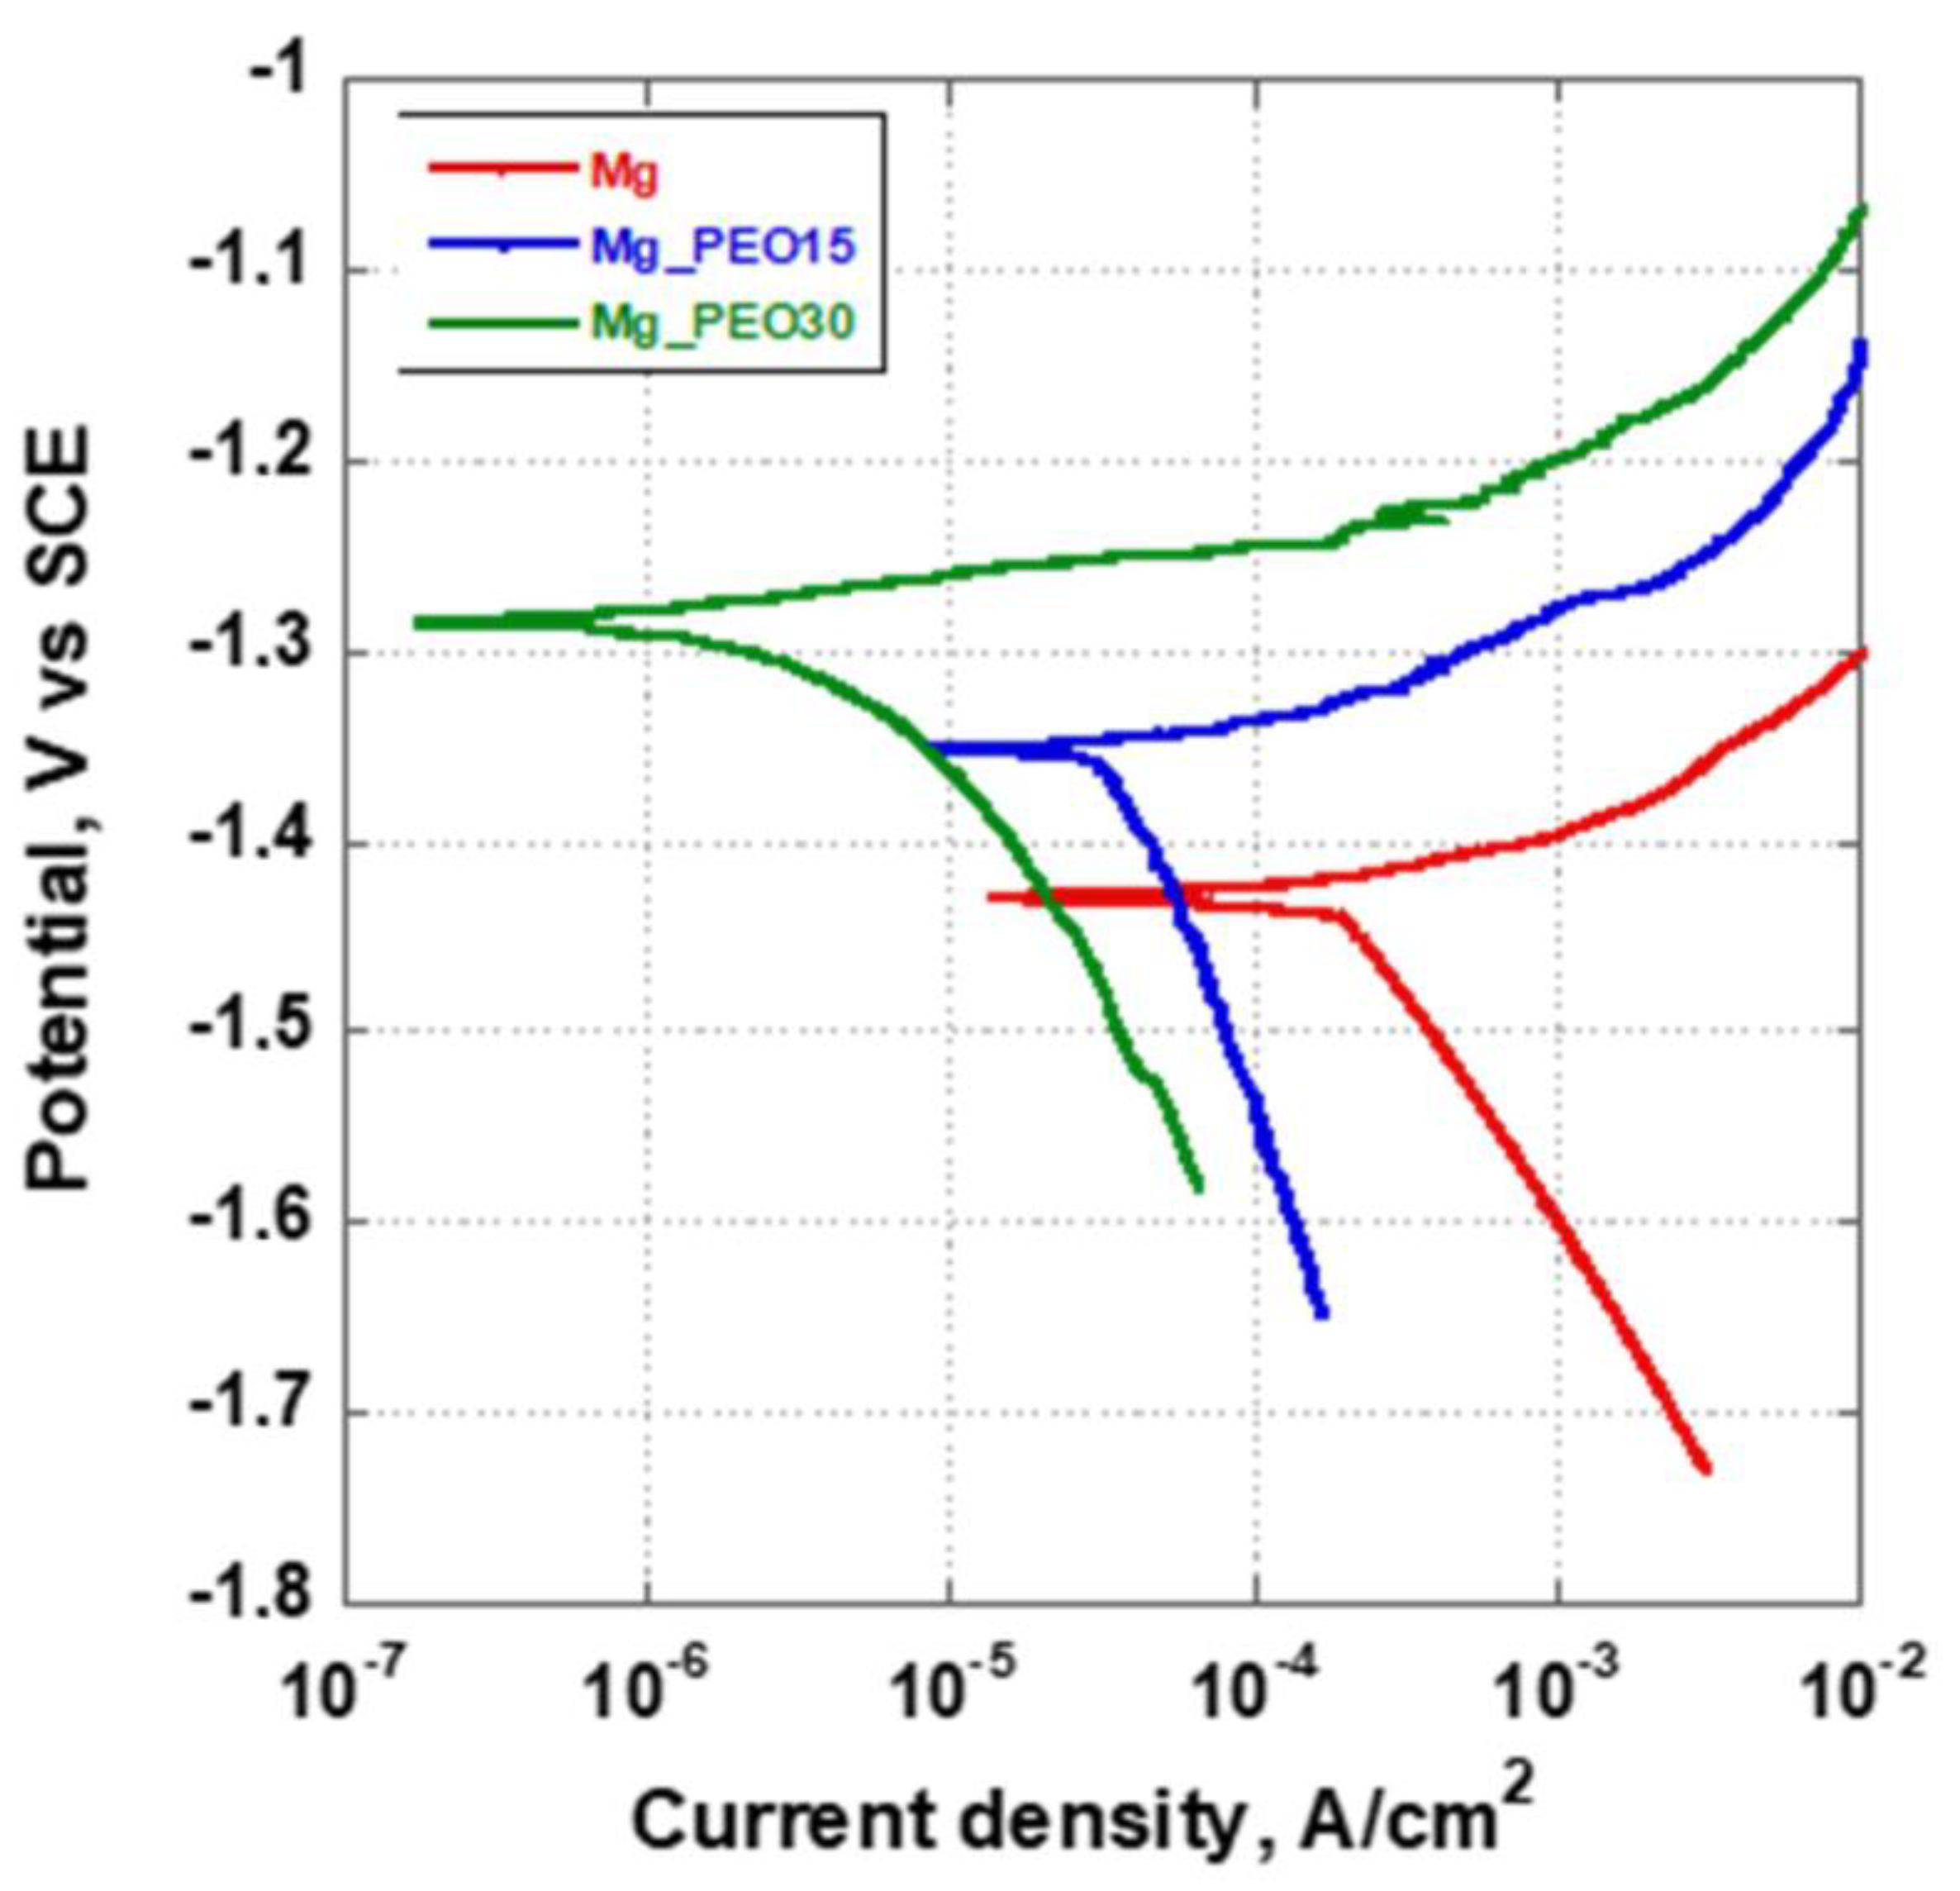
3.4.1. Potentiodynamic Polarization

The potentiodynamic polarization curves recorded in Hank’s solutions at the human body temperature are shown in Figure 7. This kind of test offers significant kinetic information and reveals the relative anodic and cathodic contributions [24]. Due to the pitting phenomena shown by the samples, Tafel’s approximation cannot be applied to evaluate the samples’ corrosion rate. Despite this, the value of the corrosion current of the samples can be estimated using the intersection of the potential corrosion value and the extrapolation of the cathodic branch of the potentiodynamic curve.
The corrosion potential, Ecorr, and the corrosion current density, icorr, values are reported in Table 3.
Usually, a positive corrosion potential, Ecorr, and a low corrosion current density, icorr, mean a lower corrosion rate and good anti-corrosion behavior. As expected [9], the bare metal shows a high corrosion rate, equal to 2 × 10⁻⁴ A/cm2. Conversely, for PEO-coated samples, the corrosion potential increased with the employed current density. For the Mg_PEO30 sample, the corrosion current density decreased by almost two orders of magnitude, suggesting a good corrosion protective property compared with the bare magnesium. In contrast with the literature [14,15], the coating formed at a higher current density (30 mA/cm2) showed the best corrosion resistance, recording the lowest current density of corrosion, although it is characterized by larger pore size and a thicker anodic oxide layer. The existence of an inner dense layer thicker than the samples treated with the lowest current density, as explained above, has probably allowed a better electrochemical response. In addition, the presence of Mg2SiO4 on the Mg_PEO30 sample, missing in the crystallographic observations for the Mg_PEO15 sample, could have contributed to the improvement in the corrosion resistance, as studied by Fukuda et al. [25].
In Figure 8, the pictures of the surface appearance after the potentiodynamic polarization experiments are displayed. The Mg_PEO15 sample showed many pits randomly distributed on its surface, while only a few little pits could be seen on the Mg_PEO30 sample.

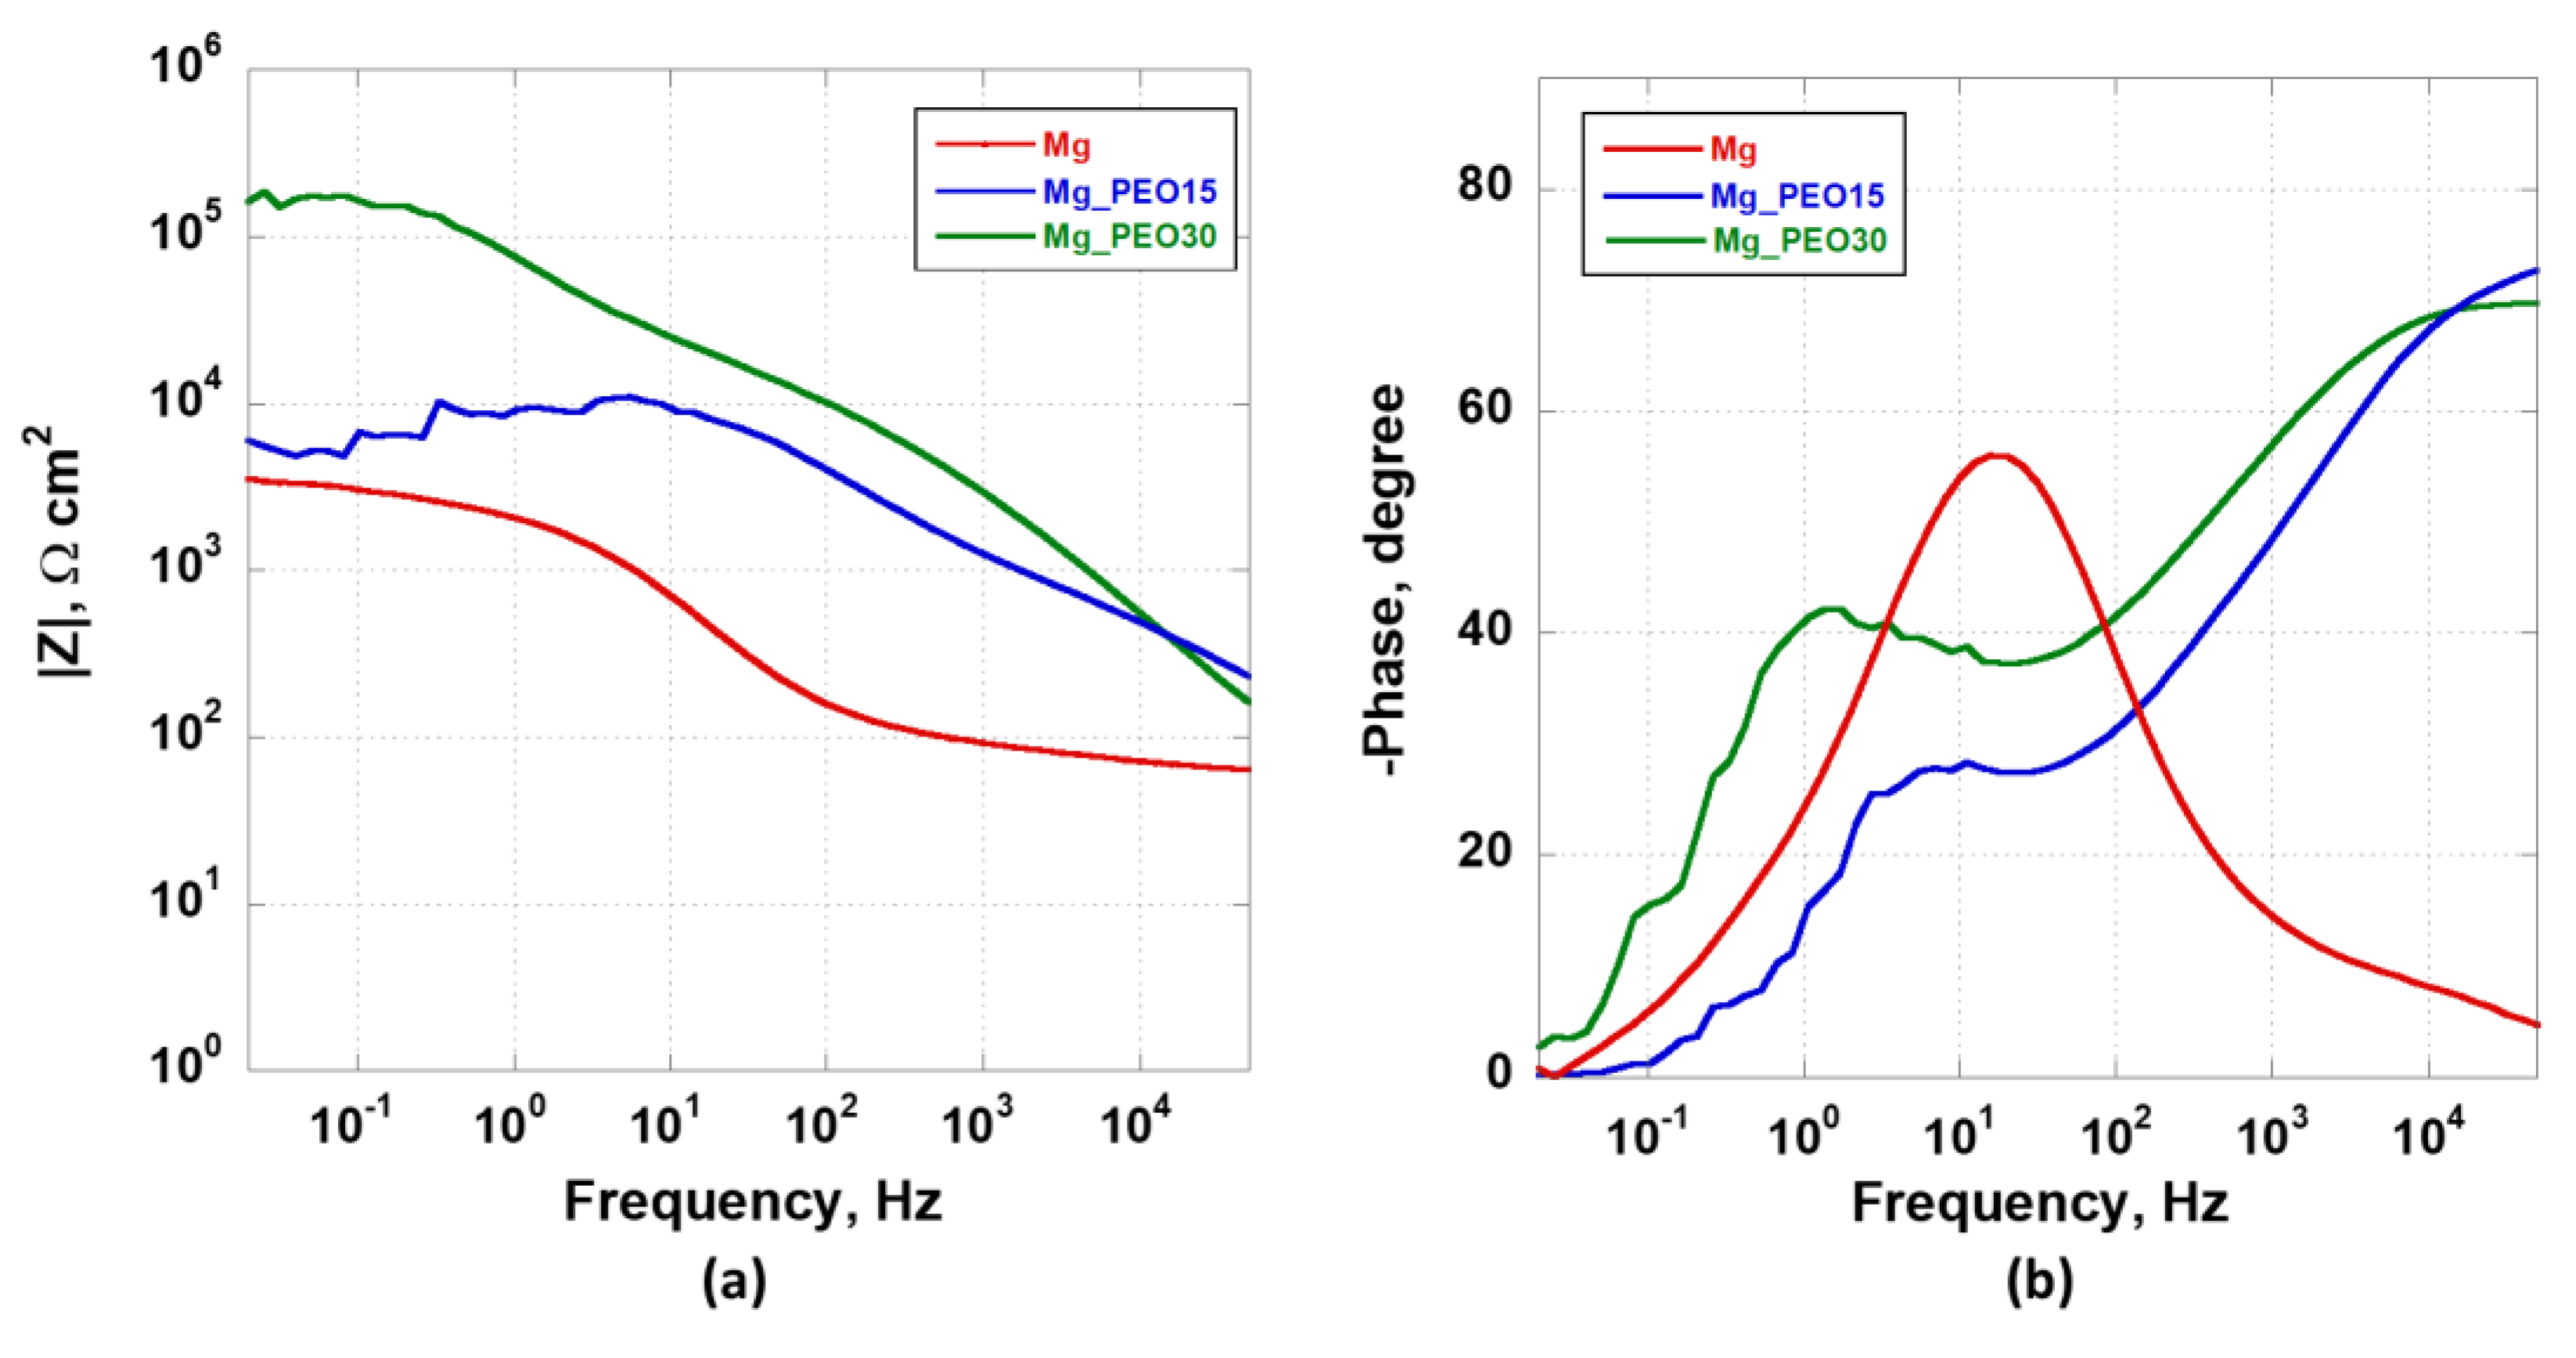
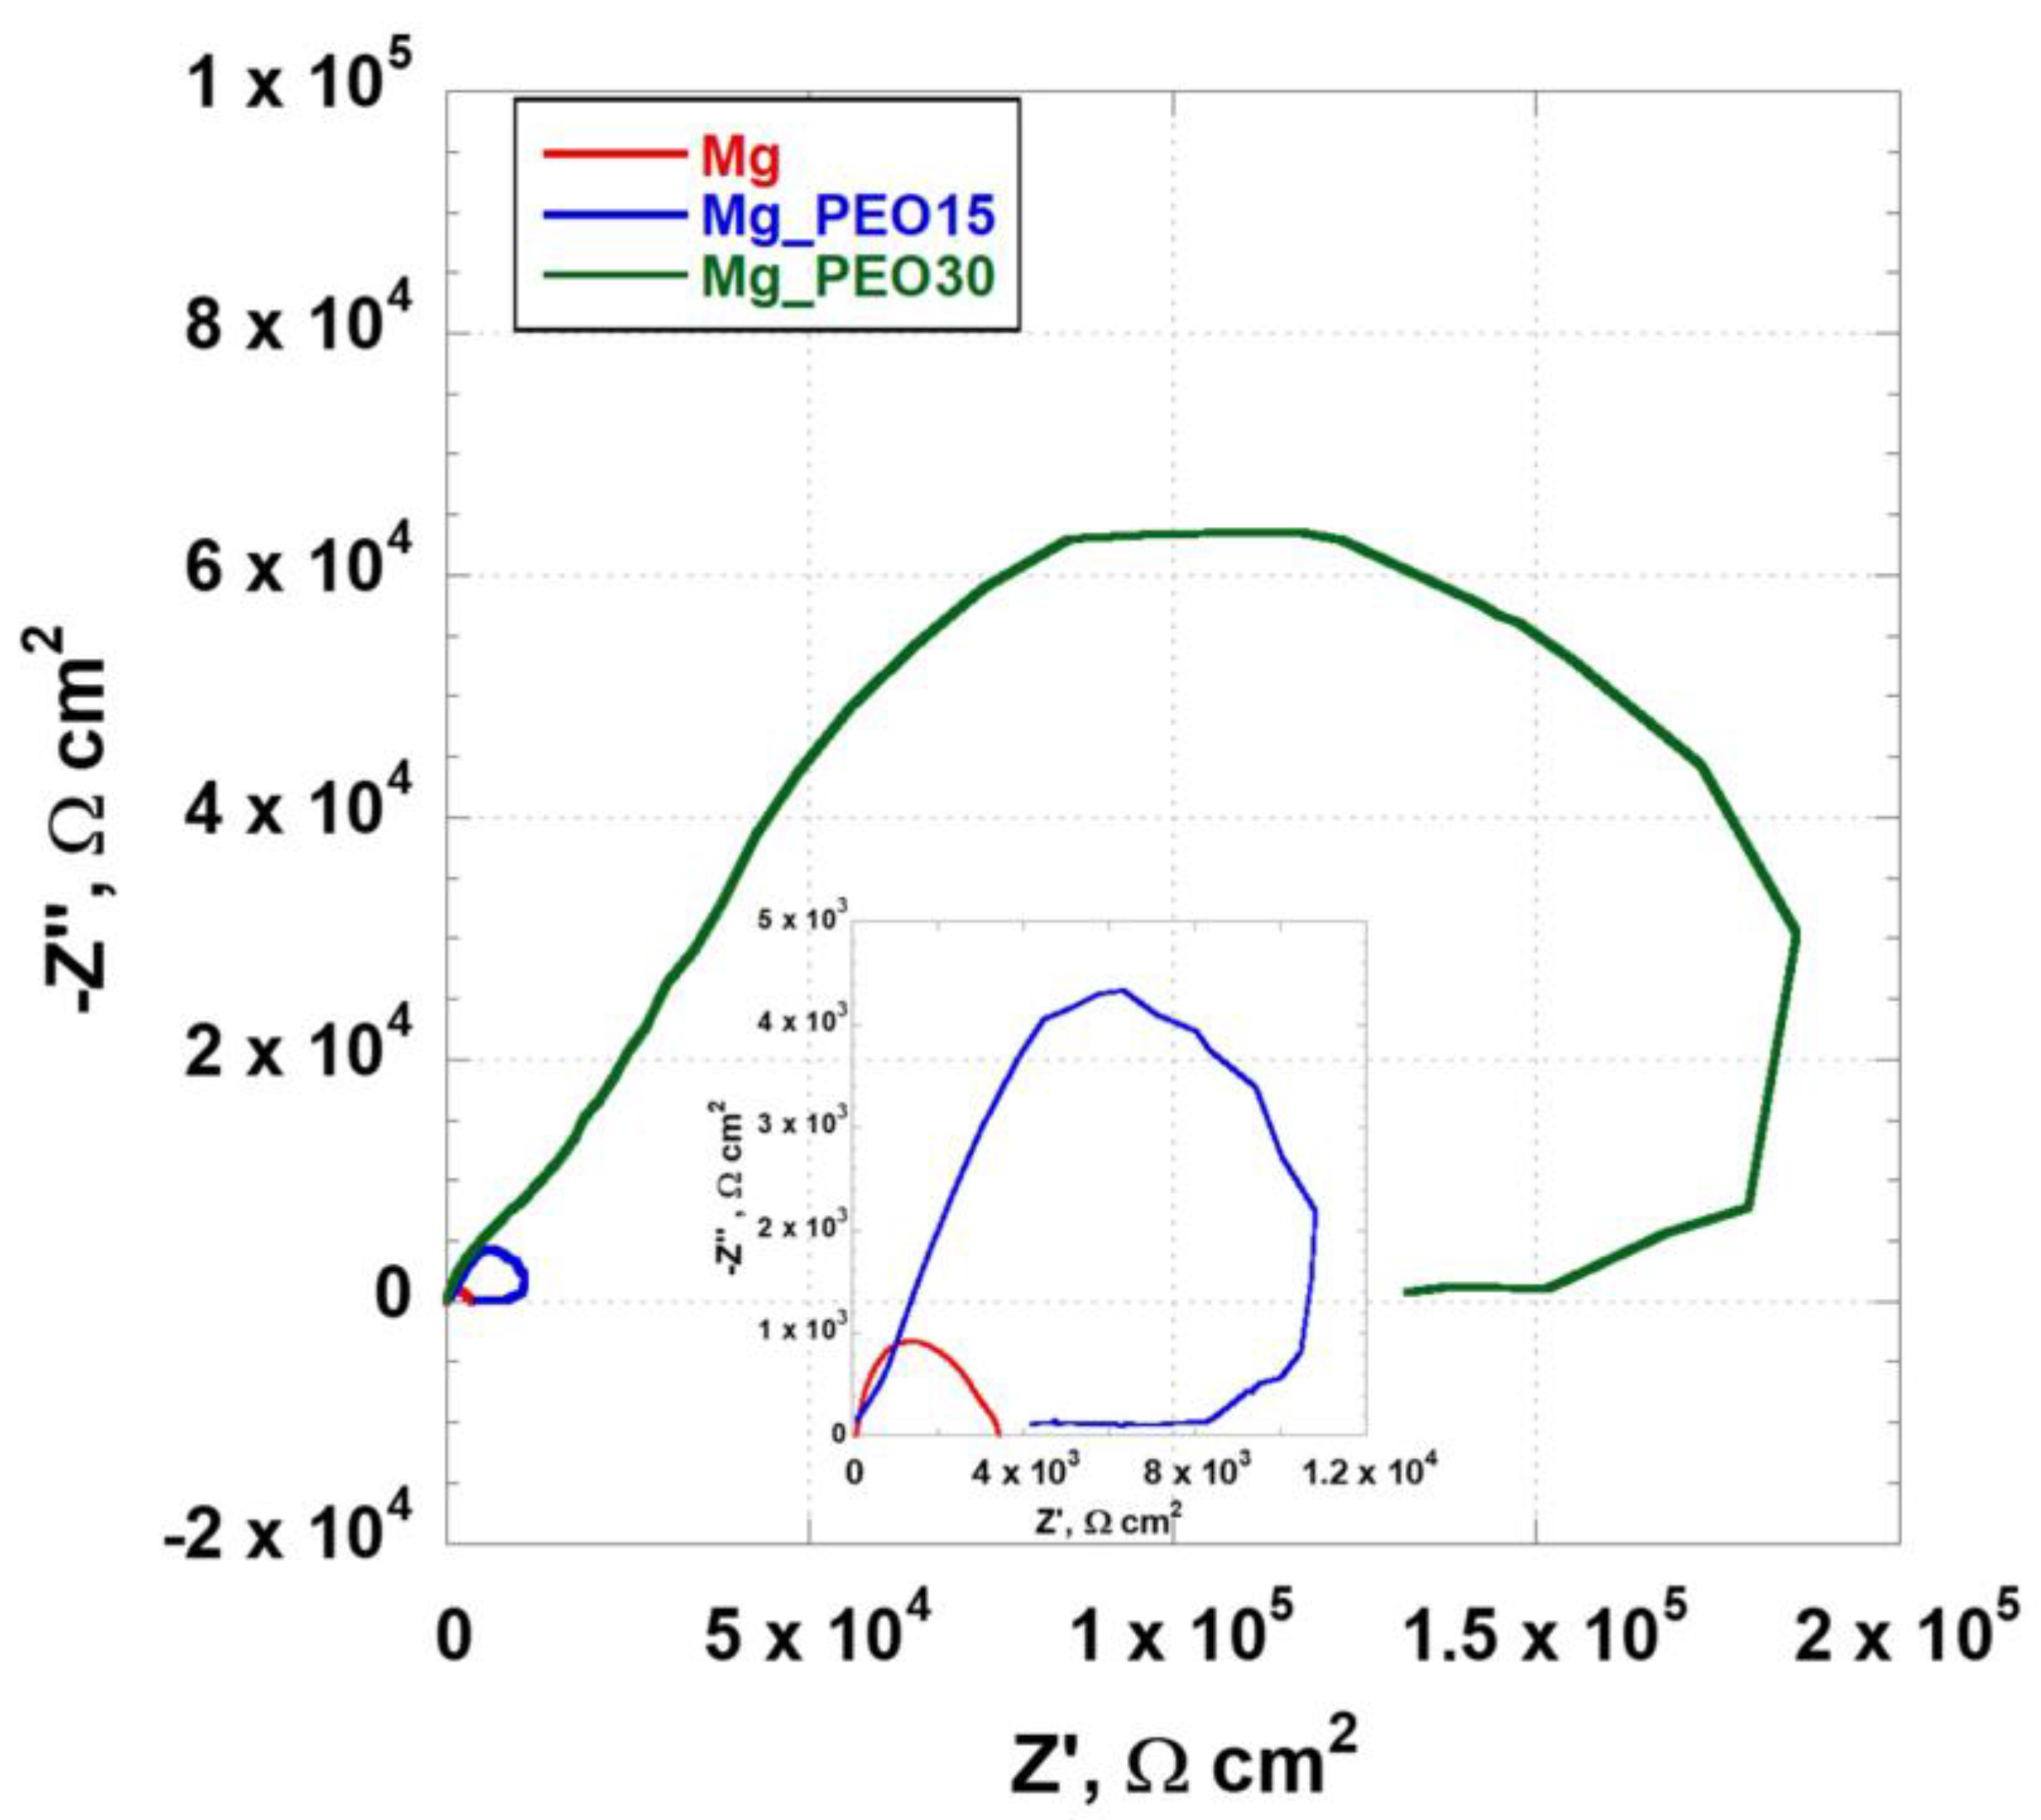
3.4.2. Electrochemical Impedance Spectroscopy Analysis

Electrochemical Impedance Spectroscopy is a well-consolidated technique used to determine the protective properties of coatings of many materials [26,27]. EIS results can be interpreted by fitting the data using a so-called equivalent electrical circuit representative of the “equivalent” electrical behavior of the system under investigation [28]. The electrical equivalent circuits, in some conditions, are well-defined, as for unpainted metal exposed to an aggressive environment, for which a Randles equivalent circuit can be used. For coated and complex systems, different equivalent circuit models can be employed to investigate systems and processes [29].
As is well-established, a good and intact protective coating, a so-called capacitive coating, is characterized by a straight line with a slope of −1 for the impedance modulus and a phase angle equal to 90° in the full frequency range [30]. Since the PEO coatings have a porous matrix, one must expect imperfect capacitive behavior. Actually, the low corrosion resistance of magnesium represents an advantage to producing biodegradable implants. The limit is its degradation rate, which must be controlled to allow the natural healing process of the hosting tissues.
The results of the EIS measurements, reported as Bode plots in Figure 9, confirmed the electrochemical behavior observed with the potentiodynamic polarization tests.
The impedance modulus curve of the Mg sample (Figure 9a—red line) shows an s-type shape, with resistive behavior in the high-frequency domain, capacitive behavior in the medium frequencies, depicted in the phase angle plot as a maximum (Figure 9b), and another resistive trend in the lowest frequency range, in which the impedance modulus value reached the typical value of a metal prone to corrode as the bare magnesium alloy, of about 3.5 × 10³ A/cm2. The impedance modulus and phase angle plot curves of the anodized samples showed a different aspect. First of all, it was possible to observe the presence of well-distinguished two-time constants, better displayed in the phase angle plot as peaks, each of which represents the interaction of the electrolyte with an interface [31]. As previously mentioned, the PEO coating generally is made of three layers, i.e., an outer porous layer, an intermediate dense layer, and an inner dense layer; each of which constitutes an interface. The pseudo-capacitive behavior at the start of the test, for the PEO coatings, represented by a negative slope of the impedance modulus graph in the higher frequency range (Figure 9a) and the first time constant at high angular values in the corresponding phase angle plot (Figure 9b) suggested electrolyte interaction with the external interface of the coatings. The different slopes showed by the two anodized samples, lower for the Mg_PEO15 sample, prove the different barrier protection offered by the interfaces to cross the corrosive medium, i.e., less protective for this sample. Immediately after, at high-medium frequencies, their barrier protection was altered due to the penetration of the corrosive medium in the pores of the PEO coating, as manifested by the phase angle reduction in Figure 9b.
From the medium frequencies to the lowest ones, the curves of the anodized samples exhibited a significant deviation. The Mg_PEO15 samples showed a second time constant, suggesting an interaction with a second interface. The impedance modulus value of 104 Ω cm2 could be assigned to the inner layer. With a reduction in the frequency, there was a continuous and unstable degradation in the protective properties. The impedance modulus recorded values comparable with those of the magnesium substrate, suggesting the penetration of the electrolytes to the PEO coating/substrate interface. Conversely, the Mg_PEO 30 sample displayed the second time constant at lower frequencies, suggesting a retarding of the electrolyte passage towards the substrate. The impedance modulus value of more than 105 Ω cm2 indicated a better corrosion resistance of the Mg_PEO30, as shown by the wider loop recorded in the Nyquist plots depicted in Figure 10.
The Nyquist plot of the Mg sample was characterized by a semicircle, confirming the single time constant highlighted in the phase angle plot (Figure 9b). Regarding the anodized samples, the Nyquist plots were more complex, presenting a low-frequency hook. In addition, in the high-medium frequency range, the curves presented a similar behavior to that shown by Sreekanth et al. [32]. They studied the influence of various additives on PEO coatings grown on AZ31 magnesium alloys. Given the porosity of these coatings, the authors declared that, when PEO treatment is performed in silicate or aluminate-based electrolytic solution, at higher frequencies the electrolytic species, used to electrochemically characterize the coatings, easily diffuse inside the coatings, reaching the internal dense barrier layer at lower frequencies, where they form adsorbed intermediates. Thus, they represented this behavior by the equivalent electrical circuit (ECC) depicted in Figure 11.
The ECC included a resistor representing the solution resistance (Rs) in series to a Warburg element (Ws), to simulate the diffusion behavior recorded in the high-frequency range [26]. These elements are followed by a parallel path composed of a constant phase element and resistor representing the capacitive (CPEpo) and resistance (Rpo) behavior of the PEO porous layer, respectively. In turn, they were in parallel to another resistor representing the resistance of the barrier layer (Rb), in series to an inductor (L) to simulate the adsorbed intermediates at the low-frequency domain.
Therefore, a clear difference is shown between the anodized samples. The increase in current density involving a PEO coating made of larger pores led to an increase in the diffusive and inductive behavior of the Mg_PEO30 sample, compared to the Mg_PEO15 sample, whose coating has smaller pores. Although the Mg_PEO30 was characterized by larger pores, it presented a higher corrosion resistance to the biological electrolyte, probably due to a thicker barrier inner layer compared to that formed on the Mg_PEO15 sample and the presence of Mg2SiO4 in the anodic oxide coating.

4. Conclusions

The purpose of this paper was to investigate the effect of current density on the morphology, thickness, and electrochemical behavior of an oxide anodic layer grown on AZ31 magnesium alloy sheets through a plasma electrolytic oxidation treatment. The higher currents resulted in an increase in the thickness of the coating and the presence of Mg2SiO4, with consequent inhibition of the corrosive phenomena, despite having larger pores than the lower-current-density Mg_PEO 30 samples.
It is clear that to use magnesium alloys for the production of biomedical devices it is necessary to both guarantee a certain corrosion resistance to allow the reference tissues to reform and ensure that the degradation process of the magnesium occurs with somewhat controllable kinetics. This contribution confirms that PEO treatment, with the possibility of growing a porous oxide layer, seems to be a good candidate for such purposes.

Author Contributions

Conceptualization: T.M. and A.A.; Methodology: A.A.; Validation: T.M.; Investigation: A.A. and P.R.; Writing—Original Draft: A.A.; Writing—Review & Editing: P.R.; Supervision: T.M. All authors have read and agreed to the published version of the manuscript.

Funding

This research received no external funding.

Data Availability Statement

The data presented in this study are available on request from the corresponding author.

Conflicts of Interest

The authors declare no conflict of interest.

References

  1. Chen, Y.; Xu, Z.; Smith, C.; Sankar, J. Recent Advances on the Development of Magnesium Alloys for Biodegradable Implants. Acta Biomater. 2014, 10, 4561–4573. [Google Scholar] [CrossRef] [PubMed]
  2. Hermawan, H.; Hermawan, H. Biodegradable Metals: State of the Art. Biodegrad. Met. Concept Appl. 2012, 13–22. [Google Scholar] [CrossRef]
  3. Zhang, T.; Wang, W.; Liu, J.; Wang, L.; Tang, Y.; Wang, K. A Review on Magnesium Alloys for Biomedical Applications. Front. Bioeng. Biotechnol. 2022, 10, 106–127. [Google Scholar] [CrossRef] [PubMed]
  4. Ramalingam, V.V.; Ramasamy, P.; Kovukkal, M.D.; Myilsamy, G. Research and Development in Magnesium Alloys for Industrial and Biomedical Applications: A Review. Met. Mater. Int. 2019, 26, 409–430. [Google Scholar] [CrossRef]
  5. Carangelo, A.; Acquesta, A.; Monetta, T. In-Vitro Corrosion of AZ31 Magnesium Alloys by Using a Polydopamine Coating. Bioact. Mater. 2019, 4, 71–78. [Google Scholar] [CrossRef]
  6. Zhongling, W.; Peng, T.; Xuanyong, L.; Bangxin, Z. In Vitro Degradation, Hemolysis, and Cytocompatibility of PEO/PLLA Composite Coating on Biodegradable AZ31 Alloy. J. Biomed. Mater. Res. Part B Appl. Biomater. 2015, 103, 342–354. [Google Scholar]
  7. Shi, P.; Niu, B.; Shanshan, E.; Chen, Y.; Li, Q. Preparation and Characterization of PLA Coating and PLA/MAO Composite Coatings on AZ31 Magnesium Alloy for Improvement of Corrosion Resistance. Surf. Coat. Technol. 2015, 262, 26–32. [Google Scholar] [CrossRef]
  8. Arrabal, R.; Mota, J.; Criado, A.; Pardo, A.; Mohedano, M.; Matykina, E. Assessment of Duplex Coating Combining Plasma Electrolytic Oxidation and Polymer Layer on AZ31 Magnesium Alloy. Surf. Coat. Technol. 2012, 206, 4692–4703. [Google Scholar] [CrossRef]
  9. Hou, F.; Gorthy, R.; Mardon, I.; Tang, D.; Goode, C. Low Voltage Environmentally Friendly Plasma Electrolytic Oxidation Process for Titanium Alloys. Sci. Rep. 2022, 12, 6037. [Google Scholar] [CrossRef]
  10. Jiao, Y.; Zou, G.-Y.; Mu, H.-X.; Ni, X.-H.; Yi, L.; Zhao, Q.-M. Cytocompatibility of Porous P-Containing Coating Prepared by Plasma Electrolytic Oxidation of Mg Alloy. Mater. Res. Express 2020, 7, 086404. [Google Scholar] [CrossRef]
  11. Toulabifard, A.; Rahmati, M.; Raeissi, K.; Hakimizad, A.; Santamaria, M. The Effect of Electrolytic Solution Composition on the Structure, Corrosion, and Wear Resistance of PEO Coatings on AZ31 Magnesium Alloy. Coatings 2020, 10, 937. [Google Scholar] [CrossRef]
  12. Toorani, M.; Aliofkhazraei, M.; Golabadi, M.; Rouhaghdam, A.S. Effect of Lanthanum Nitrate on the Microstructure and Electrochemical Behavior of PEO Coatings on AZ31 Mg Alloy. J. Alloy Compd. 2017, 719, 242–255. [Google Scholar] [CrossRef]
  13. Huang, Z.; Wang, R.; Liu, X.; Wang, D.; Zhang, H.; Shen, X.; Shen, D.; Li, D. Influence of Different Electrolyte Additives and Structural Characteristics of Plasma Electrolytic Oxidation Coatings on AZ31 Magnesium Alloy. Coatings 2020, 10, 817. [Google Scholar] [CrossRef]
  14. Zhuang, J.J.; Song, R.G.; Xiang, N.; Xiong, Y.; Hu, Q. Effect of Current Density on Microstructure and Properties of PEO Ceramic Coatings on Magnesium Alloy. Surf. Eng. 2017, 33, 744–752. [Google Scholar] [CrossRef]
  15. Lee, K.M.; Einkhah, F.; Sani, M.A.F.; Ko, Y.G.; Shin, D.H. Effects of Current Density on Microstructure and Corrosion Property of Coating on AZ31 Mg Alloy Processed via Plasma Electrolytic Oxidation. In Magnesium Technology 2014; Alderman, M., Manuel, M.V., Hort, N., Neelameggham, N.R., Eds.; Springer International Publishing: Cham, Switzerland, 2016; pp. 345–349. ISBN 978-3-319-48231-6. [Google Scholar]
  16. Kajánek, D.; Hadzima, B.; Brezina, M.; Jackova, M. Effect of Applied Current Density of Plasma Electrolytic Oxidation Process on Corrosion Resistance of AZ31 Magnesium Alloy. Commun.-Sci. Lett. Univ. Zilina 2019, 21, 32–36. [Google Scholar] [CrossRef]
  17. Bala Srinivasan, P.; Liang, J.; Blawert, C.; Störmer, M.; Dietzel, W. Effect of Current Density on the Microstructure and Corrosion Behaviour of Plasma Electrolytic Oxidation Treated AM50 Magnesium Alloy. Appl. Surf. Sci. 2009, 255, 4212–4218. [Google Scholar] [CrossRef] [Green Version]
  18. Monetta, T.; Acquesta, A.; Carangelo, A.; Donato, N.; Bellucci, F. Durability of AZ31 Magnesium Biodegradable Alloys Polydopamine Aided: Part 1. J. Magnes. Alloy. 2017, 5, 412–422. [Google Scholar] [CrossRef]
  19. Geels, K.; Fowler, D.B.; Kopp, W.-U.; Rückert, M. Metallographic and Materialographic Specimen Preparation, Light Microscopy, Image Analysis, and Hardness Testing; ASTM International: West Conshohocken, PA, USA, 2007; Volume 46. [Google Scholar]
  20. Liang, J.; Srinivasan, P.B.; Blawert, C.; Störmer, M.; Dietzel, W. Electrochemical Corrosion Behaviour of Plasma Electrolytic Oxidation Coatings on AM50 Magnesium Alloy Formed in Silicate and Phosphate Based Electrolytes. Electrochim. Acta 2009, 54, 3842–3850. [Google Scholar] [CrossRef]
  21. Monetta, T.; Parnian, P.; Acquesta, A. Recent Advances in the Control of the Degradation Rate of PEO Treated Magnesium and Its Alloys for Biomedical Applications. Metals 2020, 10, 907. [Google Scholar] [CrossRef]
  22. Hussein, R.O.; Zhang, P.; Nie, X.; Xia, Y.; Northwood, D.O. The Effect of Current Mode and Discharge Type on the Corrosion Resistance of Plasma Electrolytic Oxidation (PEO) Coated Magnesium Alloy AJ62. Surf. Coat. Technol. 2011, 206, 1990–1997. [Google Scholar] [CrossRef] [Green Version]
  23. Zhang, Y.; Wu, Y.; Chen, D.; Wang, R.; Li, D.; Guo, C.; Jiang, G.; Shen, D.; Yu, S.; Nash, P. Micro-Structures and Growth Mechanisms of Plasma Electrolytic Oxidation Coatings on Aluminium at Different Current Densities. Surf. Coat. Technol. 2017, 321, 236–246. [Google Scholar] [CrossRef]
  24. King, A.D.; Birbilis, N.; Scully, J.R. Accurate Electrochemical Measurement of Magnesium Corrosion Rates; a Combined Impedance, Mass-Loss and Hydrogen Collection Study. Electrochim. Acta 2014, 121, 394–406. [Google Scholar] [CrossRef]
  25. Fukuda, H.; Matsumoto, Y. Effects of Na2SiO3 on Anodization of Mg-Al-Zn Alloy in 3 M KOH Solution. Corros. Sci. 2004, 46, 2135–2142. [Google Scholar] [CrossRef]
  26. Walter, G. The Application of Impedance Spectroscopy to Study the Uptake of Sodium Chloride Solution in Painted Metals. Corros. Sci. 1991, 32, 1041–1058. [Google Scholar] [CrossRef]
  27. Schmitt, J.; Maheshwari, A.; Heck, M.; Lux, S.; Vetter, M. Impedance Change and Capacity Fade of Lithium Nickel Manganese Cobalt Oxide-Based Batteries during Calendar Aging. J. Power Sources 2017, 353, 183–194. [Google Scholar] [CrossRef]
  28. Amirudin, A.; Thieny, D. Application of Electrochemical Impedance Spectroscopy to Study the Degradation of Polymer-Coated Metals. Prog. Org. Coat. 1995, 26, 1–28. [Google Scholar] [CrossRef]
  29. Monetta, T.; Acquesta, A.; Carangelo, A.; Bellucci, F. TiO2 Nanotubes on Ti Dental Implant. Part 2: EIS Characterization in Hank’s Solution. Metals 2017, 7, 220. [Google Scholar] [CrossRef] [Green Version]
  30. Mansfeld, F.; Kendig, M.W.; Tsai, S. Evaluation of Corrosion Behavior of Coated Metals with AC Impedance Measurements. Corrosion 1982, 38, 478–485. [Google Scholar] [CrossRef]
  31. Walter, G.W. A Review of Impedance Plot Methods Used for Corrosion Performance Analysis of Painted Metals. Corros. Sci. 1986, 26, 681–703. [Google Scholar] [CrossRef]
  32. Sreekanth, D.; Rameshbabu, N.; Venkateswarlu, K. Effect of Various Additives on Morphology and Corrosion Behavior of Ceramic Coatings Developed on AZ31 Magnesium Alloy by Plasma Electrolytic Oxidation. Ceram. Int. 2012, 38, 4607–4615. [Google Scholar] [CrossRef]
Figure 1. Schematic diagram of the system used to perform the electrochemical treatment.
Crystals 13 00510 g001
Figure 2. Voltage-time curves of the samples treated applying a current density of 15 mA/cm2 (blue curve) or 30 mA/cm2 (green curve).
Crystals 13 00510 g002
Figure 3. Micro-spark development during (a) the second step and (b) the third step of the PEO treatment.
Crystals 13 00510 g003
Figure 4. Morphological analysis of Mg (bare sample), Mg_PEO15 (sample coated by PEO treatment carried out at 15 mA/cm2), and Mg_PEO30 (sample coated by PEO treatment carried out at 30 mA/cm2).
Crystals 13 00510 g004
Figure 5. Optical pictures of PEO coating thickness of the (a) Mg_PEO15 and (b) Mg_PEO30 samples.
Crystals 13 00510 g005
Figure 6. XRD pattern of the PEO coatings in comparison to the AZ31 magnesium substrate.
Crystals 13 00510 g006
Figure 7. Potentiodynamic curves of the investigated samples exposed to Hank’s solution at 37 °C.
Crystals 13 00510 g007
Figure 8. Surface appearance optical images after potentiodynamic polarization test in Hank’s solution at 37 °C of the (a) MG_PEO15 and (b) Mg_PEO30 samples.
Crystals 13 00510 g008
Figure 9. (a) Impedance modulus and (b) phase angle plots of samples characterized in Hank’s solution at 37 °C.
Crystals 13 00510 g009
Figure 10. Nyquist plots of samples characterized in Hank’s solution at 37 °C.
Crystals 13 00510 g010
Figure 11. The equivalent electrical circuit used by [32] to simulate the electrochemical behavior of PEO coatings obtained in silicate or aluminate-based electrolytic solutions.
Crystals 13 00510 g011
Table 1. Elemental composition by weight of AZ31 magnesium alloy.
ElementAlZnMnSiCuFeNiOthersMg
2.5–3.50.7–1.30.2–10.050.01>0.05>0.050.4Balance
Table 2. Abbreviation used to identify the samples.
AcronymDescription of the Sample
MgBare magnesium alloy sheet
Mg_PEO15Bare magnesium alloy treated by PEO applying a current density of 15 mA/cm2
Mg_PEO30Bare magnesium alloy treated by PEO applying a current density of 30 mA/cm2
Table 3. Corrosion potential and current density of corrosion values of the investigated samples in Hank’s solution.
ParameterMgMg_PEO15Mg_PEO30
Ecorr (V vs. SCE)−1.43 ± 0.03−1.35 ± 0.02−1.28 ± 0.04
icorr (A/cm2)2 × 10−4 ± 0.6 × 10−44 × 10−5 ± 0. 5 × 10−55 × 10−6 ± 0. 3 × 10⁻⁶
Disclaimer/Publisher’s Note: The statements, opinions and data contained in all publications are solely those of the individual author(s) and contributor(s) and not of MDPI and/or the editor(s). MDPI and/or the editor(s) disclaim responsibility for any injury to people or property resulting from any ideas, methods, instructions or products referred to in the content.

