Article

Impact of Polyamide Surface Preparation on the Formation of Mixed CdS-CdTe Layers

by
Migle Liudziute
,
Skirma Zalenkiene
,
Remigijus Ivanauskas
and
Ingrida Ancutiene
*
Department of Physical and Inorganic Chemistry, Kaunas University of Technology, Radvilenu Str. 19, LT-50254 Kaunas, Lithuania
*
Author to whom correspondence should be addressed.
Crystals 2023, 13(5), 730; https://doi.org/10.3390/cryst13050730
Submission received: 29 March 2023 / Revised: 19 April 2023 / Accepted: 24 April 2023 / Published: 26 April 2023

Abstract

:
CdTe-CdS layers were formed on polyamide (PA) 6 films with different surface modifications using the sorption-diffusion method. Part of the samples of the PA films was boiled in distilled water for 2 h and the other ones were stored in concentrated acetic acid at 20 °C for 0.5 h. After this stage, all the PA 6 films were chalcogenized at 20 °C for 1 or 5 h using an acidified 0.1 mol/L solution of K2TeS4O6. Then, the chalcogenized samples were treated with a 0.1 mol/L solution of cadmium acetate at 70, 80 or 90 °C for 10 min. The elemental and phase composition and the morphological and optical properties of the obtained films were determined. XRD analysis showed that cadmium chalcogenide layers consist of four phases: hexagonal CdTe, orthorhombic CdS, rhombohedral Te and orthorhombic S18. The average crystallite size among the obtained layers was very similar and was in the range of 36–42 nm. The concentrations of cadmium, sulfur and tellurium in the layers on PA 6 and the optical properties of the CdTe-CdS layers were dependent on the method of preparation of the polyamide film, the duration of chalcogenization and the temperature of the Cd(CH3COO)2 solution.

1. Introduction

In today’s world, the need for energy is constantly increasing, but with this growth comes the negative environmental impact caused by the use of fossil fuels to serve modern interests. One of the biggest focuses in the modern world is to generate electricity using renewable energy. Photovoltaic energy is one of the most popular renewable energy sources due to its economy, reliability and efficiency. Scientists around the world are constantly trying to discover new materials and ways to produce them so that semiconductors can be obtained with maximum efficiency and minimum production costs. One such material is cadmium chalcogenides, namely cadmium telluride and cadmium sulfide, which are capable of forming heterosystems [1,2,3,4]. Both cadmium telluride and cadmium sulfide are group II-VI compounds with special properties that distinguish them from standard semiconductor materials. Narrow-gap CdTe and wide-gap CdS semiconductors have bandgaps for solar absorption which are close to the maximum of the solar spectrum [5]. Cadmium telluride has a near-optimum bandgap of 1.45 eV and a significant absorption coefficient of 105 cm–1 [6,7,8,9,10], and cadmium sulfide has an energy bandgap of 2.42 eV [1,11,12,13,14]. Among other substances, CdS serves as a buffer layer in CdTe solar cells because of low resistance and high transmittance [15]. Those solar cells consist of a p-type CdTe/n-type CdS heterojunction, which develops a high bandgap and, as a result, the device can absorb about 90% of sunlight in less than 1000 nm of material [8,16,17]. The efficiency of CdTe/CdS solar cells has improved significantly in recent years and has reached a record-high level (22.1%) [1,6,7,9,18]. Another important aspect is that these modules have very little environmental impact as they are recyclable, making this technology one of the most environmentally friendly [19,20]. Due to this reason, numerous research on CdTe-CdS thin films has shown that they could be used in solar cells, and their manufacturing has never been so cheap [21,22].
Both compounds are easy to incorporate into the production of solar cell modules, are inexpensive and can be produced via both physical and chemical methods without complex manufacturing processes. Various methods have been used to synthesize thin films of cadmium chalcogenides, such as physical vapor deposition by thermal evaporation, close-spaced sublimation, sputtering, metal-organic chemical-vapor deposition, electrodeposition, chemical pyrolysis deposition, successive ionic layer adsorption and reaction (SILAR) and chemical bath deposition (CBD) [23,24,25,26,27,28,29,30,31,32,33,34,35]. Some of these methods do not require high production costs and make the cost of thin-film solar cell technology more competitive.
The production of thin-layer solar cells on flexible materials such as polymer substrates offers a number of advantages, such as lighter weight. Therefore, in this study, the semi-hydrophilic polymer polyamide 6 was used as a substrate. One aim of this work was to obtain mixed thin layers of cadmium tellurides and cadmium sulfides on the surface of PA 6 films, prepared using various techniques, via a simple sorption-diffusion method, using potassium telluropentathionate salt as a single-source precursor of tellurium and sulfur at low temperature. Another aim was to study the elemental and phase composition and the morphological and optical properties of the obtained layers. To characterize the obtained layers, scanning electron microscopy (SEM), energy-dispersive X-ray spectroscopy (EDX), X-ray diffraction (XRD), atomic absorption spectroscopy (AAS) and UV-Vis spectroscopy (UV-Vis) measurements were carried out.

2. Materials and Methods

2.1. Materials

Tellurous acid (98% purity), acetic acid (99%), hydrochloric acid (35–38%), potassium acetate (99% purity), and sodium thiosulfate pentahydrate (99.5% purity) were acquired from Labochema.com. Cadmium acetate dihydrate with a purity of 99.99% was purchased from Sigma–Aldrich (Sigma-Aldrich Chemie GmbH, Munich, Germany). Polyamide (PA) 6 film of 500 μm thickness with a density of 1.13 g/cm3 was obtained from Ensinger GmbH (Ensinger GmbH, Nufringen, Germany).

2.2. Synthesis of Cadmium Sulfide—Cadmium Telluride Layers

Before the experiments, PA films 15 mm× 70 mm in size were boiled in distilled water for 120 min (sample group S1) or kept in concentrated acetic acid at 20 °C for 30 min (sample group S2). Then, they were dried using a filter paper and kept in a desiccator over anhydrous CaCl2. Potassium telluropentathionate salt (K2TeS4O6·1.5H2O) was prepared and chemically analyzed according to a published method [36]. Firstly, PA 6 films were chalcogenized for 1 h (S1-1, S2-1) or 5 h (S1-5, S2-5) at 20 °C using a continuously stirred acidified (0.2 mol/L HCl) 0.1 mol/L solution of K2TeS4O6. At the second stage, samples of chalcogenized PA were treated with a 0.1 mol/dm3 solution of cadmium acetate for 10 min at temperatures of 70 °C (S1-1-70, S1-5-70, S2-1-70, S2-5-70), 80 °C (S1-1-80, S1-5-80, S2-1-80, S2-5-80) or 90 °C (S1-1-90, S1-5-90, S2-1-90, S2-5-90). The preparation of PA 6 films and the synthesis of cadmium sulfide-cadmium telluride layers are shown in Figure 1.

2.3. SEM/EDX Characterization

The morphology was examined using a Quanta 200 FEG (FEI CompantTM, Eindhoven, The Netherlands) scanning electron microscopy (SEM) equipped. A secondary electron signal was used for imaging. Energy dispersion spectroscopy (EDS) imaging was performed using a QUANTAX EDS system with a Bruker XFlash® 4030 detector and ESPRIT software (Bruker AXS Microanalysis GmbH, Berlin, Germany).

2.4. XRD Characterization

After preparation, all samples were analyzed via XRD on the Bruker D8 Advance diffractometer (Bruker AXS, Karlsruhe, Germany). This test determined the structural characterization of the obtained materials. PA 6 films were scanned over the range 2θ = 3–70° at a scanning speed of 1° min–1 using a coupled two theta/theta scan type. The diffractometer was supplied together with the software package DIFFRAC.SUITE. (Diffract. EVA. v. 4.5, Bruker AXS, Karlsruhe, Germany). X-ray diffraction data were analyzed using the software package Crystallographica Search Match v.2.1 and X-ray diffractograms were processed using Microsoft Office Excel.

2.5. Elemental Composition

The total amount of cadmium, tellurium and sulfur in the layers of the cadmium chalcogenides was determined via atomic absorption spectroscopy (AAS) using the OPTIMA 8000 ICP-Optical Emission Spectrometer (PerkinElmer, Waltham, MA, USA). The solution for analysis was prepared by dissolving pieces of the samples with a weight of 0.02–0.05 g in 5 mL of concentrated nitric acid. The resulting solution was boiled for 30 min in a water bath. During this process, irreversible destruction of the PA occurred and nitrogen oxides were removed. After boiling, the solution was diluted to the required volume and used for analysis.

2.6. UV-Vis Spectroscopy

UV-Vis spectra were recorded on a SpectronicR GenesysTM 8 UV-Vis spectrophotometer (Spectronic instruments, Runcorn, UK) with compensation of the absorption of PA 6 in the range of 200–800 nm.

3. Results and Discussion

3.1. SEM/EDX Analysis

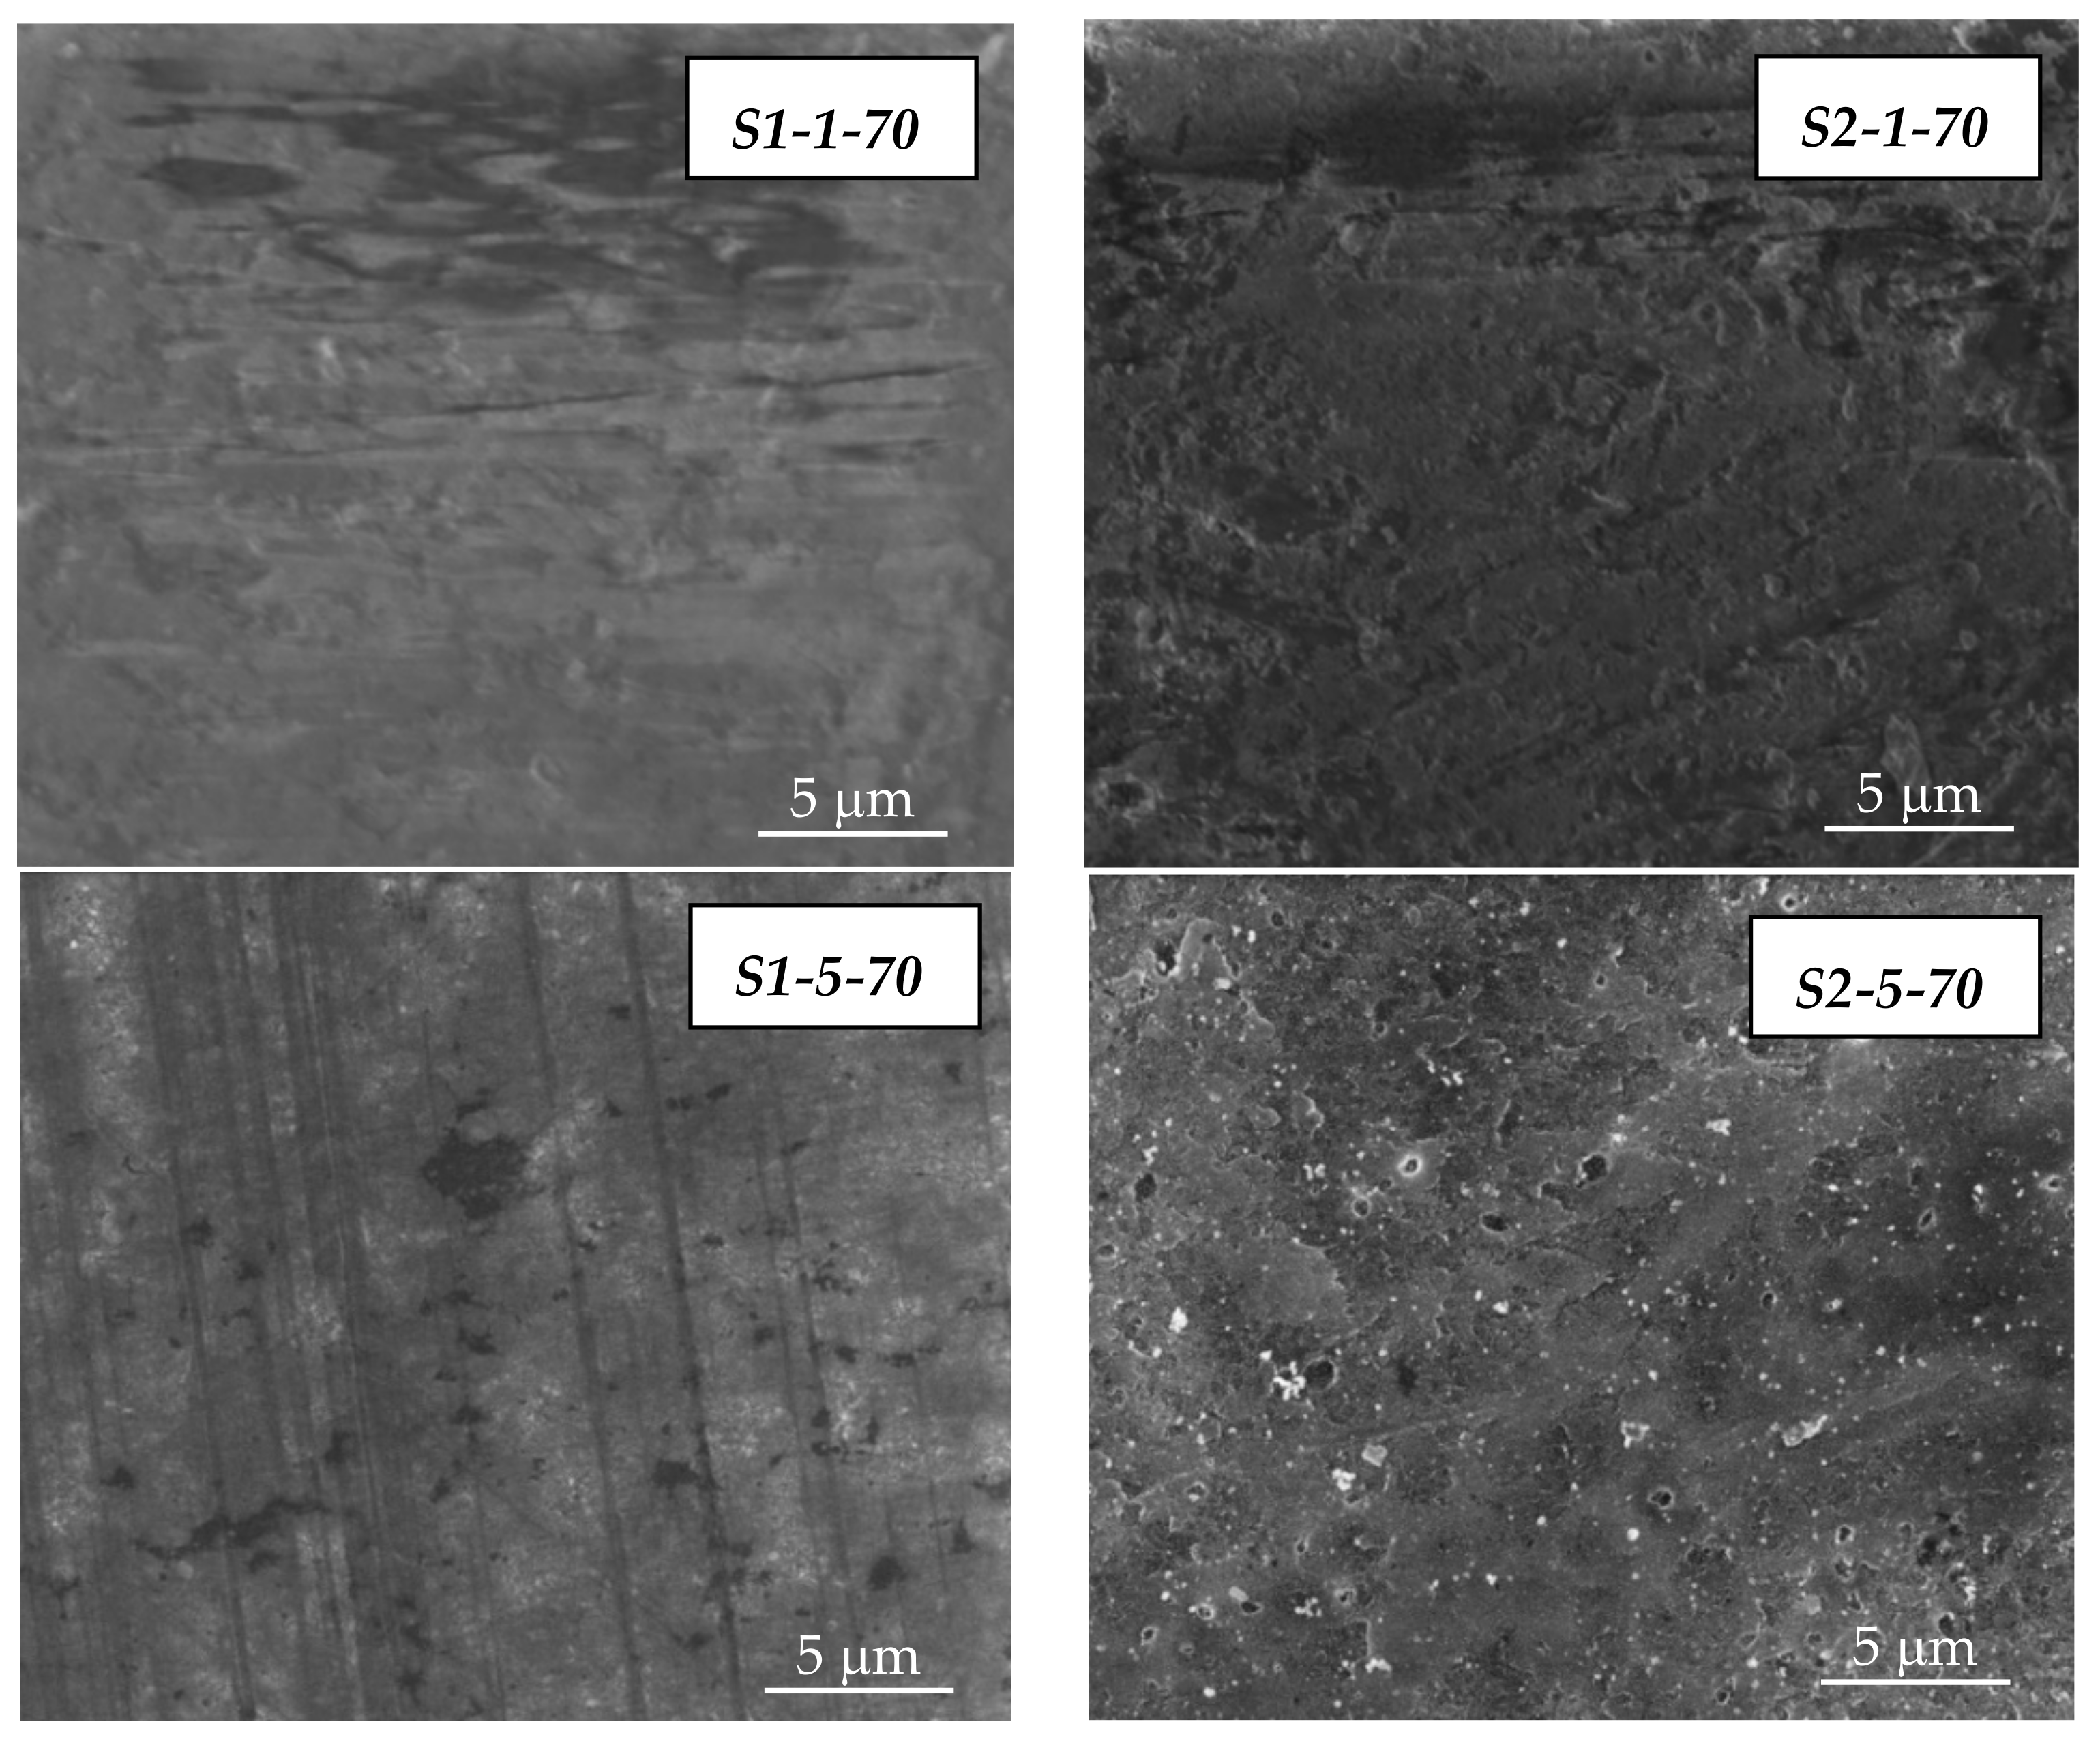
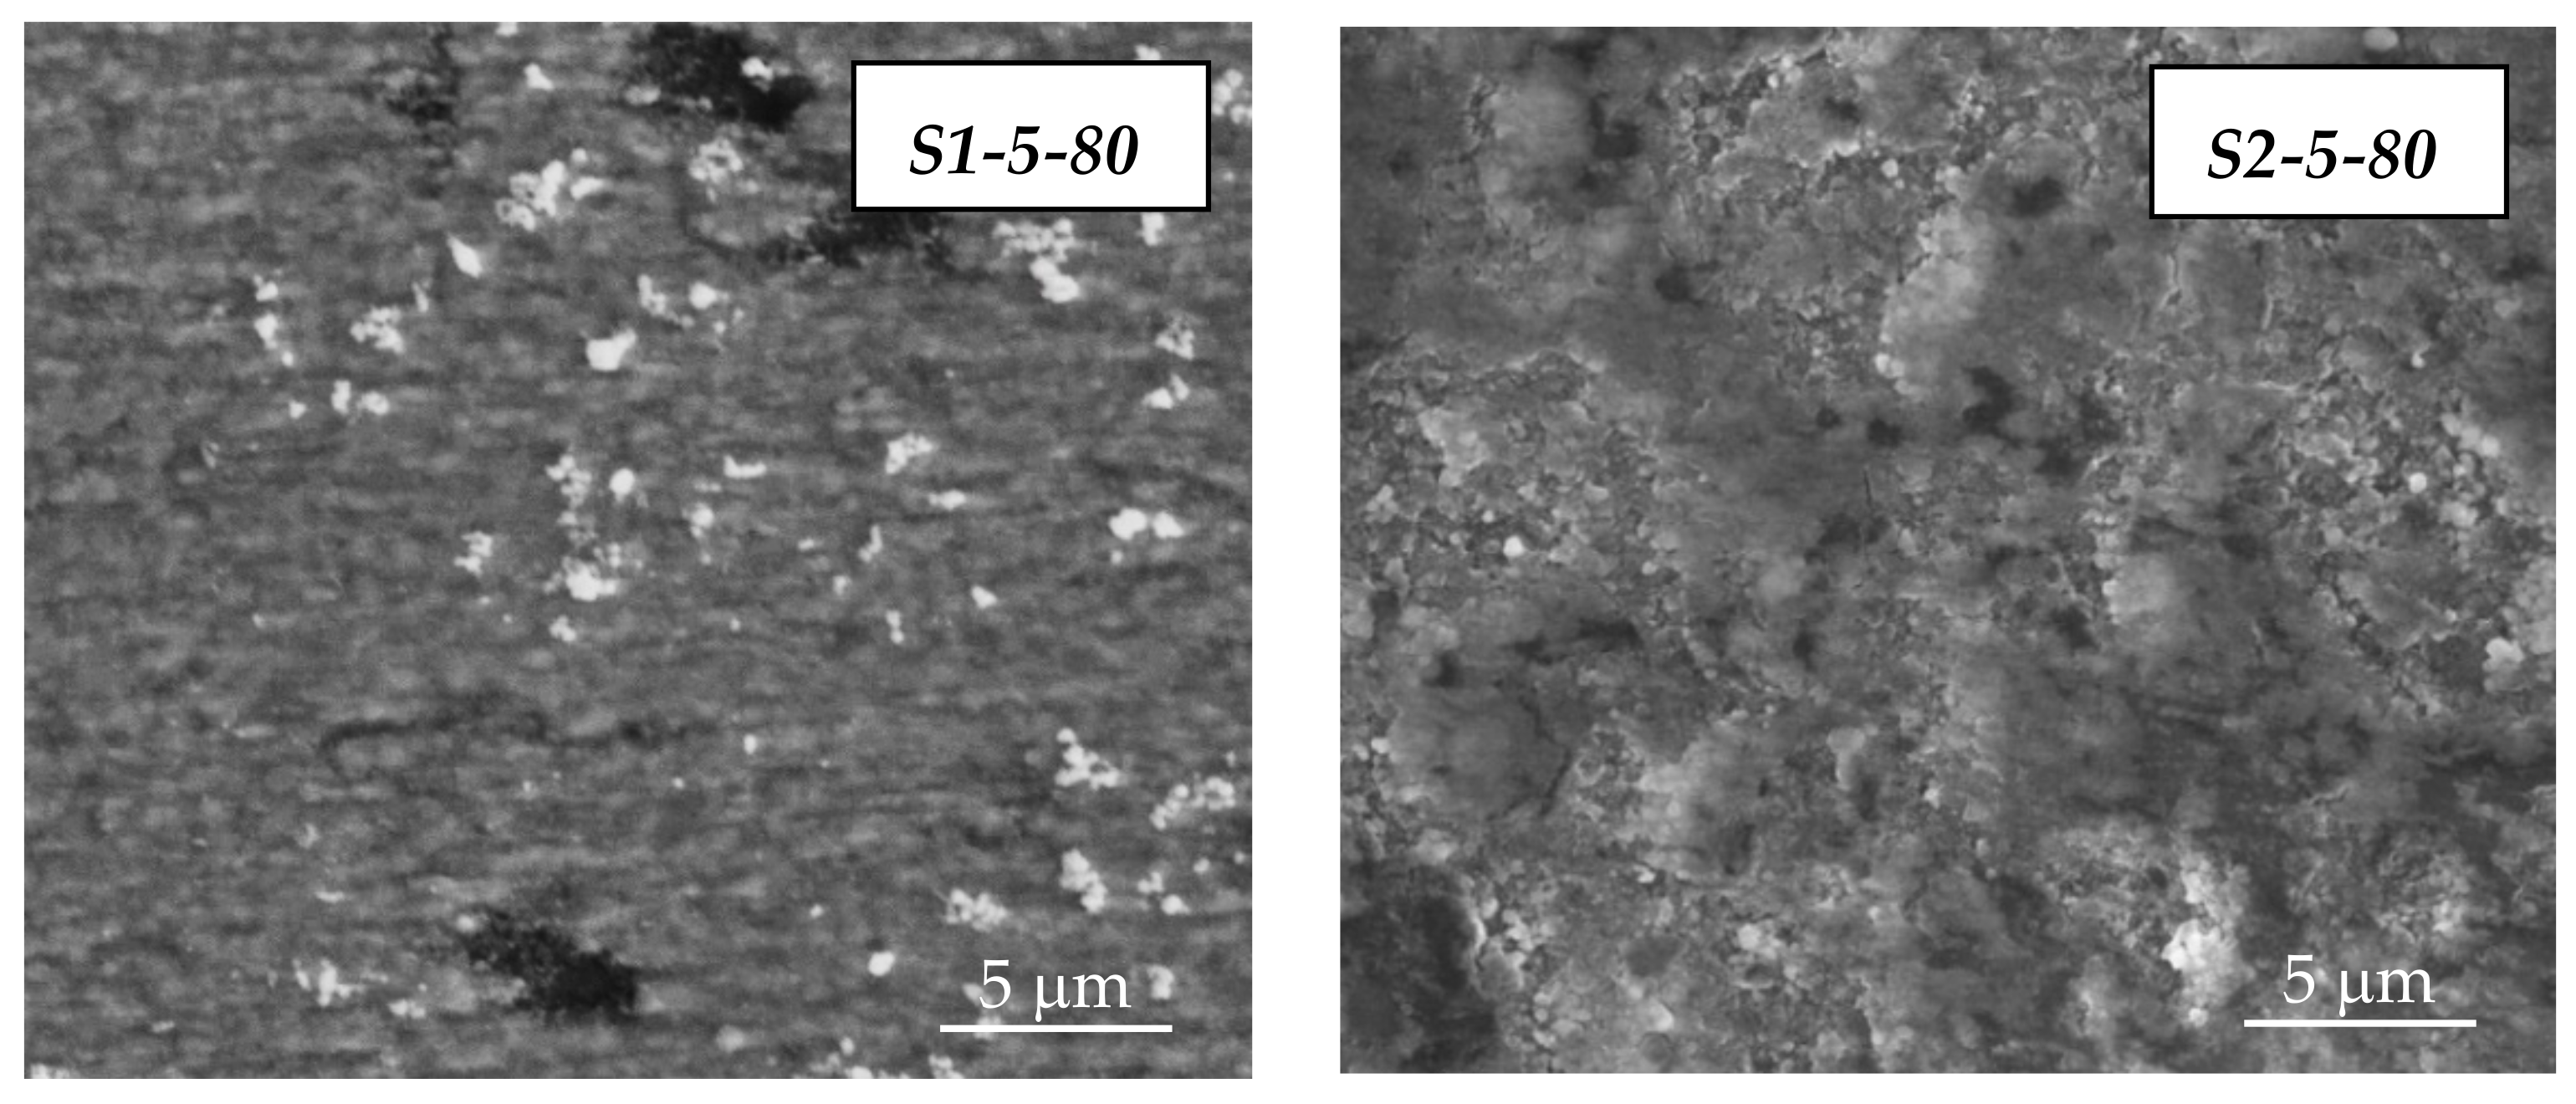
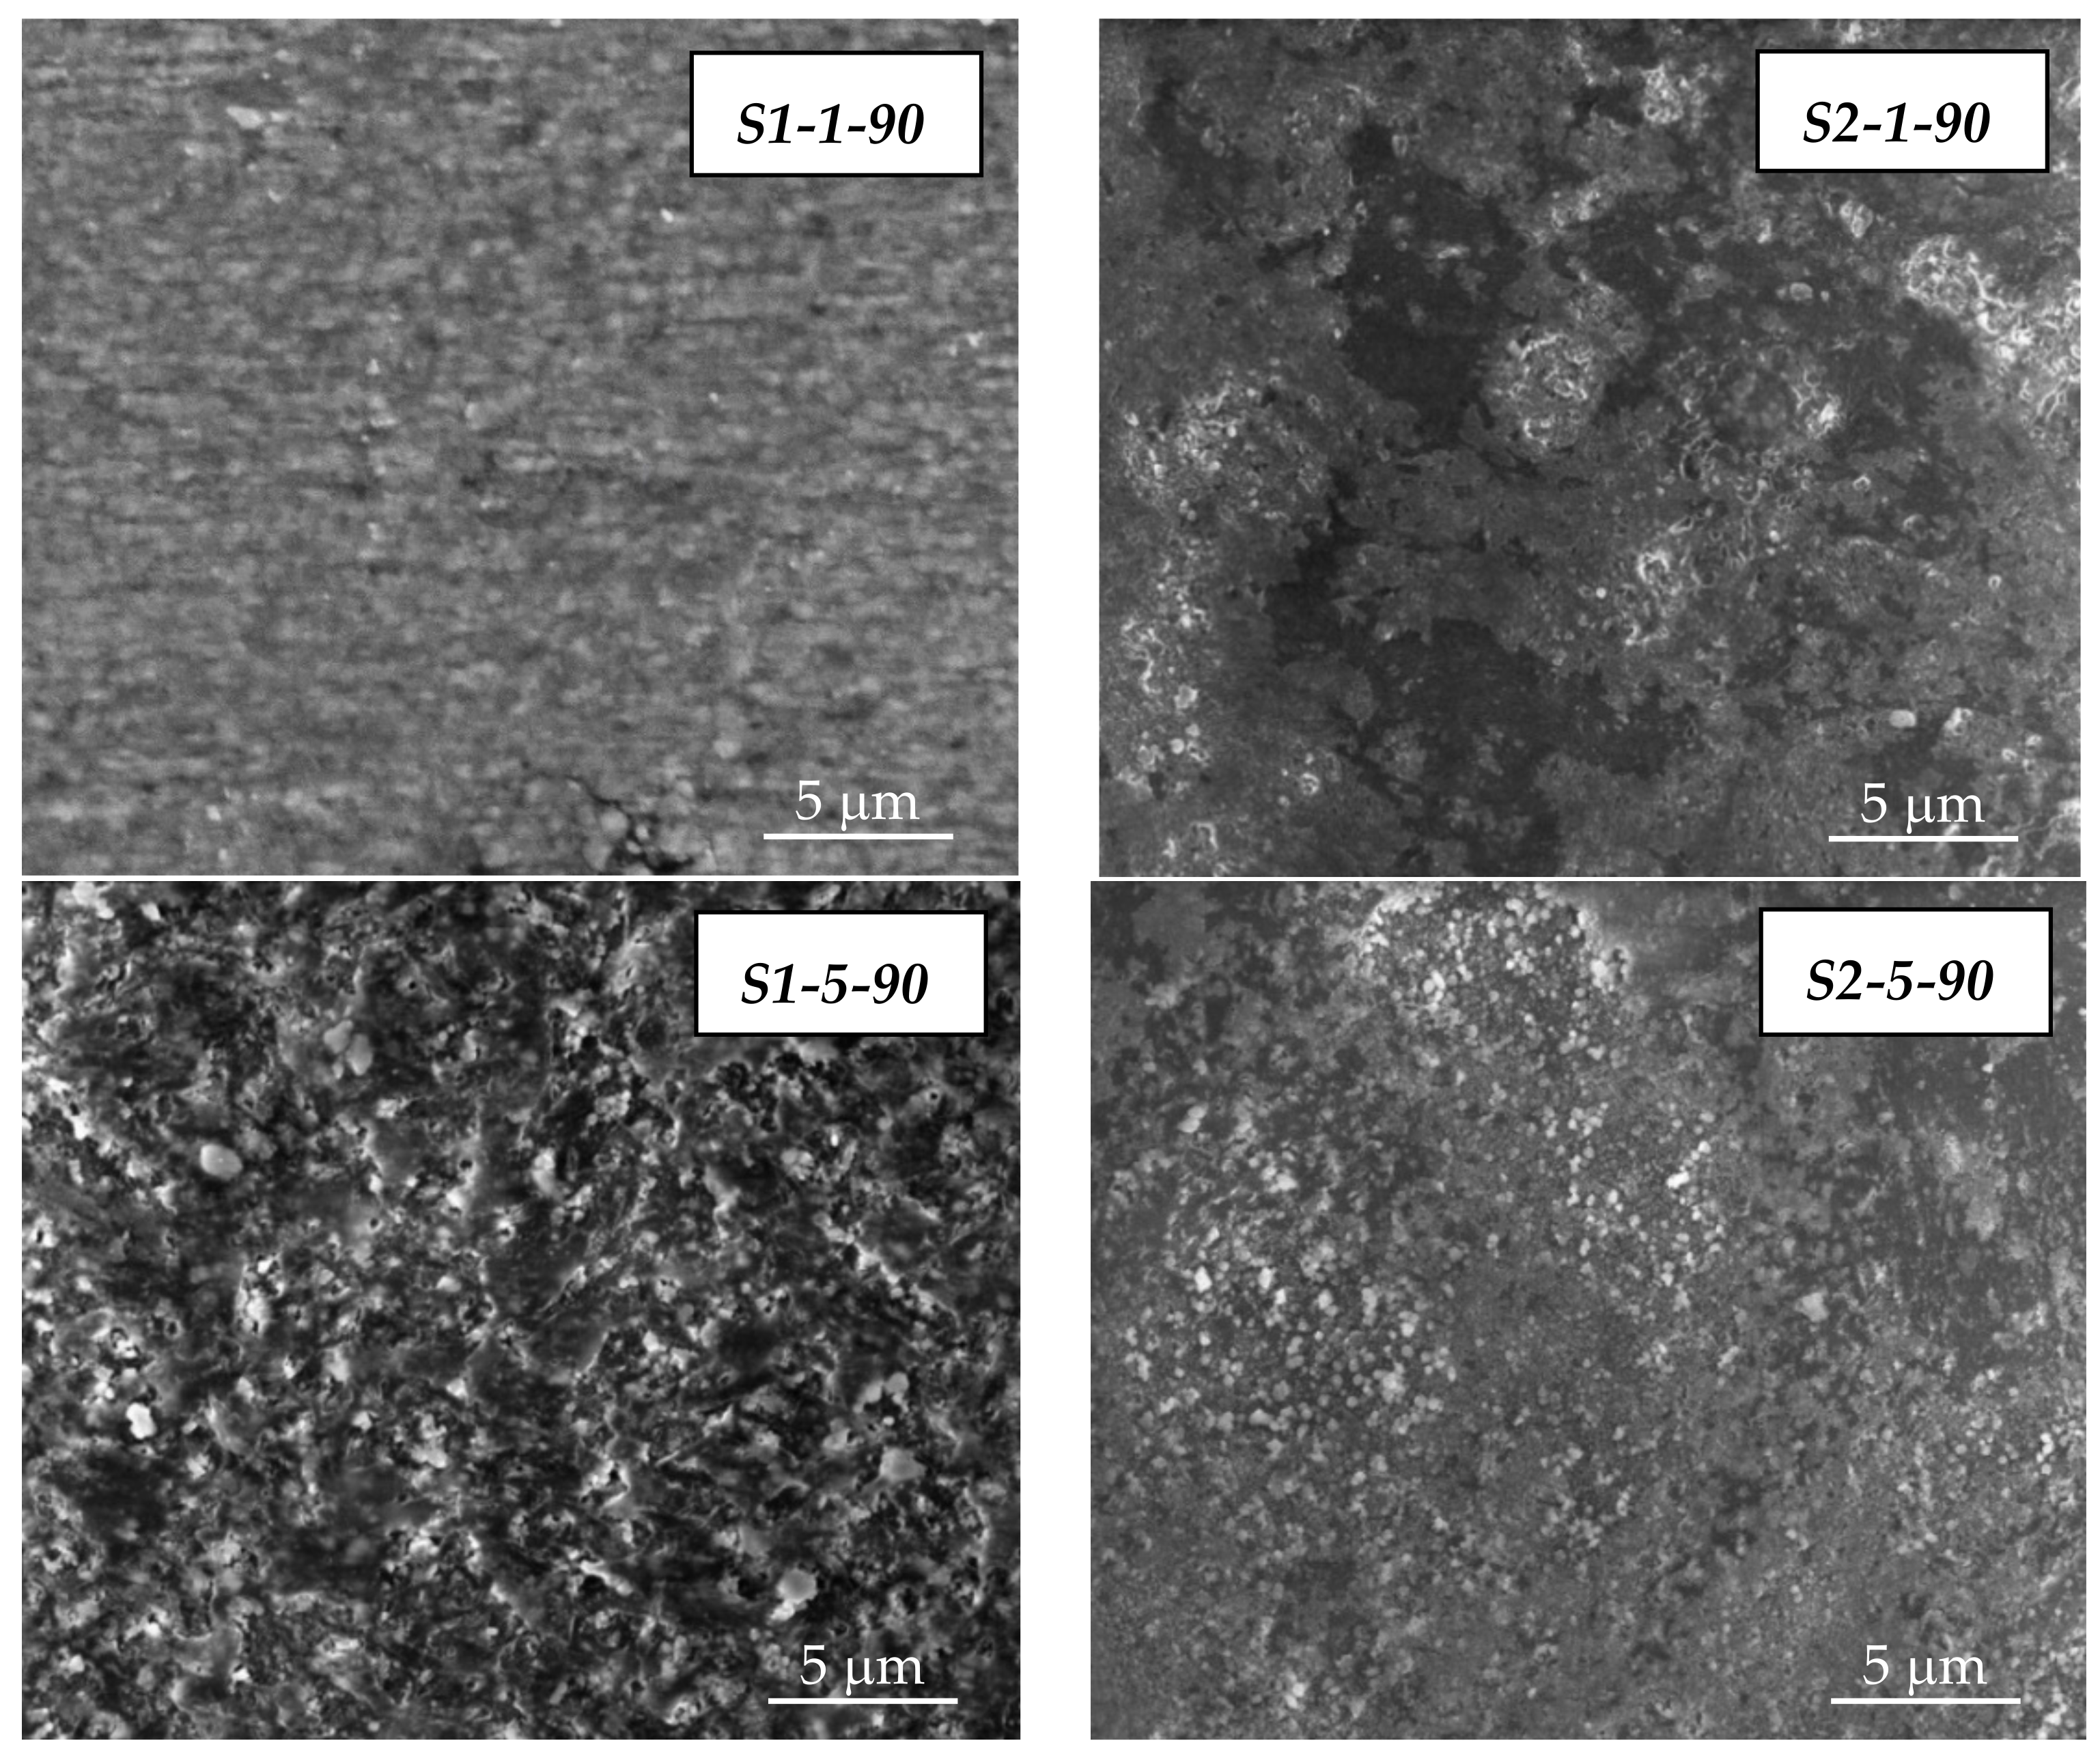
CdS-CdTe layers formed on the surface of PA 6 can be micro- or nano-derivatives; therefore, SEM analysis was used to study their formation and uniformity. Figure 2, Figure 3 and Figure 4 show the results of the surface morphology of the samples.
In the SEM images shown in Figure 2, it can be seen that the surface of the samples is somewhat rough and uneven. Only the surface of the S2-5-70 sample has areas of a lighter color, which can be identified as crystallites of the formed compounds. When comparing the images of samples S2-1-70 and S2-5-70, which were chalcogenized for different durations but treated with a cadmium acetate solution at the same temperature, it can be observed that more crystals formed on PA films chalcogenized for a longer time (5 h).
The micrographs in Figure 3 show that larger and irregularly shaped dendrites and pinholes formed on the surface of the samples, and separate crystallites and their agglomerates are also visible. Compositional variations are observed in SEM images of the obtained layers due to the longer chalcogenization time, and the surfaces of samples S1-5-80 and S2-5-80 are smoother.
The micrographs in Figure 4 show compact and smooth polycrystalline surfaces of the obtained layers on PA 6 films. It can be seen that the layers consist of densely packed grains when chalcogenized PA is treated with Cd(CH3COO)2 at 90 °C. Comparing samples S1 and S2, it can be seen that the layers on PA 6 films kept in acetic acid are more even, and more crystallites are observed on them than on the films that were boiled in distilled water. It can be stated that the crystallites and their agglomerates are often seen in SEM images and are not regular in shape, forming larger formations.
Table 1 shows the elemental composition of the layers formed on the surface of samples S1 and S2. The data obtained show that with an increase in the duration of chalcogenization and an increase in the temperature of the cadmium acetate solution, the number of cadmium and sulfur atoms in samples from group S1 decreases, while the amount of tellurium increases. It is possible that with a longer time of chalcogenization and a higher temperature of the Cd(CH3COO)2, more cadmium telluride or tellurium was formed.
As the chalcogenization time of the S2 samples increases, the percentage of tellurium increases and the percentage of sulfur in the layers decreases, but the change in the percentage of cadmium is not constant. It can be assumed that the amounts of tellurium and sulfur are different in these samples. In samples S2-1-70, S2-1-80 and S2-1-90, a large amount of sulfur and a small amount of tellurium are observed. The results obtained show that sulfur could be elemental or be part of the CdS compound, with the formation of a very small amount of CdTe.
Comparing the different surface preparation of the samples, it was found that in S1 samples, the percentage of Te atoms, S atoms and Cd atoms constantly increases or decreases depending on the conditions of the experiment. The change in the number of elements in S2 samples is unequal. Additionally, it can be seen that there is a significantly higher amount of sulfur in the samples chalcogenized for one hour, and a bigger amount of tellurium in the samples chalcogenized for five hours. This can be explained by stating that these films were treated with concentrated acetic acid; therefore, the absorbed TeS4O62− ions decomposed more quickly to form elemental tellurium.

3.2. XRD Analysis

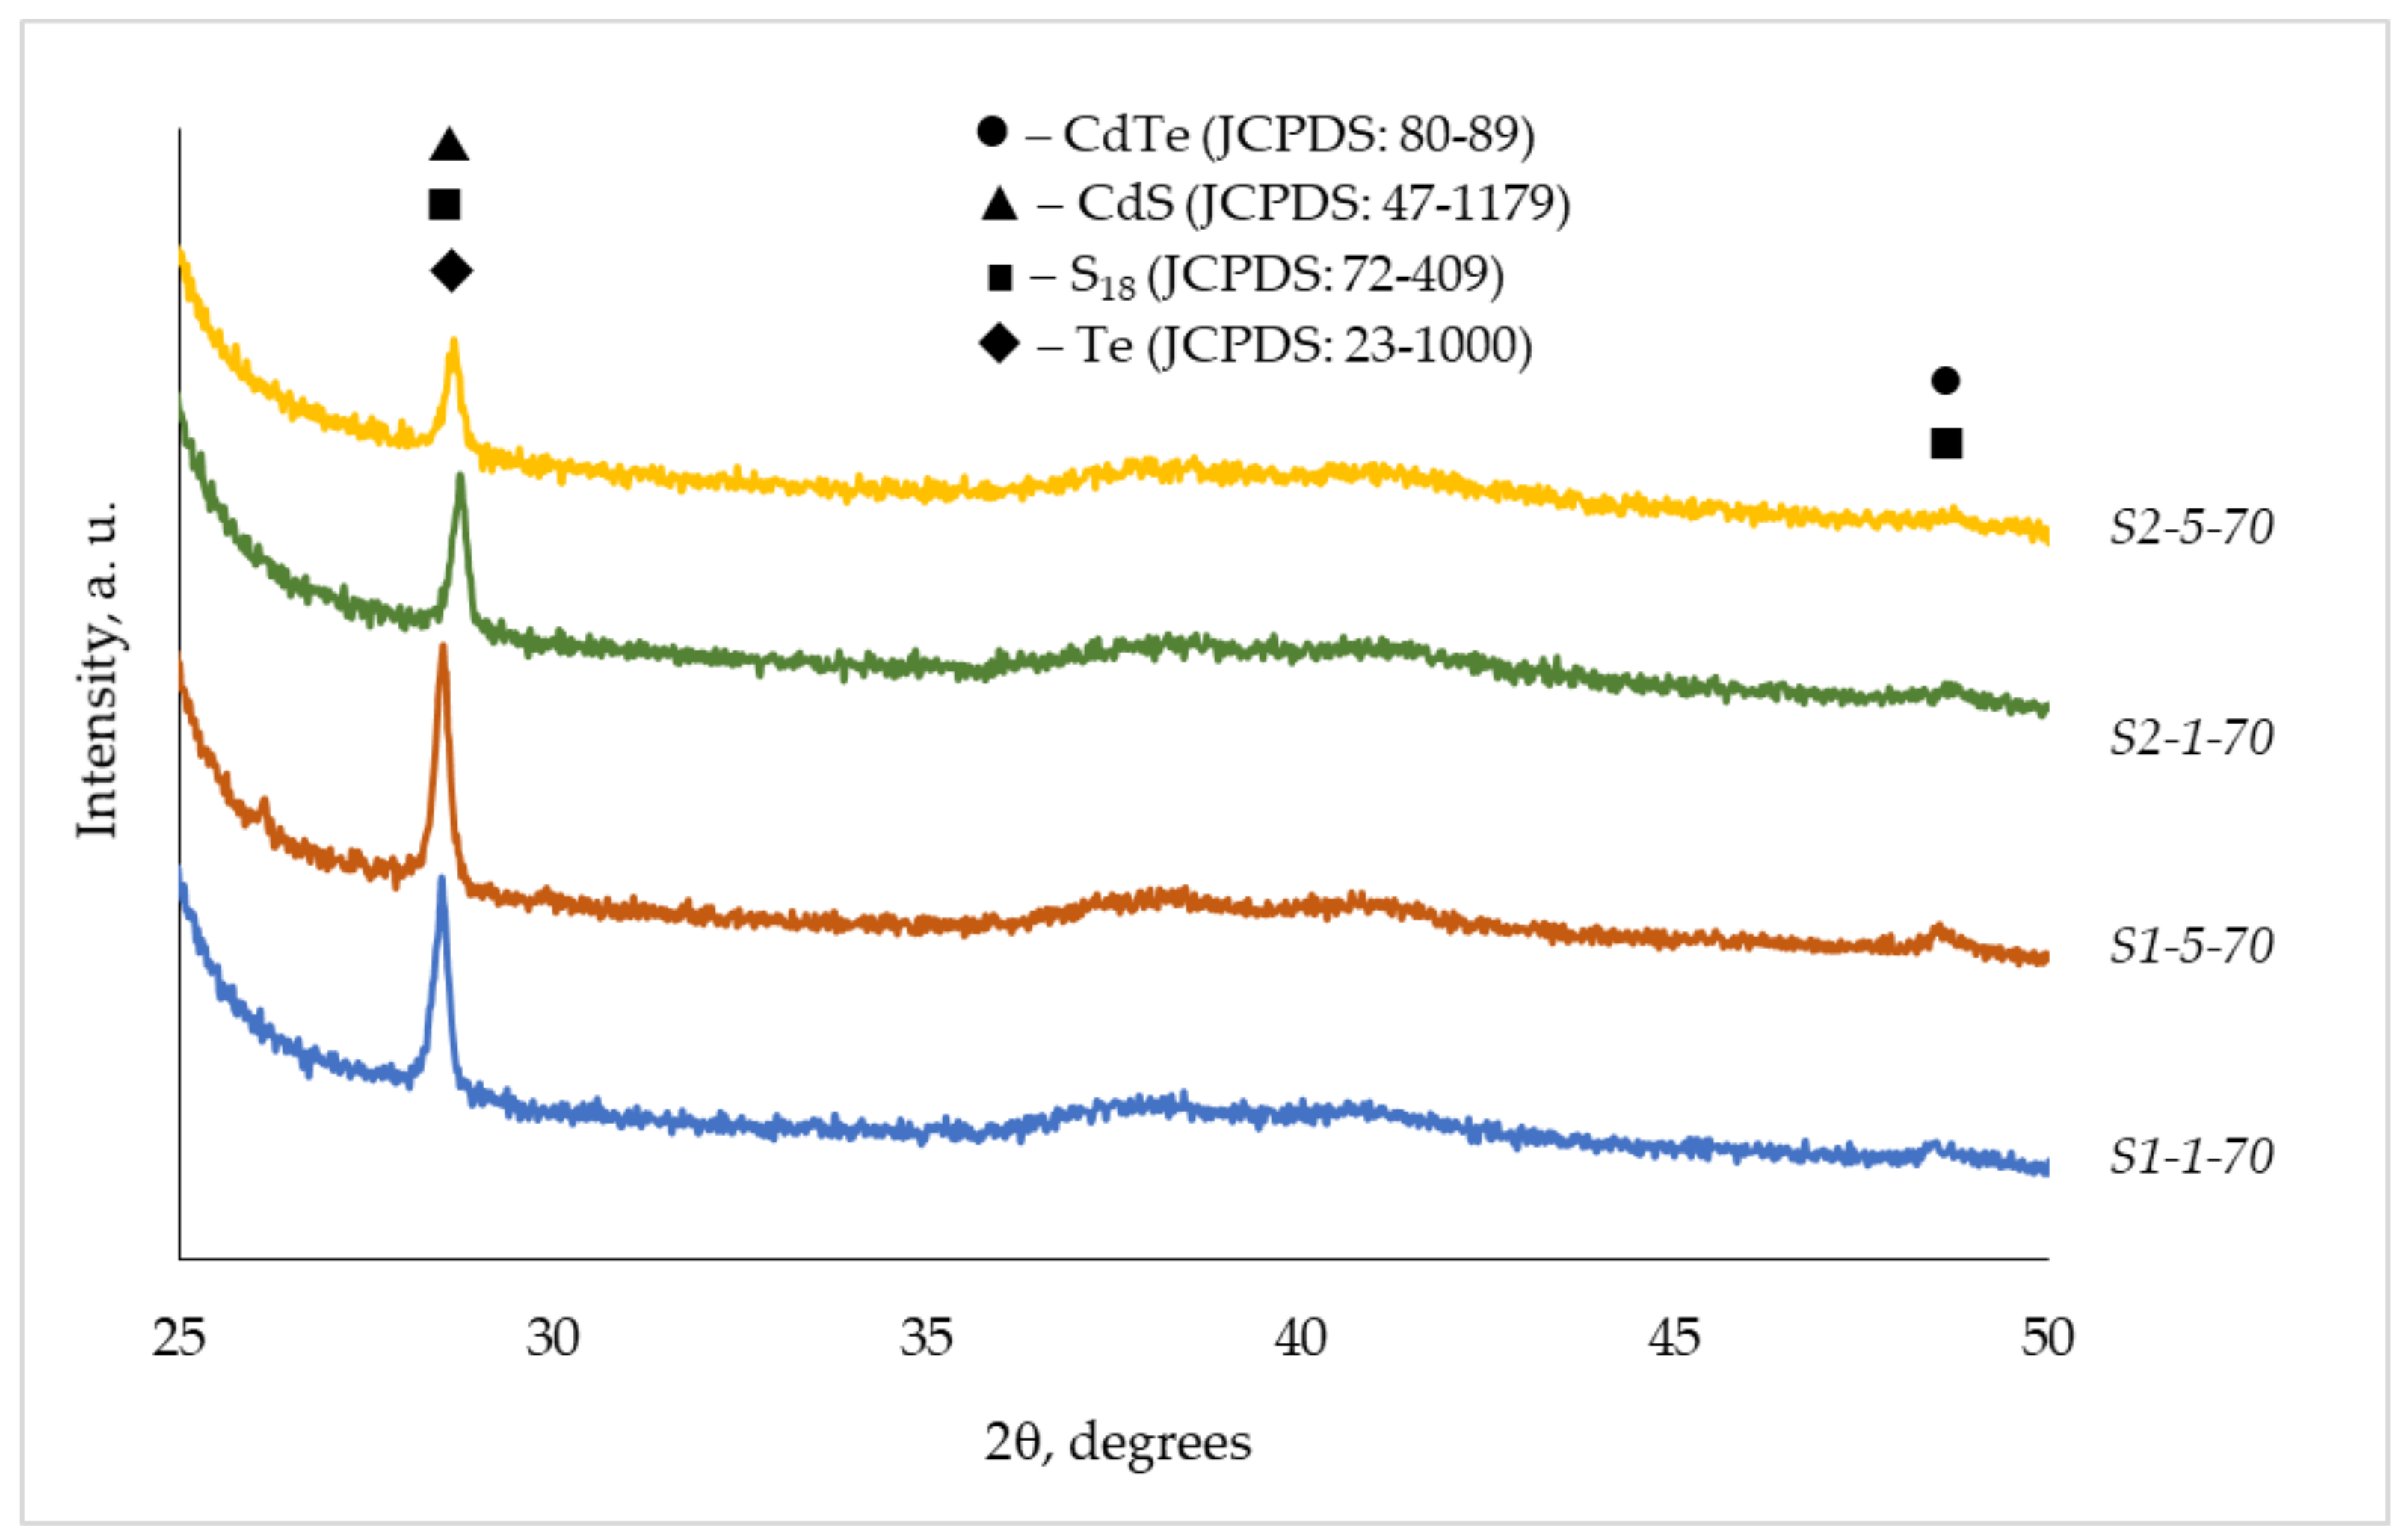
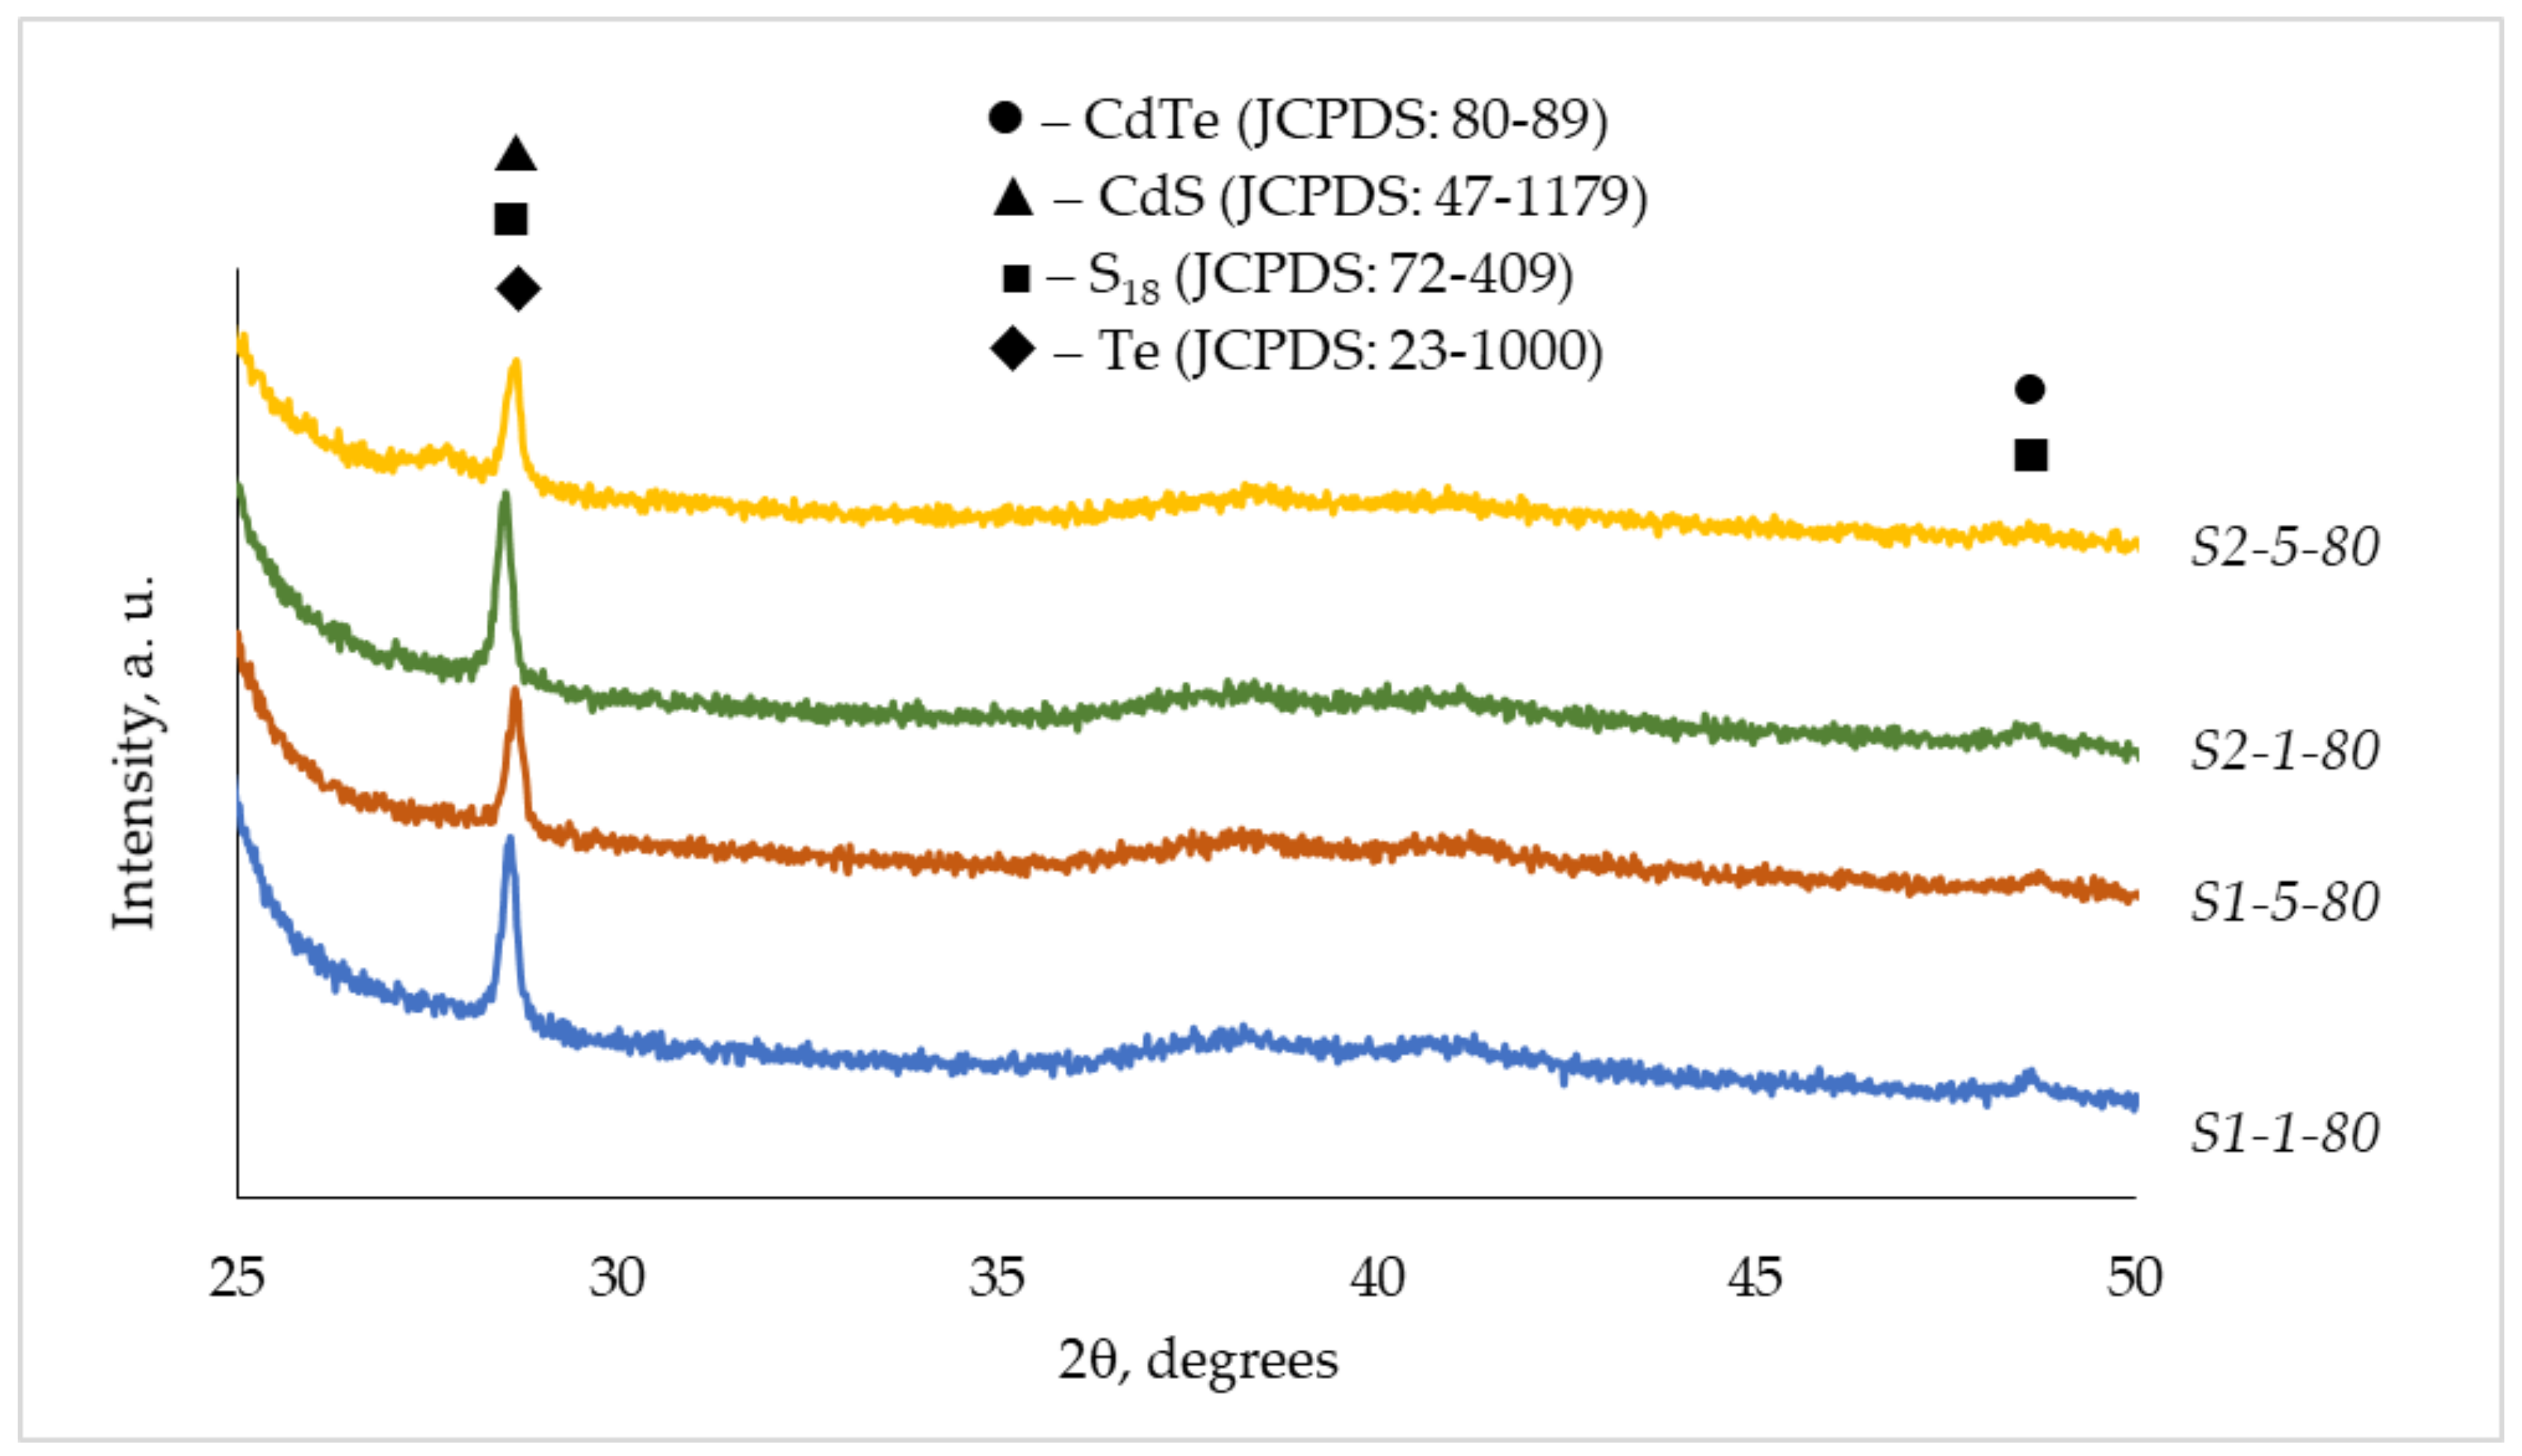
The structural characteristics of the obtained layers were studied by XRD analysis. The phase composition of the layers was determined by comparing their X-ray diffraction patterns with those of known cadmium chalcogenides. The intensity of the polyamide peaks at θ < 13° is several times higher than the intensity of the peaks of cadmium chalcogenides, so the region 2θ ≥ 25° was studied in more detail.
The analysis showed that chalcogenide layers consist of four phases: hexagonal CdTe (JCPDS: 80-89), orthorhombic CdS (JCPDS: 47-1179), rhombohedral tellurium (JCPDS: 23-1000) and orthorhombic sulfur (JCPDS: 72-409).
Values of the interplanar spacing (d) of those phases are given in Table 2. Based on the data in this table, it can be said that the peaks of CdS, elemental sulfur and tellurium or CdTe and S18 are at a very similar location and they can overlie each other.
From the data in Figure 5, Figure 6 and Figure 7, it can be seen that the peaks of the phases are more intense in the samples that were chalcogenized for 5 h and treated with cadmium acetate solution at higher temperatures. Sulfur and tellurium are found in samples kept longer in a solution of potassium telluropentathionate and treated with the Cd(CH3COO)2 solution at a higher temperature, so it can be concluded that only part of the TeS4O62− ions react with Cd2+ ions (Equation (1)), while the other part of the ions decompose (Equations (2) and (3)):
2TeS4O62−(aq) + 5Cd2+(aq) + 8H2O(l) → 2CdTe(s) + 3CdS(s) + 5SO42−(aq) + 16H+(aq)
TeS4O62−(aq) → S4O62−(aq) + Te(s)
S4O62−(aq) → SO42−(aq) + SO2(g) +2S(s)
The XRD graph analysis was applied to calculate crystallite size in the obtained layers on PA 6. As shown in Figure 5, Figure 6 and Figure 7, there is only one intensive peak and one non-intensive peak. The crystallite size was calculated using Scherrer’s Formula (4):
D h k l =   k ·   λ B h k l · c o s θ
where k is constant (k = 0.94), λ is the X-ray wavelength (1.54056 × 10⁻¹⁰ m), θ is the diffraction angle, and B h k l is the full width at half maximum (FWHM) of the peak.
From the data presented in Table 3, it can be seen that in the samples boiled in distilled water (S1), the size of the crystallites increases consistently with the increase of the chalcogenization time and the temperature of the cadmium acetate solution. The largest crystallites are found in samples chalcogenized for 5 h and kept in Cd(CH3COO)2 solutions at higher temperatures. Meanwhile, in the samples modified in acetic acid (S2), the crystallite size variation is not consistent. The smallest crystallites are found in the samples treated with a cadmium acetate solution at 80 °C, and the largest crystallites are found in the sample chalcogenized for 1 h in a potassium telluropentathionate salt solution and treated with a cadmium acetate solution at 90 °C. In summary, samples S1 and S2 have a very similar average size of crystalline particles in the obtained layers on the surface of PA 6 films.

3.3. AAS Analysis

The quantitative analysis of the obtained layers on PA 6 film was performed by atomic absorption spectroscopy.
Using this method, it was established that the concentrations of cadmium, sulfur, and tellurium in the layers on PA 6 (Table 4) depend on the method of the preparation of the polyamide film, the duration of chalcogenization, and the temperature of the Cd(CH3COO)2 solution. The results show that with the increase of chalcogenization time, the concentration of sulfur and tellurium increases, and it means that more TeS4O62− ions are sorbed-diffused into PA 6. Increasing the temperature of the cadmium acetate solution has a positive effect leading to higher concentrations of all elements. It can be seen that the concentration of elements is slightly higher in the S2 samples treated with concentrated acetic acid.

3.4. UV-Vis Spectroscopy

The optical absorbance studies of the obtained cadmium telluride-cadmium sulfide layers on the PA 6 substrate were carried out in the wavelength range of 200–800 nm, and the absorption spectra are illustrated in Figure 8 and Figure 9. The results show that the absorbance depends on the preparation of the PA film, the duration of chalcogenization and the temperature of the cadmium acetate solution.
Absorbance is high in the near-ultraviolet and visible regions of the solar spectrum, and has been found to decrease with wavelength from 400 to 800 nm and then become constant near the infrared region. Samples S1 demonstrate higher absorbance until 400 nm and then decrease; a similar trend is observed for samples S2 until 500 nm. A longer time of chalcogenization and a higher temperature of the cadmium salt solution increases the absorption intensity of the CdTe-CdSe layers. According to the literature [37], optical properties are strongly influenced by structural changes; for example, absorption decreases due to a decrease in the size of the crystallites. However, in our case, the crystallite size varied in a narrow range (36–42 nm) and did not affect the absorption. From Figure 8 and Figure 9, it can be seen that polyamide films chalcogenized for a longer time and kept in a cadmium acetate solution at a temperature of 80 and 90 °C have the highest absorption intensities. AAS analysis showed the highest concentrations of cadmium, sulfur and tellurium in samples S1-5-80, S1-5-90, S2-5-80 and S2-5-90, so it can be assumed that a higher content of cadmium telluride and cadmium sulfide in the layers increases light absorption. When comparing the surface preparation of PA 6, S2 samples have peak intensity values that are almost twice as high as the S1 samples. It was found in this study that the S2 samples kept in concentrated acetic acid have a higher content of cadmium and tellurium, and their surface is more uniform compared to the samples boiled in distilled water.

4. Conclusions

Scanning electron microscopy of the obtained layers on polyamide 6 showed that the samples boiled in distilled water have a rough surface, while the surface of the samples kept in acetic acid is more uniform and more irregularly shaped crystallites and their agglomerates are visible. The analysis of electronic dispersion spectroscopy established that the obtained layers consist of cadmium, tellurium and sulfur. Comparing different preparations of the surface of the polyamide, it was found that the amount of tellurium, sulfur and cadmium increases or decreases depending on the conditions of the experiment. X-ray diffraction analysis revealed that the phase composition of the obtained layers is similar; the layers are formed from phases of hexagonal cadmium telluride, orthorhombic cadmium sulfide, rhombohedral tellurium and orthorhombic sulfur, with a similar average size of their crystalline particles. Analysis of atomic absorption spectroscopy showed that the concentrations of cadmium, sulfur and tellurium in the layers on polyamide 6 depend on the method of preparation of the polyamide film, the duration of chalcogenization and the temperature of the cadmium acetate solution, and that the concentrations of the elements are slightly higher in the samples first treated with concentrated acetic acid. The results of UV-Vis spectroscopy show that the most intense absorption peaks are generated by samples kept in concentrated acetic acid, chalcogenized in a solution of potassium telluropentathionate for 5 h and treated with a solution of cadmium acetate at 80 and 90 °C.

Author Contributions

Conceptualization, S.Z. and I.A.; methodology, S.Z. and R.I.; software, R.I. and M.L.; validation, M.L., S.Z., R.I. and I.A.; formal analysis, R.I. and M.L.; investigation, M.L. and S.Z.; resources, S.Z. and I.A.; data curation, S.Z. and R.I.; writing—original draft preparation, S.Z. and I.A.; writing—review and editing, I.A.; visualization, M.L. and S.Z.; supervision, I.A.; funding acquisition, I.A. All authors have read and agreed to the published version of the manuscript.

Funding

Funding was provided by the Doctoral Fund of Kaunas University of Technology No. A-410, approved 26 June 2019.

Institutional Review Board Statement

Not applicable.

Informed Consent Statement

Not applicable.

Data Availability Statement

Not applicable.

Conflicts of Interest

The authors declare no conflict of interest.

References

  1. Wang, J.; Liu, S.; Mu, Y.; Liu, L.; Runa, R.A.; Su, P.; Yang, J.; Zhu, G.; Fu, W.; Yang, H. Synthesis of Uniform Cadmium Sulphide Thin Film by the Homogeneous Precipitation Method on Cadmium Telluride Nanorods and Its Application in Three-Dimensional Heterojunction Flexible Solar Cells. J. Colloid Interface Sci. 2017, 505, 59–66. [Google Scholar] [CrossRef]
  2. Dang, H.; Singh, V.P.; Guduru, S.; Hastings, J.T. Embedded Nanowire Window Layers for Enhanced Quantum Efficiency in Window-Absorber Type Solar Cells like CdS/CdTe. Sol. Energy Mater. Sol. Cells 2016, 144, 641–651. [Google Scholar] [CrossRef]
  3. Stechmann, G.; Zaefferer, S.; Konijnenberg, P.; Raabe, D.; Gretener, C.; Kranz, L.; Perrenoud, J.; Buecheler, S.; Tiwari, A.N. 3-Dimensional Microstructural Characterization of CdTe Absorber Layers from CdTe/CdS Thin Film Solar Cells. Sol. Energy Mater. Sol. Cells 2016, 151, 66–80. [Google Scholar] [CrossRef]
  4. Ojo, A.A.; Dharmadasa, I.M. 15.3% Efficient Graded Bandgap Solar Cells Fabricated Using Electroplated CdS and CdTe Thin Films. Sol. Energy 2016, 136, 10–14. [Google Scholar] [CrossRef]
  5. Suchikova, Y.; Kovachov, S.; Bohdanov, I.; Popova, E.; Moskina, A.; Popov, A. Characterization of CdxTeyOz/CdS/ZnO Heterostructures Synthesized by the SILAR Method. Coatings 2023, 13, 639. [Google Scholar] [CrossRef]
  6. Jain, S.K.; Sharma, G.; Vyas, S. Influence of Hole Interface Layer on the Performance of Cadmium Telluride-Based Thin Film Solar Cell. Mater. Today Proc. 2023, 74, 231–233. [Google Scholar] [CrossRef]
  7. Himanshu; Patel, S.L.; Thakur, A.; Kannan, M.D.; Dhaka, M.S. Analysis of Different Annealing Conditions on Physical Properties of Bi Doped CdTe Thin Films for Potential Absorber Layer in Solar Cells. Sol. Energy 2020, 199, 772–781. [Google Scholar] [CrossRef]
  8. Al-Kuhaili, M.F. Photoelectric Properties of Highly Conductive Samarium-Doped Cadmium Telluride Thin Films for Photovoltaic Applications. Sol. Energy 2021, 213, 163–171. [Google Scholar] [CrossRef]
  9. Bosio, A.; Rosa, G.; Romeo, N. Past, Present and Future of the Thin Film CdTe/CdS Solar Cells. Sol. Energy 2018, 175, 31–43. [Google Scholar] [CrossRef]
  10. Danielson, A.; Reich, C.; Drayton, J.; Bothwell, A.; Shimpi, T.; Sites, J.; Sampath, W. A Comprehensive Material Study of CdSeTe Films Deposited with Differing Selenium Compositions. Thin Solid Films 2023, 768, 139684. [Google Scholar] [CrossRef]
  11. Alam, A.; Kumar, S.; Singh, D.K. Cadmium Sulphide Thin Films Deposition and Characterization for Device Applications. Mater. Today Proc. 2022, 62, 6102–6106. [Google Scholar] [CrossRef]
  12. Gangawane, S.A.; Malekar, V.P.; Fulari, V.J. Effect of Electron Irradiation on the Crystallite Size, Grain Size and Band Gap Energy of Electrodeposited Cadmium Sulfide Thin Films. Mater. Today Proc. 2021, 47, 5722–5725. [Google Scholar] [CrossRef]
  13. Raj, R.; Kumari, N.; Monalisa; Rai, B.C.; Karimi, N.A.; Singh, R.K.; Kr, N. Physical Properties of Quantum Dot Cadmium Sulphide Nanomaterials for Its Applications, Prepared by Low Cost Chemical Method. Mater. Today Proc. 2022, 66, 1750–1755. [Google Scholar] [CrossRef]
  14. Meysing, D.M.; Reese, M.O.; Warren, C.W.; Abbas, A.; Burst, J.M.; Mahabaduge, H.P.; Metzger, W.K.; Walls, J.M.; Lonergan, M.C.; Barnes, T.M.; et al. Evolution of Oxygenated Cadmium Sulfide (CdS:O) during High-Temperature CdTe Solar Cell Fabrication. Sol. Energy Mater. Sol. Cells 2016, 157, 276–285. [Google Scholar] [CrossRef]
  15. Sinha, T.; Lilhare, D.; Khare, A. A Review on the Improvement in Performance of CdTe/CdS Thin-Film Solar Cells through Optimization of Structural Parameters. J. Mater. Sci. 2019, 54, 12189–12205. [Google Scholar] [CrossRef]
  16. Hasaneen, M.F.; Taya, Y.A.; Ali, H.M.; Ahmed, M.R. Optical and Structure Properties of CdTe/CdS Films under Influence of Both CdCl2 Heat Treatment and (O2 + Ar) Atmosphere. Appl. Phys. A Mater. Sci. Process. 2020, 126, 496. [Google Scholar] [CrossRef]
  17. Himanshu; Patel, S.L.; Agrawal, D.; Chander, S.; Thakur, A.; Dhaka, M.S. Towards Cost Effective Absorber Layer to Solar Cells: Optimization of Physical Properties to Cu Doped Thin CdTe Films. Mater. Lett. 2019, 254, 141–144. [Google Scholar] [CrossRef]
  18. Green, M.; Dunlop, E.; Hohl-Ebinger, J.; Yoshita, M.; Kopidakis, N.; Hao, X. Solar Cell Efficiency Tables (Version 57). Prog. Photovolt. Res. Appl. 2021, 29, 3–15. [Google Scholar] [CrossRef]
  19. Sarkar, K.; Jahan, S.; Dutta, B.; Chatterjee, S.; Gain, S.; Ghosh, S. Effects of Very Thin CdS Window Layer on CdTe Solar Cell. J. Mech. Contin. Math. Sci. 2019, 14, 14–29. [Google Scholar] [CrossRef]
  20. Zhang, X.; Liu, D.; Jiang, W.; Xu, W.; Deng, P.; Deng, J.; Yang, B. Application of Multi-Stage Vacuum Distillation for Secondary Resource Recovery: Potential Recovery Method of Cadmium Telluride Photovoltaic Waste. J. Mater. Res. Technol. 2020, 9, 6977–6986. [Google Scholar] [CrossRef]
  21. Nykyruy, L.I.; Yavorskyi, R.S.; Zapukhlyak, Z.R.; Wisz, G.; Potera, P. Evaluation of CdS/CdTe Thin Film Solar Cells: SCAPS Thickness Simulation and Analysis of Optical Properties. Opt. Mater. 2019, 92, 319–329. [Google Scholar] [CrossRef]
  22. Balakhayeva, R.; Akilbekov, A.; Baimukhanov, Z.; Usseinov, A.; Giniyatova, S.; Zdorovets, M.; Vlasukova, L.; Popov, A.I.; Dauletbekova, A. CdTe Nanocrystal Synthesis in SiO2/Si Ion-Track Template: The Study of Electronic and Structural Properties. Phys. Status Solidi 2021, 218, 2000231. [Google Scholar] [CrossRef]
  23. Yavorskyi, R.S.; Zapukhlyak, Z.R.; Yavorskyi, Y.S.; Nykyruy, L.I. Vapor Phase Condensation for Photovoltaic CdTe Films. Phys. Chem. Solid State 2017, 18, 410–416. [Google Scholar] [CrossRef]
  24. Han, J.; Jian, Y.; He, Y.; Liu, Y.; Xiong, X.; Cha, L.; Krishnakumar, V.; Schimper, H.J. Nanostructures of CdS Thin Films Prepared by Various Technologies for Thin Film Solar Cells. Mater. Lett. 2016, 177, 5–8. [Google Scholar] [CrossRef]
  25. Mccandless, B.E.; Moulton, L.V.; Birkmire, R.W. Recrystallization and Sulfur Diffusion in CdCl 2-Treated CdTe/CdS Thin Films. Prog. Photovolt. Res. Appl. 1997, 5, 249–260. [Google Scholar] [CrossRef]
  26. Compaan, A.D.; Gupta, A.; Lee, S.; Wang, S.; Drayton, J. High Efficiency, Magnetron Sputtered CdS/CdTe Solar Cells. Sol. Energy 2004, 77, 815–822. [Google Scholar] [CrossRef]
  27. Yimamu, A.U.; Afrassa, M.A.; Dejene, B.F.; Echendu, O.K.; Terblans, J.J.; Swart, H.C.; Motloung, S.J. Electrodeposition of CdTe Thin FIlms Using an Acetate Precursor for Solar Energy Application: The Effect of Deposition Voltage. Mater. Today Commun. 2023, 35, 105673. [Google Scholar] [CrossRef]
  28. Huang, L.; Wei, Z.L.; Zhang, F.M.; Wu, X.S. Electronic and Optical Properties of CdS Films Deposited by Evaporation. J. Alloys Compd. 2015, 648, 591–594. [Google Scholar] [CrossRef]
  29. Feldmeier, E.M.; Fuchs, A.; Schaffner, J.; Schimper, H.J.; Klein, A.; Jaegermann, W. Comparison between the Structural, Morphological and Optical Properties of CdS Layers Prepared by Close Space Sublimation and RF Magnetron Sputtering for CdTe Solar Cells. Thin Solid Films 2011, 519, 7596–7599. [Google Scholar] [CrossRef]
  30. Lu, C.; Zhang, L.; Zhang, Y.; Liu, S.; Liu, G. Fabrication of CdS/CdSe Bilayer Thin Films by Chemical Bath Deposition and Electrodeposition, and Their Photoelectrochemical Properties. Appl. Surf. Sci. 2014, 319, 278–284. [Google Scholar] [CrossRef]
  31. Han, J.F.; Liao, C.; Cha, L.M.; Jiang, T.; Xie, H.M.; Zhao, K.; Besland, M.P. TEM and XPS Studies on CdS/CIGS Interfaces. J. Phys. Chem. Solids 2014, 75, 1279–1283. [Google Scholar] [CrossRef]
  32. Kariper, A.; Güneri, E.; Göde, F.; Gümüş, C.; Özpozan, T. The Structural, Electrical and Optical Properties of CdS Thin Films as a Function of PH. Mater. Chem. Phys. 2011, 129, 183–188. [Google Scholar] [CrossRef]
  33. Mukherjee, A.; Satpati, B.; Bhattacharyya, S.R.; Ghosh, R.; Mitra, P. Synthesis of Nanocrystalline CdS Thin Film by SILAR and Their Characterization. Phys. E Low Dimens. Syst. Nanostruct. 2015, 65, 51–55. [Google Scholar] [CrossRef]
  34. Enríquez, J.P.; Mathew, X. Influence of the Thickness on Structural, Optical and Electrical Properties of Chemical Bath Deposited CdS Thin Films. Sol. Energy Mater. Sol. Cells 2003, 76, 313–322. [Google Scholar] [CrossRef]
  35. Schaffner, J.; Motzko, M.; Tueschen, A.; Swirschuk, A.; Schimper, H.J.; Klein, A.; Modes, T.; Zywitzki, O.; Jaegermann, W. 12% Efficient CdTe/CdS Thin Film Solar Cells Deposited by Low-Temperature Close Space Sublimation. J. Appl. Phys. 2011, 110, 064508. [Google Scholar] [CrossRef]
  36. Olav, F. Salts of Monotelluropentathionic Acid. Acta Chem. Scand. 1949, 3, 708–716. [Google Scholar]
  37. Zhu, Y.; Li, Z.; Chen, M.; Cooper, H.M.; Lu, G.Q.M.; Xu, Z.P. One-Pot Preparation of Highly Fluorescent Cadmium Telluride/Cadmium Sulfide Quantum Dots under Neutral-PH Condition for Biological Applications. J. Colloid Interface Sci. 2013, 390, 3–10. [Google Scholar] [CrossRef]
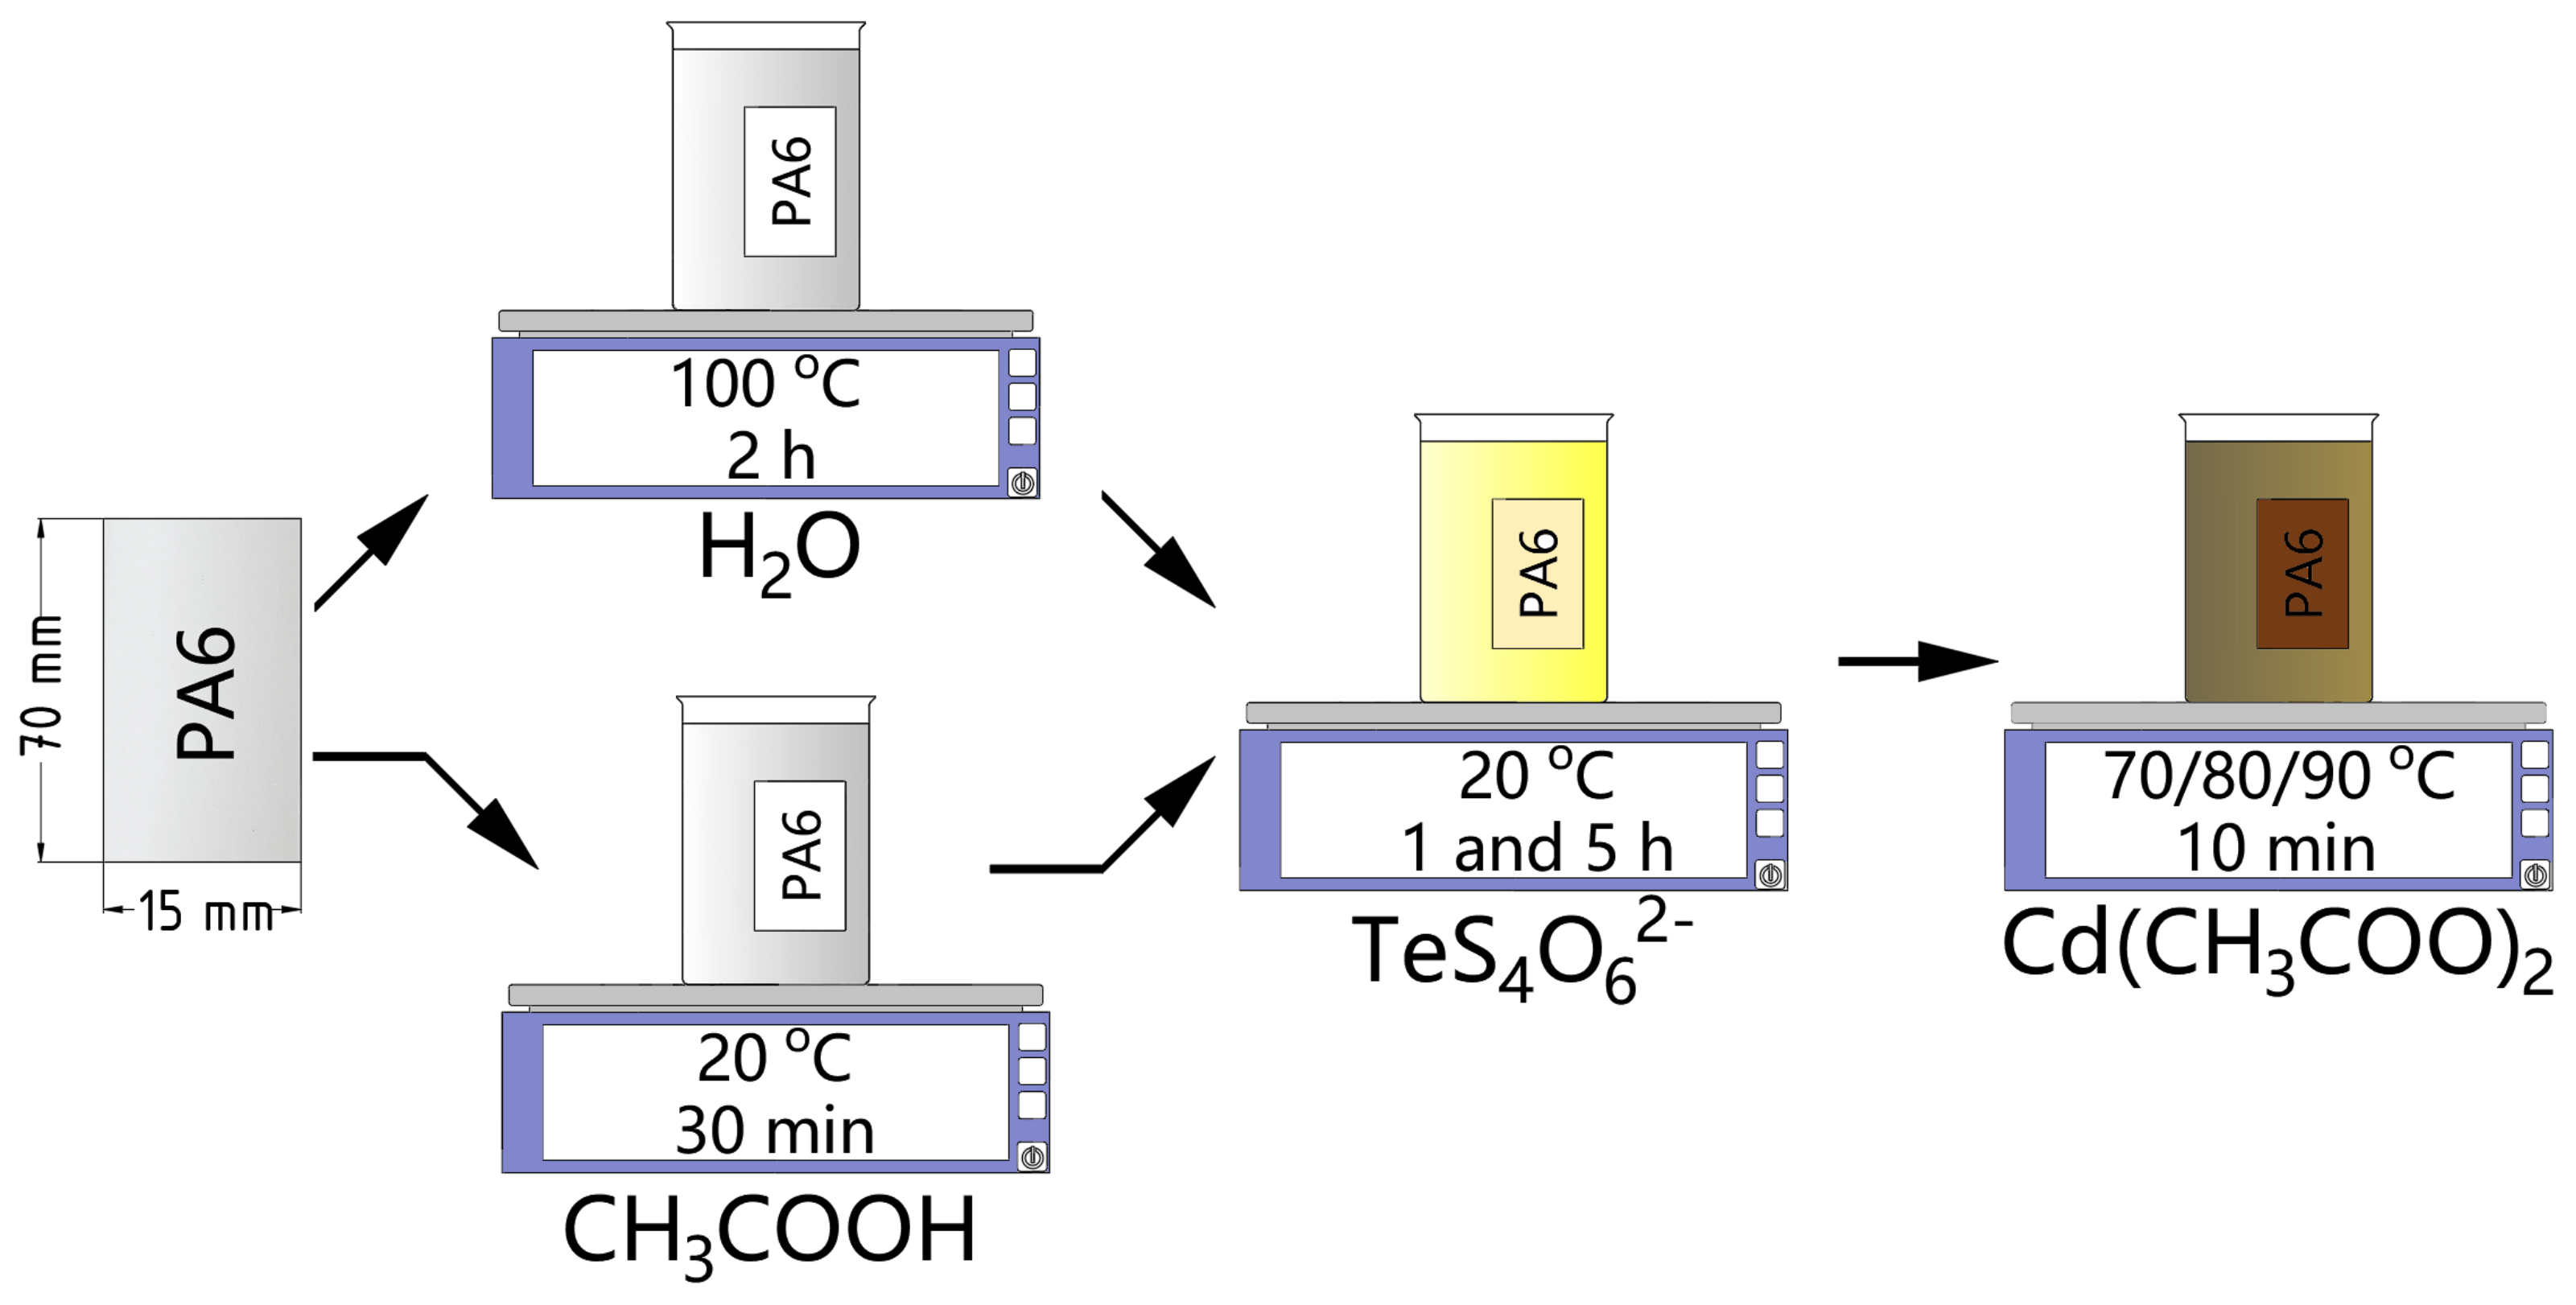
Figure 1. Schematic diagram of the preparation of films and the synthesis of cadmium sulfide–cadmium telluride layers.
Crystals 13 00730 g001
Figure 2. SEM images of chalcogenized PA 6 treated with cadmium acetate at 70 °C. Magnification 10,000×.
Crystals 13 00730 g002
Figure 3. SEM images of chalcogenized PA 6 treated with cadmium acetate at 80 °C. Magnification 10,000×.
Crystals 13 00730 g003aCrystals 13 00730 g003b
Figure 4. SEM images of chalcogenized PA 6 treated with cadmium acetate at 90 °C. Magnification 10,000×.
Crystals 13 00730 g004
Figure 5. X-ray diffractograms of chalcogenized PA 6 treated with cadmium acetate at 70 °C.
Crystals 13 00730 g005
Figure 6. X-ray diffractograms of chalcogenized PA 6 treated with cadmium acetate at 80 °C.
Crystals 13 00730 g006
Figure 7. X-ray diffractograms of chalcogenized PA 6 treated with cadmium acetate at 90 °C.
Crystals 13 00730 g007
Figure 8. UV-Vis absorption spectra of the samples S1.
Crystals 13 00730 g008
Figure 9. UV-Vis absorption spectra of the samples S2.
Crystals 13 00730 g009
Table 1. The elemental composition by EDX analysis.
Sample NoElements
Cd at. %S at. %Te at. %
S1-1-7052.9 ± 0.136.4 ± 0.010.7 ± 0.1
S1-5-7042.1 ± 0.326.2 ± 0.131.7 ± 0.3
S1-1-8050.1 ± 0.221.9 ± 0.128.0 ± 0.2
S1-5-8038.2 ± 0.617.2 ± 0.144.6 ± 0.9
S1-1-9028.0 ± 0.517.4 ± 0.154.6 ± 1.2
S1-5-9031.7 ± 0.616.0 ± 0.152.3 ± 1.1
S2-1-7025.8 ± 0.174.1 ± 0.00.1 ± 0.0
S2-5-7034.2 ± 0.516.8 ± 0.149.0 ± 1.0
S2-1-8021.5 ± 0.177.2 ± 0.11.3 ± 0.0
S2-5-8035.9 ± 0.617.4 ± 0.646.7 ± 1.0
S2-1-9019.6 ± 0.180.1 ± 0.10.3 ± 0.0
S2-5-9018.4 ± 0.229.4 ± 0.152.2 ± 0.5
Table 2. Comparison of observed interplanar spacings (d) with standard JCPDS data.
Observed DataCdTe (●)CdS (▲)S18 (■)Te (♦)
JCPDS: 80-89JCPDS: 47-1179JCPDS: 72-409JCPDS: 23-1000
d (Å)d (Å)hkld (Å)hkld (Å)hkld (Å)hkl
3.1209 3.12602 1 4
4 1 2
3.12511 2 23.11000 1 2
1.87111.87022 0 0 1.86980 1 4
Table 3. Average size of crystallites.
Sample NoAverage Crystallite Size, nmSample NoAverage Crystallite Size, nm
S1-1-7037.8 ± 1.8S2-1-7038.2 ± 1.9
S1-5-7036.5 ± 0.7S2-5-7039.7 ± 3.5
S1-1-8037.9 ± 1.7S2-1-8036.4 ± 0.9
S1-5-8040.1 ± 2.3S2-5-8037.6 ± 2.6
S1-1-9039.0 ± 2.9S2-1-9042.0 ± 3.1
S1-5-9040.1 ± 3.4S2-5-9037.5 ± 2.8
Table 4. The concentrations of cadmium, sulfur and tellurium in the obtained layers.
Sample NoElementsSample NoElements
Cd, μg/gS, μg/gTe, μg/gCd, μg/gS, μg/gTe, μg/g
S1-1-702.6541.545.20S2-1-705.7844.928.70
S1-5-705.9445.5418.41S2-5-7011.8769.9911.37
S1-1-808.0342.419.34S2-1-807.8143.7310.54
S1-5-8011.5053.8524.37S2-5-8031.28107.2477.26
S1-1-905.0938.566.51S2-1-9010.9959.5323.57
S1-5-908.1251.3819.52S2-5-9026.93105.0962.11
Disclaimer/Publisher’s Note: The statements, opinions and data contained in all publications are solely those of the individual author(s) and contributor(s) and not of MDPI and/or the editor(s). MDPI and/or the editor(s) disclaim responsibility for any injury to people or property resulting from any ideas, methods, instructions or products referred to in the content.