Article

Thermoelectric Properties of PbS Doped with Bi2S3 and Cu2S Prepared by Hydrothermal Synthesis and Spark Plasma Sintering

1
Hunan Provincial Key Laboratory of Thin Film Materials and Devices, School of Materials Science and Engineering, Xiangtan University, Xiangtan 411105, China
2
Hunan Provincial Key Laboratory of Health Maintenance for Mechanical Equipment, Hunan University of Science and Technology, Xiangtan 411201, China
3
Key Laboratory of Low Dimensional Materials and Application Technology of Ministry of Education, School of Materials Science and Engineering, Xiangtan University, Xiangtan 411105, China
*
Author to whom correspondence should be addressed.
Crystals 2023, 13(5), 764; https://doi.org/10.3390/cryst13050764
Submission received: 13 April 2023 / Revised: 28 April 2023 / Accepted: 2 May 2023 / Published: 4 May 2023
(This article belongs to the Topic High-Performance Multicomponent Alloys)

Abstract

:
Hierarchical PbS powders doped with different contents of Bi2S3 and Cu2S were synthesized using the hydrothermal method. Subsequently, the powders were subjected to spark plasma sintering (SPS) for consolidation into bulk ceramics. X-ray photoelectron spectroscopy results showed that Bi2S3 and Cu2S were doped into PbS successfully. The effect of doping with different Bi2S3 and Cu2S contents on thermoelectric performance was investigated systematically. The results showed that pure PbS was an n-type semiconductor, and Bi2S3 doping or Bi2S3-Cu2S co-doping could decrease the thermal conductivity of PbS effectively. PbS doped with 1% Bi2S3 exhibited a moderate Seebeck coefficient, high electric conductivity, and low thermal conductivity simultaneously, thus attaining a maximum figure of merit ZT of 0.55 at 773 K. PbS doped with 1% Bi2S3-1% Cu2S exhibited an enhanced power factor and reduced thermal conductivity at an elevated temperature; the maximum ZT value obtained at 773 K was 0.83, which is more than twice that of pure PbS at 758 K (0.29), as a result.

1. Introduction

The rapid development of society increasing demand for energy results in energy crises and environmental pollution problems. Therefore, it is very important to find environmentally friendly sources of clean energy and improve energy efficiency. Thermoelectric materials are receiving increasing attention due to their ability to directly convert waste heat into electricity [1,2,3,4,5,6,7,8,9]. Thermoelectric devices, during use, have the advantages of no noise, no wear, no vibration, small size, light weight, simple structure, high reliability, long life, non-toxicity, no pollution to the environment, etc. They have broad application prospects for the utilization of waste heat and solar photothermal composite power generation. At the same time, the application of thermoelectric devices can also achieve efficient cooling and heating without any pollution. The thermoelectric device’s efficiency ( η T E ) is determined by the dimensionless figure of merit (ZT), which serves as a crucial indicator evaluating its performance. In η T E = ( 1 + Z T 1 ) ( T H T C ) / T H ( 1 + Z T + T C / T H ) , ZT is figure of merit of corresponding material; TC and TH are the temperatures at the cold end and hot end of the thermoelectric devices; and ZT is defined as Z T = ( S 2 σ T ) / κ , where, S, σ, κ, and T denote the Seebeck coefficient, electrical conductivity, thermal conductivity of material, and absolute temperature, respectively. Thus, for the purpose of achieving high-efficiency thermoelectric conversion, the significance of high electrical conductivity is just as important as low thermal conductivity; however, the thermal and electric conductivities are coupled together, and when a material has high electrical conductivity, it usually also has high thermal conductivity [10,11,12]. These mutual influences and couplings make it difficult to substantially improve the conversion efficiency of thermoelectric devices to meet market needs, thus restricting their large-scale applications. Several techniques have been used to conquer this challenge, such as using multiphase composites [13,14,15,16], quantum dot superlattice structures [17,18,19,20,21,22], and nanowires [22,23,24,25,26]. Particularly, phonons’ contribution to thermal conductivity can be reduced using spark plasma sintering (SPS), leading to nanocrystalline thermoelectrics with enhanced phonon scattering occurring at the boundaries and interfaces between grains [27,28,29,30]. Among the various thermoelectric materials, PbTe-based thermoelectric materials are the best for power generation applications, and are considered as one of the most promising medium-temperature thermoelectric materials [31,32,33,34,35,36]. PbTe-based thermoelectric materials have been widely used in the military and aerospace fields due to their excellent properties. However, due to their poor mechanical properties, the toxicity of lead, and the fact that tellurium is rare and expensive, their large-scale commercial application is limited. PbS is a potential alternative for PbTe, owing to its stable and simple structure, low price, abundant reserves of S, and recently reported good thermoelectric properties [37,38,39]. For example, reports have indicated that the figure of merit ZT can be improved to 1.1 because the second phase can be doped into PbS at a temperature of 923 K [40]. In recent years, PbS powders with different shapes (dendritic structures [41,42], hyperbranched stars [43,44], nanorods [45,46,47], nanotubes [48], and other shapes [49]) have also been synthesized via the self-assembly method. Encouraged by these works on PbS [50,51], we synthesized PbS hierarchical powders with different Bi2S3 and Cu2S doping contents using the hydrothermal method, which is simple and inexpensive when compared to the melting method [52,53]. Then, we consolidated them into bulk ceramics via SPS and measured their thermoelectric performance. The experiment results indicate that the thermal conductivity of PbS samples with either Bi2S3 doping alone or Bi2S3 and Cu2S co-doping is reduced significantly compared with that of pure PbS. The maximum ZT value of PbS doped with 1% Bi2S3-1% Cu2S was 0.83 at 773 K, which is a relatively high value for PbS-based materials at the specified temperature.

2. Materials and Methods

The synthesis process for obtaining Bi2S3- and Cu2S-doped PbS is as follows: 4.3 g Pb(CH3COO)2·3H2O (99%, Alfa Aesar, Haverhill, MA, USA) and appropriate amounts of Bi(NO3)3·5H2O (98%, Alfa Aesar) and Cu(CH3COO)2·H2O (99.9%, Alfa Aesar) were dissolved into the mixed solvent of deionized water and glycol (98%, Alfa Aesar) at a 3:1 volume ratio. Then, an appropriate amount of thiourea (99%, Alfa Aesar) was added into the above solutions under stirring; then, the mixed solutions were moved to a 50 mL Teflon-lined stainless steel autoclave where the mixed solutions were held at a temperature of 180 °C for 24 h. After cooling to room temperature, the precipitates were collected via centrifugation, then washed several times using deionized water and ethanol (99.8%, Alfa Aesar) sequentially. Finally, the synthesized powders were dried in a vacuum oven at 60 °C for 6 h, then consolidated into bulk ceramics via spark plasma sintering (SPS-211Lx).
For the SPS process, the powders were first loaded into a graphite die with a diameter of 13 mm and maintained at a pressure of 45 MPa. Then, they were heated to 450 °C for 10 min by passing a large amount of DC current (100–500 A) through the die, and the heating rate was controlled at approximately 100 °C/min by adjusting the current. Then, the pressure was instantaneously released before turning off the heating current to prevent the sample from cracking. The entire process was executed within a vacuum chamber (~10−6 Torr) to prevent the oxidization of the graphite. The SPS specimens were disk-shaped, with dimensions of Φ 13 mm × 4 mm.
X-ray diffraction (XRD) (Rigaku D/max-rA, Rigaku, Tokyo, Japan), transmission electron microscopy (TEM) (JEM-2100, Rigaku, Tokyo, Japan) with selected area electron diffraction (SAED), and scanning electron microscopy (SEM) (LEO 1525, Carl Zeiss, Oberkochen, Germany) were used to identify the crystal structure and the morphology of sample. X-ray photoelectron spectroscopy (XPS; K-Alpha 1063, Thermo Fisher Scientific, Waltham, MA, USA) was employed for the purpose of analyzing the atomic composition and element valence. The thermoelectric properties were evaluated along the specimen surface perpendicular to the pressing direction during the SPS process. The Seebeck coefficient and electrical resistivity were measured using a Seebeck coefficient/electric resistance measuring system (ZEM-2, ULVAC-RIKO, Yokohama, Japan). The thermal conductivity was calculated by the product of thermal diffusivity, specific heat, and density. The thermal diffusivity was assessed using a laser flash apparatus (LFA427, NETZSCH, Bavaria, Germany). Before measurement, the sample was coated with a thin layer of graphite-by-graphite spray (Graphite33) to improve its thermal homogeneity. The volumetric specific heat capacity was determined through the utilization of a differential scanning calorimeter (DSC 404 F3, NETZSCH, Bavaria, Germany). The density of the sample was measured using the Archimedes method. The thermal conductivity was calculated via the equation κ = ρ D C p ( κ is the thermal conductivity, ρ is the density, D is the thermal diffusivity coefficient, and Cp is the specific heat capacity).

3. Results and Discussion

3.1. Thermoelectric Properties of PbS Doped with Bi2S3

The crystal structure of the PbS powders doped with varying amounts of Bi2S3 was measured by XRD, as shown in Figure 1a. All XRD peaks exhibited a cubic PbS crystal structure, and no obvious peaks of Bi2S3 were shown owing to its low content. The sharp diffraction peaks of the four samples indicated the superior crystallinity of the synthetic PbS-based powders, with preferential orientation along the (111), (200), and (220) planes in the four specimens. As shown in Figure 1b, the XPS results demonstrate that Bi2S3 was doped into PbS. When compared to the pure PbS, PbS doped with 5% Bi2S3 showed an extra peak of Bi 4f at a binding energy value of 164 eV, which confirms that the Bi2S3 was successfully doped into PbS; the peaks of O (1s) and C (1s) corresponded to the oxidation reaction in the air. The fine XPS spectra of Bi 4f peaks are presented in Figure 1c. The spectrum of the Bi 4f state consisted of two peaks at 159.2 and 164.5 eV, respectively, which also illustrates the presence of Bi3+ cations [54,55,56] and demonstrates that during the synthesis, the valence of the component did not change due to a lack of even surface oxidation by the air.
Figure 2 shows the SEM and TEM results of pure PbS and PbS doped with 1% Bi2S3. It can be observed that the primary morphology of the powders synthesized at 180 °C was dendritic, with hyperbranching and a small amount of star-shaped structures. Figure 2a,b show that the average grain size of Bi2S3-doped PbS was smaller compared to pure PbS, which was due to the addition of surfactant ethylene glycol, which reduced the surface tension of the solution and promoted nucleation, resulting in a decreased grain size. Moreover, after doping with Bi2S3, there was agglomeration of some fine particles on the surface of the dendritic structure. This was mainly due to the addition of ethylene glycol, which caused fractures in the dendritic and star shapes, forming many fine particles and small dendritic particles. The new generated Bi2S3 particles were adsorbed on the surfaces of the PbS crystals to reduce the surface energy. With the increase in the Bi2S3 doping amount, more and more Bi2S3 particles were formed, and the agglomeration of Bi2S3 particles occurred. Smaller grain sizes increased the interface between the grains, which was beneficial for decreasing the thermal conductivity of the materials. This led to an improvement in the thermoelectric performance of the material.
Figure 2c,d show the dendritic and star-shaped morphologies of the synthetic powders, which are composed of hierarchical grains. High-resolution TEM (HRTEM) confirmed the cubic structure of PbS doped with 1% Bi2S3, where the lattice spaces were measured to be 0.346 nm along the ( 1 1 ¯ 1 ) plane and 0.347 nm along the ( 1 1 ¯ 1 ¯ ) plane, as shown in Figure 2e. However, when comparing Figure 2e with Figure 2f, we observed minor difference in the lattice space at different micro-areas of the sample in the same plane, which indicates that the lattice distortion induced by doping Bi2S3 was inhomogeneous.
The effect of temperature on the thermoelectric performances of PbS doped with x% (x = 0, 1, 3, 5) Bi2S3 is shown in Figure 3. Figure 3a shows that the Seebeck coefficients of all samples were negative, which indicates that the Bi2S3-doped PbS was an n-type semiconductor and electrons were the major carriers. The absolute values of the Seebeck coefficients (S) increased with the increasing temperature, but obviously decreased with the increase in the doping amount of Bi2S3. The absolute values of the Seebeck coefficients corresponding to PbS doped with 1, 3, and 5% Bi2S3 were 264.5, 187.9, and 178.8 μV K−1 at 773 K, respectively, which are obviously lower than that of 360 μV K−1 for pure PbS at 758 K. These results are consistent with previously reported results [40].
Figure 3b shows that the electrical conductivity (σ) decreased with the increasing temperature for samples doped with x% (x = 0, 3, 5) Bi2S3, which indicates a typical metallic transport behavior; however, the electrical conductivity increased with the increasing temperature for PbS doped with 1% Bi2S3 sample. Moreover, repeated tests on the same and different samples maintained the same trend. This phenomenon can likely be explained as follows: when PbS is doped with 1% Bi2S3, the total carrier concentration of the material is significantly lower owing to the powerful surface adsorption effect of hydrothermal synthesized powder, which results in low electrical conductivity. On the contrary, an increase in the percentage of doped Bi2S3 leads to a rise in electron carrier concentration, showing a typical n-type electrical conductivity of the semiconductor as did doping with 3% and 5% of Bi2S3. At 773 K, the corresponding electric conductivities of PbS doped with 1, 3, and 5% of Bi2S3 were 95.3, 136.6, and 139.2 S cm−1, respectively. It can be observed that the electric conductivity of the samples increased gradually with the increasing content of Bi2S3 at high temperatures.
Based on the above values of electrical conductivity and Seebeck coefficients, Figure 3 shows the power factor PF values of the four samples, which were calculated using the formula. The power factors of the PbS samples doped with x% (x = 1, 3, 5) Bi2S3 increased sharply as the temperature increased, up to 573 K, and tended to stabilize at higher temperatures of approximately 773 K. The corresponding power factors of PbS doped with 1, 3, and 5% Bi2S3 at 773 K were 6.67, 4.82, and 4.45 μW cm−1 K−2, respectively. The pure PbS showed good electrical properties at low temperatures, while the PbS doped with 1% Bi2S3 had better electrical properties at high temperatures. Obviously, the power factor of PbS with 1% Bi2S3 doping had the maximum value, owing to its higher Seebeck coefficient.
Figure 3d shows that the total thermal conductivity decreased with the increasing temperature and doping content of Bi2S3 simultaneously. The thermal conductivities for 1, 3, and 5% Bi2S3 doping were 0.93, 0.79, and 0.87 W m−1 K−1 at 773 K, respectively. The thermal conductivity of PbS doped with Bi2S3 was demonstrated to be lower than that of pure PbS. Figure 3e illustrates the lattice thermal conductivity ( κ L = κ κ e ) of the samples, where the electronic thermal conductivity was calculated based on the Wiedemann–Franz law as κ e = L σ T and the Lorenz number L was set as 2.45 × 10⁻⁸ W Ω K−2 [57]. It was found by calculation that the electronic thermal conductivity value ( κ e ) was one order of magnitude smaller than the total thermal conductivity ( κ ), so the lattice thermal conductivity accounted for the main portion of the total thermal conductivity. The ratio of lattice thermal conductivity ( κ L ) to κ indicated that the total thermal conductivity ( κ ) was dominated by phonon transport. The κ e values increased with the increasing temperature; then, the decrease in thermal conductivity was primarily attributed to the rapid decrease in the lattice thermal conductivity due to the formation of point defects and fine grain sizes by doping [58,59,60].
According to the measured electrical conductivity, Seebeck coefficient, and thermal conductivity, we calculated the ZT values as shown in Figure 3f. The ZT values of all samples increased with the increasing temperature. The ZT values corresponding to 1, 3, and 5% Bi2S3 doping were 0.55, 0.47, and 0.40 at 773 K, respectively, while that of the pure PbS was only 0.29 at 758 K. Among all the samples, PbS doped with 1% Bi2S3 showed the maximum ZT value, and its thermoelectric performance was improved by nearly 90% compared with that of the pure PbS, which can be attributed to an increase in the power factor alongside a decrease in thermal conductivity. Table 1 lists the detailed transport properties of PbS doped with different Bi2S3 doping amounts.

3.2. Thermoelectric Properties of PbS Co-Doped with Bi2S3 and Cu2S

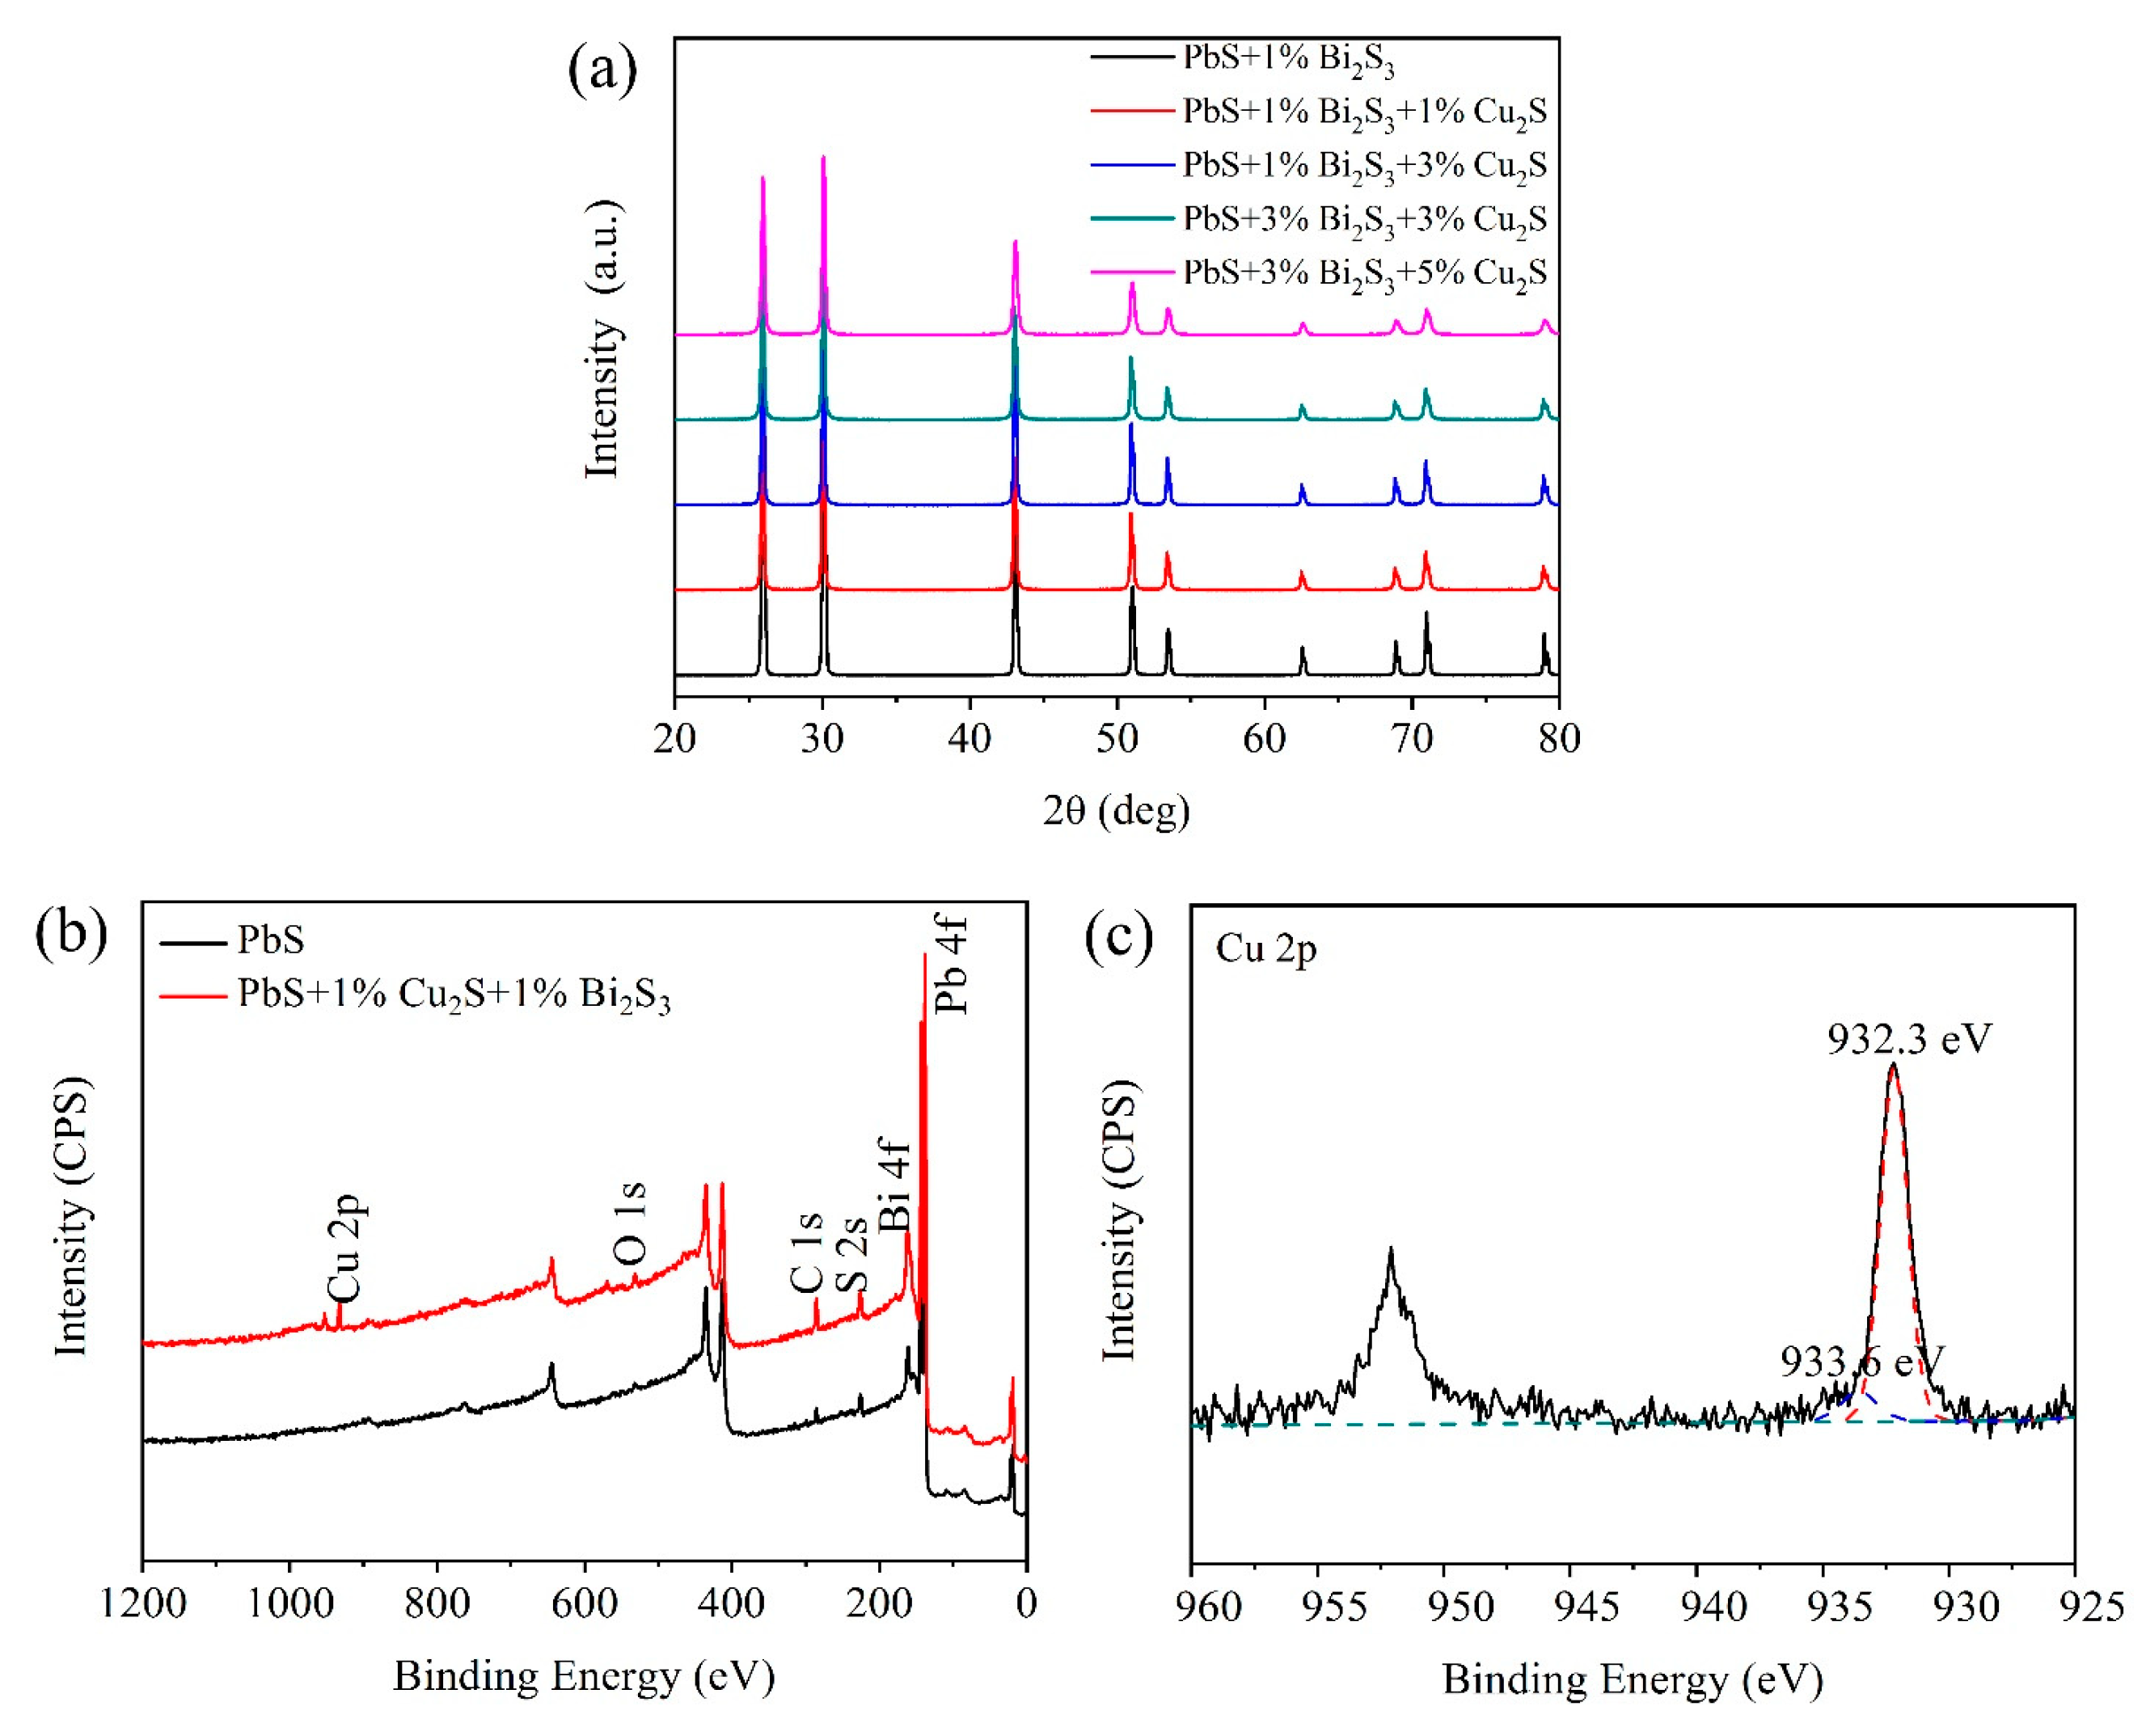
Figure 4a shows the XRD peaks corresponding to the cubic structure of PbS. The peak positions observed are consistent with those shown in Figure 1a, and no obvious peaks of Bi2S3 and Cu2S can be observed due to the use of doping amounts of no more than 5%. XPS was used to demonstrate that both Bi2S3 and Cu2S are doped into the PbS, as shown in Figure 4b. Extra peaks of Bi 4f and Cu 2p at the binding energies of 164 and 932.3 eV, respectively, can be observed for PbS doped with 1% Bi2S3-1% Cu2S, which confirms that the Bi2S3 and Cu2S were successfully co-doped into PbS. Figure 4c also illustrates that the valence of Cu ions was +1, because the corresponding binding energy of Cu 2p peak of Cu2+ was 933.6 eV, which indicates that no redox reaction may occur between the reduced form of the metal copper and the sulfide during the synthesis process due to the lack of uniform air surface oxidation.
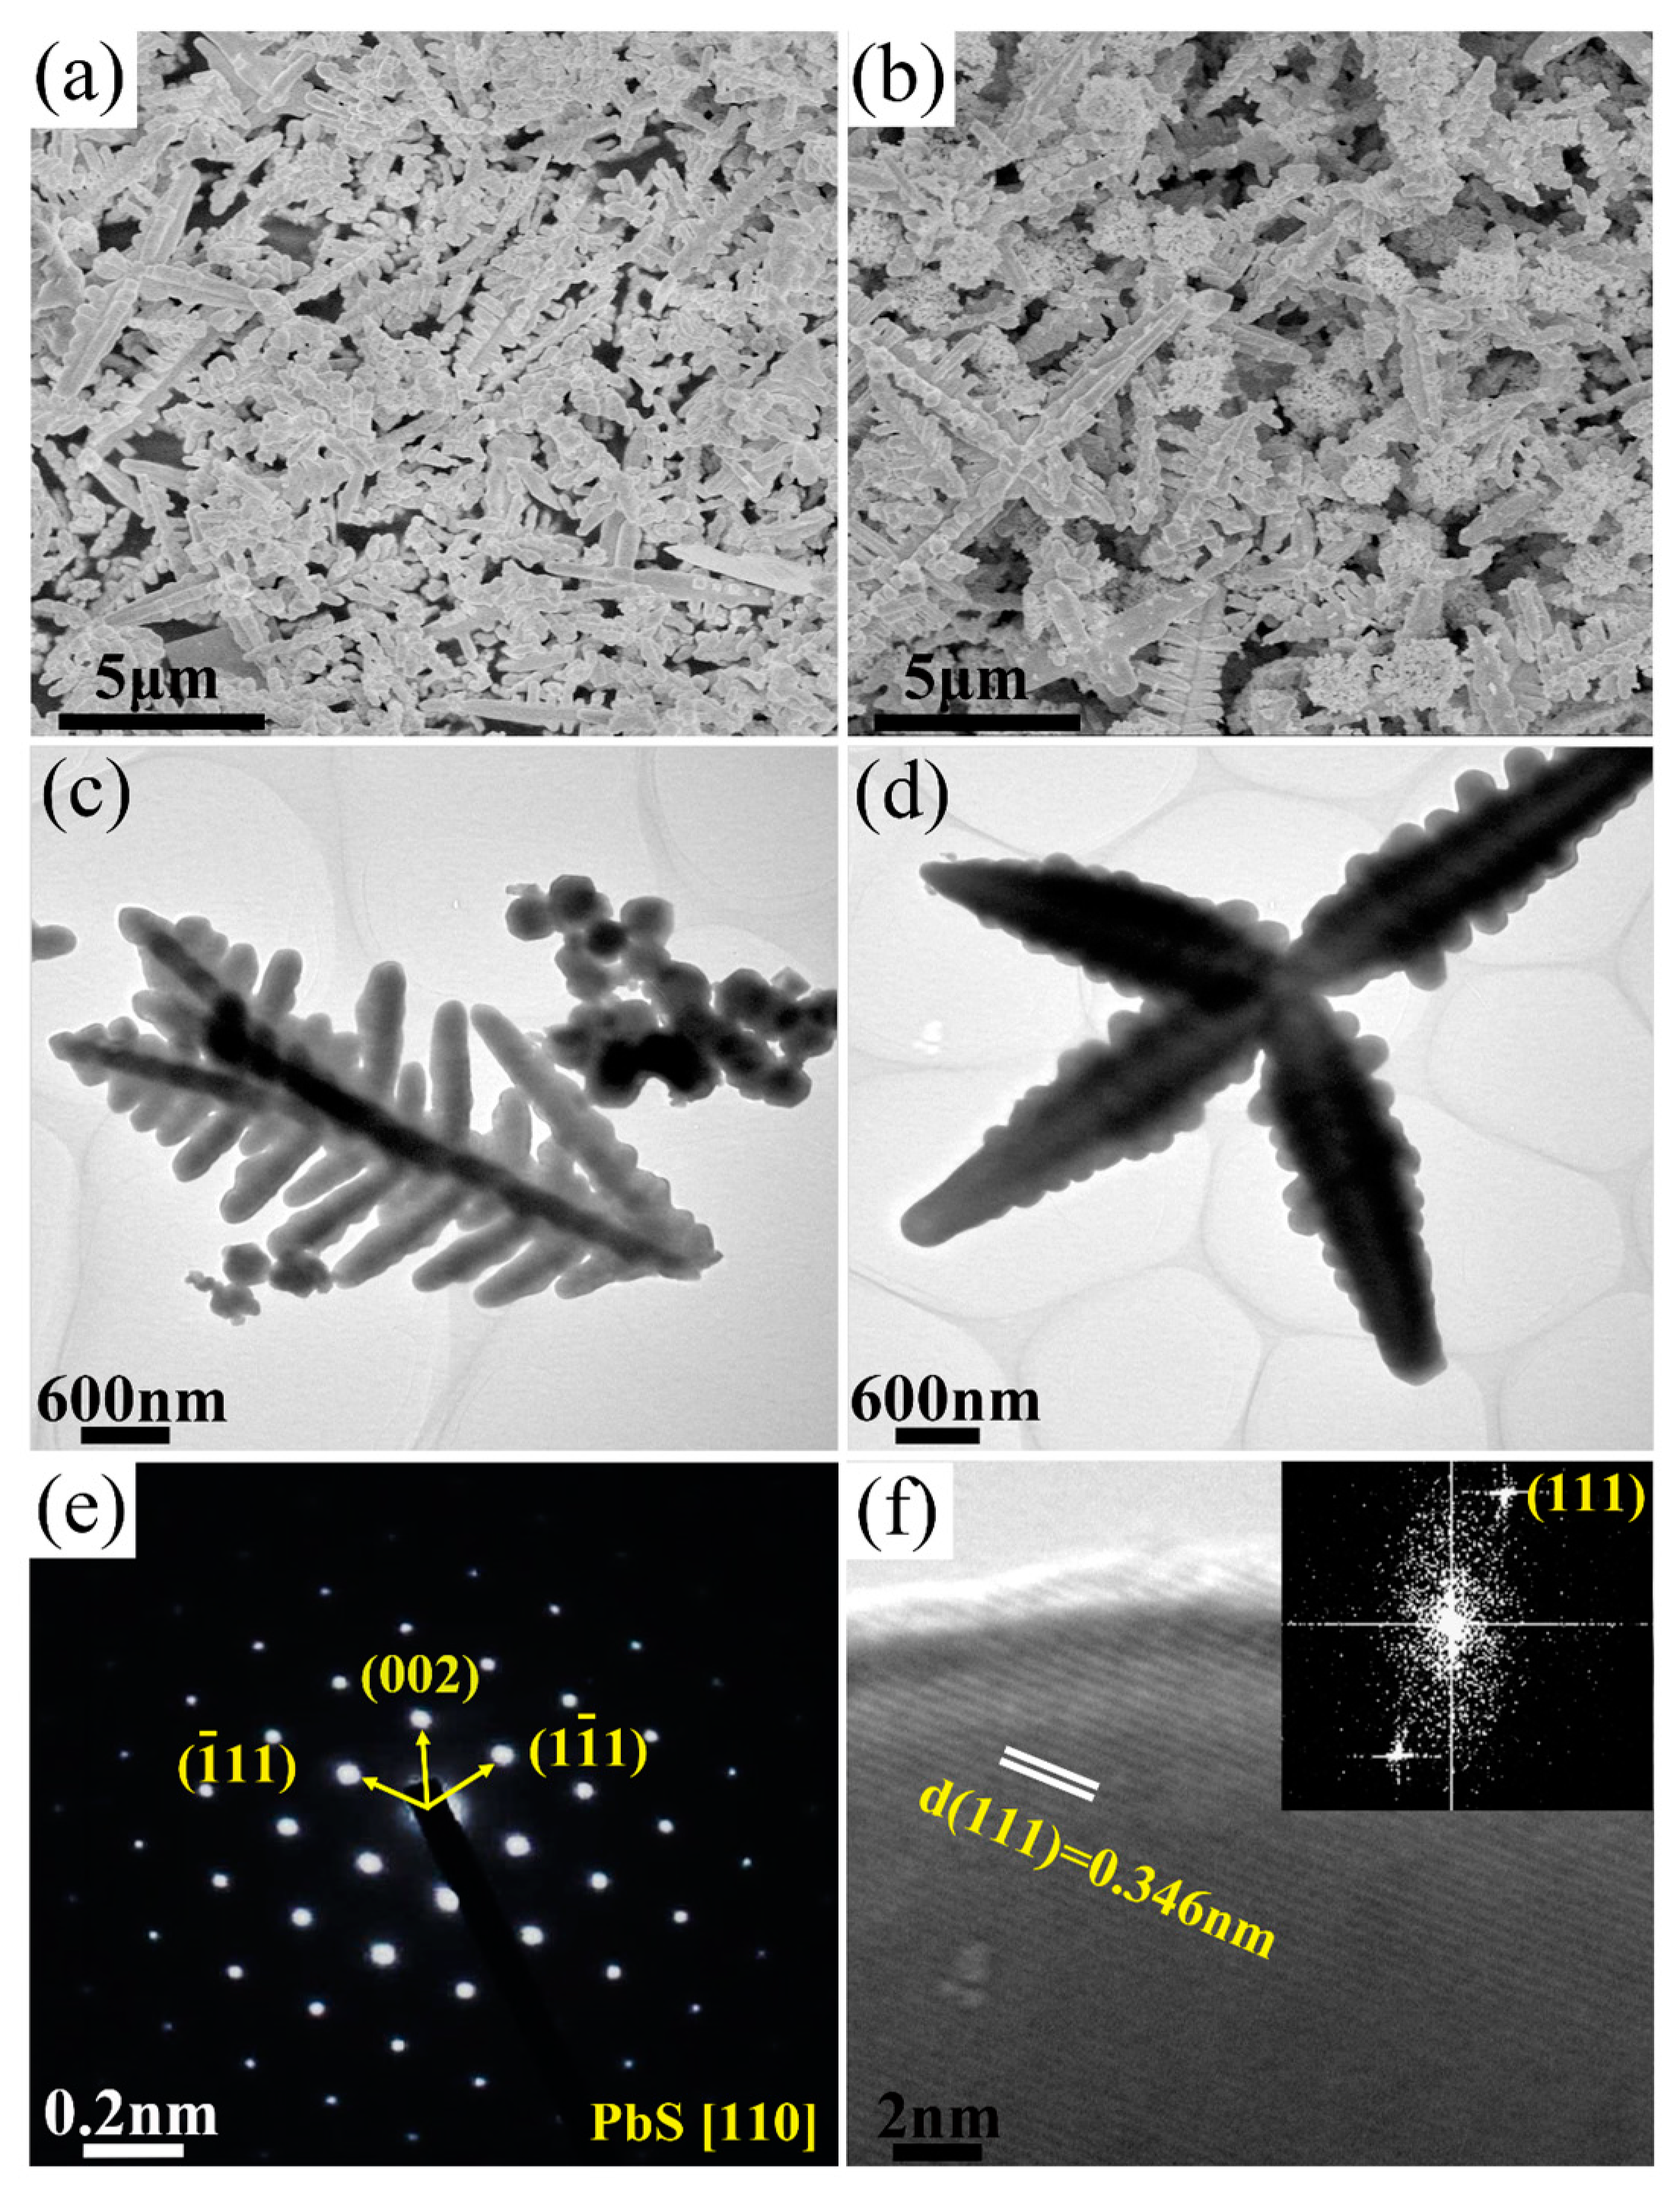
Figure 5 shows the SEM and TEM images of PbS powders doped with different percentages of Bi2S3 and Cu2S. Figure 5a,b show that the primary morphology of the co-doped samples was similar to that of Bi2S3-doped PbS, with predominantly dendritic and star-like shapes, and small amounts of spherical particles, which were probably Bi2S3, as it lacks a preferred growth direction and easily forms a spherical structure during the hydrothermal process [61]. The TEM images shown in Figure 5c,d confirm the hierarchical dendritic, star-shaped, and spherical structures of the powders, which effectively increased the interface between the grains and reduces the thermal conductivity at high temperatures. The SAED pattern shown in Figure 5e illustrates the single-crystal nature of the PbS-based powder synthesized by the hydrothermal method. Figure 5f displays the HRTEM of co-doped PbS. The lattice space was 0.346 nm along the (111) plane, which is similar to that of the Bi2S3-doped PbS.
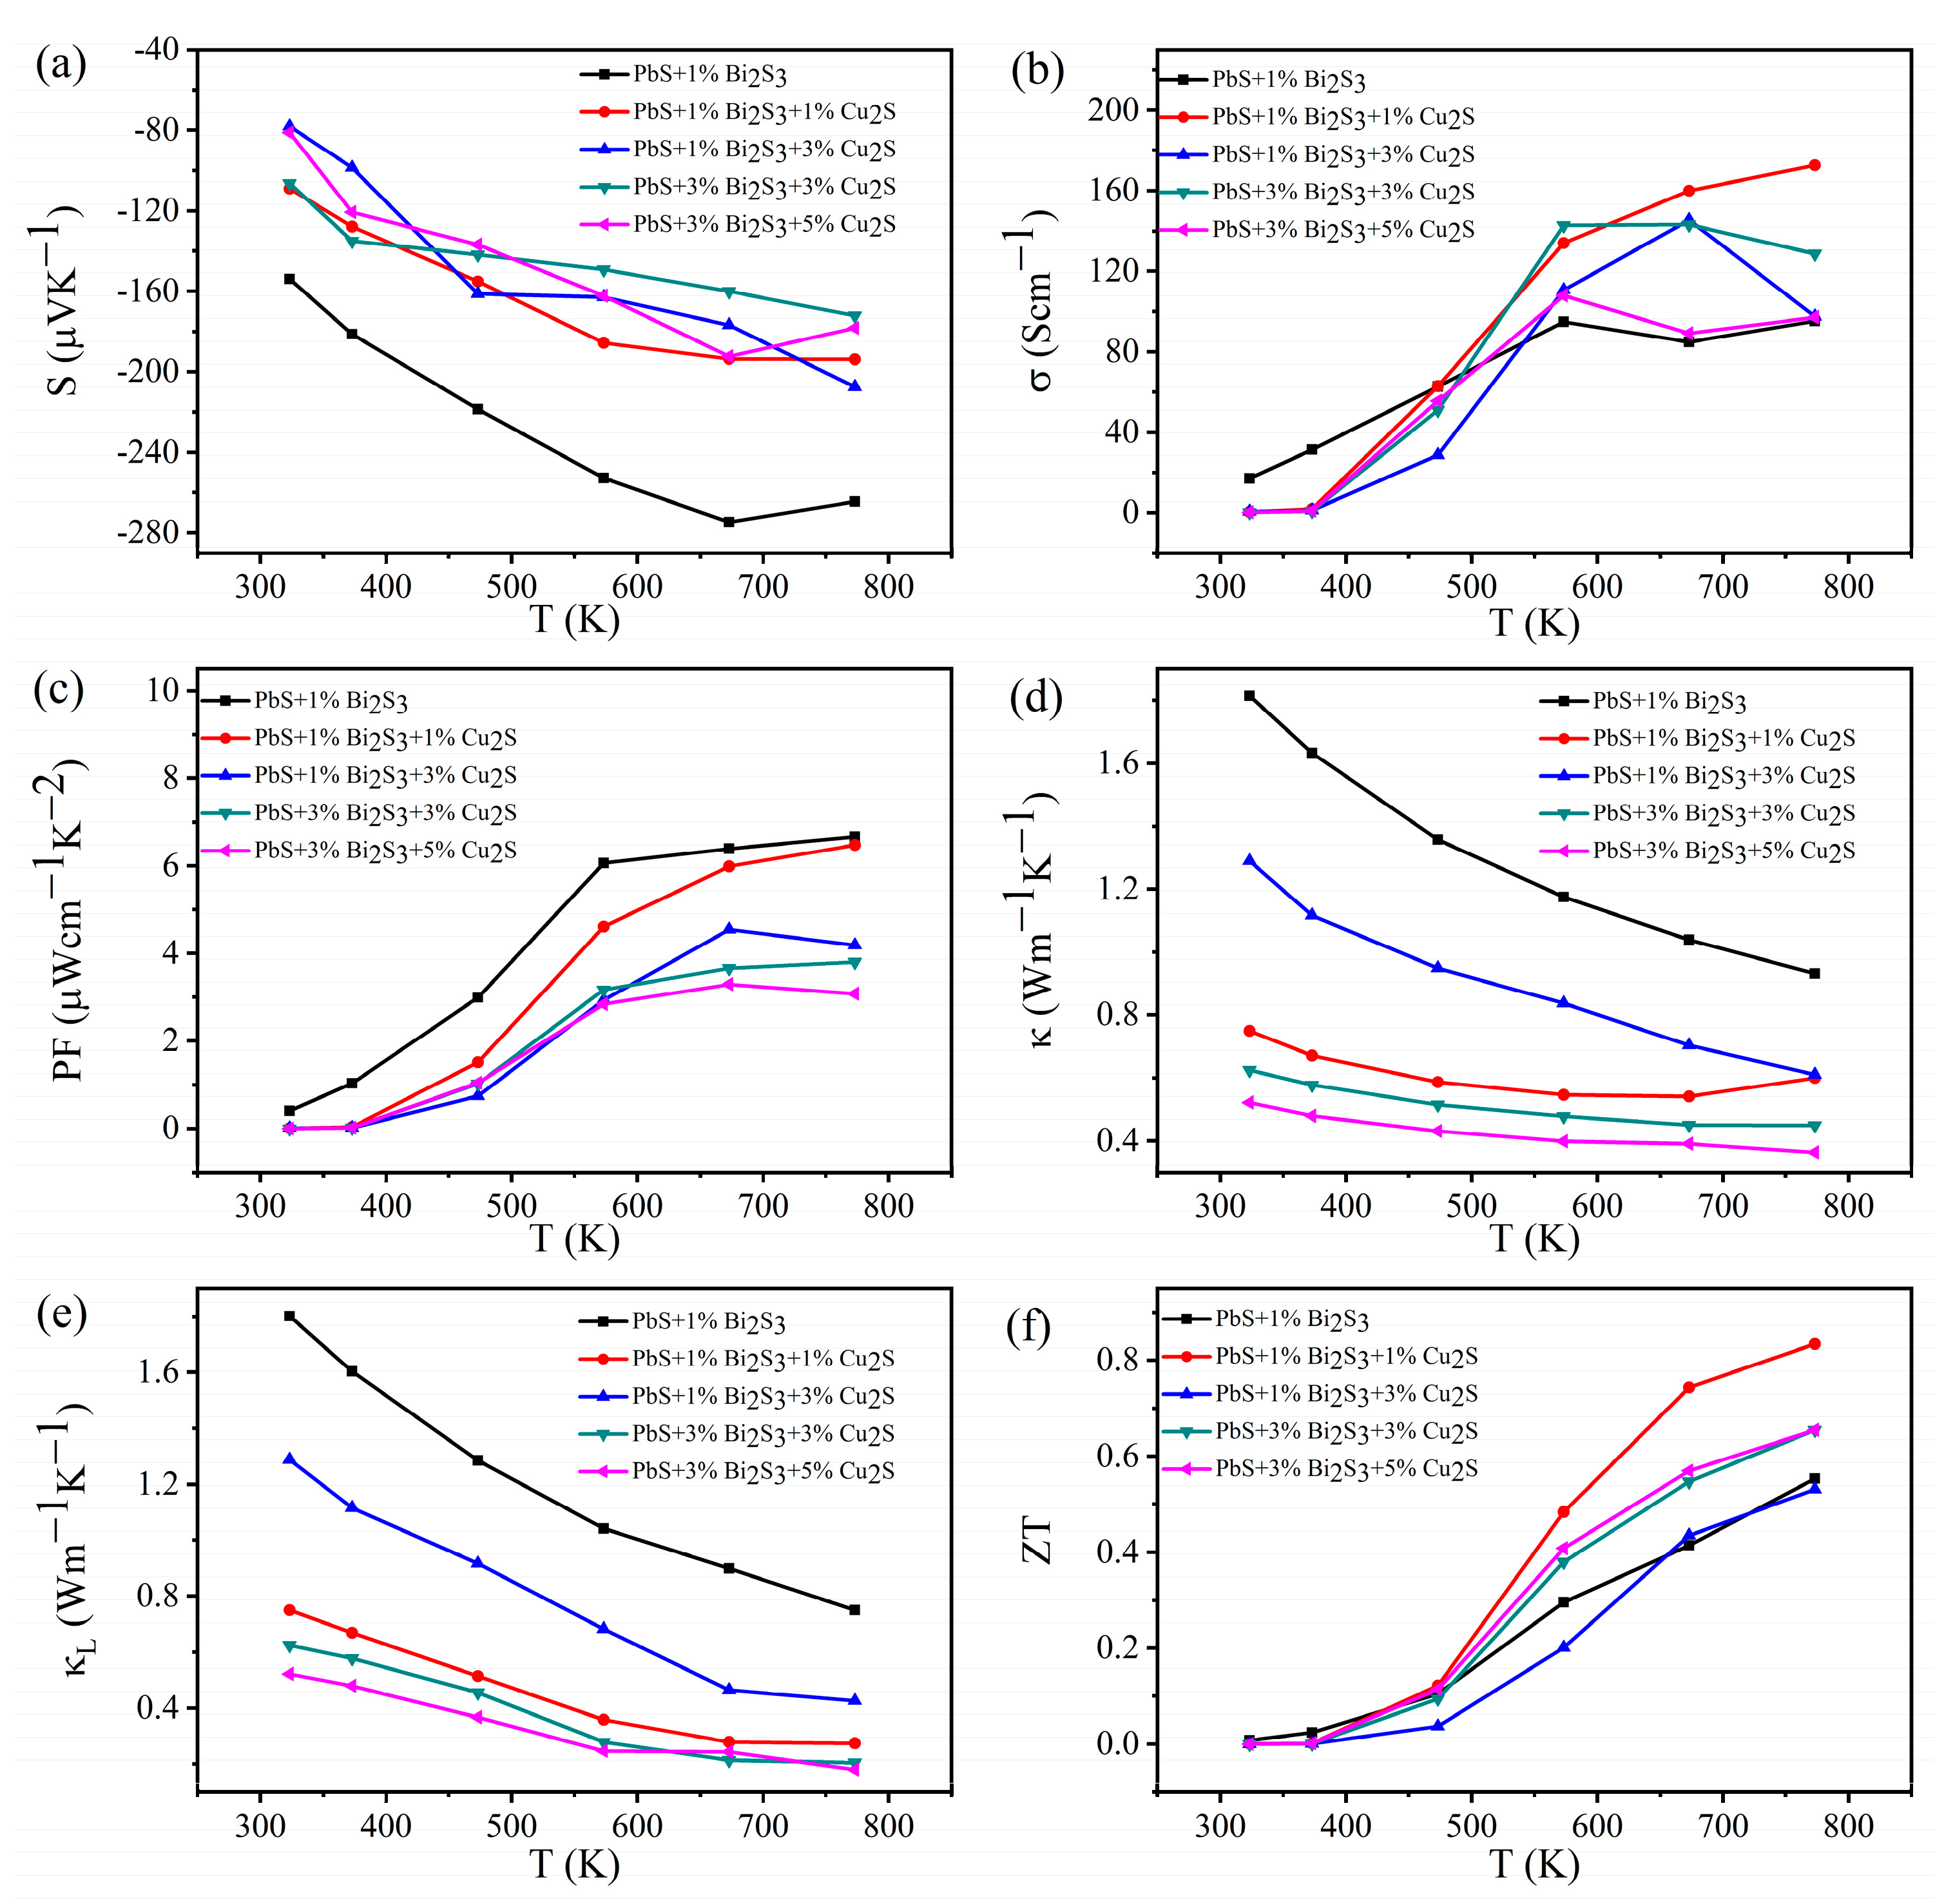
Figure 6 shows the thermoelectric performances of PbS with different amounts of co-doped Bi2S3 and Cu2S as a function of temperature. The Seebeck coefficients were negative, which indicates that the PbS doped with Bi2S3 and Cu2S was still an n-type semiconductor, as shown in Figure 6a. The absolute value of the Seebeck coefficients increased with the increasing temperature and decreased with the increasing percentage of Cu2S doping, which is due to the higher carrier concentration. At 773 K, the absolute values of the Seebeck coefficients for the five samples were 264.5, 193.7, 207.4, 172.0, and 178.1 μV K−1, respectively. Figure 6b shows that the PbS-based samples doped with Cu2S exhibited significantly low electrical conductivity at 323 K, with values less than 1 S cm−1. The electrical conductivity of the co-doped PbS sample increased with the increasing temperature; at a temperature of 773 K, the maximum electrical conductivity value was 172.6 S cm−1 for the PbS doped with 1% Bi2S3-1% Cu2S sample. The electrical conductivities of samples doped with 1% Bi2S3, 3% Bi2S3-3% Cu2S, and 3% Bi2S3-5% Cu2S showed a turning point at 573 K due to the continuously increasing carrier concentration and high temperature range [62,63,64], and the corresponding values were 95.3, 128.7, and 97.0 S cm−1 at 773 K, respectively. However, the sample doped with 1% Bi2S3-3% Cu2S showed a turning point at 673 K, with electrical conductivity of 97.5 S cm−1 at 773 K. The electric conductivities of the PbS-based samples decreased with the increasing Cu2S content at high temperatures. The power factor values are shown in Figure 6c. The power factor of all the samples increased with the increasing temperature, and tended to stabilize at higher temperatures. The corresponding PF values of the five samples were 6.67, 6.48, 4.19, 3.81, and 3.08 μW cm−1 K−2 at 773 K. When doped with 1% Bi2S3 and different amounts of Cu2S (0%, 1%, 3%), the corresponding power factors were 6.67, 6.48, and 4.19 μW cm−1 K−2 at 773 K, respectively. Additionally, when doped with 3% Bi2S3 and different amounts of Cu2S (3%, 5%), the power factors of the two samples were 3.81 and 3.08 μW cm−1 K−2 at 773 K, respectively. When the doping amount of Cu2S was increased, the electrical transport performance of PbS decreased. It can be observed that the power factor of PbS-based samples declined when the Bi2S3 and Cu2S contents were increased.
The thermal conductivity of the samples exhibited a decline as the temperature increased, as illustrated in Figure 6d, except for the PbS doped with 1% Bi2S3-1% Cu2S at a high temperature. The corresponding thermal conductivity values of the five samples were 0.93, 0.60, 0.61, 0.45, and 0.36 W m−1 K−1 at 773 K. The PbS sample doped with 3% Bi2S3-5% Cu2S exhibited the lowest thermal conductivity, which suggests that the thermal conductivity of PbS-based samples reduced with the increasing doping content. Through calculation, it was found that the value of electronic thermal conductivity ( κ e ) was one order of magnitude smaller than the total thermal conductivity ( κ ), indicating that lattice thermal conductivity dominates the total thermal conductivity. The ratio of lattice thermal conductivity ( κ L ) to total thermal conductivity ( κ ) suggests that the total thermal conductivity is mainly determined by phonon transport. The lattice thermal conductivity ( κ L ) of the specimens is displayed in Figure 6e. The κ L values clearly reduced with the increasing temperature; the corresponding values were 0.75, 0.27, 0.43, 0.21, and 0.18 W m−1 K−1 at 773 K for the five samples. The decreased thermal conductivity can be primarily attributed to the rapid decrease in the lattice thermal conductivity. The corresponding ZT values of the five samples were 0.55, 0.83, 0.53, 0.66 and 0.65 at 773 K, as shown in Figure 6f. The detailed transport properties of PbS doped with different Bi2S3-Cu2S are listed in Table 1. The ZT values of all samples increased with the increasing temperature. It was found that, when doping with 1% Bi2S3 and different amounts of Cu2S (1%, 3%), the ZT values of the samples were 0.83 and 0.53 at 773 K, respectively. This indicates that as the Cu2S doping ratio increased while the Bi2S3 doping ratio remained at 1%, and the thermoelectric properties of the samples decreased, mainly due to the decrease in power factor (PF) with the increasing Cu2S doping ratio. When doping with 3% Bi2S3 and varying amounts of Cu2S (3%, 5%), the corresponding ZT values of the samples were 0.66 and 0.65 at 773 K, respectively. It is evident that as the Cu2S doping ratio increased while the Bi2S3 doping ratio was kept at 3%, the thermoelectric properties of the samples also decreased, which can be mainly attributed to the decrease in thermal conductivity and power factor with the increasing Cu2S doping ratio. PbS doped with 1% Bi2S3-1% Cu2S exhibited the maximum ZT value of 0.83 at 773 K, which was 51% higher than 0.55 for PbS with doping of 1% Bi2S3, owing to the lower thermal conductivity, and 186% higher than 0.29 for pure PbS, owing to the higher power factor and lower thermal conductivity.

4. Conclusions

In summary, dendritic and star-shaped PbS powders with varying Bi2S3 contents and Cu2S doping were successfully synthesized using the hydrothermal method and sintered into bulk ceramics via SPS. Appropriate amounts of Bi2S3 doping into PbS were shown to improve the electric conductivity and decrease the thermal conductivity simultaneously; moreover, the maximum ZT value reached 0.55 at 773 K for PbS doped with 1% Bi2S3. Furthermore, doping 1% Cu2S into Bi2S3-doped PbS increased the electric conductivity sharply and Seebeck coefficient gradually, and decreasing the corresponding thermal conductivity resulted in a high ZT value of 0.83 at 773 K in PbS doped with 1% Bi2S3-1% Cu2S. This work presents a highly effective approach to enhance the performance of thermoelectric materials, with the potential to promote the application of thermoelectric devices with high conversion efficiency.

Author Contributions

Conceptualization, W.W. and C.X.; methodology, W.W.; formal analysis, W.W. and C.X.; investigation, Y.O.; writing—original draft preparation, W.W.; writing—review and editing, Z.H. and S.X. All authors have read and agreed to the published version of the manuscript.

Funding

This research was funded by the Natural Science Foundation of China (Approval No. 51172189).

Data Availability Statement

The authors confirm that the data supporting the findings of this study are available within the article.

Conflicts of Interest

The authors declare no conflict of interest.

References

  1. Liu, W.S.; Kim, H.S.; Chen, S.; Jie, Q.; Lv, B.; Yao, M.L.; Ren, Z.S.; Opeil, C.P.; Wilson, S.; Chu, C.W. n-type thermoelectric material Mg2Sn0. 75Ge0. 25 for high power generation. Proc. Natl. Acad. Sci. USA 2015, 112, 3269–3274. [Google Scholar] [CrossRef]
  2. Zhao, L.D.; Kanatzidis, M.G. An overview of advanced thermoelectric materials. J. Mater. 2016, 2, 101–103. [Google Scholar] [CrossRef]
  3. He, J.; Tritt, T.M. Advances in thermoelectric materials research: Looking back and moving forward. Science 2017, 357, eaak9997. [Google Scholar] [CrossRef]
  4. Su, X.L.; Wei, P.; Li, H.; Liu, W.; Yan, Y.G.; Li, P.; Su, C.Q.; Xie, C.J.; Zhao, W.Y.; Zhai, P.C. Multi-scale microstructural thermoelectric materials: Transport behavior, non-equilibrium preparation, and applications. Adv. Mater. 2017, 29, 1602013. [Google Scholar] [CrossRef] [PubMed]
  5. Zhao, W.Y.; Liu, Z.Y.; Sun, Z.G.; Zhang, Q.J.; Wei, P.; Mu, X.; Zhou, H.Y.; Li, C.C.; Ma, S.F.; He, D.Q. Superparamagnetic enhancement of thermoelectric performance. Nature 2017, 549, 247–251. [Google Scholar] [CrossRef] [PubMed]
  6. Hamawandi, B.; Mansouri, H.; Ballikaya, S.; Demirci, Y.; Orlovska, M.; Bolghanabadi, N.; Sajjadi, S.A.; Toprak, M.S. A comparative study on the thermoelectric properties of bismuth chalcogenide alloys synthesized through mechanochemical alloying and microwave-assisted solution synthesis routes. Front. Mater. 2020, 7, 569723. [Google Scholar] [CrossRef]
  7. Pei, J.; Cai, B.W.; Zhuang, H.L.; Li, J.F. Bi2Te3-based applied thermoelectric materials: Research advances and new challenges. Natl. Sci. Rev. 2020, 7, 1856–1858. [Google Scholar] [CrossRef]
  8. Demirci, Y.; Yusuf, A.; Hamawandi, B.; Toprak, M.S.; Ballikaya, S. The effect of crystal mismatch on the thermoelectric performance enhancement of nano Cu2Se. Front. Mater. 2021, 7, 581138. [Google Scholar] [CrossRef]
  9. Li, J.; Huckleby, A.B.; Zhang, M. Polymer-based thermoelectric materials: A review of power factor improving strategies. J. Mater. 2022, 8, 204–220. [Google Scholar] [CrossRef]
  10. DiSalvo, F.J. Thermoelectric cooling and power generation. Science 1999, 285, 703–706. [Google Scholar] [CrossRef]
  11. Tritt, T.M.; Subramanian, M. Thermoelectric materials, phenomena, and applications: A bird’s eye view. MRS Bull. 2006, 31, 188–198. [Google Scholar] [CrossRef]
  12. Nakamura, Y. Nanostructure design for drastic reduction of thermal conductivity while preserving high electrical conductivity. Sci. Technol. Adv. Mat. 2018, 19, 31–43. [Google Scholar] [CrossRef]
  13. Li, J.F.; Liu, W.S.; Zhao, L.D.; Zhou, M. High-performance nanostructured thermoelectric materials. NPG Asia Mater. 2010, 2, 152–158. [Google Scholar] [CrossRef]
  14. Wolf, M.; Menekse, K.; Mundstock, A.; Hinterding, R.; Nietschke, F.; Oeckler, O.; Feldhoff, A. Low thermal conductivity in thermoelectric oxide-based multiphase composites. J. Electron. Mater. 2019, 48, 7551–7561. [Google Scholar] [CrossRef]
  15. Fortulan, R.; Aminorroaya Yamini, S. Recent progress in multiphase thermoelectric materials. Materials 2021, 14, 6059. [Google Scholar] [CrossRef]
  16. Zhang, Y.X.; Yang, T.Y.; Wang, Z.Y.; Feng, J.; Ge, Z.H. Highly enhanced stability and thermoelectric performance of copper sulfides-based composites by multiphase engineering. Mater. Today Phys. 2022, 27, 100808. [Google Scholar] [CrossRef]
  17. Harman, T.; Taylor, P.; Walsh, M.; LaForge, B. Quantum dot superlattice thermoelectric materials and devices. Science 2002, 297, 2229–2232. [Google Scholar] [CrossRef] [PubMed]
  18. Hochbaum, A.I.; Chen, R.K.; Delgado, R.D.; Liang, W.J.; Garnett, E.C.; Najarian, M.; Majumdar, A.; Yang, P.D. Enhanced thermoelectric performance of rough silicon nanowires. Nature 2008, 451, 163–167. [Google Scholar] [CrossRef]
  19. Liu, M.X.; Yazdani, N.; Yarema, M.; Jansen, M.; Wood, V.; Sargent, E.H. Colloidal quantum dot electronics. Nat. Electron. 2021, 4, 548–558. [Google Scholar] [CrossRef]
  20. Putri, Y.E.; Said, S.M.; Diantoro, M. Nanoarchitectured titanium complexes for thermal mitigation in thermoelectric materials. Renew. Sust. Energ. Rev. 2019, 101, 346–360. [Google Scholar] [CrossRef]
  21. Singh, D.; Ahuja, R. Dimensionality effects in high-performance thermoelectric materials: Computational and experimental progress in energy harvesting applications. WIRES Comput. Mol. Sci. 2022, 12, e1547. [Google Scholar] [CrossRef]
  22. Li, Y.; Wang, G.L.; Akbari-Saatlu, M.; Procek, M.; Radamson, H.H. Si and SiGe nanowire for micro-thermoelectric generator: A review of the current state of the art. Front. Mater. 2021, 8, 611078. [Google Scholar] [CrossRef]
  23. Lin, Y.M.; Dresselhaus, M. Thermoelectric properties of superlattice nanowires. Phys. Rev. B 2003, 68, 075304. [Google Scholar] [CrossRef]
  24. Caballero-Calero, O.; Martín-González, M. Thermoelectric nanowires: A brief prospective. Scr. Mater. 2016, 111, 54–57. [Google Scholar] [CrossRef]
  25. Chen, R.K.; Lee, J.; Lee, W.; Li, D.Y. Thermoelectrics of nanowires. Chem. Rev. 2019, 119, 9260–9302. [Google Scholar] [CrossRef]
  26. Domínguez-Adame, F.; Martín-González, M.; Sánchez, D.; Cantarero, A. Nanowires: A route to efficient thermoelectric devices. Phys. E 2019, 113, 213–225. [Google Scholar] [CrossRef]
  27. Snyder, G.J.; Toberer, E.S. Complex thermoelectric materials. Nat. Mater. 2008, 7, 105–114. [Google Scholar] [CrossRef]
  28. Alam, H.; Ramakrishna, S. A review on the enhancement of figure of merit from bulk to nano-thermoelectric materials. Nano Energy 2013, 2, 190–212. [Google Scholar] [CrossRef]
  29. Hua, C.Y.; Minnich, A.J. Importance of frequency-dependent grain boundary scattering in nanocrystalline silicon and silicon-germanium thermoelectrics. Semicond. Sci. Technol. 2014, 29, 124004. [Google Scholar] [CrossRef]
  30. Cao, J.Y.; Ekren, D.; Peng, Y.D.; Azough, F.; Kinloch, I.A.; Freer, R. Modulation of charge transport at grain boundaries in SrTiO3: Toward a high thermoelectric power factor at room temperature. ACS Appl. Mater. Interfaces 2021, 13, 11879–11890. [Google Scholar] [CrossRef]
  31. Heremans, J.P.; Jovovic, V.; Toberer, E.S.; Saramat, A.; Kurosaki, K.; Charoenphakdee, A.; Yamanaka, S.; Snyder, G.J. Enhancement of thermoelectric efficiency in PbTe by distortion of the electronic density of states. Science 2008, 321, 554–557. [Google Scholar] [CrossRef]
  32. Zhou, M.; Li, J.F.; Kita, T. Nanostructured AgPbmSbTem+2 system bulk materials with enhanced thermoelectric performance. J. Am. Chem. Soc. 2008, 130, 4527–4532. [Google Scholar] [CrossRef]
  33. Mei, D.Q.; Li, Y.; Yao, Z.H.; Wang, H.; Zhu, T.J.; Chen, S.C. Enhanced thermoelectric performance of n-type PbTe bulk materials fabricated by semisolid powder processing. J. Alloys Compd. 2014, 609, 201–205. [Google Scholar] [CrossRef]
  34. Jiang, B.B.; Liu, X.X.; Wang, Q.; Cui, J.; Jia, B.H.; Zhu, Y.K.; Feng, J.H.; Qiu, Y.; Gu, M.; Ge, Z.H. Realizing high-efficiency power generation in low-cost PbS-based thermoelectric materials. Energ. Environ. Sci. 2020, 13, 579–591. [Google Scholar] [CrossRef]
  35. Liu, H.T.; Sun, Q.; Zhong, Y.; Deng, Q.; Gan, L.; Lv, F.L.; Shi, X.L.; Chen, Z.G.; Ang, R. High-performance in n-type PbTe-based thermoelectric materials achieved by synergistically dynamic doping and energy filtering. Nano Energy 2022, 91, 106706. [Google Scholar] [CrossRef]
  36. Xiao, Y.; Wu, H.J.; Shi, H.N.; Xu, L.Q.; Zhu, Y.K.; Qin, Y.X.; Peng, G.Y.; Zhang, Y.; Ge, Z.H.; Ding, X.D. High-ranged ZT value promotes thermoelectric cooling and power generation in n-Type PbTe. Adv. Energy Mater. 2022, 12, 2200204. [Google Scholar] [CrossRef]
  37. Androulakis, J.; Todorov, I.; He, J.Q.; Chung, D.Y.; Dravid, V.; Kanatzidis, M. Thermoelectrics from abundant chemical elements: High-performance nanostructured PbSe-PbS. J. Am. Chem. Soc. 2011, 133, 10920–10927. [Google Scholar] [CrossRef]
  38. Ge, Z.H.; Zhao, L.D.; Wu, D.; Liu, X.Y.; Zhang, B.P.; Li, J.F.; He, J.Q. Low-cost, abundant binary sulfides as promising thermoelectric materials. Mater. Today 2016, 19, 227–239. [Google Scholar] [CrossRef]
  39. Yang, J.; Zhang, X.Z.; Liu, G.W.; Zhao, L.J.; Liu, J.L.; Shi, Z.Q.; Ding, J.N.; Qiao, G.J. Multiscale structure and band configuration tuning to achieve high thermoelectric properties in n-type PbS bulks. Nano Energy 2020, 74, 104826. [Google Scholar] [CrossRef]
  40. Zhao, L.D.; Lo, S.H.; He, J.Q.; Li, H.; Biswas, K.; Androulakis, J.; Wu, C.; Hogan, T.P.; Chung, D.Y.; Dravid, V.P. High performance thermoelectrics from earth-abundant materials: Enhanced figure of merit in PbS by second phase nanostructures. J. Am. Chem. Soc. 2011, 133, 20476–20487. [Google Scholar] [CrossRef] [PubMed]
  41. Sun, S.S.; Han, Q.F.; Wu, X.D.; Zhu, J.W.; Wang, X. The facile synthesis of PbS cubes and Bi2S3 nanoflowers from molecular precursors at room temperature. Mater. Lett. 2011, 65, 3344–3347. [Google Scholar] [CrossRef]
  42. Zhu, Z.Y.; Tiwari, J.; Feng, T.L.; Shi, Z.; Lou, Y.; Xu, B. High thermoelectric properties with low thermal conductivity due to the porous structure induced by the dendritic branching in n-type PbS. Nano Res. 2022, 15, 4739–4746. [Google Scholar] [CrossRef]
  43. Xiang, J.H.; Cao, H.Q.; Wu, Q.Z.; Zhang, S.C.; Zhang, X.R. L-cysteine-assisted self-assembly of complex PbS structures. Cryst. Growth Des. 2008, 8, 3935–3940. [Google Scholar] [CrossRef]
  44. Wagle, D.V.; Zhao, H.; Baker, G.A. Deep eutectic solvents: Sustainable media for nanoscale and functional materials. Acc. Chem. Res. 2014, 47, 2299–2308. [Google Scholar] [CrossRef] [PubMed]
  45. Lee, S.M.; Jun, Y.W.; Cho, S.N.; Cheon, J. Single-crystalline star-shaped nanocrystals and their evolution: Programming the geometry of nano-building blocks. J. Am. Chem. Soc. 2002, 124, 11244–11245. [Google Scholar] [CrossRef] [PubMed]
  46. Sathyamoorthy, R.; Kungumadevi, L. Facile synthesis of PbS nanorods induced by concentration difference. Adv. Powder Technol. 2015, 26, 355–361. [Google Scholar] [CrossRef]
  47. Li, C.; Shi, G.; Xu, H.Y.; Guang, S.Y.; Yin, R.H.; Song, Y.L. Nonlinear optical properties of the PbS nanorods synthesized via surfactant-assisted hydrolysis. Mater. Lett. 2007, 61, 1809–1811. [Google Scholar] [CrossRef]
  48. Querejeta-Fernández, A.; Hernández-Garrido, J.C.; Yang, H.X.; Zhou, Y.L.; Varela, A.; Parras, M.; Calvino-Gámez, J.J.; González-Calbet, J.M.; Green, P.F.; Kotov, N.A. Unknown aspects of self-assembly of PbS microscale superstructures. ACS Nano 2012, 6, 3800. [Google Scholar] [CrossRef]
  49. Ni, Y.H.; Liu, H.J.; Wang, F.; Liang, Y.Y.; Hong, J.M.; Ma, X.; Xu, Z. Shape controllable preparation of PbS crystals by a simple aqueous phase route. Cryst. Growth Des. 2004, 4, 759–764. [Google Scholar] [CrossRef]
  50. Quan, Z.W.; Li, C.X.; Zhang, X.M.; Yang, J.; Yang, P.P.; Zhang, C.M.; Lin, J. Polyol-mediated synthesis of PbS crystals: Shape evolution and growth mechanism. Cryst. Growth Des. 2008, 8, 2384–2392. [Google Scholar] [CrossRef]
  51. Ibáñez, M.; Zamani, R.; Gorsse, S.; Fan, J.D.; Ortega, S.; Cadavid, D.; Morante, J.R.; Arbiol, J.; Cabot, A. Core-shell nanoparticles as building blocks for the bottom-up production of functional nanocomposites: PbTe-PbS thermoelectric properties. ACS Nano 2013, 7, 2573–2586. [Google Scholar] [CrossRef] [PubMed]
  52. Zhao, L.D.; He, J.Q.; Hao, S.Q.; Wu, C.; Hogan, T.P.; Wolverton, C.; Dravid, V.P.; Kanatzidis, M.G. Raising the thermoelectric performance of p-type PbS with endotaxial nanostructuring and valence-band offset engineering using CdS and ZnS. J. Am. Chem. Soc. 2012, 134, 16327–16336. [Google Scholar] [CrossRef]
  53. Chang, C.; Xiao, Y.; Zhang, X.; Pei, Y.L.; Li, F.; Ma, S.L.; Yuan, B.F.; Liu, Y.; Gong, S.K.; Zhao, L.D. High performance thermoelectrics from earth-abundant materials: Enhanced figure of merit in PbS through nanostructuring grain size. J. Alloys Compd. 2016, 664, 411–416. [Google Scholar] [CrossRef]
  54. Ou, X.; Shuai, Y.; Luo, W.B.; Siles, P.F.; Kögler, R.; Fiedler, J.; Reuther, H.; Zhou, S.Q.; Hübner, R.; Facsko, S. Forming-free resistive switching in multiferroic BiFeO3 thin films with enhanced nanoscale shunts. ACS Appl. Mater. Inter. 2013, 5, 12764–12771. [Google Scholar] [CrossRef]
  55. Zhang, Y.L.; Qi, J.; Wang, Y.H.; Tian, Y.; Zhang, J.K.; Hu, T.J.; Wei, M.B.; Liu, Y.Q.; Yang, J.H. Tuning magnetic properties of BiFeO3 thin films by controlling Mn doping concentration. Ceram. Int. 2018, 44, 6054–6061. [Google Scholar] [CrossRef]
  56. Ran, J.H.; Chen, H.B.; Bai, X.; Bi, S.G.; Jiang, H.Y.; Cai, G.M.; Cheng, D.S.; Wang, X. Immobilizing CuO/BiVO4 nanocomposite on PDA-templated cotton fabric for visible light photocatalysis, antimicrobial activity and UV protection. Appl. Surf. Sci. 2019, 493, 1167–1176. [Google Scholar] [CrossRef]
  57. Johnsen, S.; He, J.Q.; Androulakis, J.; Dravid, V.P.; Todorov, I.; Chung, D.Y.; Kanatzidis, M.G. Nanostructures boost the thermoelectric performance of PbS. J. Am. Chem. Soc. 2011, 133, 3460–3470. [Google Scholar] [CrossRef]
  58. Buscaglia, M.T.; Maglia, F.; Anselmi-Tamburini, U.; Marre, D.; Pallecchi, I.; Ianculescu, A.; Canu, G.; Viviani, M.; Fabrizio, M.; Buscaglia, V. Effect of nanostructure on the thermal conductivity of La-doped SrTiO3 ceramics. J. Eur. Ceram. Soc. 2014, 34, 307–316. [Google Scholar] [CrossRef]
  59. Lin, C.-C.; Lydia, R.; Yun, J.H.; Lee, H.S.; Rhyee, J.S. Extremely low lattice thermal conductivity and point defect scattering of phonons in Ag-doped (SnSe)1–x(SnS)x compounds. Chem. Mater. 2017, 29, 5344–5352. [Google Scholar] [CrossRef]
  60. El-Khouly, A.; Novitskii, A.; Adam, A.; Sedegov, A.; Kalugina, A.; Pankratova, D.; Karpenkov, D.; Khovaylo, V. Transport and thermoelectric properties of Hf-doped FeVSb half-Heusler alloys. J. Alloys Compd. 2020, 820, 153413. [Google Scholar] [CrossRef]
  61. Wang, W.; Luo, S.J.; Xian, C. Enhanced thermoelectric properties of hydrothermal synthesized BiCl3/Bi2S3 composites. J. Inorg. Mater. 2019, 34, 328–334. [Google Scholar] [CrossRef]
  62. You, L.; Liu, Y.F.; Li, X.; Nan, P.F.; Ge, B.H.; Jiang, Y.; Luo, P.F.; Pan, S.S.; Pei, Y.Z.; Zhang, W.Q. Boosting the thermoelectric performance of PbSe through dynamic doping and hierarchical phonon scattering. Energ. Environ. Sci. 2018, 11, 1848–1858. [Google Scholar] [CrossRef]
  63. You, L.; Zhang, J.Y.; Pan, S.S.; Jiang, Y.; Wang, K.; Yang, J.; Pei, Y.Z.; Zhu, Q.; Agne, M.T.; Snyder, G.J. Realization of higher thermoelectric performance by dynamic doping of copper in n-type PbTe. Energ. Environ. Sci. 2019, 12, 3089–3098. [Google Scholar] [CrossRef]
  64. Qin, Y.X.; Hong, T.; Qin, B.C.; Wang, D.Y.; He, W.K.; Gao, X.; Xiao, Y.; Zhao, L.D. Contrasting Cu roles lead to high ranged thermoelectric performance of PbS. Adv. Funct. Mater. 2021, 31, 2102185. [Google Scholar] [CrossRef]
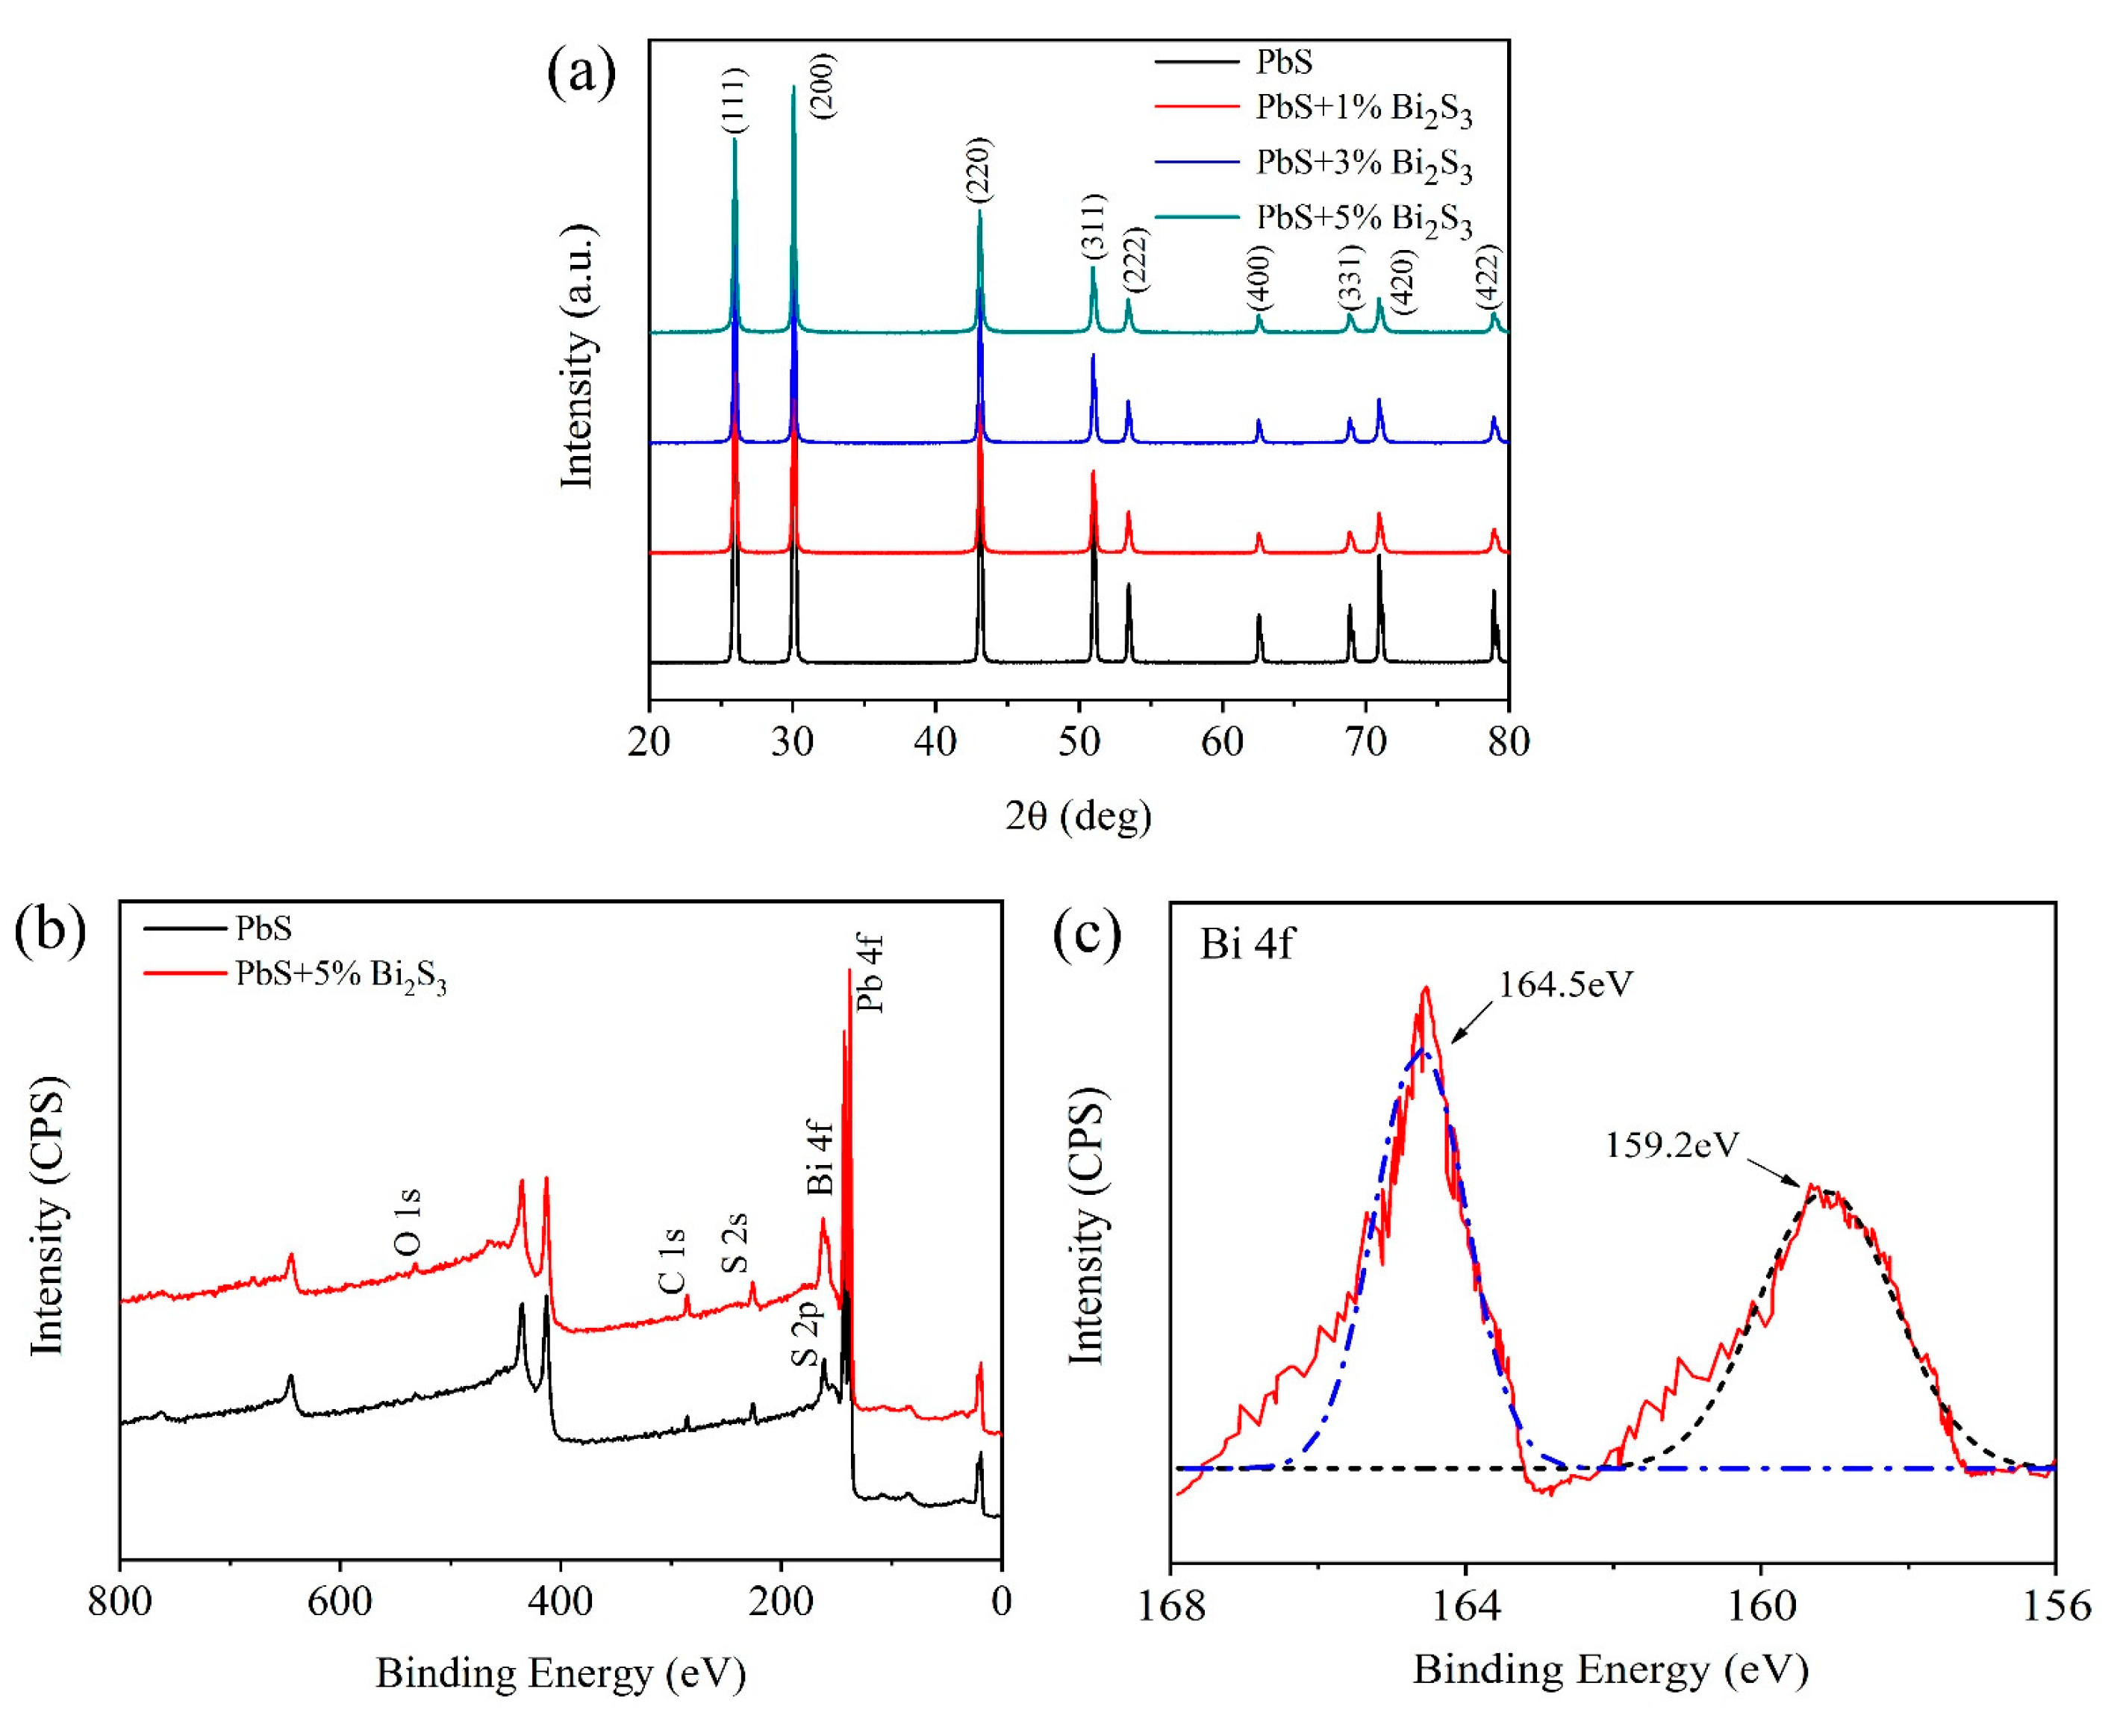
Figure 1. (a) X-ray diffraction (XRD) patterns of PbS powders doped with x% Bi2S3 (x = 0, 1, 3, 5); (b) X-ray photoelectron spectroscopy (XPS) images of pure and 5% Bi2S3-doped PbS powders; (c) XPS peak of Bi 4f.
Crystals 13 00764 g001
Figure 2. Scanning electron microscopy (SEM) images of (a) pure PbS and (b) PbS doped with 1% Bi2S3; transmission electron microscopy (TEM) and high-resolution TEM (HRTEM) images of PbS doped with 1% Bi2S3: (c) dendritic and (d) star-shaped morphologies; (e,f) HRTEM images of different micro-areas.
Crystals 13 00764 g002
Figure 3. Effect of temperature on the thermoelectric performances of PbS doped with x% (x = 0, 1, 3, 5) Bi2S3: (a) Seebeck coefficient, (b) electric conductivity, (c) power factor, (d) total thermal conductivity, (e) lattice thermal conductivity, and (f) figure of merit.
Crystals 13 00764 g003
Figure 4. (a) XRD patterns for PbS powders doped with x% (x = 1, 3) Bi2S3-y% (y = 1, 3, 5) Cu2S; (b) XPS images of pure and 1% Bi2S3-1% Cu2S co-doped PbS powders; (c) XPS peak of Cu 2p.
Crystals 13 00764 g004
Figure 5. SEM images of PbS doped with (a) 1% Bi2S3-1% Cu2S and (b) 3% Bi2S3-5% Cu2S; TEM results of PbS doped with 1% Bi2S3-1% Cu2S: (c) dendritic and spherical particles, (d) hyperbranched star-shaped particle; (e) selected area electron diffraction pattern; (f) HRTEM image.
Crystals 13 00764 g005
Figure 6. Effect of temperature on the thermoelectric performance of PbS with different amounts of co-doped Bi2S3 and Cu2S: (a) Seebeck coefficient, (b) electric conductivity, (c) power factor, (d) total thermal conductivity, (e) lattice thermal conductivity, and (f) figure of merit.
Crystals 13 00764 g006
Table 1. Thermoelectric performance of PbS with different amounts of Bi2S3 and Cu2S doping.
SampleT
(K)
S
(μV K−1)
σ
(S cm−1)
PF
(μW cm−1 K−2)
κ
(W m−1 K−1)
κ L
(W m−1 K−1)
ZTmax
PbS758−360.035.24.561.211.140.29
PbS + 1% Bi2S3773−264.595.36.670.930.750.55
PbS + 3% Bi2S3773−187.9136.64.820.790.530.47
PbS + 5% Bi2S3773−178.8139.24.450.870.600.40
PbS + 1% Bi2S3 + 1% Cu2S773−193.7172.66.480.600.270.83
PbS + 1% Bi2S3 + 3% Cu2S773−207.497.54.190.610.430.53
PbS + 3% Bi2S3 + 3% Cu2S773−172.0128.73.810.450.210.66
PbS + 3% Bi2S3 + 5% Cu2S773−178.197.03.080.360.180.65
Disclaimer/Publisher’s Note: The statements, opinions and data contained in all publications are solely those of the individual author(s) and contributor(s) and not of MDPI and/or the editor(s). MDPI and/or the editor(s) disclaim responsibility for any injury to people or property resulting from any ideas, methods, instructions or products referred to in the content.