Article

Drug Repurposing of the Antiviral Drug Acyclovir: New Pharmaceutical Salts

by
Paulo Nunes
,
Pedro Henrique de Oliveira Santiago
,
Cecilia Carolina Pinheiro da Silva
and
Javier Ellena
*
Instituto de Física de São Carlos, Universidade de São Paulo, CP 369, São Carlos 13560-970, SP, Brazil
*
Author to whom correspondence should be addressed.
Crystals 2023, 13(5), 782; https://doi.org/10.3390/cryst13050782
Submission received: 4 April 2023 / Revised: 28 April 2023 / Accepted: 5 May 2023 / Published: 8 May 2023
(This article belongs to the Special Issue Multicomponent Pharmaceutical Solids (2nd Edition))

Abstract

:
Drug repurposing is becoming interesting in terms of offering advantages over the traditional drug development, once drug discovery is a costly, time-consuming, and highly risky process. In particular, with the coronavirus disease (COVID-19) declared by World Health Organization as a global pandemic, there has emerged a considerable need to develop therapeutic agents capable of preventing viral outbreaks. Concomitantly, well-known and long-used drugs such as acyclovir (Acv) have been tested against COVID-19. Acv is a guanosine analogue that acts as an antiviral drug, commonly used to treat herpes simplex virus (HSV), genital herpes, and varicella zoster virus (VZV). Acv showed to inhibit viral proteases, multiple viral genes expression, and RNA-Dependent RNA Polymerase, helping to recover COVID-19 patients. However, ACV is a BCS class III/IV drug, with low permeability and/or slight water solubility (concentration-dependent). Given the repurposing eligibility of Acv, in this work, two new salts of this drug are presented (nitrate and sulfate), with the aim of improving its pharmacokinetic properties. The new salts were evaluated by X-ray diffraction, and thermal and spectroscopic analyses. A third salt, a chloride one, was also characterized and used for comparison.

1. Introduction

Active Pharmaceutical Ingredients (APIs) are usually available in a crystalline or amorphous state, spread through several dosage forms such as capsules, powders, suspensions, or gels, and are largely orally administered as pills or tablets, which represent the most convenient, compact, and economical way to deliver them to the population [1,2]. In particular, crystalline APIs are more attractive than non-crystalline APIs (amorphous), due to their thermodynamic stability, purity, and manufacturability. However, in the crystalline state, APIs may exist in several different solid forms, such as salts, co-crystals, hydrates, and solvates. Beyond exhibiting polymorphism, each of them presenting specific properties (melting point, solubility, hygroscopicity, etc.) that can affect the quality and safety of a medicine [3].
More than 40% of commercially available APIs exhibit bioavailability issues. The development of new crystalline solid forms of APIs could be an effective strategy to improve their pharmacokinetic and pharmacodynamic properties [4,5]. Scientists worldwide have noticed that modifications in the properties of APIs promote, in some cases, secondary health effects, thus opening doors to a new area inside the pharmacy field: Drug Repurposing (DR). In this sense, DR has become a good strategy in terms of offering advantages over traditional drug development, as it is a costly, time-consuming, and risky process [6]. Recently, given the pandemic caused by the new coronavirus, SARS-CoV-2, termed by the World Health Organization as coronavirus disease 2019 (COVID-19), a huge need for the development of therapeutic agents capable of preventing virus outbreak emerged. In this scenario, DR gained force and several APIs, especially antivirals, were investigated in an attempt to be used in the treatment of COVID-19 [6,7].
For example, remdesivir, initially designed for treating Hepatitis C and Ebola virus, has shown activity against SARS-CoV-2 and was approved for use in the COVID-19 treatment. Research on COVID-19 has shown that SARS-CoV-2 replication involves protein RNA-dependent RNA polymerase (RdRp) [8]. In this way, APIs that act by interfering with viral replication were selected for testing against COVID-19 with a greater therapeutic benefit for mild and usual patients, as well as in severe patients [9,10]. Deserving notice among them is the antiviral drug acyclovir (Acv), a cheap, common and easily accessible antiviral used worldwide. Acv, (2-amino-1,9-dihydro-9-[(2-hydroxyethoxy)methyl]-6H-purin-6-one, or 9-[(2-hydroxyethoxy)methyl]-guanine) (Figure 1), is a well-known antiviral drug, guanosine analogue, discovered in mid for the treatment of herpes simplex virus (HSV), genital herpes, and varicella-zoster virus (VZV).
Acv has as the major mechanism of action and its conversion to acyclovir monophosphate by virally encoded thymidine kinase and its subsequent conversion to acyclovir triphosphate by cellular enzymes, thus inhibiting viral DNA polymerase by acting as an analogue to deoxyguanosine triphosphate (dGTP) [11]. The tests involving Acv showed evidence for promoting some effect against COVID-19 infection [12,13,14,15]. However, despite being used for many years, this drug has few crystalline solid forms reported [15,16,17,18]. Acv is commercialized as acyclovir sesquihydrate, a solid form known since 1980s that shows to be more stable than the others polymorphs, as well as the anhydrous forms [19], which exhibit solubility/permeability issues [20]. These facts place this drug as a BCS class III or IV API, depending on the mg/tablet (drug concentration) [21,22].
Since pharmaceutical cocrystals [21] and salts [22,23] are interesting choices to improve the physico-chemical properties, and the last ones can be synthetized by acid-base reactions [24,25,26], in this work we report two new Acv salts (nitrate and sulfate), aiming to improve its pharmacokinetics properties. These new salts were evaluated by single crystal X-ray diffraction (SCXRD), differential scanning calorimetry (DSC), Fourier transform infrared (FTIR), Raman spectroscopy, Thermogravimetric analysis (TGA) and Hirshfeld surface analysis (HS) and Full Interaction Maps (FIM). In addition, acyclovir hydrochloride [22], whose X-ray powder diffraction study has already been reported in the literature, was studied by SCXRD for the first time and included for comparison reasons [4,24,25].

2. Materials and Methods

2.1. Supramolecular Synthesis

Acv salts were obtained by suspending 22.5 mg (0.1 mmol) of the API in 1 mL of alcohol for 5 min, after that, 0.2 mL of a 1.0 M solution of the respective inorganic acid (1:1 molar ratio) was added to the suspension, and the reaction was stirred for another 15 min. The solutions were cooled to room temperature and left to slowly evaporate. The yield of the salts synthesis is about 78%, 82% and 74% for the HAcv·HSO4, HAcv·Cl and HAcv·NO3, respectively.

2.2. Fourier Transform Infrared

FT–IR spectra were collected using a Bomem Michelson FT MB-102 spectrometer in the 4000−400 cm−1 range. To record the IR spectra, 1 mg of each compound in 100 mg of KBr was used to prepare the pellets.

2.3. Raman Spectroscopy

Raman spectra were collected using a Horiba LabRAM HR Evolution UV-VIS-NIR spectrometer (Palaiseau, Saclay Campus, France) and measured in the 200−4000 cm−1 range with a 532 nm diode laser and a Horiba Synphony CCD detector (Palaiseau, Saclay Campus, France).

2.4. Single Crystal X-ray Diffraction (SCXRD)

SCXRD measurements were carried out on a Rigaku XtaLAB Synergy-S Dualflex diffractometer equipped with a HyPix-6000HE hybrid photon-counting detector using Cu-Kα radiation (λ = 1.54184 Å). The crystals were kept at 100 K during data collection. Cell refinement, data collection, data reduction, and absorption correction were performed using CrysAlisPro [27]. he intrinsic phasing method was employed to solve the structures using the SHELXT-2018/2 solution program [28], while the refinement was performed using least-squares methods in the SHELXL-2019/2 program [29] both within Olex2 software [28]; non-hydrogen atoms were located in subsequent Fourier-difference map analyses and refined anisotropically. The hydrogen atoms positions were located in idealized positions and refined with isotropic displacement parameters using the riding model [Uiso(h) = 1.2 Ueq(N, C) or 1.5 Ueq(O)] [29]. The Olex2 software [30] was also used to generate graphical illustrations. The data collection and refinement parameters of the salts are listed in Table 1.
The CIF file of structures of HAcv·HSO4, HAcv·NO3 and HAcv·Cl were deposited in the Cambridge Structural Data Base with CCDC number 2247004. 2247005 and 2247006, respectively. Copies of the data can be obtained, free of charge, via www.ccdc.cam.ac.uk (accessed on 4 April 2023).

2.5. Thermal Analysis

Thermogravimetric analysis was performed using a Shimadzu TGA-50 thermobalance instrument. Approximately 4.0 mg of each sample was used for the measurements in an alumina crucible and heated at 10 °C min−1 under N2 atmosphere (50 mL min−1). DSC data were acquired according to previous TGA data, that is, up to the degradation temperature of each compound. These experiments were performed using a Shimadzu DSC-60 calorimeter. The samples were heated at a rate of 10 °C min−1 with a crimped sealed aluminum pan using nitrogen as the purge gas (50 mL min−1). The data were processed using Shimadzu TA-60 thermal data analysis software.

2.6. Hirshfeld Surface

The Hirshfeld surfaces and two-dimensional fingerprint plots for the salts were obtained from the crystallographic information files (CIFs) generated by SCXRD analyses using the CrystalExplorer 17.5 program package [31]. The dnorm surfaces were mapped over the color scale from −0.7 (red) to 1.3 (blue), and the shape index surfaces were obtained in the range of −1.0 (red) to 1.0 (blue). The bidimensional fingerprint plots were generated with the combination of the di and de distances, in the scale of 0.4 to 3.0 Å [31,32].

2.7. Full Interaction Maps

This analysis is useful to explore the intermolecular interactions in solid state and were calculated using the Mercury program [33] based on the molecular interactions library in the Cambridge Structural Database (CSD).

2.8. H Nuclear Magnetic Resonance

The 1H Nuclear Magnetic Resonance (NMR) spectra of the studied compounds were collected on a 9.4 T Bruker Avance III (400 MHz) spectrometer using DMSO-d6 as solvent.

2.9. Equilbirum Solubility Studies

The aqueous solubility of the commercial Acv and its salts was investigated at room temperature using a UV-Vis 1800 Shimadzu spectrophotometer. Saturated solutions of the compounds were prepared, suspending each compound in deionized water (Milli-Q water) and left to stir for 24 h. After 24 h, the solutions were filtered using a 0.45 μm filter, diluted, and measured in the 200–600 nm range. The concentrations of the compounds were determined in comparison with calibration curves constructed using the absorbance values at λ = 251 nm for the standard solution prepared with concentrations ranging from 0.025 to 0.2 mg mL−1.

3. Results and Discussion

3.1. Single Crystal X-ray Diffraction (SCXRD)

Acyclovir is a guanine derivative and possess amphoteric characteristic, acting as weak acid (pka between 2.16 and 2.27) or base (pKa between 9.04 and 9.25), depending on the system which is present. Three different salts were synthesized, considering the basicity of the purine group, using the following inorganic acids: hydrochloric, nitric, and sulfuric. The asymmetric unit of the salts and the geometric parameters of the hydrogen bonds are shown in Figure 2 and Table 1, respectively, while the hydrogen bonds and bond lengths of Acv and its salts are available in Tables S1 and S2.
The formation of the Acv cation occurs through protonation of the N5 atom of the imidazole ring due of the significant differences in the pKa values between Acv and the inorganic acids (ΔpKa > 3) [34,35]. Fourier map analyses and vibrational spectroscopy studies confirmed the presence of hydrogen in N5. The three salts are composed of one protonated ACV molecule and one counterion: hydrogen sulfate, nitrate, or chloride for HAcv·HSO4, HAcv·NO3 and HAcv·Cl, respectively.
The Acv molecule presents conformational flexibility around the (2-hydroxyethoxy)methyl group attached to N4, where the orientation of this group influences the organization of the Acv molecules on the crystal lattice. Figure 3 shows the overlay of the Acv molecular conformations observed in the structure of the salts, as well as the free Acv (CCDC code MECWIC) [36]. It can be noticed that the Acv molecule in HAcv·NO3 has the most different conformation for the (2-hydroxyethoxy)methyl group, which is positioned in the opposite direction when compared to Acv and the other salts. This conformational difference involves the δ angle and is a consequence of the difference in the intermolecular interactions between Acv and the anions. The conformational analyses the structures shows that the N5-C5 bond length is stable along the three salts, meanwhile the N5-C3 bond length shows different values: 1.391 (3) Å in Acv and 1.383 (2) Å, 1.385 (2) Å and 1.386 (5) Å in HAcv·HSO4, HAcv·Cl and Hacv·NO3, respectively. In contrast, the C3–N5–C5 P5 bond angles show small differences: 107.970° (11), 108.221° (14) and 108.669° (3) for HAcv·HSO4, HAcv·Cl and HAcv·NO3, respectively. However, no other substantial changes in the imidazole ring were verified due to the protonation.
The HAcv·HSO4 salt crystallizes in the triclinic P-1 space group, with one HAcv+ cation and one hydrogen sulfate anion per asymmetric unit. The presence of only one O–H group in the HSO4 counterion is evidenced by the S1–O5 bond length, which has a single bond character and is at least 0.11 Å longer than the others S–O bonds [37]. Figure 4a,b show the crystal packing of HAcv·HSO4 with the representation of the N–H⋯O, N–H⋯N and O–H⋯O intermolecular interactions.
The crystal packing of HAcv·HSO4 is composed by HAcv+ and HSO4 intercalated layers along the [001] direction (Figure 4a), connected through N–H⋯O and O–H⋯O hydrogen bonds. The N–H⋯N and O–H⋯O intermolecular interactions between two HAcv+ cations and two hydrogen sulfate anions, respectively, are responsible for the formation of homosynthons, while the N–H⋯O interactions between the 2-aminopyrimidine groups and the hydrogen sulfate anions form heterosynthons that form ribbons with R 2 2 ( 8 ) motifs (Figure 4c). These ribbons are linked by N5–H5⋯O3 interactions. In this structure the hydrogen sulfate anions participate in HSO4⋯π interactions with the acyclovir rings with distance 2.969 (12) Å and 3.083 (12) Å as reported previously [38].
The asymmetric unit of the HAcv·NO3 salt is composed of one HAcv+ cation and one nitrate anion and crystallizes in the monoclinic P21/c space group with a twinned structure along the [001] direction. The crystal structure of HAcv·NO3 is stabilized by classical O–H⋯O and N–H⋯O hydrogen bonds (Figure 5) that form a bi-dimensional supramolecular network along the [100] plane. Dimeric arrangements are formed with the association of two HAcv+ cations through the N1–H1⋯O3′ hydrogen bond as well as π⋯π stacking interaction (3.624 Å) involving the pyrimidine rings (Figure 5b). The dimers are connected through the N2–H2a⋯O1″ as well as the bifurcated N2–H2b⋯O1′⋯H5″–N5″ interactions ( C 2 1 ( 9 ) graph set). In addition, the interactions between the HAcv+ and NO3 ions form synthons with R 3 3 ( 10 ) and R 3 2 ( 9 ) graph sets (Figure 5c).
The crystal structure of HAcv·Cl belongs to the triclinic P-1 space group with the asymmetric unit formed by one HAcv+ cation and one chloride ion. The HAcv+⋯HAcv+ and HAcv+⋯Cl interactions stabilize the bidimensional network along the [100] plane, as showed in Figure 6a. The formation of Cl and HAcv+ chain-like arrangements, which were intercalated along the [001] direction, was observed. HAcv+ homosynthon, with R 2 2 ( 16 ) motif, are obtained through the N2–H2a⋯O1″ interactions, while the N1–H1⋯Cl1‴ and N2–H2b⋯Cl1‴ interactions form a heterosynthon with R 2 1 ( 6 ) motif (Figure 6c). A π⋯π stacking interaction with distance 3.417 (2) Å was also observed for HAcv·Cl (Figure 6c), which connects two HAcv+ cations through purine groups with the formation of a pseudo-dimeric structure.

3.2. Hirshfeld Surfaces Analysis

Hirshfeld surfaces (HS) analysis and the 2D-fingerprint plots (FP) allow the investigation of intermolecular interactions in crystal structures. Normalizing the distances from the HS to the nearest atom inside (di) and outside (de) the surface by the van der Waals radii of the atoms gives the origin to the dnorm HS, which shows the contacts in the crystal structure of a compound. The dnorm surface shows regions in red, white, and blue to indicate the contacts with distances shorter and longer than the sum of the vdW radii of the involved atoms, respectively. The shape index (S) is another HS property that helps evaluate the π⋯π stacking interactions, which are indicated by pairs of blue and red triangles. The HS mapped on dnorm property are represented in Figure 7, while the FP and shape index surfaces are shown in Figures S1–S4.
The red spots observed in the dnorm HS of the salts indicate that N–H⋯O hydrogen bonds stabilize the three structures. The surfaces also show the presence of O–H⋯N hydrogen bonds in the HAcv·HSO4 and HAcv·NO3 structures, due to the presence of oxygen atoms in the counterions as well as N–H⋯N interaction in HAcv·HSO4 and N–H⋯Cl and O–H⋯Cl interactions in HAcv·Cl. Furthermore, it was possible also to observe the presence of non-classical C–H⋯O interactions in the structure of the salts. Pairs of red and blue triangles are present on the shape index surface (Figure S4) of HAcv·NO3 and HAcv·Cl, indicating the presence of π⋯π interactions in the crystal structure of both salts.
The 2D-fingerprint plots of the salts (Figures S1–S3) clearly show the intermolecular contacts present in the structures. The decomposition of these fingerprints allows the quantification of the contribution of each contact to the crystal packing. The FPs of the synthesized compounds, presented in Figure S7, show that the H⋯H and O⋯H contacts were the major contributors to the crystal packing of these salts. H⋯H comprise 28.9%, 27.0% and 36.7% for HAcv·HSO4, HAcv·NO3; and HAcv·Cl, respectively. Meanwhile, the O⋯H contacts represented 44.8% (HAcv·HSO4), 49.6% (HAcv·NO3), and 27.2% (HAcv·Cl). The H⋯H contribution of HAcv·Cl was higher than the O⋯H one due to the absence of oxygen atoms in its anion (Cl). An opposite situation was observed for the other two salts. The HAcv·NO3 and HAcv·Cl have more C⋯C and C⋯N contacts contribution than the one observed for HAcv·HSO4. This is due to the presence of the π⋯π stacking interactions in the HAcv·NO3 and HAcv·Cl structures, as verified in the shape index surfaces. The O⋯H contacts are observed in regions of smaller di and de values in the FPs for the three compounds, an indicative that these interactions are shorter and stronger than the other ones.

3.3. Full Interaction Maps Analysis

A search in the CSD database only show a few reported Acv solid form crystal structures, and none of them show a further evaluation of the interactions of the functional groups. The display of the Full Interaction Maps (FIMs) created using carbonyl oxygen and alcohol oxygen probes for the Acv, and with an additional charged (NH) nitrogen probe for the salts; Providing an overview of the preferred directionality and the strength of the potential interactions that the functional groups in the molecule can form.
The FIM of the anhydrous Acv form can be observed in Figure S5a. The blue regions (related to the donor probe) indicate a higher propensity of the O1, O2, and N5 atoms (donor region) to donate electron density to the O3, N2, and N1 atoms (acceptor region). These regions are connected by O1⋯H5-O3, O1⋯H2B-N2, N5⋯H1-N1 and O2⋯H2A-N2 interactions. Meanwhile, the red regions (related to the acceptor probe maps) involve the N3, N2, N1, O3, and N5 atoms and show a significant propensity to receive electrons, which stabilize the crystal structure through the functional groups involving the O1, O2, N3, and N1 atoms, as discussed previously. Figures S5b and S6 also show similar donor and acceptor groups for the Acv salts HAcv·HSO4, HAcv·NO3 and HAcv·Cl. Table 2 summarizes the hydrogen bonds in the studied compounds.

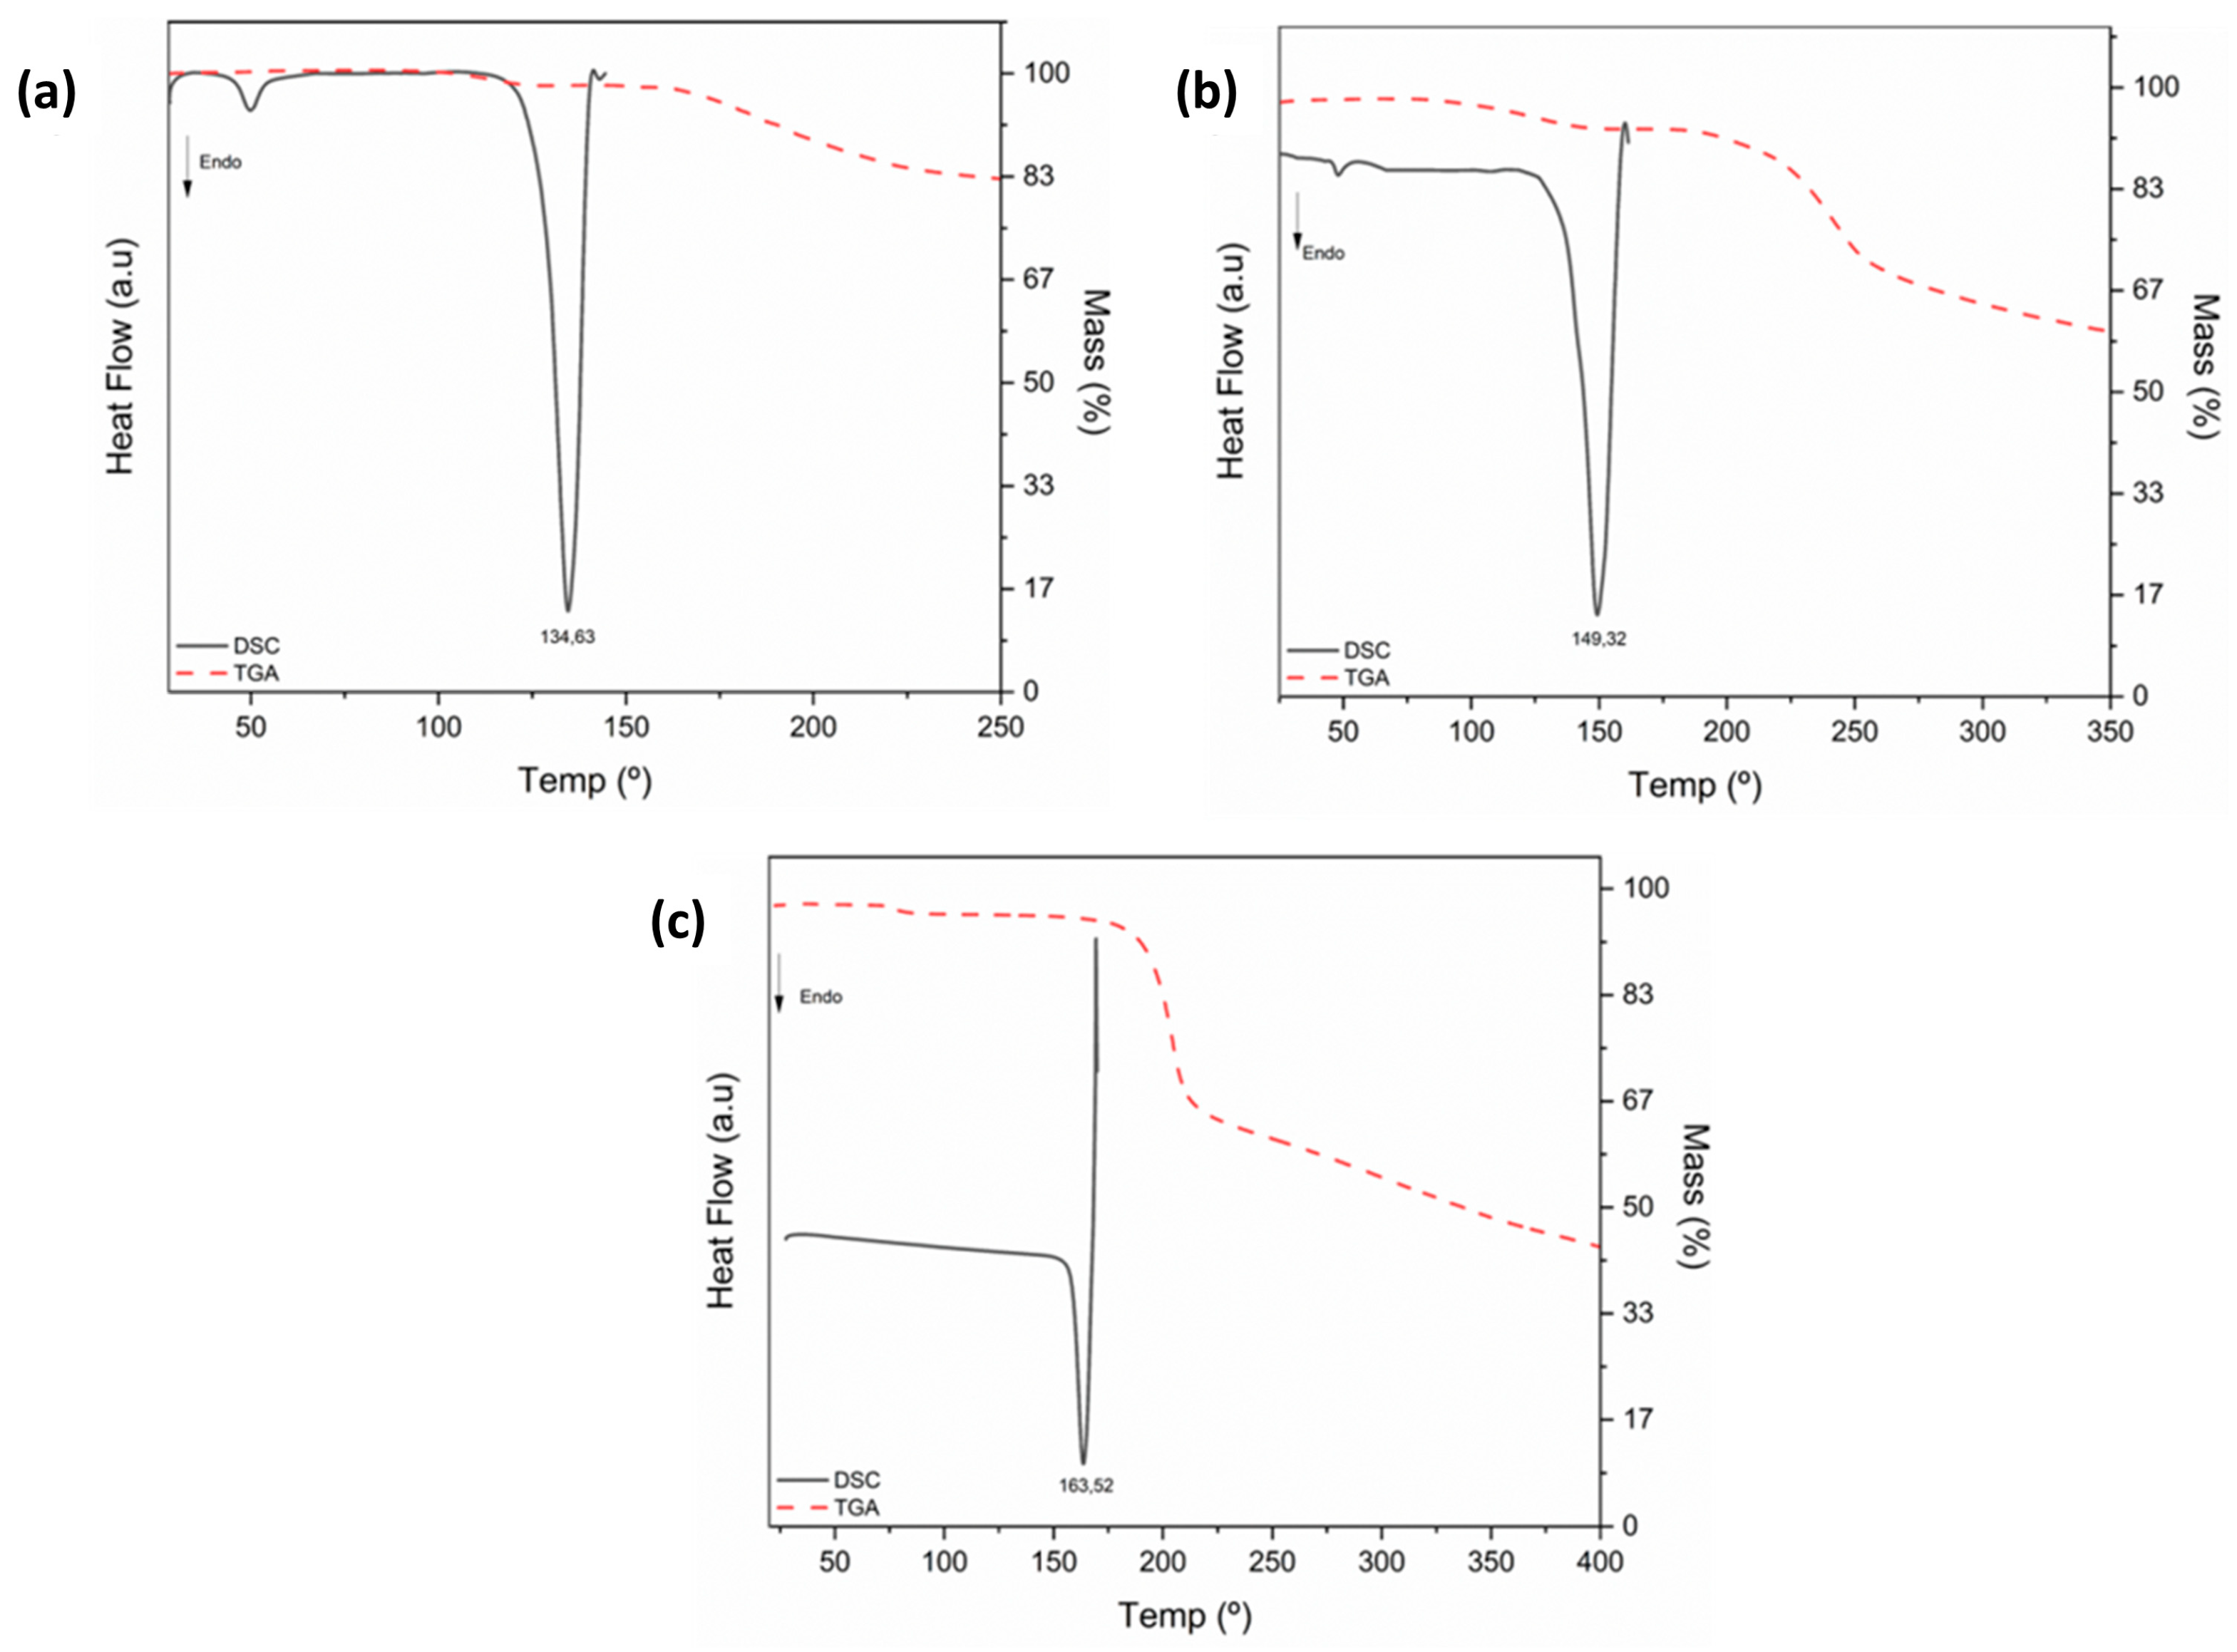
3.4. Thermal Analysis

The thermal behaviour of the Acv salts was studied using a combination of DSC/TGA techniques. The curves are presented in Figure 8. The phase purity of the salts was evaluated by observing the presence of a single endothermic peak associated with the melting point of the compounds, shown in the corresponding DSC curves at 134 °C, 149 °C, and 163 °C for the HAcv·HSO4, HAcv·Cl and HAcv·NO3, respectively. It is possible to identify one more endothermic event in HAcv·HSO4 and HAcv· at 49 °C and 47 °C, which could be associated to the loss of a small amount of water that could be present in the samples due to the hydroscopic tendency showed by these salts. To the enthalpy evaluated in the salts the values are presented in order: HAcv·Cl (192.2 J g−1) > HAcv·HSO4 (111.4 J g−1) > HAcv·NO3 (110.8 J g−1).
According to the TGA data, the thermal degradation of HAcv·HSO4, HAcv·Cl and HAcv·NO3 began at 165 °C, 187 °C and 180 °C, respectively. Thermal stability can be associated with the rupture of the crystal structure upon exposure to the heating process in an inert environment as an experimental condition in the DSC/TGA experiments. The thermal behaviour observed with TGA for Acv salts allows to establish a thermal stability based in the degradation of the compounds in order: HAcv·Cl, HAcv·NO3 and HAcv·HSO4.

3.5. Spectroscopic Analysis

The FT-IR and Raman studies of Acv and its salts were performed to confirm the formation of salts (Figure 9 and Figure 10). FT-IR and Raman spectra of the Acv sample confirmed that the API used in the supramolecular synthesis corresponded to Acv sesquihydrate [19]. The salt formation was identified by evaluating the changes in the frequency of some vibrational modes related to the promoted N5 atom from the imidazolium group, as well as the formation of new hydrogen bonds between the API and anions. The band assignments are listed in Table 3.
The FT-IR spectra show that ν(N-H) stretching frequencies associated with the imidazolium group are present in HAcv·HSO4 (3417 cm−1), HAcv·Cl (3523 cm−1) and HAcv·NO3 (3425 cm−1), but not in Acv (Figure 9). The inorganic anions used as coformers show different FT-IR characteristics, starting with the HSO4 and NO3 anions, which show ν(SO) and ν(NO3) bands at 1054 cm−1 and 1384 cm−1, respectively.
The Raman spectra of Acv and its salts present clear differences that can be attributed to the protonation of the imidazolium group and the vibrational modes arising from the inorganic anions (see Figure 10). The HSO4 and NO3 anions show ν(SO) and ν(NO3) stretching bands at 1020 cm−1 and 1282 cm−1, respectively. As expected, no bands corresponding to the Cl anion were observed in the Raman spectrum of HAcv·Cl. A new δ(N–H) band was present in the Raman spectra of the salts HAcv·HSO4 (3152 cm−1), HAcv·Cl (3312 cm−1) and HAcv·NO3 (3321 cm−1), which confirms the protonation of the imidazolium ring from Acv.

3.6. H NMR Spectroscopy

The 1H NMR spectra for Acv and its salts were obtained using DMSO-d6 as solvent and reference. The 1H spectra for each compound and the chemical shifts (δ) are presented in the Supplementary material (Figures S8–S10 and Table S2).
The spectrum of the free Acv shows the signals of the guanine group in the range of 10.70 to 6.50 ppm, appearing as singlets with the integration of 1, 1, and 2 for the -NH-C(O)- (10.64 ppm), N=CH-N (7.82 ppm) and -NH2 (6.51 ppm) groups, respectively. The hydrogens atoms from the methylene carbons of the (2-hydroxyethoxy)methyl group appear as signals in 5.35 and 3.47 ppm, with the first one as a singlet (integration of 2) correspondent to the -NCH2O- group, while the last one as a multiplet integrating for 4, being a superposing of the signals correspondent to the hydrogens from the ethyl group. These results are comparable to some data reported previously for Acyclovir [39].
The spectra of the salts also showed the signals corresponding to the hydrogens from the N=CH-N, -NH2 and -NCH2O- groups, but in regions with higher chemical shifts, which occurred due to the protonation of the Acv molecule. The signal related to the ethyl group in the free Acv spectrum is seen as two multiplets in the salts spectra, with the hydrogens from the carbon bonded to the hydroxyl being a little more deshielded than the other carbon. The protonation of the imidazolium ring is verified with the appearance of a new singlet (integration of 1) in the 11.07 to 11.29 ppm in the spectra of the salts. Unfortunately, the signal corresponding to the amide was not observed in the spectra of the salts, probably due to the possible exchange of the proton between the Acv cation and the solvent.

3.7. Equilibrium Solubility

Solubility is an important property of an API because of your strong relation with its oral absorption and pharmaceutical work. The Acv (Commercial form) and his anhydrous form exhibit solubility/permeability issues [20] that place this drug as a BCS class III or IV API, depending on the mg/tablet (drug concentration) [21,22]. In attempt to evaluate the aqueous solubility of the acyclovir salts, the synthesized compounds were measured in an aqueous solution (the concentration of acyclovir compounds in a saturated aqueous solution in the presence of undissolved solid) of the HAcv·HSO4, HAcv·NO3 salts. According to the Figure S12, the HAcv·HSO4 and HAcv·NO3 shows to be 2.5 and 1.8 times more soluble when compared to the commercial form of Acv (5.9 mM of solubility), presenting an aqueous solubility of 7.7 mM and 15.7 mM, respectively. Meanwhile the HAcv·HCl present a solubility of 241 mM [22].

4. Conclusions

Within our effort to develop new solid forms with improved pharmacokinetic properties of repurposed drugs as a subsidiary to the combat Covid-19 pandemic, two new salts of Acv were studied: HAcv·HSO4 and HAcv·NO3. These new solid forms and the HAcv·Cl salt were further characterized by Single-crystal X-ray diffraction, Hirshfield surface (HS) studies, and thermal and spectroscopic analyses. The evaluation of the crystal structures revealed that the three salts showed protonation of the imidazolium nitrogen N5. The DSC/TGA results obtained for the Acv salts allowed the establishment of the following thermal stability order: HAcv·Cl > HAcv·NO3 > HAcv·HSO4. The evaluation of aqueous solubility allows to determine that the new salts are more soluble that the commercial form of the Acv showing solubility of 7.7 mM (HAcv·HSO4) and 15.7 mM (HAcv·NO3). Thus, based on the supramolecular features/interactions presented in this work, a better comprehension of the pharmacologic properties of the salts is needed as a research proposal for future studies.

Supplementary Materials

The following supporting information can be downloaded at: https://www.mdpi.com/article/10.3390/cryst13050782/s1, Figure S1: Fingerprint images (a) C-C (b) C-N (c) H-H (d) N-H (e) O-H and (f) Total of Acv hydrogen-sulfate salt; Table S1: Hydrogen Bonds for the Acv salts; Figure S2: Fingerprint images (a) C-C (b) C-N (c) H-H (d) N-H (e) O-H and (f) Total of Acv nitrate salt; Table S2: Bond Lengths for the Acv salts; Figure S3: Fingerprint images (a) C-C (b) C-N (c) H-H (d) N-H (e) O-H (f) H-Cl and (g) Total of Acv hydrochloride salt; Table S3: 1H NMR data for commercial acyclovir and its salts; Figure S4: Detail Hirshfeld surfaces mapped in shape index (a) Acv nitrate and (b) Acv hydrochloride salts; Figure S5: Full interaction Maps of (a) Acyclovir free solvent and (b) Acv hydrogen-sulfate salt; Figure S6: Full interaction Maps of (a) Acv hydrochloride (b) Acv nitrate salts; Figure S7: % of contacts contribution in Acv salts; Figure S8: 1H NMR (400 MHz) spectrum of commercial Acv in DMSO-d6; Figure S9: 1H NMR (400 MHz) spectrum of commercial HAcv·HSO4 in DMSO-d6; Figure S10: 1H NMR (400 MHz) spectrum of commercial HAcv·NO3 in DMSO-d6; Figure S11: 1H NMR (400 MHz) spectrum of commercial HAcv·Cl in DMSO-d6; Figure S12: Aqueous solubility of Acv salts.

Author Contributions

Conceptualization, P.N. and P.H.d.O.S.; methodology, P.H.d.O.S. and J.E.; validation, P.N., P.H.d.O.S., C.C.P.d.S. and J.E.; formal analysis, P.N., P.H.d.O.S. and J.E.; investigation, P.N.; resources, J.E.; data curation, P.H.d.O.S. and J.E.; writing—original draft preparation, P.N., P.H.d.O.S. and C.C.P.d.S.; writing—review and editing, P.N., P.H.d.O.S., C.C.P.d.S. and J.E.; supervision, J.E.; project administration, J.E.; funding acquisition, J.E. All authors have read and agreed to the published version of the manuscript.

Funding

This research received no external funding.

Data Availability Statement

All data used to support the findings of this study are included within the article.

Acknowledgments

The authors are grateful to the Brazilian funding agencies FAPESP (2017/15840-0 and 2021/10066-5) and CNPq (JE grant, 312505/2021-3). We also thanks Marcelo Barbosa de Andrade (M.B.A. grant 13/03487-8) from the Centro de Caracterização de Espécies Minerais (CCEM-IFSC) for allowing access to the Raman facilities.

Conflicts of Interest

The authors declare no conflict of interest.

References

  1. Pezzini, B.R.; Silva, M.A.S.; Ferraz, H.G. Formas Farmacêuticas Sólidas Orais de Liberação Prolongada: Sistemas Monolíticos e Multiparticulados. Rev. Bras. Ciênc. Farm. 2007, 43, 491–502. [Google Scholar] [CrossRef]
  2. Gardner, C.R.; Walsh, C.T.; Almarsson, Ö. Drugs as Materials: Valuing Physical Form in Drug Discovery. Nat. Rev. Drug Discov. 2004, 3, 926–934. [Google Scholar] [CrossRef]
  3. Grothe, E.; Meekes, H.; Vlieg, E.; ter Horst, J.H.; de Gelder, R. Solvates, Salts, and Cocrystals: A Proposal for a Feasible Classification System. Cryst. Growth Des. 2016, 16, 3237–3243. [Google Scholar] [CrossRef]
  4. Sheth, A.R.; Grant, D.J.W. Relationship between the Structure and Properties of Pharmaceutical Crystals. KONA Powder Part. J. 2005, 23, 36–48. [Google Scholar] [CrossRef]
  5. Byrn, S.R.; Xu, W.; Newman, A.W. Chemical Reactivity in Solid-State Pharmaceuticals: Formulation Implications. Adv. Drug Deliv. Rev. 2001, 48, 115–136. [Google Scholar] [CrossRef]
  6. Borcherding, N.; Jethava, Y.; Vikas, P. Repurposing Anti-Cancer Drugs for COVID-19 Treatment. Drug Des. Dev. Ther. 2020, 14, 5045–5058. [Google Scholar] [CrossRef]
  7. Sahoo, B.M.; Ravi Kumar, B.V.V.; Sruti, J.; Mahapatra, M.K.; Banik, B.K.; Borah, P. Drug Repurposing Strategy (DRS): Emerging Approach to Identify Potential Therapeutics for Treatment of Novel Coronavirus Infection. Front. Mol. Biosci. 2021, 8, 628144. [Google Scholar] [CrossRef]
  8. Gao, Y.; Yan, L.; Huang, Y.; Liu, F.; Zhao, Y.; Cao, L.; Wang, T.; Sun, Q.; Ming, Z.; Zhang, L.; et al. Structure of the RNA-Dependent RNA Polymerase from COVID-19 Virus. Science 2020, 368, 779–782. [Google Scholar] [CrossRef]
  9. Nie, Z.; Sun, T.; Zhao, F. Safety and Efficacy of Antiviral Drugs for the Treatment of COVID-19: A Systematic Review. Infect. Drug Resist. 2022, 15, 4457–4466. [Google Scholar] [CrossRef]
  10. Martinez, M.A. Efficacy of Repurposed Antiviral Drugs: Lessons from COVID-19. Drug Discov. Today 2022, 27, 1954–1960. [Google Scholar] [CrossRef]
  11. O’Brien, J.J.; Campoli-Richards, D.M. Acyclovir. Drugs 1989, 37, 233–309. [Google Scholar] [CrossRef]
  12. Shaik, S.; Soundhararajan, R.; Srinivasan, H. Repurposing of Drugs Targeted Against COVID-19 Spike Receptor for Treatment: An In Silico Approach. Biointerface Res. Appl. Chem. 2021, 11, 13740–13753. [Google Scholar] [CrossRef]
  13. Heidary, F.; Madani, S.; Gharebaghi, R.; Asadi-Amoli, F. Acyclovir as a Potential Add-on Therapy in COVID-19 Treatment Regimens. Pharm. Sci. 2021, 27, S68–S77. [Google Scholar] [CrossRef]
  14. Guo, D. Old Weapon for New Enemy: Drug Repurposing for Treatment of Newly Emerging Viral Diseases. Virol. Sin. 2020, 35, 253–255. [Google Scholar] [CrossRef]
  15. Kumar, D.; Sanatan, A.R.; Kumari, K.; Bahadur, I.; Singh, P. Promising Acyclovir and Its Derivatives to Inhibit the Protease of SARS-CoV-2: Molecular Docking and Molecular Dynamics Simulations. Res. Sq. 2020, PPR228623. [Google Scholar] [CrossRef]
  16. Wang, L.; Zhao, Y.; Zhang, Z.; Wang, J.; Wang, Q.; Zheng, Z.; Deng, Z.; Zhang, H. Polymorphs of Acyclovir-Maleic Acid Salt and Their Reversible Phase Transition. J. Mol. Struct. 2017, 1127, 247–251. [Google Scholar] [CrossRef]
  17. Hilya, N.I.; Agnes Nuniek, W.; Setyawan, D.; Hendradi, E. Improvement of Dissolution Properties through Acyclovir—Succinic Acid Cocrystal Using Solvent Evaporation Technique. Int. J. Drug Deliv. Technol. 2017, 7, 304–309. [Google Scholar] [CrossRef]
  18. Yan, Y.; Chen, J.M.; Lu, T.B. Simultaneously Enhancing the Solubility and Permeability of Acyclovir by Crystal Engineering Approach. CrystEngComm 2013, 15, 6457–6460. [Google Scholar] [CrossRef]
  19. Lutker, K.M.; Quiñones, R.; Xu, J.; Ramamoorthy, A.; Matzger, A.J. Polymorphs and Hydrates of Acyclovir. J. Pharm. Sci. 2011, 100, 949–963. [Google Scholar] [CrossRef]
  20. Arnal, J.; Gonzalez-Alvarez, I.; Bermejo, M.; Amidon, G.L.; Junginger, H.E.; Kopp, S.; Midha, K.K.; Shah, V.P.; Stavchansky, S.; Dressman, J.B.; et al. Biowaiver Monographs for Immediate Release Solid Oral Dosage Forms: Aciclovir. J. Pharm. Sci. 2008, 97, 5061–5073. [Google Scholar] [CrossRef]
  21. Savjani, J.K.; Pathak, C. Improvement of Physicochemical Parameters of Acyclovir Using Cocrystallization Approach. Braz. J. Pharm. Sci. 2016, 52, 727–734. [Google Scholar] [CrossRef]
  22. Shamshina, J.L.; Cojocaru, O.A.; Kelley, S.P.; Bica, K.; Wallace, S.P.; Gurau, G.; Rogers, R.D. Acyclovir as an Ionic Liquid Cation or Anion Can Improve Aqueous Solubility. ACS Omega 2017, 2, 3483–3493. [Google Scholar] [CrossRef]
  23. Balfour, H.H. Acyclovir Therapy for Herpes Zoster: Advantages and Adverse Effects. JAMA 1986, 255, 387–388. [Google Scholar] [CrossRef]
  24. Serajuddin, A.T.M. Salt Formation to Improve Drug Solubility. Adv. Drug Deliv. Rev. 2007, 59, 603–616. [Google Scholar] [CrossRef]
  25. Martins, F.T.; Bonfilio, R.; de Araújo, M.B.; Ellena, J. Lamivudine Salts with Improved Solubilities. J. Pharm. Sci. 2012, 101, 2143–2154. [Google Scholar] [CrossRef]
  26. Bharate, S.S. Recent Developments in Pharmaceutical Salts: FDA Approvals from 2015 to 2019. Drug Discov. Today 2021, 26, 384–398. [Google Scholar] [CrossRef]
  27. CrysAlisPro, Agilent Technologies Ltd.: Yarnton, Oxfordshire, UK, 2022.
  28. Sheldrick, G.M. SHELXT—Integrated Space-Group and Crystal-Structure Determination. Acta Crystallogr. Sect. A Found. Adv. 2015, 71, 3–8. [Google Scholar] [CrossRef]
  29. Sheldrick, G.M. Crystal Structure Refinement with SHELXL. Acta Crystallogr. Sect. C Struct. Chem. 2015, 71, 3–8. [Google Scholar] [CrossRef]
  30. Dolomanov, O.V.; Bourhis, L.J.; Gildea, R.J.; Howard, J.A.K.; Puschmann, H. OLEX2: A Complete Structure Solution, Refinement and Analysis Program. J. Appl. Crystallogr. 2009, 42, 339–341. [Google Scholar] [CrossRef]
  31. Spackman, P.R.; Turner, M.J.; McKinnon, J.J.; Wolff, S.K.; Grimwood, D.J.; Jayatilaka, D.; Spackman, M.A. CrystalExplorer: A Program for Hirshfeld Surface Analysis, Visualization and Quantitative Analysis of Molecular Crystals. J. Appl. Crystallogr. 2021, 54, 1006–1011. [Google Scholar] [CrossRef]
  32. Spackman, M.A.; Jayatilaka, D. Hirshfeld Surface Analysis. CrystEngComm 2009, 11, 19–32. [Google Scholar] [CrossRef]
  33. Macrae, C.F.; Edgington, P.R.; McCabe, P.; Pidcock, E.; Shields, G.P.; Taylor, R.; Towler, M.; van de Streek, J. Mercury: Visualization and Analysis of Crystal Structures. J. Appl. Crystallogr. 2006, 39, 453–457. [Google Scholar]
  34. Bell, R.P. The Proton in Chemistry; Springer: New York, NY, USA, 1973. [Google Scholar]
  35. Dean, J.A.; John, A.; Lange, N.A. Lange’s Handbook of Chemistry; McGraw-Hill: New York, NY, USA, 1999; ISBN 0070163847. [Google Scholar]
  36. Tutughamiarso, M.; Wagner, G.; Egert, E. Cocrystals of 5-Fluorocytosine. I. Coformers with Fixed Hydrogen-Bonding Sites. Acta Crystallogr. Sect. B Struct. Sci. 2012, 68, 431–443. [Google Scholar] [CrossRef]
  37. Kemnitz, E.; Weber, C.; Trojanov, S. Reinvestigation of Crystalline Sulfuric Acid and Oxonium Hydrogensulfate. Acta Crystallogr. Sect. C Cryst. Struct. Commun. 1996, 52, 2665–2668. [Google Scholar] [CrossRef]
  38. Garcia-Raso, A.; Albertí, F.M.; Fiol, J.J.; Tasada, A.; Barceló-Oliver, M.; Molins, E.; Escudero, D.; Frontera, A.; Quiñonero, D.; Deyà, P.M. Anion-π Interactions in Bisadenine Derivatives: A Combined Crystallographic and Theoretical Study. Inorg. Chem. 2007, 46, 10724–10735. [Google Scholar] [CrossRef]
  39. Gao, H.; Mitra, A.K. NMR Spectral Data for Acyclovir Prodrugs. Magn. Reson. Chem. 1999, 37, 687–689. [Google Scholar] [CrossRef]
Figure 1. Molecular structure of acyclovir (Acv) showing the torsion angles δ, χ and τ.
Crystals 13 00782 g001
Figure 2. ORTEP type illustration of the asymmetric unit of (a) Acv hydrogen sulfate, (b) Acv nitrate and (c) Acv hydrochloride with crystallographic labelling. Thermal ellipsoids represented at 50% probability level.
Crystals 13 00782 g002
Figure 3. Overlay of the Acv molecule with the HAcv+ cations obtained by superposing of pyrimidine rings. Hydrogen atoms were omitted for clarity.
Crystals 13 00782 g003
Figure 4. Crystal packing of HAcv·HSO4 (a) through the ac plane (b) viewed through the bc plane (c) Graphic set of the three motifs R 2 2 (8), involving the interaction of Acv+ molecules mediated by HSO4.
Crystals 13 00782 g004
Figure 5. Crystal packing of HAcv·NO3. (a) 2D supramolecular arrangement viewed through the bc plane (b) π⋯π interactions forming a dimeric arrangement (c) Graphic set motifs R 3 3 (10), R 3 2 (9) and C 2 1 (9) involving the interaction of Acv+ molecules mediated by NO3.
Crystals 13 00782 g005
Figure 6. Crystal packing of HAcv·Cl. (a) 2D supramolecular arrangement viewed through the bc plane (b) Graphic set motif R 2 2 (16) and R 2 1 (6) involving the interaction of Acv+ molecules and mediated by Cl (c) π⋯π interactions forming a dimeric arrangement.
Crystals 13 00782 g006
Figure 7. HS of (a) Acv hydrogen sulfate, (b) Acv nitrate and (c) Acv hydrochloride mapped in dnorm.
Crystals 13 00782 g007
Figure 8. DSC/TGA curves of (a) Acv hydrogen sulfate, (b) Acv hydrochloride and (c) Acv nitrate.
Crystals 13 00782 g008
Figure 9. FT-IR spectra of Acv (green) and its salts, HAcv·HSO4 (black), HAcv·NO3 (blue), and HAcv·Cl (red).
Crystals 13 00782 g009
Figure 10. Raman spectra of Acv (green) and its salts Hacv·HSO4 (blue), Hacv·NO3 (red), and Hacv·Cl (black).
Crystals 13 00782 g010
Table 1. Crystallographic parameters of Acv Salts.
HAcv·HSO4HAcv·NO3HAcv·Cl
Chemical formulaC8H13N5O7SC8H12N6O6C8H12N5O3Cl
Molar mass (g mol−1)323.29288.24261.68
Crystal systemTriclinicMonoclinicTriclinic
Space groupP-1P21/cP-1
a (Å)7.7475 (1)11.9342 (10)6.6360 (5)
b (Å)8.6389 (1)14.8161 (10)8.6147 (6)
c (Å)10.4881 (1)6.7449 (8)10.2881 (8)
α (o)74.2290 (10)9083.137 (6)
β (o)85.7930 (10)90.4810 (90)71.696 (7)
γ (o)69.1930 (10)9080.607 (6)
V (Å3)631.28 (1)1192.58 (19)549.43 (7)
Z242
Density/g cm−31.7011.6051.582
θmin, θmax/o8.764, 140.0849.516, 148.9889.078, 140.024
Index ranges−9 ≤ h ≤ 9−14 ≤ h ≤ 14−8 ≤ h ≤ 8
−10 ≤ k ≤ 10−18 ≤ k ≤ 18−9 ≤ k ≤ 10
−12 ≤ l ≤ 12−8 ≤ l ≤ 8−12 ≤ l ≤ 12
F (000)336.0600.0272.0
μ/mm−12.7531.2043.183
Absorption correctionGaussianMulti-scanGaussian
Max./min. transmission1.000/0.4331.000/0.4741.000/0.370
Measured reflections26,01235855287
Independent reflections/Rint2400/0.0293585/2022/0.039
Refined parameters192183155
Final R indexes [I ≥ 2σ(I)]R1 = 0.0258/wR2 = 0.0672R1 = 0.0622/wR2 = 0.1606R1 = 0.0334/wR2 = 0.0846
Final R indexes [all data]R1 = 0.0260/wR2 = 0.0674R1 = 0.0901/wR2 = 0.1811R1 = 0.0361/wR2 = 0.0865
GooF1.0711.0501.062
Largest diff. peak and hole (eÅ−3)0.20/−0.440.31/−0.330.35/−0.29
CCDC number224700422470052247006
Table 2. Hydrogen bonds by region (Donor and Acceptors).
BlueRed
AcvO1⋯H5-O3O2⋯H2A-N5N2-H2A⋯O2
O1⋯H2B-N5 N1-H1⋯N5
N5⋯H1-N1 O3-H5⋯O1
HAcv·HSO4O3-H5⋯N5 N2-H2A⋯N3N5-H5⋯O3
N5-H2B⋯O5O3-H3⋯O6
N1-H1⋯O4
HAcv·NO3O1-H2A⋯N2 N2-H2A⋯O1N5-H5⋯O5
O3-H1⋯N2 N5-H2B⋯O5O3-H3⋯O4
N1-H1⋯O3O3-H3⋯O5
HAcv·ClO3-H5⋯N5 N2-H2A⋯O2N5-H5⋯O5
N5-H2B⋯ClN1-H1⋯Cl
Atoms in bold are related to the region detached.
Table 3. Main bands (cm−1) for IR and Raman spectra of Acv and its salts.
AcvHAcv·HSO4HAcv·ClHAcv·NO3
IRRamanIRRamanIRRamanIRRaman
ν(C–N)11851355116413411182133811511336
ν(C=N)14851611148716101483160414851600
ν(C=O)16931630171417031693170317081717
ν(N–H)3475341731523523331234253321
ν(NO3)13841282
ν(SO)10541020
Disclaimer/Publisher’s Note: The statements, opinions and data contained in all publications are solely those of the individual author(s) and contributor(s) and not of MDPI and/or the editor(s). MDPI and/or the editor(s) disclaim responsibility for any injury to people or property resulting from any ideas, methods, instructions or products referred to in the content.

