Review

Atomic-Scale Imaging of Organic-Inorganic Hybrid Perovskite Using Transmission Electron Microscope

1
Analysis & Testing Center, Beijing Institute of Technology, Beijing 102488, China
2
Experimental Center for Advanced Materials, School of Materials Science and Engineering, Beijing Institute of Technology, Beijing 100081, China
3
Shenzhen BTR New Energy Technology Institute Co., Ltd., Shenzhen 518118, China
4
Department of Materials Science and Engineering, McMaster University, 1280 Main St. W, Hamilton, ON L8S 4L8, Canada
*
Author to whom correspondence should be addressed.
Crystals 2023, 13(6), 973; https://doi.org/10.3390/cryst13060973
Submission received: 2 June 2023 / Revised: 12 June 2023 / Accepted: 17 June 2023 / Published: 19 June 2023
(This article belongs to the Special Issue Recent Achievements and Progress in Perovskite Photovoltaics)

Abstract

:
Transmission electron microscope (TEM) is thought as one powerful tool to imaging the atomic-level structure of organic inorganic hybrid perovskite (OIHP) materials, which provides valuable and essential guidance toward high performance OIHP-related devices. However, these OIHPs exhibit poor electron beam stability, severely limiting their practical applications in TEM. Here in this article, the application of TEM to obtain atomic-scale image of OIHPs, main obstacles in identifying the degradation product and future prospects of TEM in the characterization of OIHP materials are reviewed and presented. Three potential strategies (sample protection, low temperature technology, and low-dose technologies) are also proposed to overcome the current drawback of TEM technology.

1. Introduction

Organic-inorganic hybrid perovskites (OIHPs) have attracted broad attentions due to their excellent opto-electronic properties [1,2,3,4,5,6,7], including long diffusion length, high defect tolerance, decent absorption properties, etc., which have been widely used in photovoltaic, photocatalysis [8], and photoelectronic devices, including solar cells, LED [9], and photodetectors. In the past decade, the power conversion efficiency (PCE) of perovskite solar cells (PSCs) has rapidly increased from the initial 3.8% [10] to 26.0% [11], rivaling already the best silicon cells (~26.8%). OIHPs possess a general chemical formula of ABX3 as illustrated in Figure 1, where A represents a monovalent cation, including methylammonium (CH3NH3+, denoted as MA+) or formamidinium (HC(NH2)2+, denoted as FA+), B represents a bivalent metal cation such as Pb2+ and Sn2+, and X for Cl, Br, or I. Previous studies unraveled that even atomic-level structural changes could affect the resultant device performance, as can be observed from the deteriorated device PCE under operational conditions [12], which hamper the PSC commercialization. It is thus imperative and necessary to precisely determine the atomic configurations of OIHP materials and establish the comprehensive relationship between their structures and properties.
Transmission electron microscopy (TEM) has been recognized as a powerful tool to monitor material structures at an atomic resolution [14,15]. Moreover, TEM can be performed under various imaging modes, as well as be integrated with electron diffraction (ED) and spectroscopic techniques (e.g., energy-dispersive X-ray spectroscopy (EDS) and electron energy-loss spectroscopy (EELS)) to gain both structural and compositional information with very high resolution (spatial resolution < 1 Å, energy resolution < 0.1 eV). As shown in Figure 2, two main imaging modes exit in the TEM technique, such as the TEM mode and the scanning TEM (STEM) mode. The TEM mode uses a parallel electron beam, and the obtained images are interference patterns of the scattered electrons that are formed by the objective lens (Figure 2a). On the contrary, the STEM mode employes a focused electron beam to scan the specimen, and the images are formed by collecting transmitted electrons within a certain range of scattering angle using annular detectors (Figure 2b). In general, it is much challenging to measure image-sensitive materials (i.e., OIHPs) via the STEM mode, due presumably to the intense interaction between the sample and the focused beam (a high dose rate).
Although TEM may be employed to accurately reveal the atomic-level microstructure of OIHPs, these hybrid materials with soft ionic lattice features are extremely sensitive to beams. The critical dose for probing perovskite materials is estimated to be tens of electrons per Å2 [13]. Although the all-inorganic perovskites exhibit better electron beam stability than the hybrid ones, due possibly to the lack of organic moieties, keeping the dose below the critical value is still challenging [16,17,18]. A high dose might damage the perovskite structure and even induce phase transition problem during the TEM measurement, which limits its application scenarios [19,20,21]. To overcome, it is thus necessary to develop both low-dense and high-resolution TEM techniques, such as sample protection, cryo-TEM, and low-dose method, to acquire atomic-level images of the highly sensitive OIHP materials.
In this article, the research status and major challenges of TEM as a characterization tool in PSC investigations are summarized. Specifically, several conventional low-dose technologies, the miscalibration of OIHPs, and future advancements of TEM technology are discussed, which hopefully could provide essential guidance toward more efficient and accurate characterizations of TEM in OIHP materials.

2. The Actuality of Atomic-Resolution Imaging of OIHPs Using Transmission Electron Microscopy

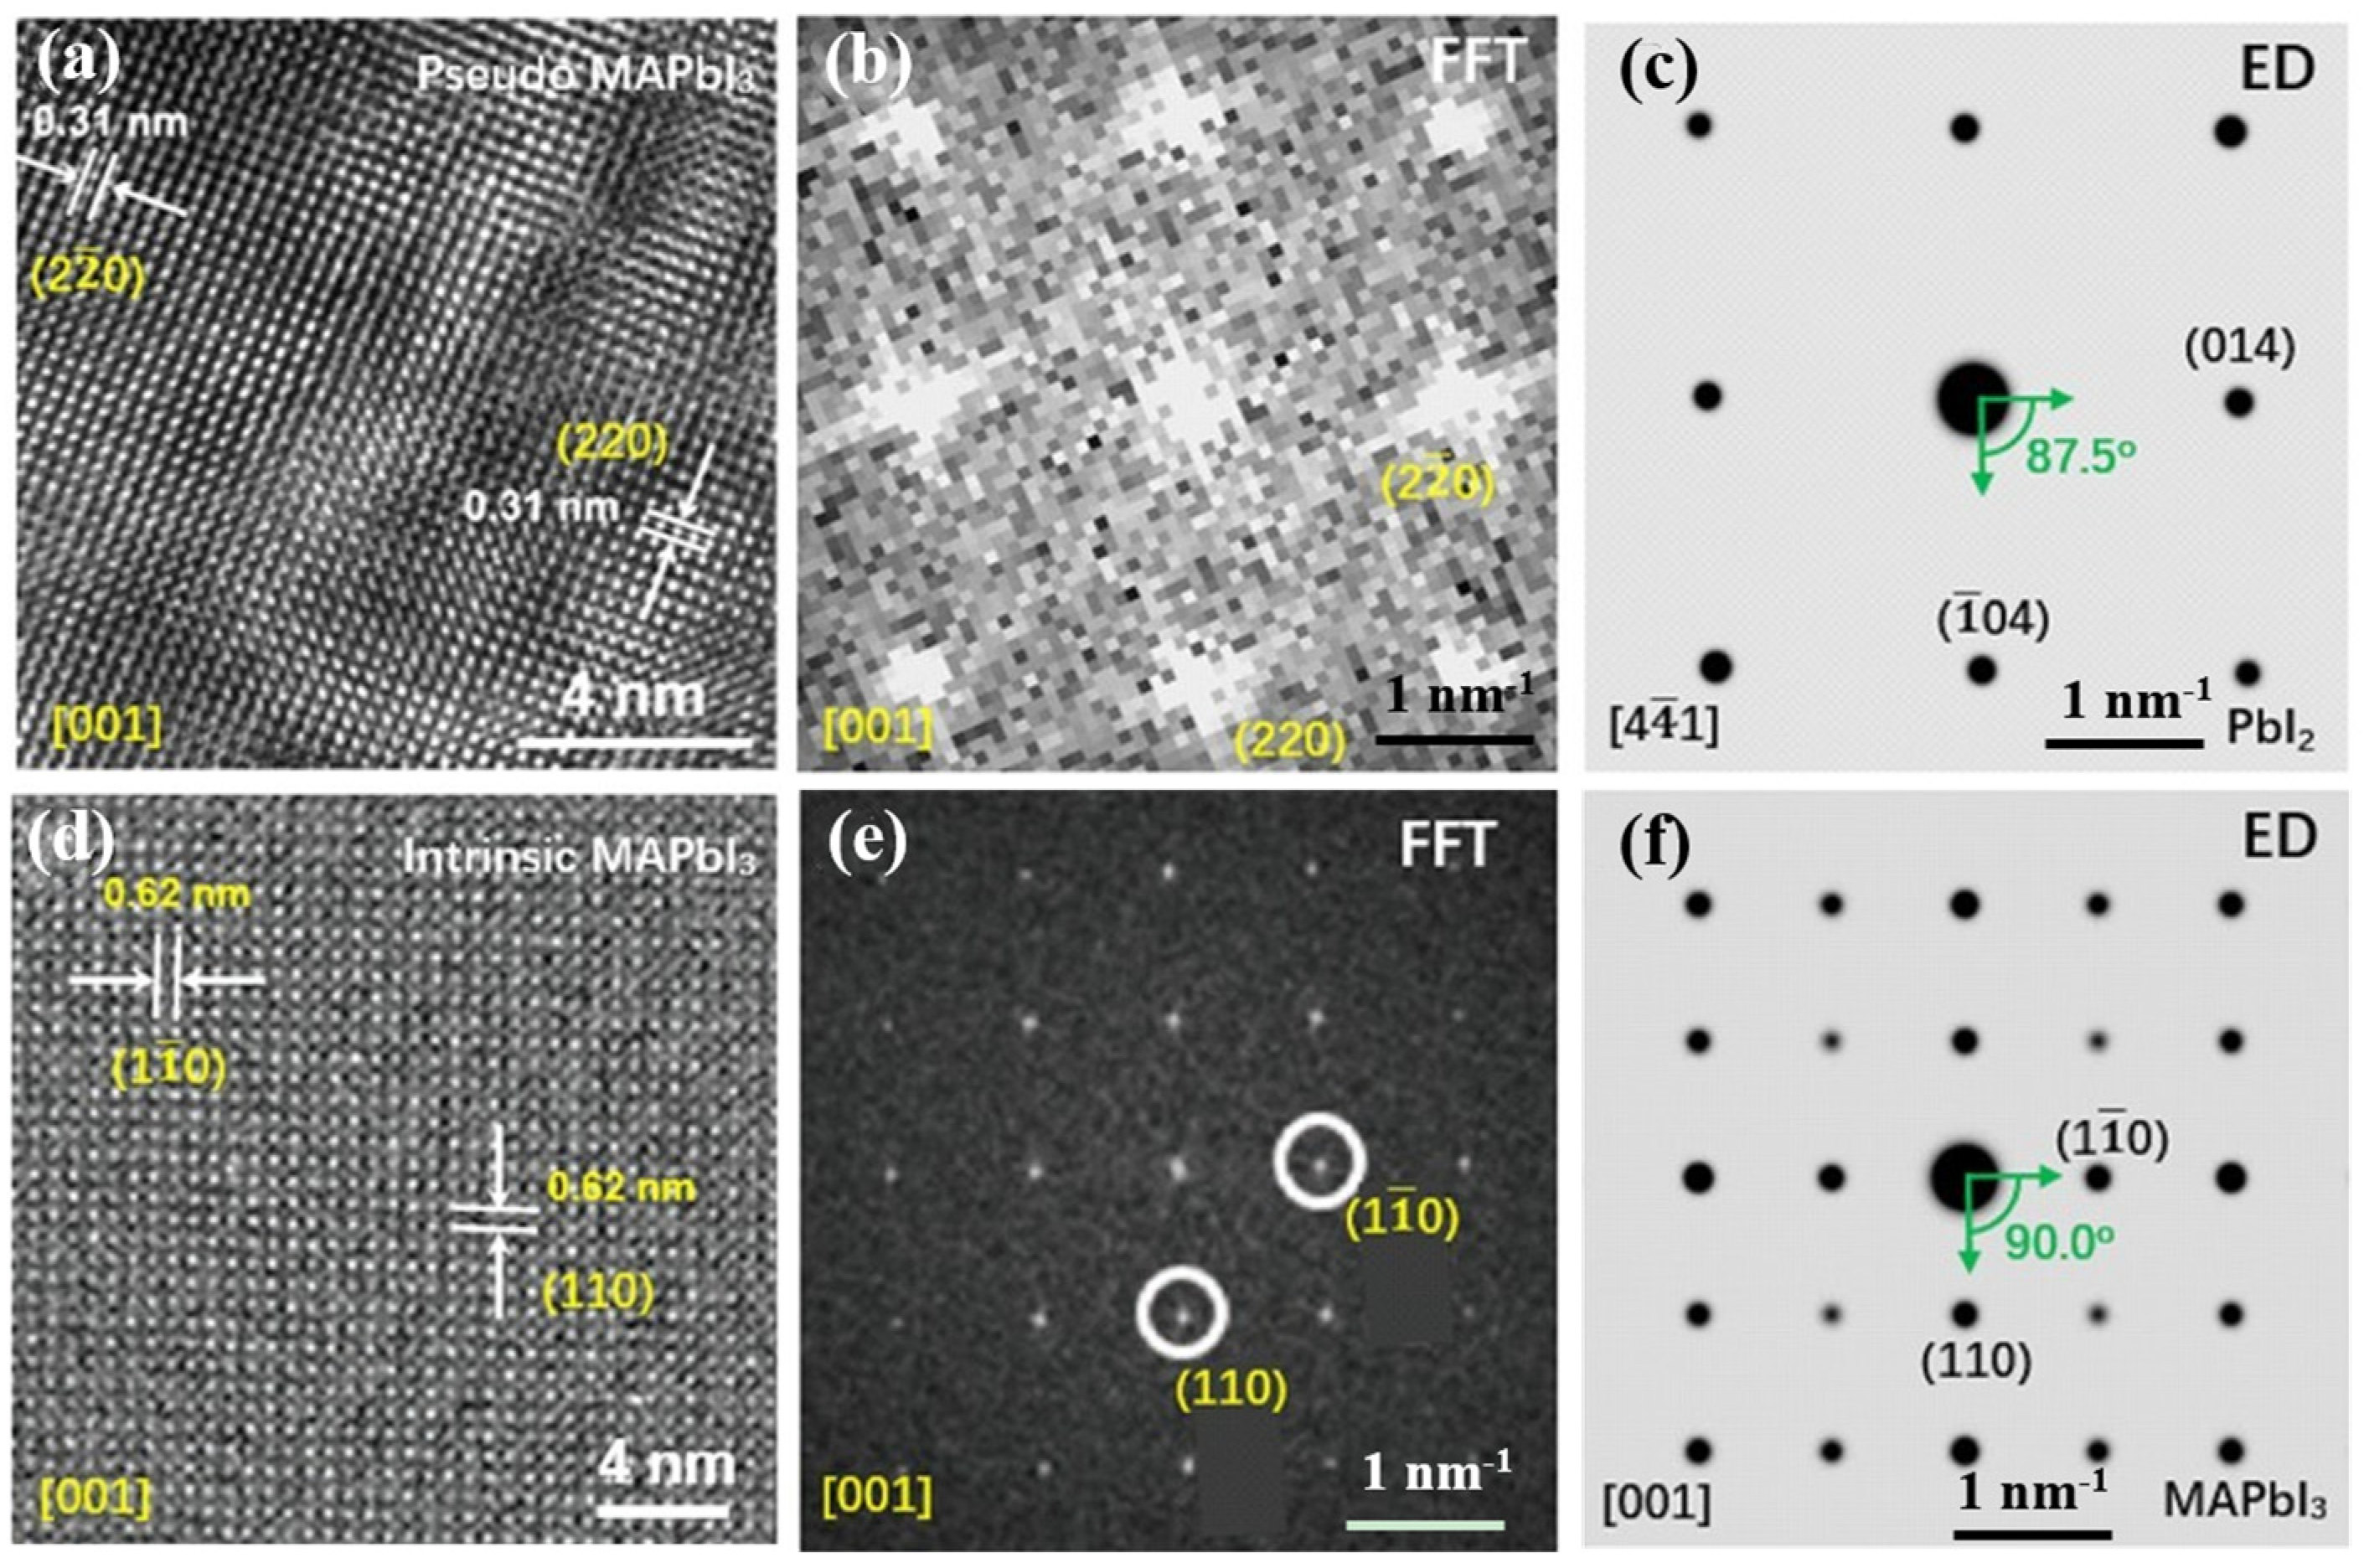
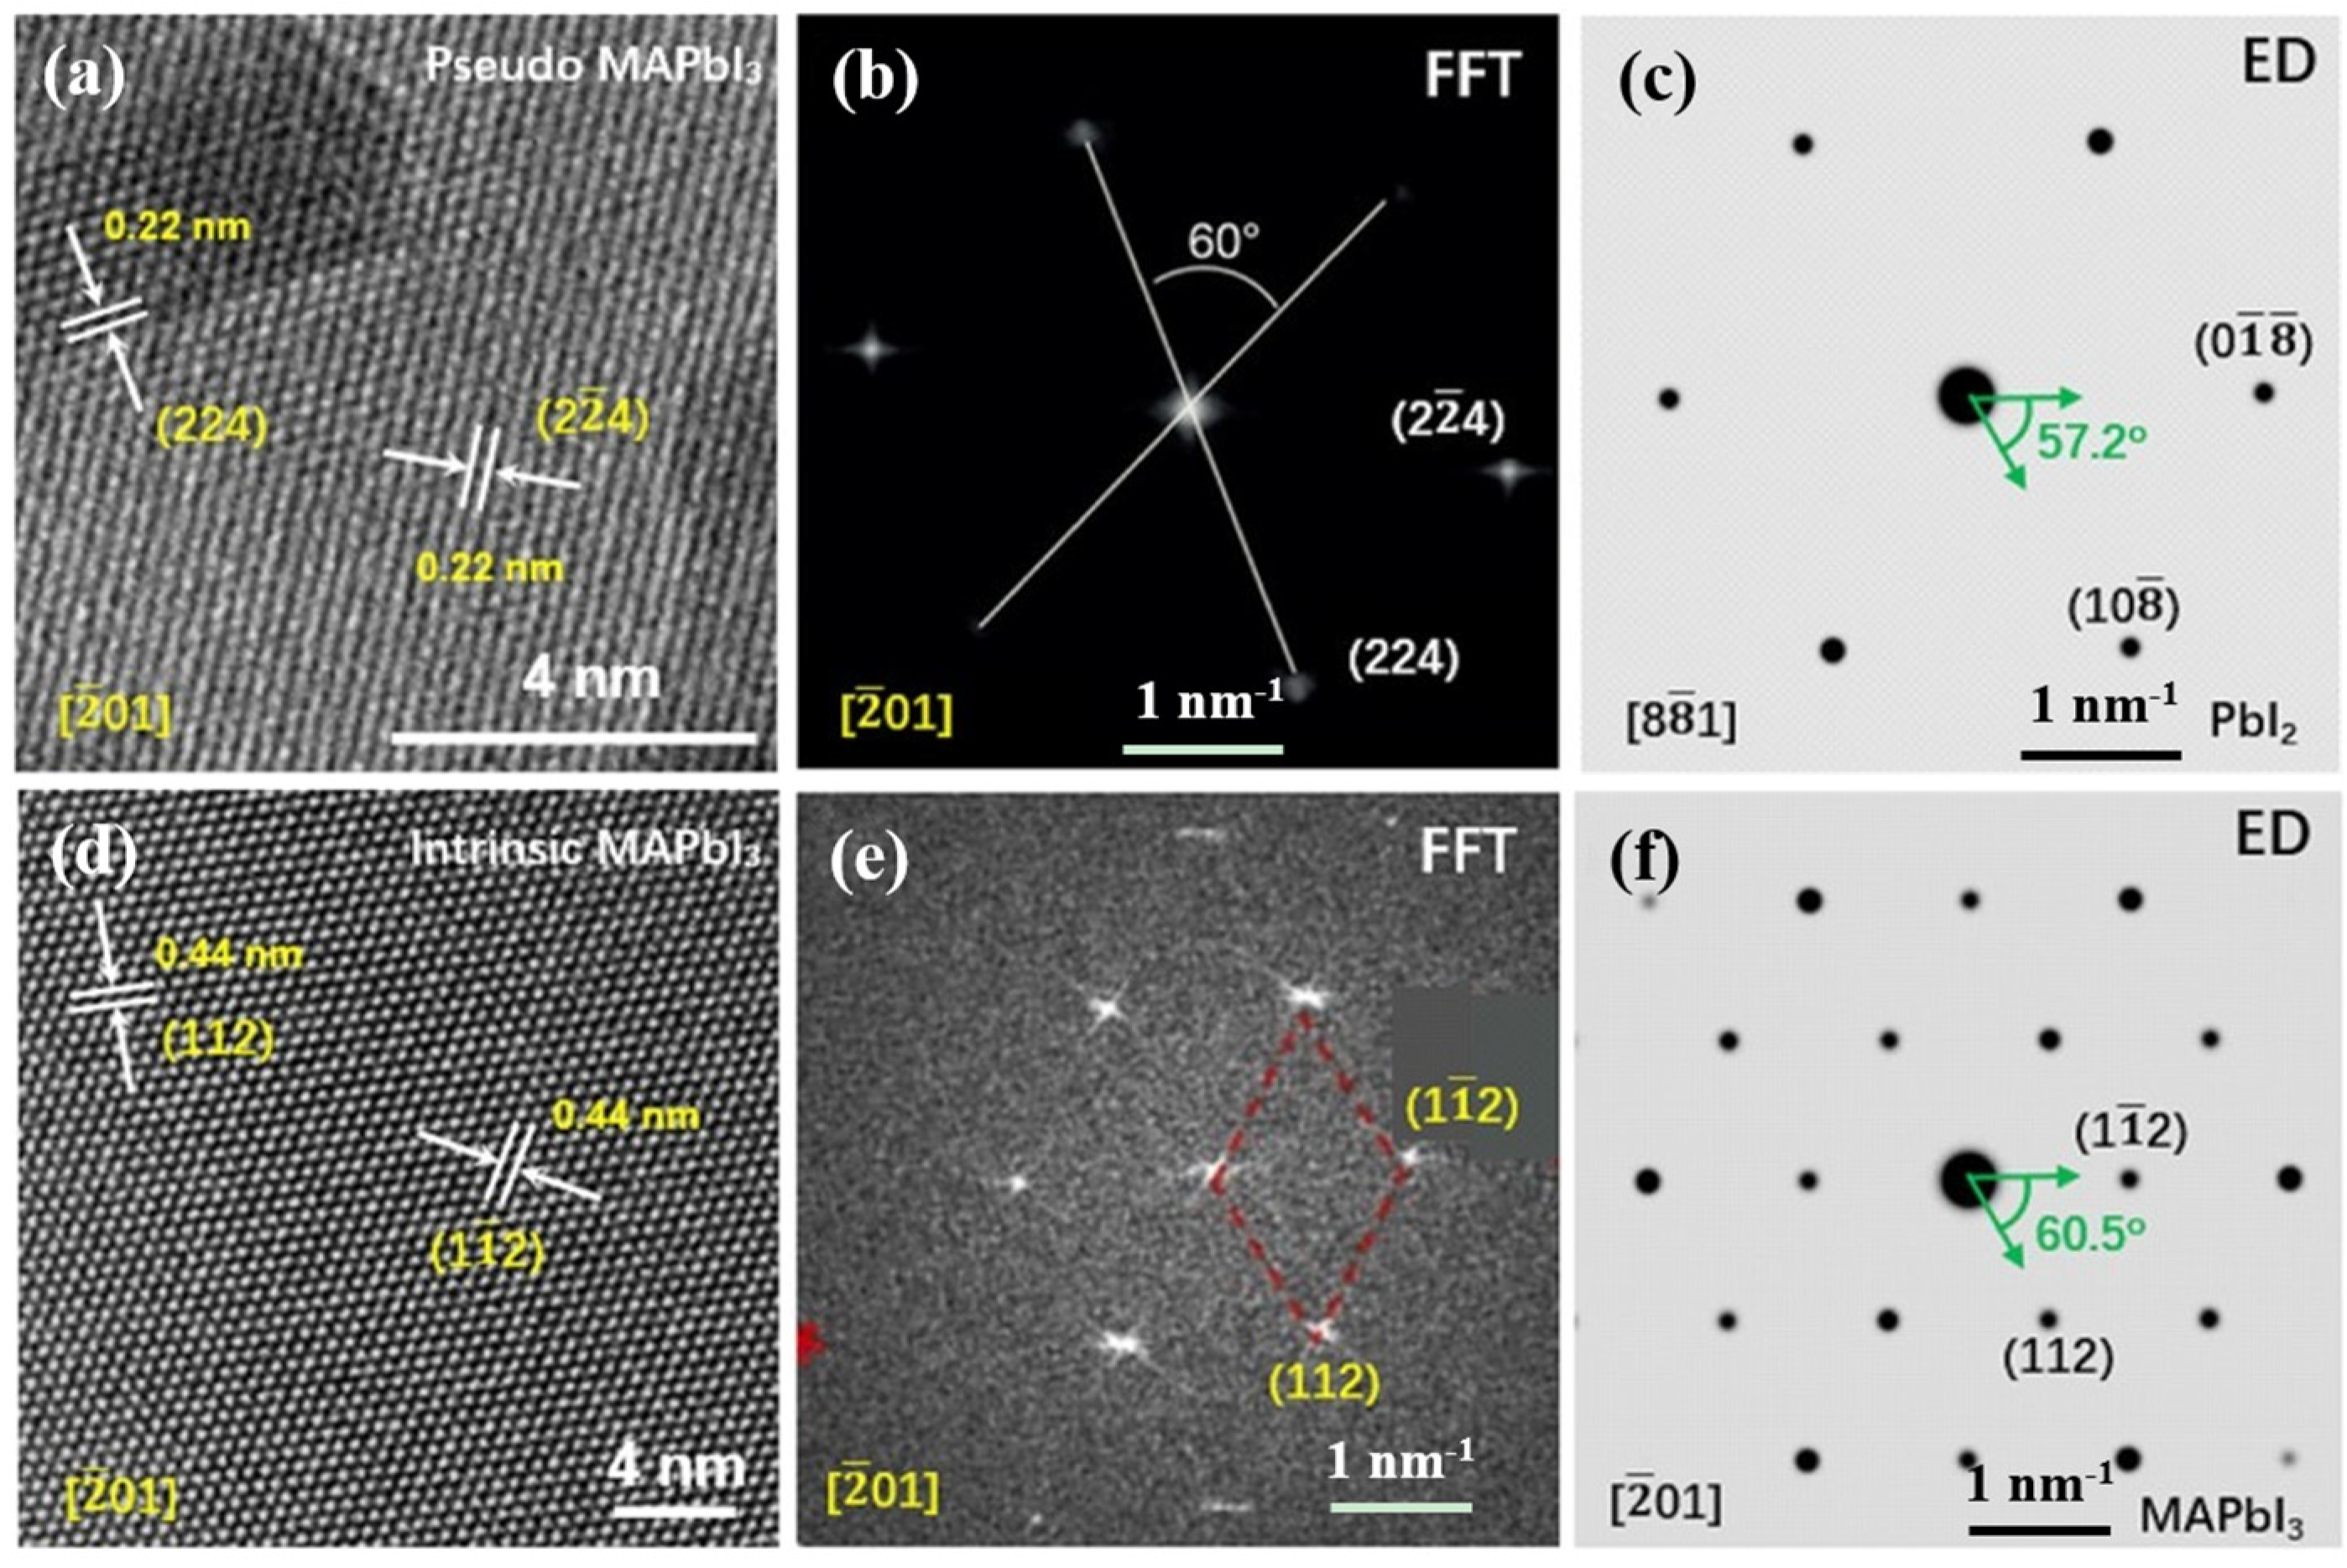
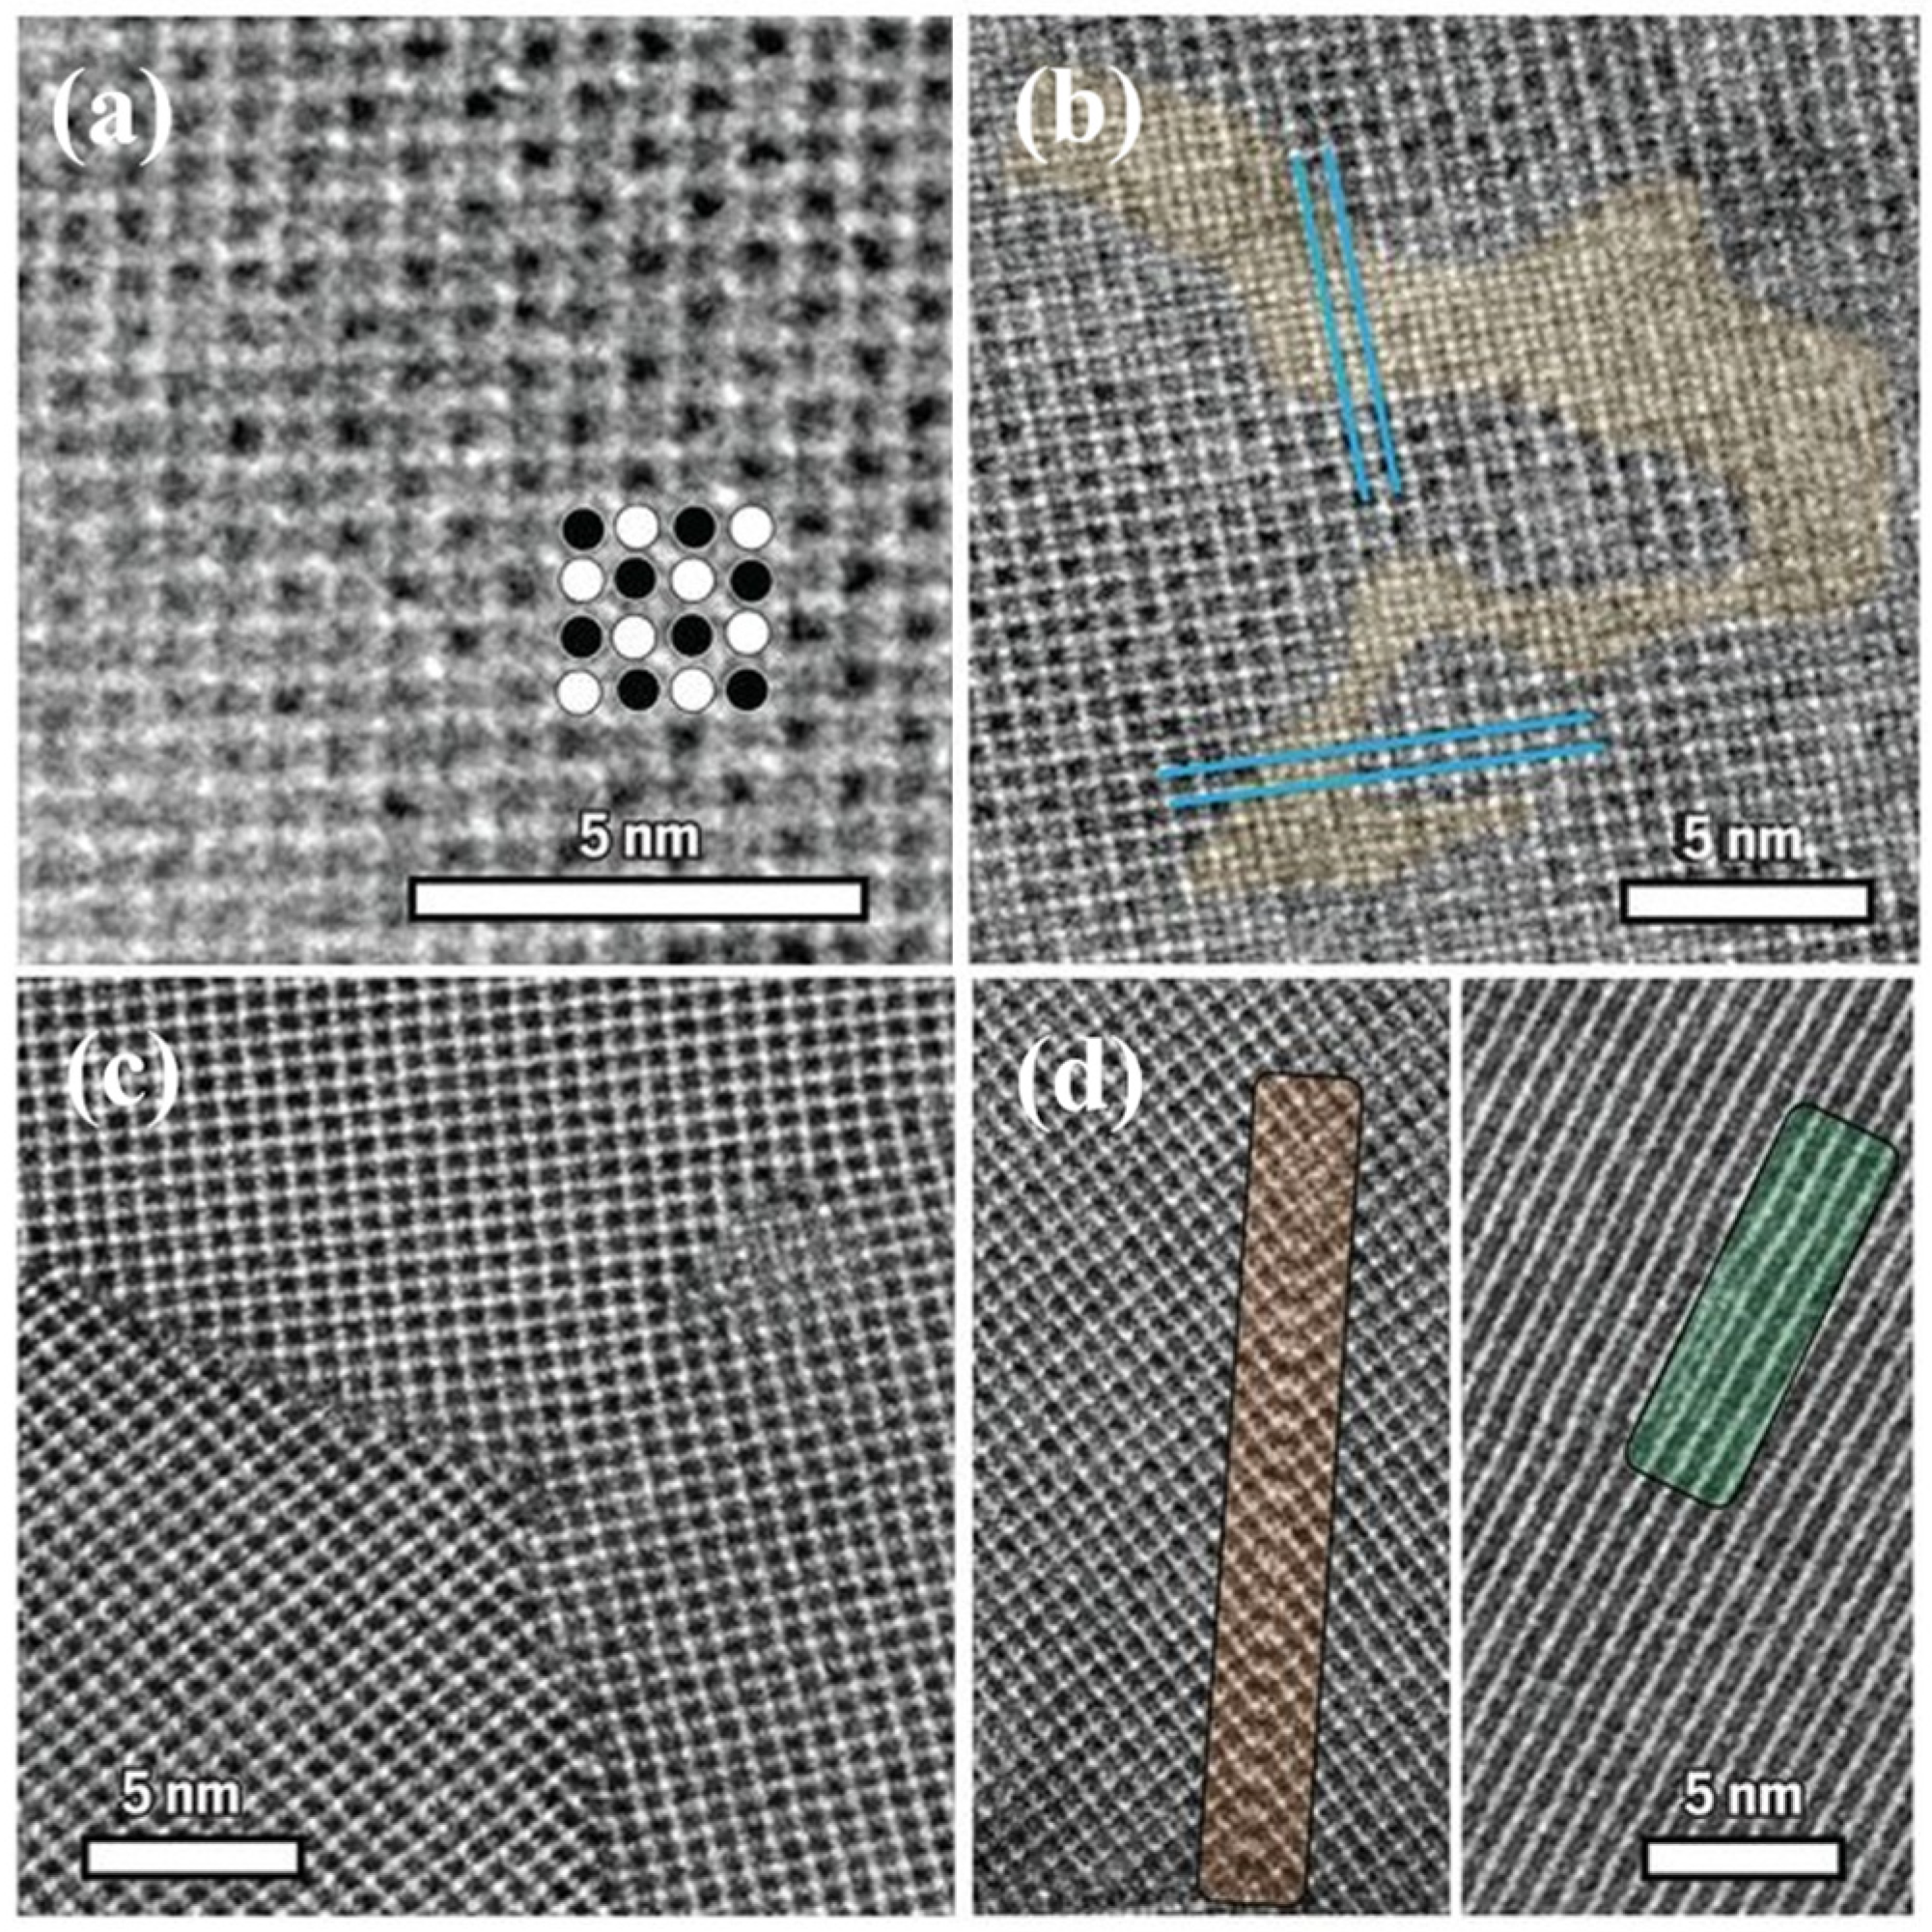
2.1. Application Status of TEM in OIHPs

The unusual optoelectronic properties and performance of OIHPs are closely related to their unique crystal structure and microstructure, e.g., the crystal symmetry, the vibration and ordered arrangement of the organic groups, and the tilt of the [PbI6] octahedra [22]. Therefore, in recent years, TEM has been widely employed to reveal the atomic-level structure and image of OHIP materials, which promotes deeper understanding to their material properties and related device performance [23,24].
When OIHPs are imaged using conventional TEM, the structure of the perovskites might be destroyed in several seconds, which is sorted as the irradiation damage, as shown in Figure 3. Chen et al. noticed severe irradiation damages in the MAPbI3 perovskite polycrystalline film when being imaged via conventional TEM at a high electron dose rate of ~9870 e/(Å2·s), where nanoparticles were precipitated quickly within the irradiated area (Figure 3a) [25]. Kim et al. revealed the generation and expansion of “bubbles” by a series of TEM images through continuous irradiation on MAPbI3 perovskite single crystals (Figure 3b) [26]. The above results indicate that it is difficult to obtain the low-magnification morphology of OIHPs films via traditional imaging mode of TEM, which should be caused by electron beam induced electrical field [25] and the direction-selectivity of the electron beam damage in OIHPs [26]. The electrical field will be formed when there occurs the accumulation of positive charges in irradiated sample regions, following the emissions of Auger and secondary electron into vacuum. The beam periphery damage in the images has been unraveled in previous related literature, where various electron doses and different accelerate voltages were attempted [25].
The structural instability of OIHP materials under various conditions (e.g., high temperature, oxygen, humid environment, light) becomes a vital issue to hamper the commercialization of PSCs [27,28,29]. By employing the SAED technique, Chen et al. investigated the decomposition mechanism of OIHPs under electron beam irradiations [30,31]. A possible decomposition way was thus proposed as shown in Figure 4. Under continuous beam illumination, we observe structure evolution of MAPbI3 (along the [110] zone axis) and MAPbBr3 (along the [001] zone axis) as exhibited by SAED patterns in Figure 4a–d and Figure 4g–j respectively. With the increased electron beam dose, the loss of methylamine and halogen ions could eventually cause the collapse of perovskite structure to PbX2 (X = I, Br), and the atomic resolution images can be seen in Figure 4f,l. The structure illustrations for decomposition from tetragonal MAPbI3 (viewed along its [110]) to PbI2 and cubic MAPbBr3 (along its [110]) to PbBr2 can be seen from Figure 4m–p. Their results indicated that the tetragonal CH3NH3PbI3 and the cubic CH3NH3PbBr3 may lose some halides during the irradiation, which then formed an intermediate product of perovskite superstructure with ordered vacancies (i.e., CH3NH3PbX2.5, X = I, Br), which can be seen in Figure 4e,k. The structural degradation behaviors of perovskites under various experimental conditions were also investigated via low-dose electron diffraction and imaging techniques, which optimized the operating conditions of TEM for characterizing OIHPs [30]. As shown in Figure 5, a TEM cryogenic holder (Gatan 636) was employed to study the SAED patterns of MAPbI3 at different temperatures, which are reported to be orthorhombic phase below −(111 ± 2) °C, tetragonal phase between −(111 ± 2) and (58 ± 5) °C, and cubic phase over (58 ± 5) °C, as shown in Figure 5a–c [31]. The MAPbI3 is grown to be a tetragonal phase, whose SAED pattern (Figure 5e) matches with the simulated one (Figure 5h). The acquired SAED pattern at −180 °C (Figure 5d) shows no superstructure diffraction spots of the orthorhombic phase, highlighted by the circle on the simulated ED pattern (Figure 5g), suggesting that a low temperature in vacuum will not cause the transition from tetragonal to orthorhombic phase for the single crystal MAPbI3. The phase at a high temperature and the SAED pattern at 90 (Figure 5f) indicates either a [110] direction of cubic phase (Figure 5i) or a [100] direction of the tetragonal phase (Figure 5h), making us unable to identify the specific phase. A liquid nitrogen side-entry specimen holder was applied to cool down the specimen temperature. When the temperature is at −180 °C, a rapid crystalline-to-amorphous phase transition was observed under low doses (129 to 150 eÅ−2). Interestingly, a large electron beam dose (450–520 eÅ−2) is required to induce the transition from MAPbI3 to PbI2 at higher temperatures. Such phenomenon suggests that lowering the temperature may not hinder the decomposition of OIHPs, but rater leads to rapid undesirable phase transformation.

2.2. Main Issues of TEM in Characterizating OIHPs

Despite the importance and necessarily of TEM in OIHP characterizations have been gradually realized, major challenges still remain, i.e., these perovskite materials are electron beam sensitive [32,33], which limit the practical application of TEM. Taking the well-known MAPbI3 as an example, due to the negligence of electron beam-sensitive property, the decomposition products, such as PbI2, Pb and other intermediates have widely misidentified as perovskite in TEM characterizations, which negatively influenced the development of perovskite field.
In general, the electron dose value of normal HRTEM is within 800–2000 eÅ−2 s −1, which is much higher than the critical value of MAPbI3 (~150 eÅ−2) [32,33]. Meanwhile, several interplanar spacings and angles of the decomposition product (e.g., PbI2) are similar with MAPbI3. For example, Figure 6 shows simulated electron diffraction (ED) patterns of the tetragonal MAPbI3 and the hexagonal PbI2 along different axis zones. The ED pattern of MAPbI3 along [110] zone axis was illustrated in Figure 6a, where the ( 1 ¯ 10), (002) crystal planes were missed in previous HRTEM characterization work [34]. Figure 6b demonstrates the simulated ED patterns of PbI2 along [4 4 ¯ 1] zone axis. As can be observed, (014) and ( 1 ¯ 04) crystal planes of PbI2 exhibit the confusable interplanar spacing and angle comparing to ( 2 ¯ 20) and (004) crystal planes of MAPbI3. Indeed, MAPbI3 may be damaged into PbI2 when being exposed to electron beams. Similarly, Figure 6c–h are ED patterns of MAPbI3 along [101] and PbI2 along [8 10 1], MAPbI3 along [ 2 ¯ 01] and PbI2 along [8 8 ¯ 1], MAPbI3 along [ 1 ¯ 20] and PbI2 along [ 4 ¯ 11] respectively. The missing crystal planes in HRTEM characterizations have been circled in red in Figure 6 [34]. We think the phase transformation may be local and hard to distinguish the main phase and the secondary phase by SAED. Otherwise, different phased can be told by their distinction conditions.
Due to the inaccurate recognize of crystal planes, some researchers may identify PbI2 as MAPbI3 [35,36,37,38,39,40,41,42,43] even using low-dose electron diffraction (ED) technology. Some examples are showed in Figure 7 and Figure 8 [44]. For instance, in contrast to the MAPbI3 perovskite, the structures of decomposition products were misidentified as ‘pseudo’ perovskite. Figure 7a,b show the HRTEM image and Fast Fourier Transform (FFT) of the pseudo MAPbI3 perovskite respectively at high doses with conventional TEM condition [40]. The FFT was consistent with the simulated ED pattern along [4 4 ¯ 1] zone axis (Figure 7c), which was identified as the perovskite. In fact, the HRTEM image and Fast Fourier Transform (FFT) of intrinsic MAPbI3 along [001] zone axis at a total dose of 1.5 eÅ−2 at room temperature were obtained [13], as shown in Figure 7d,e. Obviously, (1 1 ¯ 0), (110) planes with 0.62 nm interplanar spacing can be seen in images, matching the ED pattern (Figure 7f) and XRD data of the intrinsic MAPbI3 [5,43]. Comparing the simulated ED of PbI2 along [4 4 ¯ 1] zone axis with that of intrinsic perovskite along [001] zone axis, it was found that they were very similar, but (1 1   ¯ 0), (110) planes missing and only (2 2 ¯ 0), (220) planes remained, which results in the misidentified of the perovskite structure. Similarly, Zhu et al. [45] got the HRTEM images of intrinsic MAPbI3 along [ 2 ¯ 01] zone axis at total doses of 3 eÅ−2 in liquid nitrogen temperature (Figure 8d), while the FFT and simulated ED pattern was shown in Figure 8e. Figure 8a,b were shown as the HRTEM and FFT of the pseudo perovskite under normal TEM condition, which was identified as PbI2 rather than MAPbI3 due to the lacking of (1 1 ¯ 2), (112) planes and the matched ED pattern (Figure 8c).
The crystal planes that could be observed in other Bragg’s law-based characterization tools, such as SAED and XRD [4,5,21,46], were missed in TEM results, which is attributed to the excessive electron beam irradiation in MAPbI3, damaging its original structure. Particularly, if {2h, 2k, 0} diffraction spots along the [001] direction is observed while the {2h + 1, 2k + 1, 0} reflections [e.g., (110)] are absent, it is reasonable to presume that the perovskite structure has already been decomposed into PbI2 [33]. Therefore, when using HRTEM images to identify phases, it seems incidental to misidentify perovskite phases by merely comparing interplanar spacing and angles. During phase identification, misidentification may occur due to the similarity of certain crystal parameters, missing crystal planes, measurement errors, and other reasons. It is thus necessary to combine with other relevant diffractograms, simulated ED, nanodiffractions, or XRD specimen data [47] to conduct accurate phase identification.

2.3. Strategies to Improve the Compability of TEM in OIHPs

Driven by the urgent demands to understand the structure-property relationship of OIHPs, novel approaches have been developed to reduce the electron beam irradiation damage, which may be helpful to obtain the atomic-level structure of OIHPs using TEM characterizations. The specific mechanisms of beam damage are complex, which also vary with different types of materials. The damage caused by electron beam radiation could be categorized into three main types of radiation damage mechanisms, e.g., knock on damage, radiolysis, and rise of local temperature caused by phonons excited by electron beam radiation [48]. The knock-on damage is closely related to beam energy, while heating effects and radiolysis are more related to electron dose [49]. Cai et al. calculated the knock-on damage on OIHPs using first-principle calculations, and the result showed that iodine was only knocked-out when accelerating voltage is higher than approximately 250 kV. This is consistent with the experimental data, where low acceleration voltages were performed to study the degradation of OIHPs, and the results showed that the decomposition was not noticeably reduced in low acceleration voltage. Previous investigations demonstrate that radiolysis dominates the degradation of OIHPs under electron beam irradiation [50,51,52,53]. Developing low-dose TEM is vital for imaging OIHPs without cause negative impacts to the materials/films. Triggered from the OIHPs irradiation damage mechanism, various methods have been proposed to achieve atomic resolution imaging of OIHPs, including sample protection, Cryo-TEM, and low dose technology (e.g., direct-detection electron-counting, abbreviated as DDEC).

2.3.1. Sample Protection

Sample protection, as its name indicates, could directly protect the material and improve its stability [54]. By coating carbon about 6–10 nm thick on MAPbI3, Chen et al. revealed that the decomposition of OIHPs could be significantly suppressed, due to the thin carbon coating layer served as a diffusion barrier, reducing the escape rate of the volatile species (e.g., halogen atom and CH3NH2), which helps to maintain the structure framework of perovskite [30]. However, for one-side coated specimen with half of shielding, the degradation was not slowed down, likely because the volatile species can escape from the other uncoated side. Furthermore, hexagonal boron nitride thin films were deposited as an encapsulation layer, which successfully extend the stability of MAPbI3, successfully reducing radiation damage induced by electron beam [36].

2.3.2. Low-Temperature-Based Technologies

To mitigate electron beam damage, low temperature-based technologies were also developed, which could effectively reduce mass loss and the heat damage [55,56]. Indeed, cryo-electron microscopy (cryo-EM) has already been applied for characterizing electron beam sensitive materials such as lithium-ion battery materials [53,57,58,59]. Efforts have also been devoted to investigate the effect of low temperature on the structural stability of OIHPs under electron beam irradiation [17,33,60,61,62]. It was found that the intrinsic structure of MAPbI3 could be maintained at room temperature when the total electron dose is at ~1.5 eÅ−2 [13]. When the total dose reaches 5.95 eÅ−2, superlattice will be formed, which will damage the original perovskite structure. by employing Cryo-TEM, the critical dose of MAPbI3 increases to 12 eÅ−2, which is much higher than that at room temperature [31]. As a result, a more “stable” OIHP is achieved, which allows the use of higher electron dose to increase the signal-to-noise ratio of the image. However, conflicted results were reported in Rothmann’s research, which suggests that low temperatures may lead to rapid amorphization [46]. Chen et al. [31] also found that low temperature (−180 °C) would cause rapid crystal-to-amorphous transition even at low doses (129 to 150 eÅ−2), suggesting that low temperature may not be helpful to reduce electron beam damage. The above inconsistent might source from the specimen properties or the discrepancy between the cryo-holder and cryo-microscope methods, which needs to be investigated in the near future.
The third approach refers to low-dose imaging technology, which is also an effective strategy to obtain atomic-level resolution images for electron beam sensitive materials [18]. By combining low-dose LAADF-STEM imaging with simple Butterworth and Bragg filters, atomic-level high resolution pictures of the FAPbI3 perovskite film with only minor damages were acquired [51], which unraveled some unique phenomena of these perovskite materials that may not be feasibly measured using other techniques. Figure 9a shows the image of the damaged FAPbI3 after mild radiations, where light and dark lattice patterns can be observed, as highlighted by white and black circles. In Figure 9b, an unexpected coherent transition boundary between the residual PbI2 (yellow areas in Figure 9b) and FAPbI3 grains was observed, with an undetectable lattice misfit. The existence of a low mismatch and low lattice strain interface between PbI2 and FAPbI3 perovskites suggests that a small amount of PbI2 may not deteriorate the PSC device performance, in accordance with previous reports [63,64]. Figure 9c shows the high-resolution image of boundaries between FAPbI3 grains. It could be observed that perovskite lattice at boundaries are highly crystalline, which indicates that the presence of boundaries might not disrupt the long-range crystal quality of the surrounding perovskite lattice. Additionally, aligned point defects (mainly vacancies) at the Pb-I sublattice of FAPbI3 were found by conducting TEM measurements, such as stacking faults (Figure 9d, left) and edge dislocations (Figure 9d, right), which may provide valuable structural and defect information for future theoretical calculations and defect-related studies. In general, lowering the accelerating voltage of the incident electron beam can obtain electron low dose (reduce knock-on damage) but reduce imaging quality while also increasing radiation damage. Therefore, further research is needed on the method of obtaining atomic level resolution images of OIHPs by reducing voltage to achieve low dose.
The invention of the DDEC camera provides an alternate solution towards high-resolution TEM images for OIHPs. Early in 2018, Han and coworkers reported the employment of DDEC cameras in TEM, which exhibit high detective quantum efficiency, thus enabling HRTEM with ultralow electron doses that is suitable for imaging OIHPs [64]. Moreover, the intrinsic structure of MAPbI3 has been revealed successfully at a total electron dose of only 3 eÅ−2 by using DDEC cameras [31,47]. Li et al. obtained Cryo-TEM images of MAPbBr3 and MAPbI3 at different cumulative electron doses via DDEC camera, and investigated their electron dose thresholds at cryogenic temperatures. The resultant electron doses of MAPbI3 and MAPbBr3 were approximately 12 eÅ−2 and 46 eÅ−2, respectively [32]. Song et al. also used a DDEC camera to obtain a set of high-resolution images of MAPbI3 along the [001] zone axis, which matched well with the expected structure [13]. Nevertheless, despite the employment of DDEC is one of the prerequisites for HRTEM to probe sensitive OIHP materials, the DDEC camera alone is insufficient to gain high-quality images. There still remains several obstacles. First, the desired zone axis must be aligned with the electron beam in a very fast period to prevent the crystalline structure from damage. Second, the successive short-exposure low-dose frames must be precisely aligned to avoid any loss of resolution. Last but not least, the accurate defocus value should be known to obtain an interpretable image by image processing. Han and co-workers developed a simple program to achieve a one step, automatic alignment of the zone axis, as well as an “amplitude filter” to retrieve the high-resolution information hidden in the image stack, and a method to determine the defocus value of the image. By applying such methods, they successfully acquired the first atomic-resolution (≈1.5 Å) HRTEM image of hybrid CH3NH3PbBr3 at 300 kV with a total electron dose of 11 eÅ−2 [64].
At the same time, we may also reduce the exposure dose of electron beam sensitive materials through some other techniques during the testing process, such as zone-axis auto-alignment and adjusting parameters of TEM in non region of interest (ROI). Instead of real-time observation, automatic zone-axis alignment utilizes one diffraction pattern to judge and rotate the sample to the desired zone-axis blindly using of programming control for parameter adjustment, which could save a lot of avoidable exposure. Moreover, focusing on the adjacent region of interest (ROI) instead of directly on the ROI and restoring the parameters in advance can further eliminate the electron irradiation. These dose-control strategies are able to diminish unnecessary electron exposure [65].
For electron beam sensitive materials, such as OIHPs, low-dose technology is required to obtain atomic level resolution images, however, there are problems such as sample drift during imaging processing, low signal-to-noise ration of images, and difficulty in data processing due to a large amount of data. Therefore, in order to precisely observe the atomic structure of OIHPs, processing data more efficiently and increasing the input-output ratio is also an indispensable point in practical HRTEM imaging. A combination of machine learning and development of algorithms for drift correction, denoising, and image reconstructor would benefit low-dose imaging.

3. Summary and Outlook

OIHP materials are highly sensitive to electron beams, which restrict their atomic-level structure characterization by using electron microscopes. The lack of structural information of perovskites may hamper their further developments. It is thus crucial to minimize the beam damage to perovskite materials, which may be achieved by controlling the imaging voltage and temperature, as well as developing low-dose imaging technologies. Nevertheless, low-dose technology will inevitably generate large amounts of data, which needs to be analyzed to obtain the atomic structure information. The development of appropriate algorithms to conduct drift correction, denoising, and image reconstruction will hopefully facilitate the process. Therefore, the combination of low-dose imaging and machine learning is expected as the next coming research hot spots in TEM- and perovskite-related studies.

Funding

This research was funded by Natural Sciences and Engineering Research Council of Canada, Grant Number: RGPIN-2015-05740.

Data Availability Statement

Not applicable.

Conflicts of Interest

The authors declare no competing financial interest.

References

  1. Manser, J.S.; Christians, J.A.; Kamat, P.V. Intriguing Optoelectronic Properties of Metal Halide Perovskites. Chem. Rev. 2016, 116, 12956–13008. [Google Scholar] [CrossRef]
  2. Xu, F.; Zhang, M.; Li, Z.; Yang, X.; Zhu, R. Challenges and Perspectives toward Future Wide-Bandgap Mixed-Halide Perovskite Photovoltaics. Adv. Energy Mater. 2023, 13, 2203911. [Google Scholar] [CrossRef]
  3. Xu, F.; Li, Y.; Liu, N.; Han, Y.; Zou, M.; Song, T. 1D Perovskitoid as Absorbing Material for Stable Solar Cells. Crystals 2021, 11, 241. [Google Scholar] [CrossRef]
  4. Shi, D.; Adinolfi, V.; Comin, R.; Yuan, M.J.; Alarousu, E.; Buin, A.; Chen, Y.; Hoogland, S.; Rothenberger, A.; Katsiev, K.; et al. Low trap-state density and long carrier diffusion in organolead trihalide perovskite single crystals. Science 2015, 347, 519–522. [Google Scholar] [CrossRef] [Green Version]
  5. Dong, Q.F.; Fang, Y.J.; Shao, Y.C.; Mulligan, P.; Qiu, J.; Cao, L.; Huang, J.S. Electron-hole diffusion lengths >175 μm in solution-grown CH3NH3PbI3 single crystals. Science 2015, 347, 967–970. [Google Scholar] [CrossRef] [Green Version]
  6. Wang, R.T.; Zhang, Y.; Wu, X.; Zhang, W.; Chi, L.; Xu, F. Stable FAPbI3 hydrate structure by kinetics negotiation for solar cells. Sustain. Energy Fuels 2023, 7, 1974–1980. [Google Scholar] [CrossRef]
  7. Xu, A.F.; Liu, N.; Xie, F.; Song, T.; Ma, Y.; Zhang, P.; Bai, Y.; Li, Y.; Chen, Q.; Xu, G. Promoting thermodynamic and kinetic stabilities of FA-based perovskite by an in situ bilayer structure. Nano Lett. 2020, 20, 3864–3871. [Google Scholar] [CrossRef]
  8. Zhu, Y.F.; Liu, Y.F.; Ai, Q.; Gao, G.H.; Yuan, L.; Fang, Q.Y.; Tian, X.Y.; Zhang, X.; Egap, E.; Ajayan, P.M.; et al. In situ synthesis of lead-free halide perovskite-COF nanocomposites as photocatalysts for photoinduced polymerization in both organic and aqueous phases. ACS Mater. Lett. 2022, 4, 464–471. [Google Scholar] [CrossRef]
  9. Leyden, M.R.; Meng, L.Q.; Jiang, Y.; Ono, L.K.; Qiu, L.B.; Juarez-Perez, E.J.; Qin, C.J.; Adachi, C.; Qi, Y.B. Methylammonium lead bromide perovskite light-emitting diodes by chemical vapor deposition. J. Phys. Chem. Lett. 2017, 8, 3193–3198. [Google Scholar] [CrossRef] [Green Version]
  10. Kojima, A.; Teshima, K.; Shirai, Y.; Miyasaka, T. Organometal halide perovskites as visible-light sensitizers for photovoltaic cells. J. Am. Chem. Soc. 2009, 131, 6050–6051. [Google Scholar] [CrossRef] [PubMed]
  11. Interactive Best Research-Cell Efficiency Chart. Available online: http://www.nrel.gov/pv/interactive-cell-effciency.html (accessed on 1 June 2023).
  12. Domanski, K.; Alharbi, E.A.; Hagfeldt, A.; Grätzel, M.; Tress, W. Systematic investigation of the impact of operation conditions on the degradation behaviour of perovskite solar cells. Nat. Energy 2018, 3, 61–67. [Google Scholar] [CrossRef]
  13. Song, K.P.; Liu, L.M.; Zhang, D.L.; Hautzinger, M.P.; Jin, S.; Han, Y. Atomic-Resolution Imaging of Halide Perovskites Using Electron Microscopy. Adv. Energy Mater. 2020, 10, 1904006. [Google Scholar] [CrossRef]
  14. Jia, C.L.; Lentzen, M.; Urban, K. Atomic-Resolution Imaging of Oxygen in Perovskite Ceramics. Science 2003, 299, 870–873. [Google Scholar] [CrossRef] [Green Version]
  15. Krivanek, O.L.; Chisholm, M.F.; Nicolosi, V.; Pennycook, T.J.; Corbin, G.J.; Dellby, N.D.; Murfitt, M.F.; Own, C.S.; Szilagyi, Z.S.; Oxley, M.P.; et al. Atom-by-atom structural and chemical analysis by annular dark-field electron microscopy. Nature 2010, 464, 571–574. [Google Scholar] [CrossRef] [PubMed] [Green Version]
  16. Egerton, R.F. Outrun radiation damage with electrons? Adv. Struct. Chem. Imag. 2015, 1, 1–11. [Google Scholar] [CrossRef] [Green Version]
  17. Egerton, R.F. Control of radiation damage in the TEM. Ultramicroscopy 2013, 127, 100–108. [Google Scholar] [CrossRef]
  18. Egerton, R.F.; Qian, H. Exploiting the Dose-Rate Dependence of Radiolysis-a Future for Cryo -STEM? Microsc. Microanal. 2019, 25, 992–993. [Google Scholar] [CrossRef] [Green Version]
  19. Rothmann, M.U.; Li, W.; Zhu, Y.; Bach, U.; Spiccia, L.; Etheridge, J.; Cheng, Y.B. Direct observation of intrinsic twin domains in tetragonal CH3NH3PbI3. Nat. Commun. 2017, 8, 14547. [Google Scholar] [CrossRef] [Green Version]
  20. Milosavljević, A.R.; Huang, W.X.; Sadhu, S.; Ptasinska, S. Low-Energy Electron-Induced Transformations in Organolead Halide Perovskite. Angew. Chem. Int. Ed. 2016, 128, 10237–10241. [Google Scholar] [CrossRef]
  21. Dang, Z.Y.; Shamsi, J.; Palazon, F.; Imran, M.; Akkerman, Q.A.; Park, S.; Bertoni, G.; Prato, M.; Brescia, R.; Manna, L. In Situ Transmission Electron Microscopy Study of Electron Beam-Induced Transformations in Colloidal Cesium Lead Halide Perovskite Nanocrystals. ACS Nano 2017, 11, 2124–2132. [Google Scholar] [CrossRef] [Green Version]
  22. Yang, Y.; Sun, Y.B.; Jiang Y, S. Structure and photocatalytic property of perovskite and perovskite-related compounds. Mater. Chem. Phys. 2006, 96, 234–239. [Google Scholar] [CrossRef]
  23. Aguiar, J.A.; Alkurd, N.R.; Wozny, S.; Patel, M.K.; Yang, M.J.; Zhou, W.L.; Aljassim, M.; Holesinger, T.G.; Zhu, K.; Berry, J.J. In situ investigation of halide incorporation into perovskite solar cells. MRS Commun. 2017, 7, 575–582. [Google Scholar] [CrossRef]
  24. Aguiar, J.A.; Wozny, S.; Alkurd, N.R.; Yang, M.J.; Kovarik, L.; Holesinger, T.G.; Al-Jassim, M.; Zhu, K.; Zhou, W.L.; Berry, J.J. Effect of Water Vapor, Temperature, and Rapid Annealing on Formamidinium Lead Triiodide Perovskite Crystallization. ACS Energy Lett. 2016, 1, 155–161. [Google Scholar] [CrossRef]
  25. Chen, X.Y.; Wang, Z.W. Investigating chemical and structural instabilities of lead halide perovskite induced by electron beam irradiation. Micron 2019, 116, 73–79. [Google Scholar] [CrossRef] [PubMed]
  26. Kim, T.W.; Kondo, T. Direction-selective electron beam damage to CH3NH3PbI3 based on crystallographic anisotropy. Appl. Phys. Express 2020, 13, 091001. [Google Scholar] [CrossRef]
  27. Wu, X.X.; Tan, L.Z.; Shen, X.Z.; Hu, T.; Miyata, K.; Trinh, M.T.; Li, R.K.; Coffee, R.; Liu, S.; Egger, D.A.; et al. Light-induced picosecond rotational disordering of the inorganic sublattice in hybrid perovskites. Sci. Adv. 2017, 3, e1602388. [Google Scholar] [CrossRef] [Green Version]
  28. Bryant, D.; Aristidou, N.; Pont, S.; Sanchez-Molina, I.; Chotchunangatchaval, T.; Wheeler, S.; Durrant, J.R.; Haque, S.A. Light and oxygen induced degradation limits the operational stability of methylammonium lead triiodide perovskite solar cells. Energy Environ. Sci. 2016, 9, 1655–1660. [Google Scholar] [CrossRef] [Green Version]
  29. Berhe, T.A.; Su, W.N.; Chen, C.H.; Pan, C.J.; Cheng, J.H.; Chen, H.M.; Tsai, M.C.; Chen, L.Y.; Dubale, A.A.; Hwang, B.J. Organometal halide perovskite solar cells: Degradation and stability. Energy Environ. Sci. 2016, 9, 323–356. [Google Scholar] [CrossRef]
  30. Chen, S.L.; Zhang, Y.; Zhang, X.W.; Zhao, Z.W.; Su, X.; Hua, Z.; Zhang, J.M.; Cao, J.; Feng, J.C.; Wang, X.; et al. General Decomposition Pathway of Organic–Inorganic Hybrid Perovskites through an Intermediate Superstructure and Its Suppression Mechanism. Adv. Mater. 2020, 32, 2001107. [Google Scholar] [CrossRef]
  31. Chen, S.L.; Zhang, Y.; Zhao, J.J.; Mi, Z.; Zhang, J.M.; Cao, J.; Feng, J.C.; Zhang, G.L.; Qi, J.L.; Li, J.Y.; et al. Transmission electron microscopy of organic-inorganic hybrid perovskites: Myths and truths. Sci. Bull. 2020, 65, 1643–1649. [Google Scholar] [CrossRef]
  32. Li, Y.B.; Zhou, W.J.; Li, Y.Z.; Huang, W.X.; Zhang, Z.W.; Chen, G.X.; Wang, H.S.; Wu, G.H.; Rolston, N.; Vila, R.; et al. Unravelling Degradation Mechanisms and Atomic Structure of Organic-Inorganic Halide Perovskites by Cryo-EM. Joule 2019, 3, 2854–2866. [Google Scholar] [CrossRef]
  33. Chen, S.L.; Zhang, X.W.; Zhao, J.J.; Zhang, Y.; Kong, G.L.; Li, Q.; Li, N.; Yu, Y.; Xu, N.G.; Zhang, J.M.; et al. Atomic scale insights into structure instability and decomposition pathway of methylammonium lead iodide perovskite. Nat. Commun. 2018, 9, 4807. [Google Scholar] [CrossRef] [PubMed] [Green Version]
  34. Deng, Y.H. Common Phase and Structure Misidentifications in High-Resolution TEM Characterization of Perovskite Materials. Condens. Matter 2020, 6, 1. [Google Scholar] [CrossRef]
  35. Zhu, H.M.; Fu, Y.P.; Meng, F.; Wu, X.X.; Gong, Z.Z.; Ding, Q.; Gustafsson, M.V.; Trinh, M.T.; Jin, S.; Zhu, X.Y. Lead halide perovskite nanowire lasers with low lasing thresholds and high quality factors. Nat. Mater. 2015, 14, 636–642. [Google Scholar] [CrossRef] [PubMed]
  36. Fan, Z.; Xiao, H.; Wang, Y.L.; Zhao, Z.P.; Lin, Z.Y.; Cheng, H.C.; Lee, S.J.; Wang, G.M.; Feng, Z.Y.; Goddard, W.A.; et al. Layer-by-Layer Degradation of Methylammonium Lead Tri-iodide Perovskite Microplates. Joule 2017, 1, 548–562. [Google Scholar] [CrossRef] [Green Version]
  37. Divitini, G.; Cacovich, S.; Matteocci, F.; Cina, L.; Carlo, A.D.; Midgley, P.; Ducati, C. In situ observation of heat-induced degradation of perovskite solar cells. Nat. Energy 2016, 1, 15012. [Google Scholar] [CrossRef] [Green Version]
  38. Yang, M.J.; Zhou, Y.Y.; Zeng, Y.N.; Jiang, C.S.; Padture, N.P.; Zhu, K. Square-Centimeter Solution-Processed Planar CH3NH3PbI3 Perovskite Solar Cells with Efficiency Exceeding 15%. Adv. Mater. 2015, 27, 6363–6370. [Google Scholar] [CrossRef]
  39. Zhou, Y.Y.; Vasiliev, A.L.; Wu, W.W.; Yang, M.J.; Pang, S.P.; Zhu, K.; Padture, N.P. Crystal Morphologies of Organolead Trihalide in Mesoscopic/Planar Perovskite Solar Cells. J. Phys. Chem. Lett. S 2015, 6, 2292–2297. [Google Scholar] [CrossRef]
  40. Xiao, M.D.; Huang, F.Z.; Huang, W.C.; Dkhissi, Y.; Zhu, Y.; Etheridge, J.; Gray-Weale, A.; Bach, U.; Cheng, Y.B.; Spiccia, L. A Fast Deposition-Crystallization Procedure for Highly Efficient Lead Iodide Perovskite Thin-Film Solar Cells. Angew. Chem. Int. Ed. 2014, 53, 9898–9903. [Google Scholar] [CrossRef]
  41. Kollek, T.; Gruber, D.; Gehring, J.; Zimmermann, E.; Schmidt-Mende, L.; Polarz, S. Porous and Shape-Anisotropic Single Crystals of the Semiconductor Perovskite CH3NH3PbI3 from a Single-Source Precursor. Angew. Chem. Int. Ed. 2015, 54, 1341–1346. [Google Scholar] [CrossRef]
  42. Li, D.H.; Wang, G.M.; Cheng, H.C.; Chen, C.Y.; Wu, H.; Liu, Y.; Huang, Y.; Duan, X.F. Size-dependent phase transition in methylammonium lead iodide perovskite microplate crystals. Nat. Commun. 2016, 7, 11330. [Google Scholar] [CrossRef]
  43. Zhang, X.W.; Yang, Z.Q.; Li, J.Z.; Deng, Y.H.; Hou, Y.M.; Mao, Y.F.; Lu, J.; Ma, R.M. Directly imaging the structure–property correlation of perovskites in crystalline microwires. J. Mater. Chem. A 2019, 7, 13305–13314. [Google Scholar] [CrossRef]
  44. Deng, Y.H.; Nest, L.G. Analysis of misidentifications in TEM characterization of organic-inorganic hybrid perovskite material. J. Microsc. 2021, 282, 1–10. [Google Scholar] [CrossRef] [PubMed]
  45. Zhu, Y.M.; Gui, Z.G.; Wang, Q.; Meng, F.X.; Feng, S.H.; Han, B.; Wang, P.Y.; Huang, L.; Wang, H.L.; Gu, M. Direct atomic scale characterization of the surface structure and planar defects in the organic-inorganic hybrid CH3NH3PbI3 by Cryo-TEM. Nano Energy 2020, 73, 104820. [Google Scholar] [CrossRef]
  46. Rothmann, M.U.; Li, W.; Zhu, Y.; Liu, A.; Ku, Z.L.; Bach, U.; Etheridge, J.; Cheng, Y.B. Structural and Chemical Changes to CH3NH3PbI3 Induced by Electron and Gallium Ion Beams. Adv. Mater. 2018, 30, 1800629. [Google Scholar] [CrossRef]
  47. Spence, J.C.H. High-Resolution Electron Microscopy; Oxford University Press: Oxford, UK, 2013. [Google Scholar]
  48. Wu, X.M.; Ke, X.X.; Sui, M.L. Recent progress on advanced transmission electron microscopy characterization for halide perovskite semiconductors. J. Semicond. 2022, 43, 041106. [Google Scholar] [CrossRef]
  49. Cai, Z.H.; Wu, Y.N.; Chen, S.Y. Energy-dependent knock-on damage of organic-inorganic hybrid perovskites under electron beam irradiation: First-principles insights. Appl. Phys. Lett. 2021, 119, 123901. [Google Scholar] [CrossRef]
  50. Chen, Z.X.; Ke, X.X.; Zhu, L.J.; Zhu, C.; Chen, Q.; Sui, M.L. Electron microscopy of organic-inorganic hybrid perovskite solar cell materials: Degradation mechanism study and imaging condition optimization. J. Chin. Electron. Microsc. Soc. 2019, 38, 15. [Google Scholar]
  51. Rothmann, M.U.; Kim, J.S.; Borchert, J.; Lohmann, K.B.; O’Leary, C.M.; Sheader, A.A.; Clark, L.; Snaith, H.J.; Johnston, M.B.; Nellist, P.D.; et al. Atomic-scale microstructure of metal halide perovskite. Science 2020, 370, eabb5940. [Google Scholar] [CrossRef]
  52. Egerton, R.F. Radiation damage to organic and inorganic specimens in the TEM. Micron 2019, 119, 72–87. [Google Scholar] [CrossRef]
  53. Li, Y.Z.; Li, Y.B.; Pei, A.; Yan, K.; Sun, Y.M.; Wu, C.L.; Joubert, L.M.; Chin, R.; Koh, A.L.; Yu, Y.; et al. Atomic structure of sensitive battery materials and Interfaces revealed by cryo-electron microscopy. Science 2017, 358, 506–510. [Google Scholar] [CrossRef] [Green Version]
  54. Wiktor, C.; Turner, S.; Zacher, D.; Fischer, R.A.; Tendeloo, G.V. Imaging of intact MOF-5 nanocrystals by advanced TEM at liquid nitrogen temperature. Micropor. Mesopor. Mat. 2012, 162, 131–135. [Google Scholar] [CrossRef]
  55. Zachman, M.J.; Tu, Z.Y.; Choudhury, S.; Archer, L.A.; Kourkoutis, L.F. Cryo-STEM mapping of solid-liquid interfaces and dendrites in lithium-metal batteries. Nature 2018, 560, 345–349. [Google Scholar] [CrossRef]
  56. Wang, X.F.; Zhang, M.H.; Alvarado, J.; Wang, S.; Sina, M.; Lu, B.Y.; Bouwer, J.; Xu, W.; Xiao, J.; Zhang, J.G.; et al. New Insights on the Structure of Electrochemically Deposited Lithium Metal and Its Solid Electrolyte Interphases via Cryogenic TEM. Nano Lett. 2017, 17, 7606–7612. [Google Scholar] [CrossRef]
  57. Li, Y.Z.; Huang, W.; Li, Y.B.; Pei, A.; Boyle, D.T.; Yi, C. Correlating Structure and Function of Battery Interphases at Atomic Resolution Using Cryoelectron Microscopy. Joule 2018, 2, 2167–2177. [Google Scholar] [CrossRef] [Green Version]
  58. Meents, A.; Gutmann, S.; Wagner, A.; Schulze-Briese, C. Origin and temperature dependence of radiation damage in biological samples at cryogenic temperatures. Proc. Natl. Acad. Sci. USA 2010, 107, 1094–1099. [Google Scholar] [CrossRef] [PubMed] [Green Version]
  59. Shi, L.X.; Wang, J.; Zhou, L.; Chen, Y.L.; Yan, J.; Dai, C.N. Facile in-situ preparation of MAPbBr3@UiO-66 composites for information encryption and decryption. J. Solid State Chem. 2019, 282, 121062. [Google Scholar] [CrossRef]
  60. Herzing, A.A.; Delongchamp, D.M. Cold Microscopy Solves Hot Problems in Energy Research. Matter 2019, 1, 1104–1118. [Google Scholar] [CrossRef]
  61. Cao, D.H.; Stoumpos, C.C.; Malliakas, C.D.; Katz, M.J.; Farha, O.K.; Hupp, J.T.; Kanatzidis, M.G. Remnant PbI2, an unforeseen necessity in high-efficiency hybrid perovskite-based solar cells? APL Mater. 2014, 2, 091101. [Google Scholar] [CrossRef] [Green Version]
  62. Hsu, H.Y.; Du, M.S.; Zhao, J.; Yu, E.T.; Bard, A.J. Optimization of PbI2/MAPbI3 Perovskite Composites by Scanning Electrochemical Microscopy. J. Phys. Chem. C 2016, 120, 19890–19895. [Google Scholar] [CrossRef]
  63. Kim, Y.C.; Jeon, N.J.; Noh, J.H.; Yang, W.S.; Seo, J.; Yun, J.S.; Ho-Baillie, A.; Huang, S.J.; Green, M.A.; Seidel, J.; et al. Beneficial Effects of PbI2 Incorporated in Organo-Lead Halide Perovskite Solar Cells. Adv. Energy Mater. 2016, 6, 1502104. [Google Scholar] [CrossRef]
  64. Zhang, D.L.; Zhu, Y.H.; Liu, L.M.; Ying, X.R.; Hsiung, C.E.; Sougrat, R.; Li, K.; Han, Y. Atomic-resolution transmission electron microscopy of electron beam–sensitive crystalline materials. Science 2018, 359, 675–679. [Google Scholar] [CrossRef] [PubMed] [Green Version]
  65. Yuan, B.; Yu, Y. High-resolution transmission electron microscopy of beam-sensitive halide perovskites. Chem 2022, 8, 327–339. [Google Scholar] [CrossRef]
Figure 1. Schematic structural model of typical ABX3 [13]. Reprinted with permission from Ref. [13]. Copyright 2020, John Wiley and Sons.
Crystals 13 00973 g001
Figure 2. Schematic illustrations of two typical imaging modes of electron microscopy (a) TEM (b) STEM [13]. Reprinted with permission from Ref. [13]. Copyright 2020, John Wiley and Sons.
Crystals 13 00973 g002
Figure 3. (a) Electron beam irradiation damage observed in free-standing MAPbI3 films [25]. Reprinted with permission from Ref. [25]. Copyright 2018, Elsevier. (b) Time-series of TEM images on MAPbI3 single crystal showing the electron beam damage from 0 to 50 s, where bubble-like morphology (colored arrows) emerged and grew [26]. Reprinted with permission from Ref. [26]. Copyright 2020, IOP Publishing on behalf of the Japan Society of Applied Physics (JSAP).
Crystals 13 00973 g003
Figure 4. Generality of decomposition pathway for MAPbI3 and MAPbBr3 [30]. Reprinted with permission from Ref. [30]. Copyright 2020, John Wiley and Sons. (ad) Consecutive SAED patterns during the decomposition of MAPbI3; (e) The intensity line profiles extracted along the white arrow in (a); (f) The HAADF−STEM image of the decomposed product PbI2 along the [ 4 ¯ 41] zone axis; (gj) Time−series SAED patterns during the decomposition of MAPbBr3; (k) The structure line profiles obtained from time−series SAED patterns along the white arrow in (g); (l) HRTEM image of the decomposed product PbBr2; (mp) The structure illustrations for decomposition from MAPbI3 to PbI2 and MAPbBr3 to PbBr2. All figures have been permitted to be reprinted by original journals.
Crystals 13 00973 g004
Figure 5. Phases characterization of MAPbI3 under different temperature. Atomistic structures of (a) orthorhombic (below −111 °C), (b) tetragonal (−111 to 54 °C) and (c) cubic (over 54 °C) MAPbI3. (df) SAED patterns of MAPbI3 at −180, 25, 90 °C. (gi) The corresponding simulated SAED patterns along the [100] direction of orthorhombic and tetragonal MAPbI3 and [110] direction of cubic MAPbI3 [31]. The inside frames are selected area to compare whether the SAED patterns match to the simulated diffraction patterns. Reprinted with permission from Ref. [31]. Copyright 2020, Elsevier.
Crystals 13 00973 g005
Figure 6. Simulated electron diffraction (ED) patterns of tetragonal MAPbI3 and hexagonal PbI2. (a) MAPbI3 along [110] axis zone. (b) PbI2 along [44 1 ¯ ] zone axis. (c) MAPbI3 along [101] axis zone. (d) PbI2 along [8101] zone axis. (e) MAPbI3 along [2 0 ¯ 1] zone axis. (f) PbI2 along [88 1 ¯ ] zone axis. (g) MAPbI3 along [1 2 ¯ 0] zone axis. (h) PbI2 along [4 1 ¯ 1] zone axis. Reprinted with permission from Ref. [34]. Copyright 2020, MDPI.
Crystals 13 00973 g006
Figure 7. Analysis of ignoring the absent crystal planes. (a) HRTEM image of pseudo MAPbI3 along [001] zone axis, (11 0 ¯ ), (110) planes are missing. (b) FFT of (a). (c) Simulated ED pattern of corrected PbI2 phase along [44 1 ¯ ] zone axis (d) HRTEM image of intrinsic MAPbI3 along [001] axis zone. (e) Fast Fourier Transform (FFT) of (d). (f) Simulated ED pattern of intrinsic MAPbI3 along [001] zone axis [44]. Reprinted with permission from Ref. [44]. Copyright 2021, John Wiley and Sons.
Crystals 13 00973 g007
Figure 8. HRTEM image, FFT and simulated ED patterns of intrinsic (df), pseudo (ac) MAPbI3 along [ 2 ¯ 01] zone axis were also be analysed. The newly added annotations in reproduced HRTEM images were marked by yellow font [45]. Reprinted with permission from Ref. [45]. Copyright 2020, Elsevier.
Crystals 13 00973 g008
Figure 9. Atomic-level STEM images of FAPbI3. (a) Partially FA-depleted perovskite; (b) Coherent PbI2: FAPbI3 interface; (c) Sharp FAPbI3 grain boundaries; (d) Stacking fault and dislocation [51]. Reprinted with permission from Ref. [51]. Copyright 2020, The American Association for the Advancement of Science.
Crystals 13 00973 g009
Disclaimer/Publisher’s Note: The statements, opinions and data contained in all publications are solely those of the individual author(s) and contributor(s) and not of MDPI and/or the editor(s). MDPI and/or the editor(s) disclaim responsibility for any injury to people or property resulting from any ideas, methods, instructions or products referred to in the content.

