Abstract
Thirty-four binary systems of nitrofurantoin with pyridine derivatives were analyzed by combining virtual (molecular complementarity prediction and hydrogen bond propensity calculations) and experimental (liquid-assisted grinding) screening methods. A new modification of the hydrogen bond propensity calculation method (the integrated hydrogen bond propensity calculation method) with significantly improved virtual screening efficiency was proposed. Novel cocrystals of nitrofurantoin with 3-aminopyridine and 2-(1H-Imidazol-2-yl)pyridine were discovered. The crystal structures of the new cocrystals were determined from single-crystal X-ray diffraction data, and the hydrogen bond patterns were studied in conjunction with the Molecular Electrostatic Potential maps of the components. The nitrofurantoin cocrystal with 3-aminopyridine was found to exist in two polymorphic modifications. The origins of the different stability of the polymorphic forms were rationalized both in terms of total lattice enthalpy and free energy derived from periodic DFT-D3 calculations and in terms of the non-covalent interaction energy distribution in crystal.
1. Introduction
Active pharmaceutical ingredients (APIs) are often delivered to patients in a solid state as part of a variety of dosage forms (e.g., tablet, capsule, pill, suppository) [1], as these are convenient, compact, and stable formats for storing APIs or drug products. However, most of the drugs that are either currently on the market or are in the development stage have low bioavailability [2,3]. The development of multicomponent crystals (salts and cocrystals) is one of the most promising approaches to improving the physicochemical characteristics of APIs that do not change the pharmacological properties of the target molecule. The design of multicomponent crystals, mainly cocrystals, is based on the term supramolecular synthons [4,5,6], described by Desiraju as “robust intermolecular interactions” [7]. A valuable starting point for predicting the cocrystal structure is the identification of the supramolecular synthon in a crystalline solid. This requires not only searching for the most favorable synthons in molecules with rival molecular recognition sites but also an understanding of the hierarchy of supramolecular synthons [8,9,10,11]. As a result, an “appropriate” design will produce multicomponent crystals with desired physicochemical properties.
Screening of novel multicomponent crystals is a time-consuming and expensive process. In the interests of increasing the efficiency and reducing the cost of this step, much attention has been paid to the selection of coformers and screening methods [12,13,14]. Numerous virtual and experimental methods have recently been developed for screening novel multicomponent crystals. Among the most popular virtual screening tools are hydrogen bond propensity (HBP) [15,16], molecular complementarity (MC) [17], Hansen solubility parameters (HBP) [18], conductor-like screening model for real solvents (COSMO-RS) [19], and molecular electrostatic potential maps (MEP) [20]. However, the predictive reliability of virtual screening tools is extremely variable. The same virtual screening method can yield accuracies ranging from 30 to 80%, according to the molecule targeted. [21]. In spite of the wide variety of experimental screening techniques, each of them has a number of limitations. For example, liquid-assisted grinding is not applicable to systems prone to amorphization during grinding [22], thermal screening methods cannot be used with thermally unstable compounds [23], and solution-based methods for obtaining cocrystals are limited by the solubility of compounds in the solvent [24,25]. Therefore, a confluence of experimental and virtual screening methods is required to streamline the screening process for identifying new multicomponent crystals [26,27,28].
Nitrofurantoin is an antibacterial drug compound (Figure 1) that belongs to class IV of the Biopharmaceutics Classification System [29,30] due to its low water solubility and permeability [31,32]. A large number of NFT multicomponent solid forms with derivatives of pyridine, benzamide, benzoic acid, carboxylic, and amino acids have been obtained for the last decade [29,30,33,34,35,36,37,38,39]. In the paper devoted to the study of the NFT cocrystals with four structurally related carboxamide compounds [37], a Cambridge Structural Database (CSD) analysis was carried out, which showed a high probability (63.4%) of the -Nim–H⋯Npyr hydrogen bond heterosynthon formation for the compounds that have the cyclic imidedione fragment in the structure. However, it is not possible to make reliable assumptions about the possible synthon hierarchy in potential NFT multicomponent crystals. This is due to the high diversity in the molecular packing and hydrogen bonding motifs of the known NFT multicomponent crystals caused by different functional groups in the coformers.
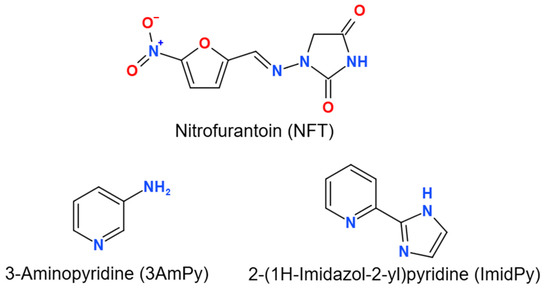
Figure 1.
Molecular structures of the compounds studied.
In the present work, a combined virtual and experimental screening of the NFT multicomponent crystals with pyridine derivatives was performed (Table S1). A modification of the hydrogen bond propensity calculation method was proposed, which significantly increases the efficiency of the qualitative screening of the NFT multicomponent crystals. Three new cocrystals of NFT with 3-aminopyridine ([NFT+3AmPy] (1:1) Form I and Form II) and 2-(1H-Imidazol-2-yl)pyridine ([NFT+ImidPy] (2:1)) (Figure 1) were identified and their crystal structures were determined. The differences in molecular conformation, hydrogen bond pattern, and molecular packing between the polymorphic forms of the [NFT+3AmPy] cocrystal (1:1) and their impact on lattice energy and relative stability were studied through periodic DFT computations and non-covalent interaction analysis using Molecular Electrostatic Potential (MEP) maps, Quantum Theory of Atoms in Molecules and Crystals (QTAIMC), Hirshfeld surface analysis, and interaction energy frameworks computed using the UNI intermolecular potentials. The packing features of novel and previously known crystal structures of the NFT-based cocrystals were compared using XPac analysis, and the non-covalent energy distribution was investigated by a set of complementary theoretical methods.
2. Materials and Methods
2.1. Materials
Nitrofurantoin was purchased from Acros Organics (Pittsburgh, PA, USA) and used without further purification. The experimental PXRD pattern corresponds to the β polymorph of NFT (Cambridge Structural Database (CSD) code LABJON02). All the coformers were obtained from Sigma-Aldrich (St. Louis, MO, USA) or Acros Organics (Pittsburgh, PA, USA). They were used in the condition in which they arrived. The solvents used were of analytical or chromatographic grade.
2.2. Crystallization Procedure
[NFT+3AmPy] cocrystals (1:1) Forms I and II. NFT (10.10 mg, 0.04 mmol) and 3AmPy (39.90 mg, 0.40 mmol) were dissolved in acetone and allowed to evaporate at room temperature. Orange prismatic crystals of the cocrystal (Form I) were obtained at the bottom of the vessel after 3 days. Orange needle crystals of cocrystal (Form II) were obtained on the vessel walls after 1 day.
[NFT+ImidPy] cocrystal (2:1). NFT (7.05 mg, 0.03 mmol) and ImidPy (42.95 mg, 0.3 mmol) were dissolved in acetonitrile or ethanol. The solvent was allowed to evaporate at room temperature. Orange prismatic crystals of the cocrystal were obtained after 4 days.
2.3. Liquid-Assisted Grinding (LAG)
Multicomponent crystals were prepared by liquid-assisted grinding (LAG) with a planetary micromill, model Pulverisette 7 (Fritsch, Idar-Oberstein, Germany). In addition, 12 mL agate grinding jars with ten 5 mm agate balls were used. The grinding experiments were performed for 60 min at a rotation speed of 500 rpm. A physical mixture of NFT and coformer in a molar ratio of 1:1 or 2:1 was placed in a grinding jar, and 50 μL of a solvent (acetonitrile, acetone, methanol, ethanol, water, dimethylformamide, dioxane, tetrahydrofuran, ethyl acetate, or chloroform) was loaded with a micropipette. PXRD was used to analyze the powder samples obtained.
2.4. Powder X-ray Diffraction (PXRD)
The PXRD data of the NFT powders were collected using a D2 PHASER XRD diffractometer (Bruker, Karlsruhe, Germany) working at 30 kV and 10 mA utilizing Cu-Kα1 radiation (λ = 1.54187 Å). The data collection was performed from 4 to 30° 2θ with a 0.02° step size and a count time of at least 1 s per step.
2.5. Single Crystal X-ray Diffraction (SCXRD)
Single crystal X-ray diffraction data were collected using a Bruker SMART APEX II diffractometer (Bruker AXS, Karlsruhe, Germany). Graphite-monochromated Mo-Kα radiation was used in the ω-scan mode. Adsorption corrections were applied based on equivalent reflection measurements [40]. The structures were solved by direct methods and refined by full matrix least-squares on F2. Anisotropic thermal parameters were used for all non-hydrogen atoms [41]. A difference Fourier map was used and refined with isotropic thermal parameters for all hydrogen atoms. The crystallographic data were deposited with the Cambridge Crystallographic Data Center as supplementary publications under CCDC numbers 2169243–2169245. This information is available free of charge from the Cambridge Crystallographic Data Centre via www.ccdc.cam.ac.uk/data_request/cif (accessed on 27 April 2022).
2.6. Thermogravimetric Analysis
The thermal analysis of the powders was performed with a differential scanning calorimeter (Perkin Elmer DSC 4000, Waltham, MA, USA) equipped with a refrigeration system. Powdered samples were heated in a sealed aluminum sample holder at a rate of 10 °C·min−1 under a nitrogen atmosphere. Indium and zinc standards were used to calibrate the instrument. Weighing precision was ±0.01 mg.
The TG 209 F1 Iris thermomicrobalance (Netzsch, Selb, Germany) was utilized to perform TGA analysis. The powder sample (approximately 10 mg) was placed in a platinum crucible and heated at a heating rate of 10 °C·min−1 over a temperature range of 25 to 300 °C. Samples were flushed with flowing dry Ar at 30 mL·min−1 during testing.
2.7. Computational Details
2.7.1. Molecular Complementarity (MC)
The molecular complementarity method is based on calculated quantitative structure–activity relationship molecular descriptors [15,17,42]. It is implied that cocrystal-forming molecules generally have similar properties (e.g., shape, polarity). The CSD-Materials suite in Mercury 2021.3.0 was used for the molecular complementarity calculations [43]. By default, MC uses three shape descriptors (S axis, S/L axis, and M/L axis) and two polarity descriptors (nitrogen and oxygen fraction and dipole moment) [44]. Although other types of molecular descriptors have been previously proposed for cocrystal screening by this method [17]. We decided to use the default settings for our study. Each descriptor has a “PASS/FAIL” criterion. Overall, if and only if all five descriptors show a “PASS”, the formation of a cocrystal is predicted [27]. For the selected library of coformers, the probability of multicomponent crystal formation was assessed by comparison with (a) the stable form of nitrofurantoin (conformer 1) and (b) the nitrofurantoin conformation generated using the conformer generation tool (conformer 2) (Figure S1). Details of the screening by MC are summarized in ESI (S1).
2.7.2. Hydrogen Bond Propensity (HBP)
The calculations of the hydrogen-bond propensity [15,16] were carried out in Mercury 2021.3.0 [43]. Each NFT+coformer pair was drawn and auto-edited, and functional groups were picked from Mercury’s suggestions. Training data (800–2000 structures per functional group) was generated and propensities calculated using a logistic regression model with a ROC curve above 0.800. The CSD database (ver. 5.43) was used for all calculations [45]. To estimate the probability of multicomponent crystal formation, the MultiComponent Score value (Δ(HBP)), i.e., the difference between the best hetero-interaction and the best homo-interaction propensities, was used [42].
2.7.3. Crystal Similarity Analysis Using XPac
The study of the packing similarity features in the NFT cocrystals and salt was performed using the XPac program (ver. 2.0.2) [46]. Since the NFT molecule exists in two different conformations, all atoms except hydrogens were included in a common set of points [47]. The cut-off parameters of the XPac calculations were set to “high” to detect possible low-level isostructural motifs.
2.7.4. Molecular Electrostatic Potential (MEP) Calculations
The molecular electrostatic potential surfaces (MEPs) [48] for NFT, 3AmPy, and ImidPy were generated in Gaussian 16 Revision C.01 using the B3LYP functional and aug-cc-pVTZ basis sets [49]. The molecular structures were relaxed prior to the MEP calculations. The MultiWFN software [50] was utilized to exact the local maxima and minima on the MEP surfaces. For the visualization of the electron density ρ = 0.001 isosurfaces derived from MultiWFN and mapped with the MEP functions with added extrema points. The post-processing of the VDM render was conducted following the tutorial by Tian Lu [50]. VMD program ver.1.9.3 with Tachyon render was used [51].
2.7.5. Hirshfeld Surface Analysis
The Hirshfeld surface analysis [52] of the molecules extracted from the crystal structure of the studied solids was performed in the CrystalExplorer program version 17.5 [53] at “very high” surface resolution. The distances from the Hirshfeld surface to the nearest nucleus outside and inside the surface (de and di, respectively) were plotted into a 2D fingerprint map, and the contributions from the contacts between different atom pairs were evaluated.
2.7.6. Periodic DFT Computations
All new crystal structures were subjected to optimization of atomic position followed by vibrational analysis based on periodic DFT computations in the CRYSTAL17 program [54] at the B3LYP/6-31G(d,p) level of theory with Grimme’s D3 dispersion correction with the Becke-Johnson damping and the Axelrod-Teller-Muto three-body term [55,56,57]. The X–H bond lengths were normalized before relaxation to the neutron diffraction values, and the space group and unit ell parameters of the crystals were frozen. In order to remove the disorder in the ImidPy molecule located in a special position of the [NFT+ImidPy] cocrystal (2:1) with site occupancy 0.5, the symmetry was reduced from P21/c to P21 prior to the computations. The shrinking factor reflecting the density of the k-point grid in the reciprocal space was set at least to four depending on the reciprocal lattice vectors in a particular crystal. The TOLDEE and TOLINTEG parameters controlling total energy SCF convergence and bielectronic integral truncation were set to 10 and 7 7 7 7 25, respectively. No imaginary vibrational modes were observed for the relaxed structures, which is an indicator of a local minimum on the potential energy surface. For additional computational details, the reader is referred to our previous papers [58,59].
2.7.7. Lattice Energy Evaluation
A common way to evaluate the lattice energy, Elatt, of an n-component crystal implies conducting DFT computations for the bulk solid and individual molecules in the gas phase. The Elatt is then calculated as a difference between the total electronic energies of a relaxed crystal, Ecryst, and isolated molecules, Emol with the zero-point energy and basis set superposition energy correction [60,61]:
Here, Z is the number of molecules in the unit cell.
As an alternative way of estimating the energetic properties of molecular packing, an analysis of the non-covalent interaction energies was performed within the QTAIMC framework [62,63]. A search for the line critical points [64] with Laplacian values >0 [63] was conducted in TOPOND14 [65], and the non-covalent interaction energies were estimated using the Eint~Gb correlation equation proposed by Mata et al. [66]:
Eint [kJ∙mol−1] = 1127 Gb [a.u.]
Here, Eint is the energy of a single interaction, and Gb is the positively defined local kinetic energy density.
The lattice energy, Elatt, is then calculated by the lattice summation of interaction energies within the asymmetric unit, as described in our earlier publications [58,67]. Compared to Equation (1), the lattice sum approaches yield more information on the Elatt contributions from different packing motifs and single strong directed interactions.
In an alternative method, the Elatt was estimated based on pair interaction energies calculated using the UNI force field [68,69] via the “UNI Intermolecular Potentials” component within the CSD-Materials module of Mercury 2021.3.0 [43].
3. Results
In our previous work [37], we tried to rationalize the hydrogen bonding pattern of the studied NFT cocrystals based on the analysis of the molecular electrostatic potential surface of the NFT and coformer molecules. This method has been extended to a series of NFT-pyridine derivative systems in this paper. To evaluate the effectiveness of virtual screening methods for the NFT multicomponent crystals, 19 coformers of known NFT solvates, salts, and cocrystals and 15 new coformers were selected for screening (Table S1).
The binding sites of NFT include one H-bond donor and six acceptor atoms (Figure S1) [37]. Depending on the conformation of the NFT molecule, the position of H-bond acceptors and the dipole moment of the molecule differ greatly. According to the CSD survey, the NFT molecules in crystal take the planar conformation with two possible orientations of the 5-nitrofuran fragment presented in Figure S1. The difference between these conformations is in the torsion angle (τ1(N-C-C-O)), which is almost 0° in conformer 1 (the synperiplanar conformation) and almost 180° in conformer 2 (the antiperiplanar conformation), respectively. It should be noted that different NFT conformations are observed even in the salts with the same coformer (4-aminopyridine, 4AmPy) but with different hydration levels ([NFT+4AmPyr+H2O] (1:1:1) and (1:1:4)) [70]. The predominant conformation 1 with a significant dipole moment contains four H-bond acceptors in close proximity, providing a suitable binding site for a molecule/fragment with multiple donor groups, such as H2O, R-NH2, etc. This is probably why 8 out of 19 known NFT multicomponent crystals contain amino or amide functional groups in the coformer structures (Table S1).
Based on our previous work [37], LAG was chosen as the main experimental screening method. Thermal screening methods are not applicable because NFT is a thermally unstable compound. The results of experimental screening were compared with the results of virtual screening generated by two commonly used tools: molecular complementarity (MC) and hydrogen bond propensity (HBP). The screening results are summarized in Table S2.
3.1. Experimental Screening
A total of 15 coformers were selected for screening novel NFT multicomponent crystals via LAG. Only 2 out of 15 coformers were found to form new multicomponent crystals with NFT: 3-aminopyridine and 2-(1H-imidazol-2-yl)pyridine (Table S2). In addition, two polymorphs (Form I and Form II) of the [NFT+3AmPy] cocrystal (1:1) were obtained by solution crystallization, and their crystal structures were determined. It was observed that the [NFT+3AmPy] cocrystal (1:1) Form II could not be obtained by LAG. Grinding the physical mixture of NFT and 3AmPy in the presence of different solvents resulted in the formation of a more thermodynamically stable cocrystal polymorph (Form I) (Figure 2a). Grinding the physical mixture NFT and ImidPy resulted in a [NFT+ImidPy] cocrystal (2:1), regardless of the solvent used (Figure 2b).
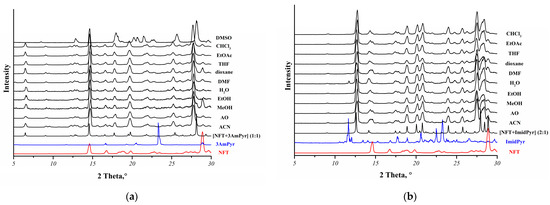
Figure 2.
Overlay of the experimental PXRD patterns of the NFT mixtures with (a) 3AmPy or (b) ImidPy obtained by LAG in the presence of different solvents (ACN—acetonitrile, AO—acetone, MeOH—methanol, EtOH—ethanol, H2O—water, DMF—dimethylformamide, THF—tetrahydrofuran, EtOAc—ethyl acetate, CHCl3—chloroform) with the calculated PXRD patterns for the [NFT+3AmPy] (1:1) Form I or [NFT+ImidPy] (2:1) cocrystals.
The effect of the number of H-bond donors in the coformer molecules on the probability of the NFT multicomponent crystals’ formation was studied (Table S1). For the selected series of coformers (8 coformes), there is a 100% rate of NFT cocrystal/salt/solvate formation with compounds without the H-bond donors. Furthermore, the probability of the formation of NFT multicomponent crystals decreases by almost a factor of 2 as the number of H-bond donors in the coformers increases (Figure S2). The imbalance in the ratio of H-bonding donors to acceptors is often corrected during the formation of the crystal lattice of a multicomponent crystal by varying its stoichiometric composition or by attracting additional sources of H-bonding centers (solvent molecules) [71]. Among the systems discussed in this work, there are both NFT multicomponent crystals with a molar ratio other than 1:1 ([NFT+ImidPy] cocrystal (2:1)) and hydrated/solvated NFT multicomponent solids with 2-pyridone, 4,4′-bipyridine, 1,2-bis(4-pyridyl)ethane, isoniazid, and 4-aminopyridine [34,35,36,39]. Therefore, C–H⋯O/C–H⋯N and other weaker non-covalent interactions play a key role in stabilizing the crystal structures for most of the NFT multicomponent crystals.
3.2. Virtual Screening
We used the concept of a confusion matrix to quantitatively assess the predictive ability of virtual screening tools [42]. Confusion matrices can be constructed for any model that has prediction and observation data. Each column of the matrix corresponds to the instances in a prediction class, and each row corresponds to the instances in an observation class. The entries in the matrix can be labeled as True Positive (TP; predicted and observed multicomponent crystal), False Positive (FP; predicted multicomponent crystal, but not observed), False Negative (FN; predicted no multicomponent crystal, but observed one), and True Negative (TN; predicted and observed no multicomponent crystal), as shown in Figure 3a.
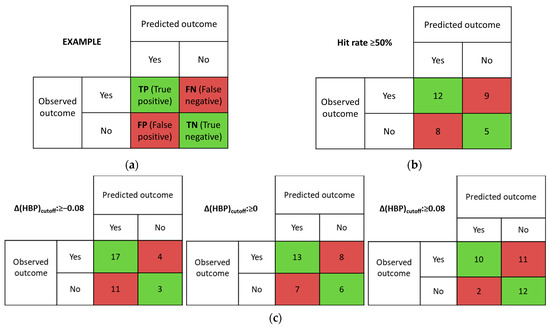
Figure 3.
Example of confusion matrix (a) and confusion matrixes determined from (b) MC (Hit rate cut-off value of 50% was used) and (c) multicomponent HBP (Δ(HBP) (cutoff values of −0.08, 0.00, and 0.08 were used).
3.2.1. Molecular Complementary (MC) Calculation Method
The MC method has shown conflicting results with the experimental screening (Table S2, Figure 3b). The discrimination threshold for the screening method (Hit rate cut-off value) was equal to or greater than 50%. This means that if the MC calculation result is positive for NFT conformer 1 and negative for conformer 2, we consider this system to be promising. The MC method gave true positive and true negative results in only 50% of the cases studied. The rest of the results were not consistent with the experiment. For systems containing at least one H-bond donor, the MC results indicated the formation of a new form. Exceptions were the two-component systems with betahistine, quinolinic acid, emoxypine, 2-pyridinecarbothioamide and 4-pyridinecarbothioamide. The MC method applied to the NFT systems with quinolinic acid and emoxypine shows agreement with the experimental results (these multicomponent crystals do not form). False negative hits were mostly found in coformers, whose structures do not contain H-bond donors.
The MC method predicts 57% positive hits for conformer 1, compared to 38% for conformer 2. It confirms the assumption that the binding site with four H-bond acceptors in conformation 1 of the NFT molecule is best suited for the water molecule or the NH2- group. Molecular complementarity analysis shows opposite results for the two conformations of NFT with six coformers (2-pyridone, 2-hydroxy-4-methylpyridine, 2,6-diaminopyridine, 4-aminopyridine, 2-aminonicotinic acid, and pyridoxine) (Table S2). The multicomponent crystals of nitrofurantoin are actually formed with four out of these six coformers. Therefore, an obligatory task, anticipating the screening of cocrystals by the MC method, should be the search and identification of possible conformations of the target molecule by both virtual and experimental methods [14,72,73].
3.2.2. Hydrogen-Bond Propensity (HBP) Calculation Method
HBP is a simple tool that is much less time- and labor-intensive than actual experiments [74,75]. Usually, the MultiComponent score cut-off value (the discrimination threshold, Δ(HBP)cutoff) is determined in advance to analyze the results of the HBP analysis. The Δ(HBP)cutoff indicates the predominance of the hetero- or homo-interaction formation probability and, consequently, the multicomponent crystal formation or not. For example, Sandhu et al. suggested that the multicomponent score cut-off value should be set at −0.1 [76]. However, Wood et al. [42] noted that the choice of Δ(HBP)cutoff should be dictated by the purpose of the screening and can be changed. Increasing the value of Δ(HBP)cutoff can minimize the number of experiments. However, some systems forming multicomponent crystals may be skipped. As the Δ(HBP)cutoff decreases, the number of experiments increases, but there is a high probability that no cocrystals or salts will be missed.
In our work, we have decided to analyze the influence of the chosen discrimination threshold on the efficiency of the method. Since the average uncertainty statistical value of the method is 0.08 [42], we estimated the effectiveness of the HBP model with Δ(HBP)cutoff: −0.08; 0 and 0.08 (Figure 3c). Indeed, as the Δ(HBP)cutoff threshold is lowered, the number of true positive hits increases. However, increasing the number of false negative hits obviously leads to increasing the number of unsuccessful trials. Increasing the threshold value of Δ(HBP)cutoff results in a significant reduction in false negative hits.
We would like to mention separately the system of NFT with 2-aminonicotinic acid (2AmNicAc), the HBP analysis of which resulted in a false positive hit. This is probably due to the fact that 2AmNicAc, both in pure form and as part of multicomponent crystals, is often in the zwitterionic form [42]. Therefore, the HBP parameters for the zwitterionic form were calculated for the marked compound. The Δ(HBP) value for NFT+2AmNicAc (zwitterionic form) is negative (−0.15).
To facilitate discussion of the HBP results, we have labeled the target molecule (NFT) as “A” and the coformer (or CF) as “B” [42]. The four types of paired H-bonding interactions are: A:A where the target donates and accepts; A:B where the target donates and the coformer accepts; B:A where the coformer donates and the target accepts; and B:B where the coformer donates and accepts.
Can the predictive power of the HBP method be affected by proton transfer or the presence of solvent molecules? The possible transfer of a proton from one molecule to another can drastically affect the calculated hydrogen bond formation propensity values. However, in most of the works devoted to the evaluation of the HBP method’s effectiveness for cocrystal screening [27,42], a preliminary assessment of ΔpKa in the analyzed systems is not carried out. Previously, the effectiveness of the HBP method for the screening of salts and cocrystals had only been analyzed in one paper [16].
The ΔpKa for an acid–base pair was calculated by subtracting the pKa values of the strongest acid and the strongest base, where ΔpKa = pKa(BH+) − pKa(A) (Table S1). Only 3 of the 34 systems studied are characterized by ΔpKa values that belong to the uncertainty region (−1 < ΔpKa < 4). These are systems with 4-dimethylaminopyridine, betahistine, and 4-aminopyridine. It was confirmed that NFT salts are formed with these three coformers (Table S3).
NFT salts with pyridine derivatives are formed by the transfer of hydrogen atoms from the only hydrogen bond donor of the API molecule to the coformer molecule. In these systems, NFT acts only as an H-bond acceptor. Therefore, the HBP analysis of the binary systems demonstrates the formation of only one type of hydrogen bond between coformers (type B:A, Table S3).
The application of the HBP method to systems with the transfer of the only H-bond donor of the coformer is inappropriate because HBP involves calculating the difference between the propensity of the best hetero-interaction and the best homo-interaction. Since the probability of salt/cocrystal formation estimated from ΔpKa does not always follow the ΔpKa rule (e.g., the NFT+2,6-diaminopyridine system with ΔpKa = −1.42 still produces salt), it is better to screen for neutral components.
HBP analysis of three-component systems (NFT+coformer+solvent) quite accurately predicts the formation of hydrogen bonds in the crystal lattice of cocrystal solvates (two or three of the highest H-bond propensity scores correspond to the crystal structures of nitrofurantoin 2-pyridone acetonitrile solvate and nitrofurantoin 1,2-bis(4-pyridyl)ethane hydrate, respectively).
An analysis of the probability parameters for the formation of hydrogen bonds for systems with 3- and 4-aminopyridine made it possible to find that, despite the fact that the B:B hydrogen bond has the highest propensity values (0.88 and 0.89, respectively (Table S3)) and Δ(HBP) for the systems are equal to −0.18 and −0.17, respectively (Table S2), the six closest hydrogen bonds in both 3- and 4-aminopyridine are of the A:B type (see Supplementary Materials, S2: Details of the integrated hydrogen bond propensity calculation). As a rule, all “good” donors of hydrogen bonds are involved in the formation of cocrystals (Etter’s first general hydrogen bonding rule for organic compounds [42]). Therefore, the decision to estimate the probability of the formation of a new multicomponent crystal containing only one hydrogen bond seems biased.
3.2.3. Integrated Hydrogen-Bond Propensity (intHBP) Calculation Method
In addition to the main heterosynthons (such as acid-amide or acid-pyridine [77]), secondary interactions also play an important role in the stabilization of the multicomponent crystals [78,79,80]. Therefore, it seems somewhat imprudent to limit the analysis of the HBP calculation results by estimating the difference between only the most probable hetero- and homosynthons. The HBP results should be considered in terms of the “integrated” value of all the competitive probabilities of hydrogen bonding. This means that the most probable hydrogen bonds for all donors present in the system should be estimated using the following equation for systems with two or more H-bond donors:
where Δint(HBP)—integrated MultiComponent Score; Δ(HBP)(A)—difference between the highest A:B hydrogen bond propensity value and the highest A:A hydrogen bond propensity value for each donor of the target molecule; Δ(HBP)(B)—difference between the highest B:A hydrogen bond propensity value and the highest B:B hydrogen bond propensity value for each donor of the conformer; n and m—the number of donors in the target molecule and in the coformer, respectively; i and j—the number of functional groups with hydrogen bond donors in the target molecule and in the coformer, respectively.
In cases where there are two H-bond donors in a functional group (for example, the -NH2 group), the calculation is performed according to the two maximum values of the heterosynthons and homosynthons for the functional group formation probabilities. The HBP method evaluates the probability of the formation of intramolecular H-bonds as well as intermolecular H-bonds. Therefore, this factor is taken into account in the intHBP method. Due to the fact that the donor involved in intramolecular hydrogen bond formation cannot participate in other intermolecular interactions [81], the calculation took into account the difference between the probability of an intramolecular hydrogen bond formation and the highest intermolecular hydrogen bond propensity for the donor. In the case where the probability of intramolecular bond formation was higher, this donor was excluded from the calculation of the Δ(HBP).
The details of the intHBP analysis method and examples of several system calculations are presented in ESI (S2). The results of the intHBP analysis are summarized in Table S4 and presented in confusion matrix form in Figure 4.
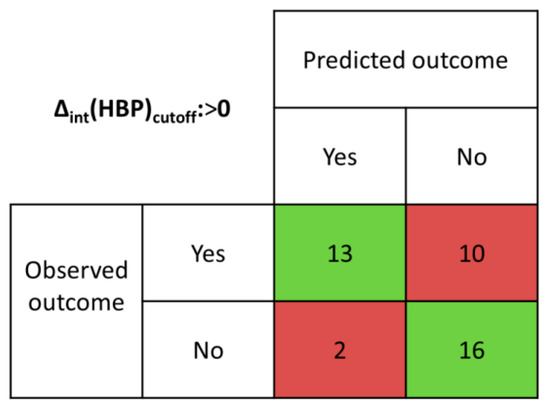
Figure 4.
Confusion matrix determined from intHBP results.
Table 1 shows a comparison of the effectiveness of virtual screening methods. Since the existence of three-component crystals (solvates of salts and cocrystals) has been proven for some of the selected systems, it should be clarified that these hits were marked as true positives if the virtual screening method confirmed the formation of a two-component crystal. The discrimination threshold (Δint(HBP)cutoff) was set to 0. The Δint(HBP) values greater than 0 indicate the formation of multicomponent crystals; otherwise they do not. The proposed intHBP approach has maximum accuracy in comparison with the MCP and HBP methods. While the overall accuracy of the MCP method was found to be 50%, for the HBP method: ~62% (when Δ(HBP)cutoff > −0.08), ~56% (when Δ(HBP)cutoff > 0), and ~59% (when Δ(HBP)cutoff > 0.08), the accuracy of the intHBP method was higher than 76%. Despite the highest specificity of the intHBP method (100% for the studied coformers group), the sensitivity of the intHBP method is equal to the sensitivity of the HBP method with Δ(HBP)cutoff > 0, and lower than the sensitivity value of the HBP method with Δ(HBP)cutoff > −0.08.

Table 1.
Effectiveness (ε) of the multicomponent crystal virtual screening methods.
It should also be noted that for 3 out of the 8 systems that are characterized by Δint(HBP) values close to 0, only solvated forms of multicomponent crystals are known. It is likely that the lack of hydrogen bonding centers in these systems is offset by solvent molecules. In addition, the high propensity for intramolecular hydrogen bond formation also reduces the sensitivity of the intHBP method. This is due to the fact that the acceptor involved in the formation of intramolecular hydrogen bonds weakens its acceptor ability in the formation of intermolecular bonds.
3.3. Crystal Structure Analysis
In this work, three novel multicomponent crystals of NFT with 3AmPy (two polymorphs) and ImidPy were obtained with the slow evaporation method. The crystallographic data are detailed in Table 2. Hydrogen bonding parameters (Table S5) and ORTEP diagrams (Figure S3) for all solid forms are included in the ESI.
Table 2.
Crystallographic data, details of the SCXRD experiment, and structure refinement for the NFT multicomponent crystals.
3.3.1. [NFT+3AmPy] Cocrystals (1:1) Forms I and II
As stated above, the [NFT+3AmPy] cocrystal (1:1) was found to crystallize in two polymorphic modifications, with only Form I corresponding to the bulk phase observed during the screening experiments. Both Forms I and II contain two NFT molecules and two molecules of 3AmPy in their asymmetric units, held together by N–H⋯O/N hydrogen bonds and C–H⋯O/N contacts. In both forms, the only strong H-bond donor in the NFT molecule (the imide N–H group) and the strongest H-bond acceptor of 3AmPy (the N atom of the pyridine ring) form a partially covalent N–H⋯N hydrogen bond, in accordance with Etter’s third rule [81] (Figure 5). From the electron density at the (3; −1) critical point, the N–H⋯N bond (0.060–0.066 a.u.) can be classified as a borderline interaction between closed-shell and partially covalent bonds [82]. The energy of this interaction estimated using the Eint~Gb correlation [66] is the highest in crystals of both forms and equals 41–44 kJ·mol−1, which is comparable to the N–H⋯O hydrogen bonds observed in the NFT cocrystals with aromatic carboxamides [37]. In Form II, the imide-pyridine synthon is additionally stabilized by a C–H⋯O bond with interaction energy Eint = 6 kJ·mol−1 which completes a seven-member ring (Figure 5b). In Form I, the imide and pyridine fragments of interacting molecules are not coplanar, hindering the formation of the supporting C–H⋯O contact common for this synthon type (Figure 5a).
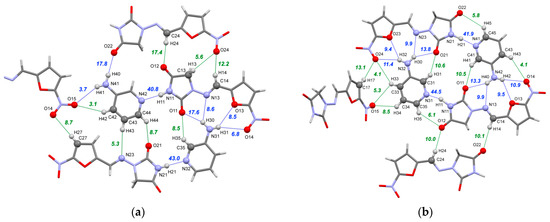
Figure 5.
Part of the hydrogen bond network in Form I (a) and Form II (b) of the [NFT+3AmPy] cocrystal (1:1). The numbers correspond to the interaction energies of “classical” hydrogen bonds (blue dotted lines) and C–H⋯O/N hydrogen bonds (green dotted lines) in kJ·mol−1 estimated using Equation (2).
The conformation of the two NFT molecules in Form II is identical, while in Form I, one of the symmetry-inequivalent molecules adopts conformation 1 and the other one adopts conformation 2. As stated in our previous work [37], conformation 2 is more energetically preferable, with stabilization energy equal to 6 kJ·mol−1. These results agree with the earlier estimation performed in the work by Tutughamiarso et al. (11.8 kJ·mol−1) [38]. Since conformation 1 is observed in the majority of the NFT crystal structures, including those presented in this work, it can be concluded that the gain in packing energy from the multicenter coordination with the nucleophilic site in conformation 1 is greater than the conformational penalty.
The difference in the conformations of the NFT molecules between the forms results in differences in the hydrogen bonding pattern. Multiple acceptor sites of the NFT molecules in both Form I and Form II with conformation 1 coordinate the amino group of 3AmPy, leading to the formation of four weak bifurcated hydrogen bonds with the interaction energy between 9 and 14 kJ·mol−1 (Figure 5b). This synthon is additionally supported by the two C–H⋯O contacts, resulting in a total of six bonds with a total energy of 58–59 kJ·mol−1 in Form II and five bonds with a total Eint of 50 kJ·mol−1 in Form I (Figure 5a). An identical heterosynthon was observed earlier for NFT monohydrate II, NFT peroxosolvate [83] as well as in NFT cocrystals with 3-aminobenzoic acid [36], 4-hydroxybenzamide [35], urea [29], and picolinamide [37]. While the total energy of this heterosynthon exceeds that of the “main” imide-pyridine synthon by about 1.4 times, it is not formed by the strongest donor and acceptor sites in the crystal and would likely be overlooked during the virtual screening based on the heterosynthon approach, like HBP.
The amino group of the second 3AmPy molecule in Form I, which is not involved in the formation of the heterosynthon, participates in a weak N41–H40⋯O22 bond with the imide oxygen and a very weak N41–H41⋯O15 hydrogen bond with the –NO2 oxygen of the adjacent NFT molecules, linking the molecules into a corrugated sheet along with multiple C–H⋯O contacts presented in Figure 5. Parallel sheets are stabilized by stacking interactions and C–H⋯O/N H-bonds, as shown in Figure S4a.
In contrast, Form II consists of distinct tetramers formed by strong hydrogen bond heterosynthons packed into displaced parallel stacks (Figure S4b). The stacks in the crystal are connected only by C–H⋯X hydrogen bonds and weaker interactions. The difference in packing architecture is reflected in the relative contributions to the lattice energy estimated by QTAIMC (Tables S6–S8). The combined energy of “classical” hydrogen bonds in Form II is 17 kJ·mol−1 higher compared to one for Form I (87.2 against 70.1 kJ·mol−1); however, this is largely offset by the fraction of non-conventional C–H⋯O/N bonds (77.6 against 53.7 kJ·mol−1). The fractions of stacking and C–H⋯π interactions also differ, reflecting the packing features of both forms, such as γ packing [84] of displaced parallel stacks in Form II and deviations from planarity of 2D sheets in Form I.
Crystal packing similarity analysis performed using the Mercury software has revealed that Forms I and II of [NFT+3AmPy] (1:1) only share a common centrosymmetric motif of two NFT molecules (2 molecules out of 15, RMS = 0.136). The performed XPac analysis [46,47] for the single- and multicomponent crystals of NFT from the CSD showed that Form I shares a common centrosymmetric dimer of NFT molecules held by π-stacking interactions with a variable offset with 17 crystal structures reported so far, including the β-form of pure NFT. According to the CSD survey results, the polar P212121 space group observed in Form II is uncommon for NFT crystals. Only one salt hydrate with L-arginine with the same symmetry (refcode ORUXEF) has been reported to date. At the same time, the centrosymmetric space groups represent 95% of all NFT crystal structures.
Periodic DFT-D3 computations revealed that Form I and II are close in terms of lattice energy (257.8 vs. 253.7 kJ·mol−1). The thermal and entropy terms derived from the vibrational analysis were also found to be within the calculation error (Table S9). Higher absolute values of both energies, enthalpy and free energy of Form I, allow us to conclude that Form II is thermodynamically less favorable compared to Form I in the temperature range from 0 to 298.15 K. Moreover, Form I has a 1.7% higher density compared to Form II (1.525 versus 1.500 g·cm−3), which is often considered an indicator for a higher entropy value according to the “density rule” proposed by Burger and Ramberger [85]. However, a recent study [86] has demonstrated that this rule is violated in 45% of monotropic systems, significantly reducing its reliability.
The combined DSC/TG analysis of Form I displays an endothermic event at 151 °C with weight loss equal to 28.88% (Figure S5a). A hot-stage microscopy study of [NFT+3AmPy] allowed identification of this process as cocrystal sublimation with the escape of molecules of the more volatile 3AmPy from the crystal lattice. The remaining NFT recrystallizes at 151 °C and remains solid up to 270 °C (the melting temperature of pure NFT). Since the cocrystal is thermally unstable, we were unable to determine the order of stability from a DSC experiment.
The lattice energies of the polymorphic forms estimated from the QTAIMC analysis are also close (206.8 kJ·mol−1 for Form I and 213.3 kJ·mol−1 for Form II), with Form II being more energetically preferable by 6 kJ·mol−1. However, the QTAIMC method does not take into account the difference in conformation energies between the polymorphic forms, which also equals 6 kJ·mol−1. With this correction applied, the resulting lattice energy difference between Form I and Form II equals zero.
From the packing energy perspective, the polymorphic forms of [NFT+3AmPy] (1:1) can be distinguished by the distribution of non-covalent energies of the packing motifs. For example, 50% of the total lattice energy of Form II estimated using QTAIMC is contained within the hydrogen-bonded tetramer, while in Form I, the distribution of the non-covalent interaction energy is more even. The energy frameworks based on the UNI force field [68,69] support this statement (Figure S6). In order to compare the non-covalent energy distribution in the two crystals, the 20 strongest interactions in Forms I and II were selected, and their energies were plotted in Figure 6. Although the energy of the first 12 interactions corresponding to the hydrogen-bonded tetramer and molecules from nearby layers interacting via π-π stacking is higher for Form II, further increasing the number of contacts leads to better stabilization of Form I. The total lattice energy of Form I estimated by this method (251.2 kJ·mol−1) was found to be 0.2 kJ·mol−1 higher than that of Form II, which agrees well with the QTAIMC results corrected for the conformation energy (Table S6). It is also worth noting that UNI (similar to other parameterized force fields) considers stacking interactions stronger compared to QTAIMC since the total energies of π⋯π stacking interactions estimated by UNI exceed 55% of Elatt in both forms.
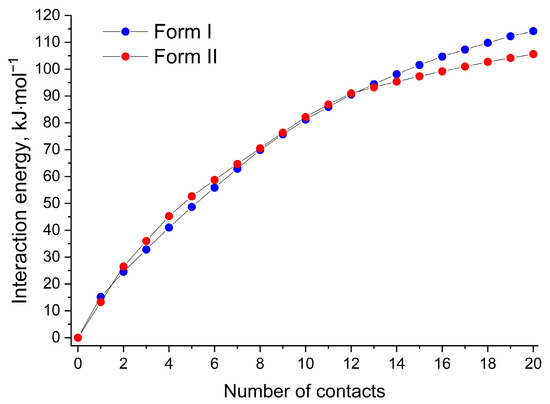
Figure 6.
Pair interaction energies of a probe NFT molecule with the 20 nearest molecules in Form I (blue circles) and Form II (red circles) estimated using the UNI force field.
The lack of strong/moderate hydrogen bonds or other interactions uniting the isolated tetramers into a crystal of Form II is probably one of the reasons for the slower crystal growth of Form II and the dominance of Form I in crystallization experiments.
To further investigate the difference in non-covalent interactions in two polymorphic forms of [NFT+3AmPy] (1:1), the Hirshfeld surface analysis was utilized. The fingerprint plots were built for all four molecules in the asymmetric unit of both Forms I and II using CrystalExplorer 17.5, and the contributions to the surface area from the contacts with adjacent molecules were examined (Figure 7). The major impact on the packing comes from conventional and non-conventional (C–H⋯O/N) hydrogen bonds, while the second largest contribution comes from the H···H and (C/N/O)⋯(C/N/O) interactions. A common interpretation of the fingerprint plots attributes these contacts to dispersion and stacking interactions, respectively. However, a recently proposed definition treats Hδ−⋯Hδ+ interactions as dihydrogen bonds, which are subspecies of hydrogen bonds [87].
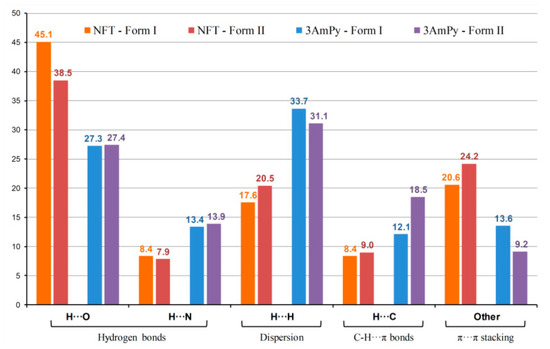
Figure 7.
Results of Hirshfeld surface analysis for individual molecules in polymorphic forms of [NFT+3AmPy] (1:1). The data are averaged over two molecules of the same type in the asymmetric unit.
In Form II, the fraction of C–H⋯π bonds on the Hirshfeld surface of the conformer molecule is 1.5 times higher than in Form I, indicating the role of interactions of this type in the γ packing of the 2D stacks in the crystal. In contrast, the stacking interactions involving 3AmPy are less prominent in Form II because of the parallel-displaced orientation of the π-systems of molecules from adjacent layers compared to the lamellar packing of layers in Form I (Figure S4).
Our findings confirm that the competition between hydrogen donor and acceptor sites in the molecules constituting the multicomponent crystal may lead to an unexpected packing architecture that is not easily predicted by common algorithms such as HBP that judge cocrystal formation based on a single interaction. Including multiple H-bond donors and acceptors in the intHBP scheme allows a more accurate description of the main interactions in the crystal for a proper assessment of cocrystallization probability.
3.3.2. [NFT+ImidPy] Cocrystal (2:1)
The [NFT+ImidPy] cocrystal (2:1) belongs to a P21/c space group. The asymmetric unit contains one NFT molecule and one molecule of ImidPy located in the inversion center with 0.5 occupancy. In order to remove the disorder in the crystal, the symmetry of the crystal was reduced to P21 with three molecules in the asymmetric unit prior to the DFT computations. As in the [NFT+3AmPy] cocrystals (1:1), the strongest non-covalent interaction in the [NFT+ImidPy] crystal is formed between the best donor in the NFT molecule (the imide N–H group) and the best acceptor (the pyridine ring) (Figure 8). Due to steric reasons, this bond is longer and lower in energy (33.0 kJ·mol−1) than the identical imide-pyridine bond in the [NFT+3AmPy] (1:1) crystals. Two weaker H-bonds between the N–H and C–H donors in the ImidPy and imide oxygens of NFT complete the heterosynthon. The second NFT molecule forms a two-center heterosynthon based on N11–H11⋯N2 and C2–H2⋯O12 hydrogen bonds. It is worth noting that, although the coformer molecule is planar, no critical points corresponding to intramolecular hydrogen bonds were observed by the QTAIMC method in the volume between the imidazole N–H group and the N atom of the pyridine moiety in the ImidPy molecule.
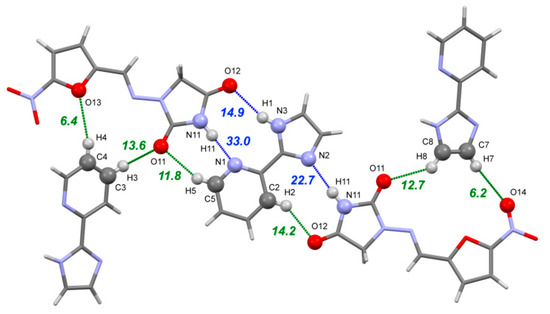
Figure 8.
Part of the hydrogen bond network in the [NFT+ImidPy] (2:1) crystal. The numbers correspond to the interaction energies of ‘classical’ hydrogen bonds (blue dotted lines) and C–H⋯O/N hydrogen bonds (green dotted lines) in kJ·mol−1 estimated using Equation (2).
A pair of C17–H17⋯O15 hydrogen bonds between the NFT molecules with a total energy of 25 kJ·mol−1 links the trimers into infinite parallel chains. The chains are stabilized by stacking interactions, which are facilitated by the planar shape of the molecules and the small offset between them, uniting the parallel chains into layers (Figure S7). The adjacent layers with different orientations are packed into a crystal at an angle of 27.6° via C–H⋯O/N hydrogen bonds between the free acceptor sites in the nitro and imidazolidine groups of NFT and the C–H groups of both NFT and ImidPy molecules (shown in Figure 8).
The [NFT+ImidPy] (2:1) and the nitrofurantoin multicomponent crystals known from the CSD crystal structures comparison led to the finding that a NFT cocrystal with 2,2′-bipyridyl [88] (refcode AZAXIK) shows 3D isostructurality to the [NFT+ImidPy] (2:1). Both crystals share a common hydrogen bond pattern and closely similar packing architecture, as presented in Figure S8. The fact that ImidPy in the crystal can be replaced by a molecule with no H-bond donors indicates the low impact of the imidazole N–H donor site on the crystal packing.
From an energetic point of view, the hydrogen bonds within the chains, stacking interactions, and C–H⋯O/N bonds between the layers in [NFT+ImidPy] (2:1) are balanced, as they contribute almost equally to the crystal lattice energy (Table S6). The fraction of stacking interactions in Elatt equals 30%, or 111 kJ·mol−1 per formula unit, of which 68 kJ·mol−1 correspond to interactions between the NFT molecules and 43 kJ·mol−1 come from NFT-ImidPy contacts. Considering the fact that the QTAIMC experiences difficulties in finding the (3; −1) critical points for non-directed interactions (including π⋯π stacking), one can assume that the stabilizing role of stacking interactions in a crystal is comparable to that of classical and non-conventional hydrogen bonds.
The computational insight into the origins of stabilities of different NFT crystal forms presented in this work highlights that the role of weak non-directional interactions should not be underestimated when considering the relative energy of polymorphic forms or the probability of cocrystal formation between the components. While most virtual screening approaches utilize hydrogen bonding ability as the main criteria for cocrystal formation, the potential inclusion of C–H⋯X hydrogen bonds and stacking interactions in any form would benefit the efficiency of the algorithms.
4. Conclusions
A combined virtual and experimental screening of 34 binary systems containing the antibacterial drug nitrofurantoin (NFT) and pyridine derivatives resulted in the discovery of three novel cocrystals: [NFT+3AmPy] cocrystals (1:1) Forms I and II and [NFT+ImidPy] cocrystal (2:1). According to the experimental screening results, the formation of nitrofurantoin cocrystals with pyridine derivatives is more likely when the coformer molecule has no hydrogen bond donors in its structure. It is demonstrated that the lack of hydrogen bonding sites in coformer molecules leads to lower accuracy in virtual screening algorithms. For example, the molecular complementarity prediction (MCP) method has been shown to fail for coformers with no hydrogen bond donors in the structure. It has been demonstrated that the MCP method is sensitive to the conformations of nitrofurantoin. The sensitivity and specificity of the virtual screening approach based on hydrogen bond propensity depend strongly on the chosen value of the discrimination threshold. However, even the variation in the MC score cut-off values cannot raise the overall accuracy of the method above 62% on the studied set of compounds.
Based on the performance comparison of different virtual screening approaches, we have proposed a new algorithm for processing the HBP calculation data: the integrated hydrogen-bond propensity calculation method (intHBP). For a set of nitrofurantoin cocrystals with pyridine derivatives, this method was found to be superior to other virtual screening schemes used in the work in terms of accuracy and specificity. Another advantage of the method is the absence of the need to select the discrimination threshold for every compound since, in intHBP, this parameter is fixed to zero. The proposed intHBP method also allows taking into account the probabilities of intramolecular hydrogen bonds and demonstrates 100% efficiency in non-promising coformer detection. 100% specificity of the method will significantly reduce the work load at the stage of multicomponent crystal screening.
Novel multicomponent crystals of NFT with 3AmPy (two polymorphic forms) and ImidPy were obtained as a result of screening experiments. While the obtained [NFT+ImidPy] (2:1) cocrystal and Form I of the [NFT+3AmPy] cocrystal (1:1) can be produced in bulk using a variety of methods, the Form II of [NFT+3AmPy] (1:1) was obtained only once from a crystallization experiment by solvent evaporation. The crystal structures of these cocrystals were solved from single-crystal X-ray diffraction data, and the hydrogen bond pattern was discussed in conjunction with MEP maps of the constituent molecules. The origins of the lower stability of Form II were rationalized both in terms of energetic characteristics derived from periodic DFT-D3 computations and in terms of non-covalent interaction energy distribution in crystal. It was found that Form I is characterized by more favorable lattice energy, total enthalpy, and free energy, while the structure of Form II features the robust hydrogen-bonded NFT-3AmPy tetramers that are weakly bound to one another, which supposedly inhibits crystal growth.
The present study underscores the impact of secondary interactions (side hydrogen bonds, C–H⋯X contacts, π⋯π stacking) on cocrystal formation, which is often neglected in crystal engineering. The proposed intHBP method represents an attempt to include these interactions into a virtual screening workflow in order to reduce the amount of experimental labor and improve the overall screening efficiency, making an important step towards the targeted design of multicomponent crystals for pharmaceutical and other industrial applications.
Supplementary Materials
The following supporting information can be downloaded at: https://www.mdpi.com/article/10.3390/cryst13071022/s1. S1: Details of molecular complementarity (MC) calculation; S2: Details of the integrated hydrogen bond propensity calculation; Figure S1: Chemical structure of NFT with atom labeling considered for conformational analysis; Figure S2: Effect of the number of donors per coformer molecule on their formation of multicomponent crystals with NFT; Figure S3: ORTEP drawings of the NFT multicomponent crystals; Figure S4: Packing of molecules in the polymorphic forms of the [NFT+3AmPy] cocrystal (1:1); Figure S5: DSC and TG curves for [NFT+3AmPy] (1:1) Form I and [NFT+ImidPy] (2:1); Figure S6: Energy frameworks displaying a cluster of molecules forming the strongest interactions with the probe built for [NFT+3AmPy] (1:1) Form I and Form II; Figure S7: Packing of molecules in the [NFT+ImidPy] (2:1) crystal; Figure S8: Overlay of crystal structures of [NFT+ImidPy] (2:1) and [NFT+2,2′-bipyridyl] (2:1); Table S1: pKa values of nitrofurantoin and pyridine-based compounds reported in this paper; Table S2: Results of the virtual and experimental screening of NFT multicomponent crystals; Table S3: Summary of conformer details, atom numbering schemes, propensity data, and comparison of predicted and observed outcomes for the various reactions reported; Table S4: Results of intHBP screening method of the NFT multicomponent crystals; Table S5: Geometry of intermolecular interactions in the NFT multicomponent crystal structures; Table S6: Contributions of different types of non-covalent interactions into the lattice energies of studied NFT cocrystals estimated by QTAIMC; Table S7: Contributions of different types of non-covalent interactions into the lattice energies of studied NFT cocrystals estimated by QTAIMC using the Eint (kJ·mol−1) = −2.3 + 186 ρb (a.u.) correlation; Table S8: Contributions of different types of non-covalent interactions into the lattice energies of studied NFT cocrystals estimated by QTAIMC using the Eint (kJ·mol−1) = 0.31 Vb (a.u.) correlation; Table S9: Results of the periodic DFT computations for two polymorphic forms of [NFT+3AmPy] (1:1).
Author Contributions
Conceptualization, G.L.P. and A.N.M.; methodology, A.N.M., A.P.V. and D.E.B.; software, A.N.M., A.P.V. and A.V.C.; formal analysis, K.V.D.; investigation, A.N.M., D.E.B. and A.V.C.; writing—original draft preparation, A.N.M., A.P.V. and K.V.D.; writing—review and editing, G.L.P.; visualization, A.N.M., A.P.V. and D.E.B.; supervision, G.L.P.; project administration, G.L.P. All authors have read and agreed to the published version of the manuscript.
Funding
This research was funded by the Russian Science Foundation, Grant No. 19-73-10005.
Data Availability Statement
The results obtained for all experiments performed are shown in the manuscript and Supplementary Materials. The raw data will be provided upon request.
Acknowledgments
We thank the Upper Volga Region Centre of Physicochemical Research for the assistance with powder X-ray diffraction and TG experiments.
Conflicts of Interest
The authors declare no conflict of interest.
References
- Zhou, Q.T.; Li, T. Formulation and Manufacturing of Solid Dosage Forms. Pharm. Res. 2018, 36, 16. [Google Scholar] [CrossRef] [PubMed]
- Thayer, A.M. Finding Solutions. Chem. Eng. News Arch. 2010, 88, 13–18. [Google Scholar] [CrossRef]
- Aakeröy, C.B.; Fasulo, M.E.; Desper, J. Cocrystal or Salt: Does It Really Matter? Mol. Pharm. 2007, 4, 317–322. [Google Scholar] [CrossRef]
- Nangia, A.; Desiraju, G.R. Supramolecular Synthons and Pattern Recognition. In Design of Organic Solids. Topics in Current Chemistry; Weber, E., Aoyama, Y., Caira, M.R., Desiraju, G.R., Glusker, J.P., Hamilton, A.D., Meléndez, R.E., Nangia, A., Eds.; Springer: Berlin/Heidelberg, Germany, 1998; Volume 198, pp. 57–95. ISBN 978-3-540-69178-5. [Google Scholar]
- Corpinot, M.K.; Bučar, D.-K. A Practical Guide to the Design of Molecular Crystals. Cryst. Growth Des. 2019, 19, 1426–1453. [Google Scholar] [CrossRef]
- Fleischman, S.G.; Kuduva, S.S.; McMahon, J.A.; Moulton, B.; Bailey Walsh, R.D.; Rodríguez-Hornedo, N.; Zaworotko, M.J. Crystal Engineering of the Composition of Pharmaceutical Phases: Multiple-Component Crystalline Solids Involving Carbamazepine. Cryst. Growth Des. 2003, 3, 909–919. [Google Scholar] [CrossRef]
- Desiraju, G.R. Supramolecular Synthons in Crystal Engineering—A New Organic Synthesis. Angew. Chem. Int. Ed. Engl. 1995, 34, 2311–2327. [Google Scholar] [CrossRef]
- Kavuru, P.; Aboarayes, D.; Arora, K.K.; Clarke, H.D.; Kennedy, A.; Marshall, L.; Ong, T.T.; Perman, J.; Pujari, T.; Wojtas, Ł.; et al. Hierarchy of Supramolecular Synthons: Persistent Hydrogen Bonds between Carboxylates and Weakly Acidic Hydroxyl Moieties in Cocrystals of Zwitterions. Cryst. Growth Des. 2010, 10, 3568–3584. [Google Scholar] [CrossRef]
- Bučar, D.-K.; Henry, R.F.; Zhang, G.G.Z.; MacGillivray, L.R. Synthon Hierarchies in Crystal Forms Composed of Theophylline and Hydroxybenzoic Acids: Cocrystal Screening via Solution-Mediated Phase Transformation. Cryst. Growth Des. 2014, 14, 5318–5328. [Google Scholar] [CrossRef]
- Gołdyn, M.; Larowska, D.; Nowak, W.; Bartoszak-Adamska, E. Synthon Hierarchy in Theobromine Cocrystals with Hydroxybenzoic Acids as Coformers. CrystEngComm 2019, 21, 7373–7388. [Google Scholar] [CrossRef]
- Bolla, G.; Nangia, A. Supramolecular Synthon Hierarchy in Sulfonamide Cocrystals with Syn-Amides and N-Oxides. IUCrJ 2019, 6, 751–760. [Google Scholar] [CrossRef]
- Malamatari, M.; Ross, S.A.; Douroumis, D.; Velaga, S.P. Experimental Cocrystal Screening and Solution Based Scale-up Cocrystallization Methods. Adv. Drug Deliv. Rev. 2017, 117, 162–177. [Google Scholar] [CrossRef] [PubMed]
- Kumar, A.; Nanda, A. In-Silico Methods of Cocrystal Screening: A Review on Tools for Rational Design of Pharmaceutical Cocrystals. J. Drug Deliv. Sci. Technol. 2021, 63, 102527. [Google Scholar] [CrossRef]
- Khalaji, M.; Potrzebowski, M.J.; Dudek, M.K. Virtual Cocrystal Screening Methods as Tools to Understand the Formation of Pharmaceutical Cocrystals—A Case Study of Linezolid, a Wide-Range Antibacterial Drug. Cryst. Growth Des. 2021, 21, 2301–2314. [Google Scholar] [CrossRef]
- Galek, P.T.A.; Allen, F.H.; Fábián, L.; Feeder, N. Knowledge-Based H-Bond Prediction to Aid Experimental Polymorph Screening. CrystEngComm 2009, 11, 2634–2639. [Google Scholar] [CrossRef]
- Delori, A.; Galek, P.T.; Pidcock, E.; Patni, M.; Jones, W. Knowledge-Based Hydrogen Bond Prediction and the Synthesis of Salts and Cocrystals of the Anti-Malarial Drug Pyrimethamine with Various Drug and GRAS Molecules. CrystEngComm 2013, 15, 2916. [Google Scholar] [CrossRef]
- Fábián, L. Cambridge Structural Database Analysis of Molecular Complementarity in Cocrystals. Cryst. Growth Des. 2009, 9, 1436–1443. [Google Scholar] [CrossRef]
- Mohammad, M.A.; Alhalaweh, A.; Velaga, S.P. Hansen Solubility Parameter as a Tool to Predict Cocrystal Formation. Int. J. Pharm. 2011, 407, 63–71. [Google Scholar] [CrossRef]
- Abramov, Y.A.; Loschen, C.; Klamt, A. Rational Coformer or Solvent Selection for Pharmaceutical Cocrystallization or Desolvation. J. Pharm. Sci. 2012, 101, 3687–3697. [Google Scholar] [CrossRef]
- Musumeci, D.; Hunter, C.A.; Prohens, R.; Scuderi, S.; McCabe, J.F. Virtual Cocrystal Screening. Chem. Sci. 2011, 2, 883–890. [Google Scholar] [CrossRef]
- Cappuccino, C.; Cusack, D.; Flanagan, J.; Harrison, C.; Holohan, C.; Lestari, M.; Walsh, G.; Lusi, M. How Many Cocrystals Are We Missing? Assessing Two Crystal Engineering Approaches to Pharmaceutical Cocrystal Screening. Cryst. Growth Des. 2022, 22, 1390–1397. [Google Scholar] [CrossRef]
- Braga, D.; Maini, L.; Grepioni, F. Mechanochemical Preparation of Co-Crystals. Chem. Soc. Rev. 2013, 42, 7638–7648. [Google Scholar] [CrossRef] [PubMed]
- Boycov, D.E.; Manin, A.N.; Drozd, K.V.; Churakov, A.V.; Perlovich, G.L. Thermal Method Usage Features for Multicomponent Crystal Screening. CrystEngComm 2022, 24, 2280–2290. [Google Scholar] [CrossRef]
- Friščić, T.; Childs, S.L.; Rizvi, S.A.A.; Jones, W. The Role of Solvent in Mechanochemical and Sonochemical Cocrystal Formation: A Solubility-Based Approach for Predicting Cocrystallisation Outcome. CrystEngComm 2009, 11, 418–426. [Google Scholar] [CrossRef]
- Pawar, N.; Saha, A.; Nandan, N.; Parambil, J.V. Solution Cocrystallization: A Scalable Approach for Cocrystal Production. Crystals 2021, 11, 303. [Google Scholar] [CrossRef]
- Manin, A.N.; Drozd, K.V.; Surov, A.O.; Churakov, A.V.; Volkova, T.V.; Perlovich, G.L. Identification of a Previously Unreported Co-Crystal Form of Acetazolamide: A Combination of Multiple Experimental and Virtual Screening Methods. Phys. Chem. Chem. Phys. 2020, 22, 20867–20879. [Google Scholar] [CrossRef]
- Sarkar, N.; Gonnella, N.C.; Krawiec, M.; Xin, D.; Aakeröy, C.B. Evaluating the Predictive Abilities of Protocols Based on Hydrogen-Bond Propensity, Molecular Complementarity, and Hydrogen-Bond Energy for Cocrystal Screening. Cryst. Growth Des. 2020, 20, 7320–7327. [Google Scholar] [CrossRef]
- Grecu, T.; Adams, H.; Hunter, C.A.; McCabe, J.F.; Portell, A.; Prohens, R. Virtual Screening Identifies New Cocrystals of Nalidixic Acid. Cryst. Growth Des. 2014, 14, 1749–1755. [Google Scholar] [CrossRef]
- Cherukuvada, S.; Babu, N.J.; Nangia, A. Nitrofurantoin–P-aminobenzoic Acid Cocrystal: Hydration Stability and Dissolution Rate Studies. J. Pharm. Sci. 2011, 100, 3233–3244. [Google Scholar] [CrossRef]
- Maity, D.K.; Paul, R.K.; Desiraju, G.R. Drug–Drug Binary Solids of Nitrofurantoin and Trimethoprim: Crystal Engineering and Pharmaceutical Properties. Mol. Pharm. 2020, 17, 4435–4442. [Google Scholar] [CrossRef]
- Wijma, R.A.; Fransen, F.; Muller, A.E.; Mouton, J.W. Optimizing Dosing of Nitrofurantoin from a PK/PD Point of View: What Do We Need to Know? Drug Resist. Updates 2019, 43, 1–9. [Google Scholar] [CrossRef]
- Rosenberg, H.A.; Bates, T.R. The Influence of Food on Nitrofurantoin Bioavailability. Clin. Pharmacol. Ther. 1976, 20, 227–232. [Google Scholar] [CrossRef] [PubMed]
- Vangala, V.R.; Chow, P.S.; Tan, R.B.H. Characterization, Physicochemical and Photo-Stability of a Co-Crystal Involving an Antibiotic Drug, Nitrofurantoin, and 4-Hydroxybenzoic Acid. CrystEngComm 2011, 13, 759–762. [Google Scholar] [CrossRef]
- Alhalaweh, A.; George, S.; Basavoju, S.; Childs, S.L.; Rizvi, S.A.A.; Velaga, S.P. Pharmaceutical Cocrystals of Nitrofurantoin: Screening, Characterization and Crystal Structure Analysis. CrystEngComm 2012, 14, 5078–5088. [Google Scholar] [CrossRef]
- Vangala, V.R.; Chow, P.S.; Tan, R.B.H. The Solvates and Salt of Antibiotic Agent, Nitrofurantoin: Structural, Thermochemical and Desolvation Studies. CrystEngComm 2013, 15, 878–889. [Google Scholar] [CrossRef]
- Vangala, V.R.; Chow, P.S.; Tan, R.B.H. Co-Crystals and Co-Crystal Hydrates of the Antibiotic Nitrofurantoin: Structural Studies and Physicochemical Properties. Cryst. Growth Des. 2012, 12, 5925–5938. [Google Scholar] [CrossRef]
- Surov, A.O.; Voronin, A.P.; Drozd, K.V.; Volkova, T.V.; Vasilev, N.; Batov, D.; Churakov, A.V.; Perlovich, G.L. Extending the Range of Nitrofurantoin Solid Forms: Effect of Molecular and Crystal Structure on Formation Thermodynamics and Physicochemical Properties. Cryst. Growth Des. 2022, 22, 2569–2586. [Google Scholar] [CrossRef]
- Tutughamiarso, M.; Bolte, M.; Wagner, G.; Egert, E. Five Pseudopolymorphs and a Cocrystal of Nitrofurantoin. Acta Crystallogr. Sect. C Cryst. Struct. Commun. 2011, 67, 18–25. [Google Scholar] [CrossRef]
- Segalina, A.; Pavan, B.; Ferretti, V.; Spizzo, F.; Botti, G.; Bianchi, A.; Pastore, M.; Dalpiaz, A. Cocrystals of Nitrofurantoin: How Coformers Can Modify Its Solubility and Permeability Across Intestinal Cell Monolayers. Cryst. Growth Des. 2022, 22, 3090–3106. [Google Scholar] [CrossRef]
- Sheldrick, G.M. SADABS, Programs for Scaling and Absorption Correction of Area Detector Data; University of Gottingen: Gottingen, Germany, 1997. [Google Scholar]
- Sheldrick, G.M. A Short History of SHELX. Acta Crystallogr. Sect. A 2008, 64, 112–122. [Google Scholar] [CrossRef]
- Wood, P.A.; Feeder, N.; Furlow, M.; Galek, P.T.A.; Groom, C.R.; Pidcock, E. Knowledge-Based Approaches to Co-Crystal Design. CrystEngComm 2014, 16, 5839–5848. [Google Scholar] [CrossRef]
- MacRae, C.F.; Sovago, I.; Cottrell, S.J.; Galek, P.T.A.; McCabe, P.; Pidcock, E.; Platings, M.; Shields, G.P.; Stevens, J.S.; Towler, M.; et al. Mercury 4.0: From Visualization to Analysis, Design and Prediction. J. Appl. Crystallogr. 2020, 53, 226–235. [Google Scholar] [CrossRef] [PubMed]
- Pidcock, E.; Motherwell, W.D.S. A New Model of Crystal Packing. Chem. Commun. 2003, 24, 3028–3029. [Google Scholar] [CrossRef] [PubMed]
- Taylor, R.; Wood, P.A. A Million Crystal Structures: The Whole Is Greater than the Sum of Its Parts. Chem. Rev. 2019, 119, 9427–9477. [Google Scholar] [CrossRef] [PubMed]
- Gelbrich, T.; Hursthouse, M.B. A Versatile Procedure for the Identification, Description and Quantification of Structural Similarity in Molecular Crystals. CrystEngComm 2005, 7, 324–336. [Google Scholar] [CrossRef]
- Gelbrich, T.; Hursthouse, M.B. Systematic Investigation of the Relationships between 25 Crystal Structures Containing the Carbamazepine Molecule or a Close Analogue: A Case Study of the XPac Method. CrystEngComm 2006, 8, 448–460. [Google Scholar] [CrossRef]
- Murray, J.S.; Politzer, P. Hydrogen Bonding: A Coulombic σ-Hole Interaction. J. Indian Inst. Sci. 2020, 100, 21–30. [Google Scholar] [CrossRef]
- Frisch, M.J.; Trucks, G.W.; Schlegel, H.B.; Scuseria, G.E.; Robb, M.A.; Cheeseman, J.R.; Scalmani, G.; Barone, V.; Petersson, G.A.; Nakatsuji, H.; et al. Gaussian 16 Revision C. 01; Gaussian Inc.: Wallingford, CT, USA, 2016; Volume 1. [Google Scholar]
- Lu, T.; Chen, F. Multiwfn: A Multifunctional Wavefunction Analyzer. J. Comput. Chem. 2012, 33, 580–592. [Google Scholar] [CrossRef]
- Humphrey, W.; Dalke, A.; Schulten, K. VMD: Visual Molecular Dynamics. J. Mol. Graph. 1996, 14, 33–38. [Google Scholar] [CrossRef]
- Spackman, M.A.; Jayatilaka, D. Hirshfeld Surface Analysis. CrystEngComm 2009, 11, 19–32. [Google Scholar] [CrossRef]
- Spackman, P.R.; Turner, M.J.; McKinnon, J.J.; Wolff, S.K.; Grimwood, D.J.; Jayatilaka, D.; Spackman, M.A. CrystalExplorer: A Program for Hirshfeld Surface Analysis, Visualization and Quantitative Analysis of Molecular Crystals. J. Appl. Crystallogr. 2021, 54, 1006–1011. [Google Scholar] [CrossRef]
- Dovesi, R.; Erba, A.; Orlando, R.; Zicovich-Wilson, C.M.; Civalleri, B.; Maschio, L.; Rérat, M.; Casassa, S.; Baima, J.; Salustro, S.; et al. Quantum-Mechanical Condensed Matter Simulations with CRYSTAL. WIREs Comput. Mol. Sci. 2018, 8, e1360. [Google Scholar] [CrossRef]
- Grimme, S.; Antony, J.; Ehrlich, S.; Krieg, H. A Consistent and Accurate Ab Initio Parametrization of Density Functional Dispersion Correction (DFT-D) for the 94 Elements H-Pu. J. Chem. Phys. 2010, 132, 154104. [Google Scholar] [CrossRef] [PubMed]
- Grimme, S.; Ehrlich, S.; Goerigk, L. Effect of the Damping Function in Dispersion Corrected Density Functional Theory. J. Comput. Chem. 2011, 32, 1456–1465. [Google Scholar] [CrossRef]
- Becke, A. Density-Functional Thermochemistry. III. The Role of Exact Exchange. J. Chem. Phys. 1993, 98, 5648–5652. [Google Scholar] [CrossRef]
- Manin, A.N.; Voronin, A.P.; Drozd, K.V.; Perlovich, G.L. Thermodynamic Properties of Nalidixic and Oxolinic Acids: Experimental and Computational Study. Thermochim. Acta 2019, 682, 178411. [Google Scholar] [CrossRef]
- Surov, A.O.; Manin, A.N.; Voronin, A.P.; Boycov, D.E.; Magdysyuk, O.V.; Perlovich, G.L. New Pharmaceutical Cocrystal Forms of Flurbiprofen: Structural, Physicochemical, and Thermodynamic Characterization. Cryst. Growth Des. 2019, 19, 5751–5761. [Google Scholar] [CrossRef]
- Boys, S.F.; Bernardi, F. The Calculation of Small Molecular Interactions by the Differences of Separate Total Energies. Some Procedures with Reduced Errors. Mol. Phys. 1970, 19, 553–566. [Google Scholar] [CrossRef]
- Surov, A.O.; Voronin, A.P.; Vener, M.V.; Churakov, A.V.; Perlovich, G.L. Specific Features of Supramolecular Organisation and Hydrogen Bonding in Proline Cocrystals: A Case Study of Fenamates and Diclofenac. CrystEngComm 2018, 20, 6970–6981. [Google Scholar] [CrossRef]
- Bader, R.F.W. Atoms in Molecules. Acc. Chem. Res. 1985, 18, 9–15. [Google Scholar] [CrossRef]
- Tsirelson, V.G.; Ozerov, R.P. Electron Density and Bonding in Crystals: Principles, Theory and X-ray Diffraction Experiments in Solid State Physics and Chemistry; CRC Press: Boca Raton, FL, USA, 2020. [Google Scholar]
- Shahbazian, S. Why Bond Critical Points Are Not “Bond” Critical Points. Chem. A Eur. J. 2018, 24, 5401–5405. [Google Scholar] [CrossRef]
- Gatti, C.; Saunders, V.R.; Roetti, C. Crystal Field Effects on the Topological Properties of the Electron Density in Molecular Crystals: The Case of Urea. J. Chem. Phys. 1994, 101, 10686–10696. [Google Scholar] [CrossRef]
- Mata, I.; Alkorta, I.; Espinosa, E.; Molins, E. Relationships between Interaction Energy, Intermolecular Distance and Electron Density Properties in Hydrogen Bonded Complexes under External Electric Fields. Chem. Phys. Lett. 2011, 507, 185–189. [Google Scholar] [CrossRef]
- Manin, A.N.; Voronin, A.P.; Manin, N.G.; Vener, M.V.; Shishkina, A.V.; Lermontov, A.S.; Perlovich, G.L. Salicylamide Cocrystals: Screening, Crystal Structure, Sublimation Thermodynamics, Dissolution, and Solid-State DFT Calculations. J. Phys. Chem. B 2014, 118, 6803–6814. [Google Scholar] [CrossRef] [PubMed]
- Gavezzotti, A. Are Crystal Structures Predictable? Acc. Chem. Res. 1994, 27, 309–314. [Google Scholar] [CrossRef]
- Gavezzotti, A.; Filippini, G. Geometry of the Intermolecular X–H···Y (X, Y=N, O) Hydrogen Bond and the Calibration of Empirical Hydrogen-Bond Potentials. J. Phys. Chem. 1994, 98, 4831–4837. [Google Scholar] [CrossRef]
- Boycov, D.E.; Drozd, K.V.; Manin, A.N.; Churakov, A.V.; Perlovich, G.L. New Solid Forms of Nitrofurantoin and 4-Aminopyridine Salt: Influence of Salt Hydration Level on Crystal Packing and Physicochemical Properties. Molecules 2022, 27, 8990. [Google Scholar] [CrossRef]
- Manin, A.N.; Drozd, K.V.; Churakov, A.V.; Perlovich, G.L. Hydrogen Bond Donor/Acceptor Ratios of the Coformers: Do They Really Matter for the Prediction of Molecular Packing in Cocrystals? The Case of Benzamide Derivatives with Dicarboxylic Acids. Cryst. Growth Des. 2018, 18, 5254–5269. [Google Scholar] [CrossRef]
- Khodov, I.; Dyshin, A.; Efimov, S.; Ivlev, D.; Kiselev, M. High-Pressure NMR Spectroscopy in Studies of the Conformational Composition of Small Molecules in Supercritical Carbon Dioxide. J. Mol. Liq. 2020, 309, 113113. [Google Scholar] [CrossRef]
- Khodov, I.; Efimov, S.; Krestyaninov, M.; Kiselev, M. Exposing Hidden Conformations of Carbamazepine Appearing Due to Interaction with the Solid Phase by 2D 1H-15N HMBC NMR Spectroscopy. J. Pharm. Sci. 2021, 110, 1533–1539. [Google Scholar] [CrossRef]
- Sarkar, N.; Sinha, A.S.; Aakeröy, C.B. Systematic Investigation of Hydrogen-Bond Propensities for Informing Co-Crystal Design and Assembly. CrystEngComm 2019, 21, 6048–6055. [Google Scholar] [CrossRef]
- Barua, H.; Gunnam, A.; Yadav, B.; Nangia, A.; Shastri, N.R. An Ab Initio Molecular Dynamics Method for Cocrystal Prediction: Validation of the Approach. CrystEngComm 2019, 21, 7233–7248. [Google Scholar] [CrossRef]
- Sandhu, B.; McLean, A.; Sinha, A.S.; Desper, J.; Sarjeant, A.A.; Vyas, S.; Reutzel-Edens, S.M.; Aakeröy, C.B. Evaluating Competing Intermolecular Interactions through Molecular Electrostatic Potentials and Hydrogen-Bond Propensities. Cryst. Growth Des. 2018, 18, 466–478. [Google Scholar] [CrossRef]
- Vener, M.V.; Levina, E.O.; Koloskov, O.A.; Rykounov, A.A.; Voronin, A.P.; Tsirelson, V.G. Evaluation of the Lattice Energy of the Two-Component Molecular Crystals Using Solid-State Density Functional Theory. Cryst. Growth Des. 2014, 14, 4997–5003. [Google Scholar] [CrossRef]
- Manin, A.N.; Voronin, A.P.; Shishkina, A.V.; Vener, M.V.; Churakov, A.V.; Perlovich, G.L. Influence of Secondary Interactions on the Structure, Sublimation Thermodynamics, and Solubility of Salicylate: 4-Hydroxybenzamide Cocrystals. Combined Experimental and Theoretical Study. J. Phys. Chem. B 2015, 119, 10466–10477. [Google Scholar] [CrossRef]
- Taylor, R. Identifying Intermolecular Atom···atom Interactions That Are Not Just Bonding but Also Competitive. CrystEngComm 2020, 22, 7145–7151. [Google Scholar] [CrossRef]
- Garcia, M.R.; Iribarren, I.; Rozas, I.; Trujillo, C. Simultaneous Hydrogen Bonds with Different Binding Modes: The Acceptor “Rules” but the Donor “Chooses”. Chem. A Eur. J. 2023, 29, e202300717. [Google Scholar] [CrossRef]
- Etter, M.C. Encoding and Decoding Hydrogen-Bond Patterns of Organic Compounds. Acc. Chem. Res. 1990, 23, 120–126. [Google Scholar] [CrossRef]
- Gatti, C. Chemical Bonding in Crystals: New Directions. Z. Krist. Cryst. Mater. 2005, 220, 399–457. [Google Scholar] [CrossRef]
- Vener, M.V.; Churakov, A.V.; Voronin, A.P.; Parashchuk, O.D.; Artobolevskii, S.V.; Alatortsev, O.A.; Makhrov, D.E.; Medvedev, A.G.; Filarowski, A. Comparison of Proton Acceptor and Proton Donor Properties of H2O and H2O2 in Organic Crystals of Drug-like Compounds: Peroxosolvates vs. Crystallohydrates. Molecules 2022, 27, 717. [Google Scholar] [CrossRef] [PubMed]
- Desiraju, G.R.; Gavezzotti, A. Crystal Structures of Polynuclear Aromatic Hydrocarbons. Classification, Rationalization and Prediction from Molecular Structure. Acta Crystallogr. Sect. B 1989, 45, 473–482. [Google Scholar] [CrossRef]
- Burger, A.; Ramberger, R. On the Polymorphism of Pharmaceuticals and Other Molecular Crystals. II. Microchim. Acta 1979, 72, 273–316. [Google Scholar] [CrossRef]
- Perlovich, G.; Surov, A. Polymorphism of Monotropic Forms: Relationships between Thermochemical and Structural Characteristics. Acta Crystallogr. Sect. B 2020, 76, 65–75. [Google Scholar] [CrossRef] [PubMed]
- Civiš, S.; Lamanec, M.; Špirko, V.; Kubišta, J.; Špet’ko, M.; Hobza, P. Hydrogen Bonding with Hydridic Hydrogen–Experimental Low-Temperature IR and Computational Study: Is a Revised Definition of Hydrogen Bonding Appropriate? J. Am. Chem. Soc. 2023, 145, 8550–8559. [Google Scholar] [CrossRef] [PubMed]
- Wang, H.; Xiao, H.; Liu, N.; Zhang, B.; Shi, Q. Three New Compounds Derived from Nitrofurantoin: X-ray Structures and Hirshfeld Surface Analyses. Open J. Inorg. Chem. 2015, 5, 63–73. [Google Scholar] [CrossRef]


Disclaimer/Publisher’s Note: The statements, opinions and data contained in all publications are solely those of the individual author(s) and contributor(s) and not of MDPI and/or the editor(s). MDPI and/or the editor(s) disclaim responsibility for any injury to people or property resulting from any ideas, methods, instructions or products referred to in the content. |
© 2023 by the authors. Licensee MDPI, Basel, Switzerland. This article is an open access article distributed under the terms and conditions of the Creative Commons Attribution (CC BY) license (https://creativecommons.org/licenses/by/4.0/).