
Thermal Fatigue Crack Propagation Process and Mechanism of Multicomponent Al-7Si-0.3Mg Alloy
Abstract
:1. Introduction
2. Materials and Methods
2.1. Materials
2.2. Methods
2.2.1. The Preparation of Each of Samples (A, B, C, and D)
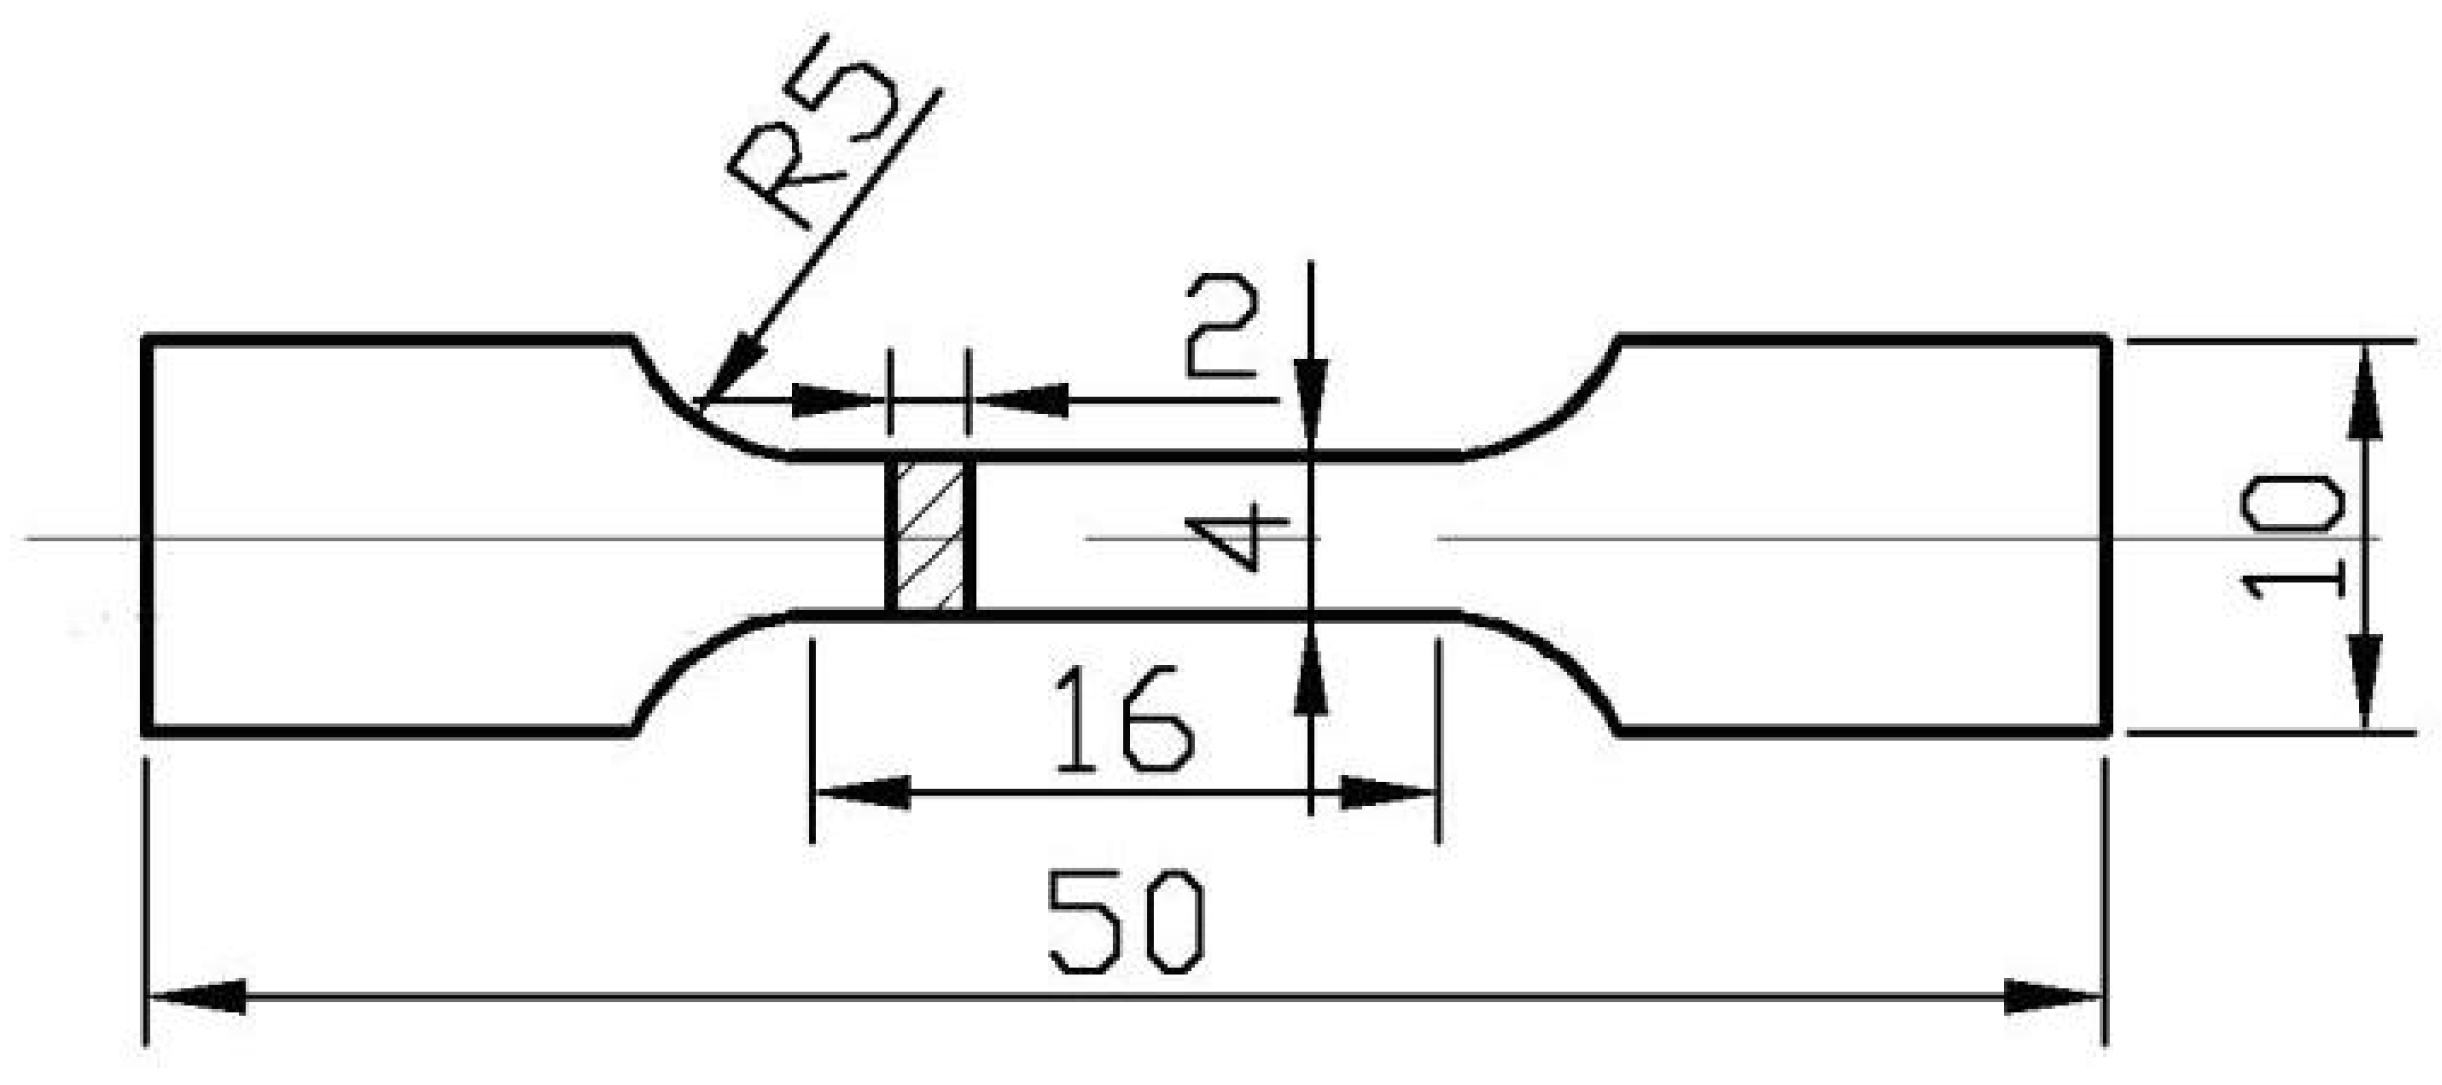
2.2.2. The Tensile Test
2.2.3. Hardness
2.2.4. Impact Toughness
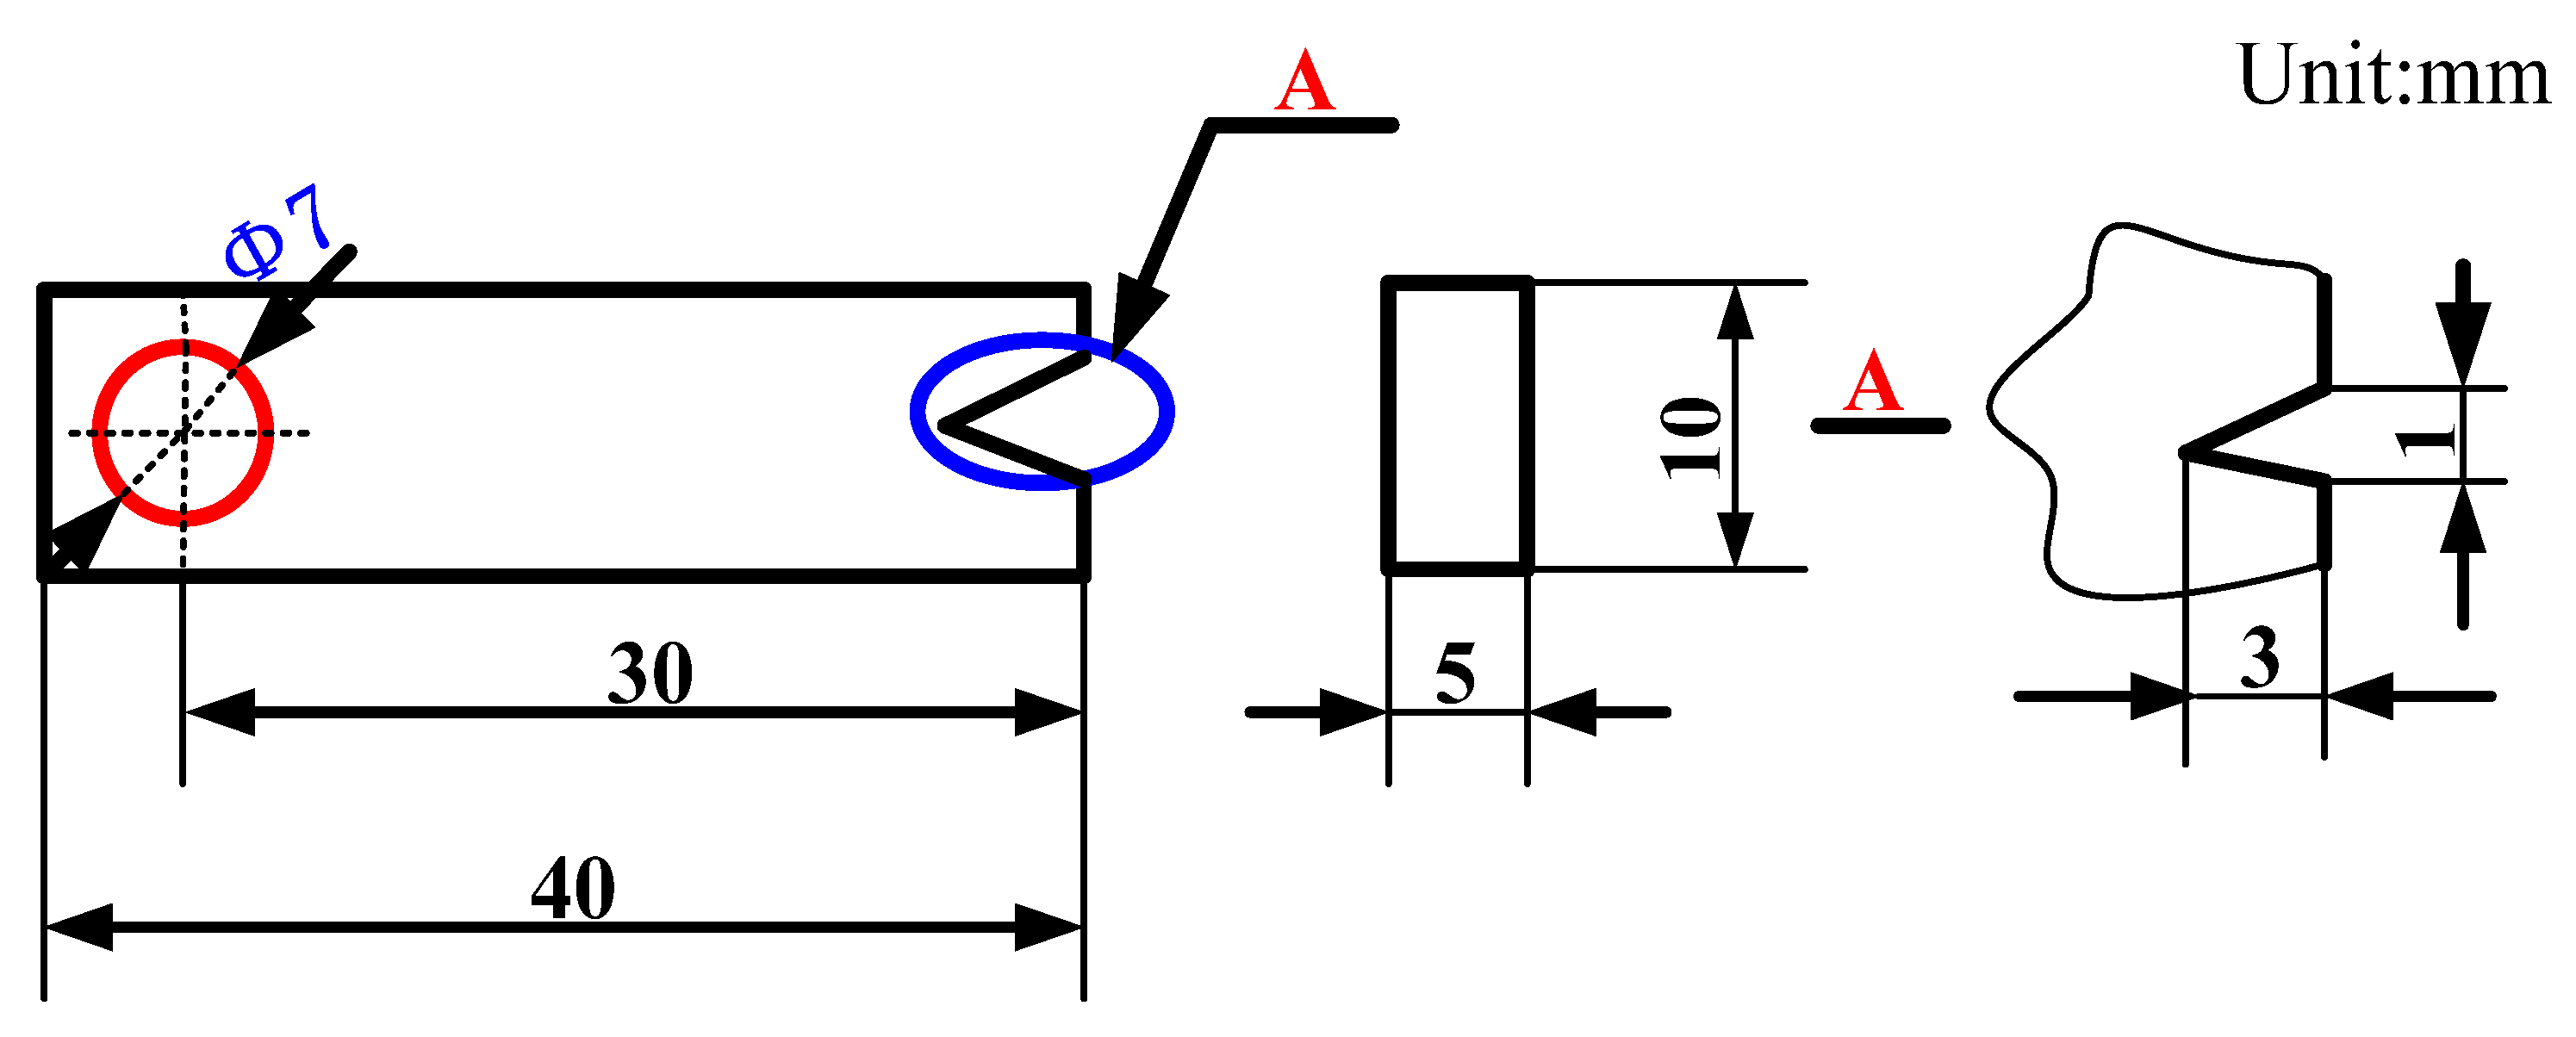
2.2.5. Thermal Fatigue Test
3. Results and Discussion
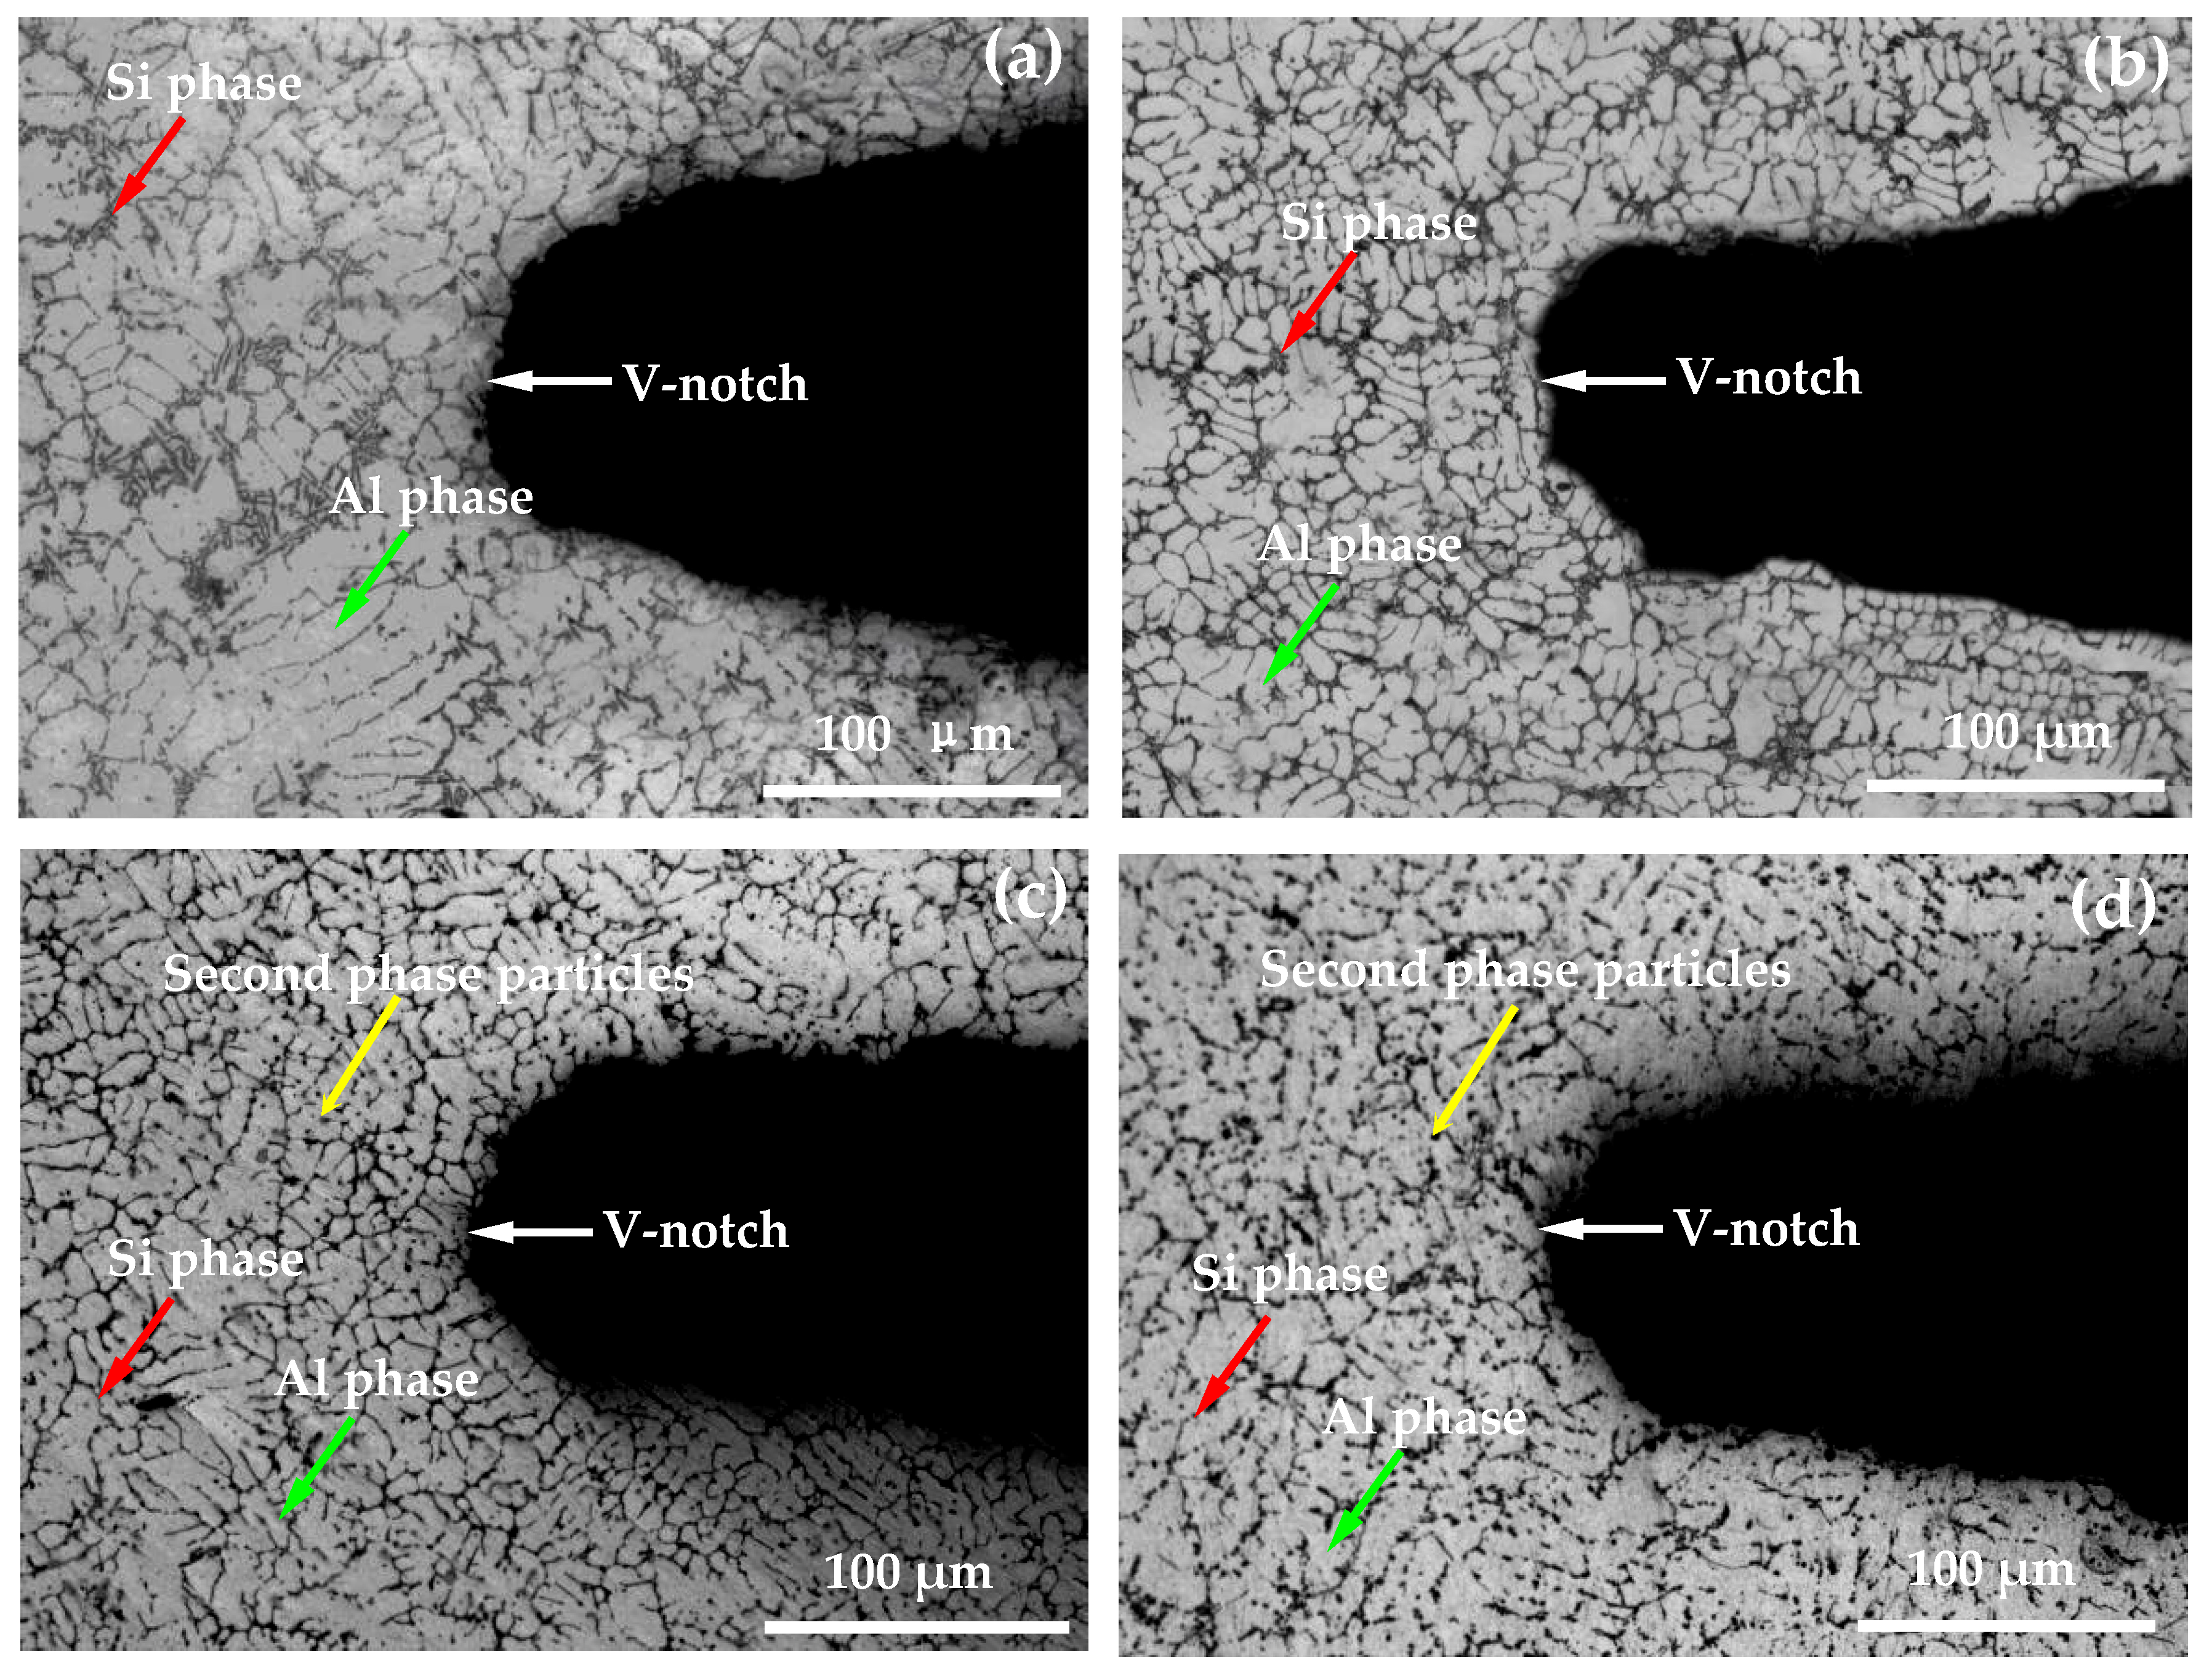
3.1. Analysis of Microstructure of Thermal Fatigue Specimens
3.2. Analysis of Mechanical Properties of Thermal Fatigue Specimens
3.3. Analysis of Thermal Fatigue Crack Growth Behavior
3.4. Morphology Analysis of Thermal Fatigue Crack Propagation
3.5. Influencing Factors of Thermal Fatigue Crack Propagation
3.5.1. Effect of Temperature Amplitude
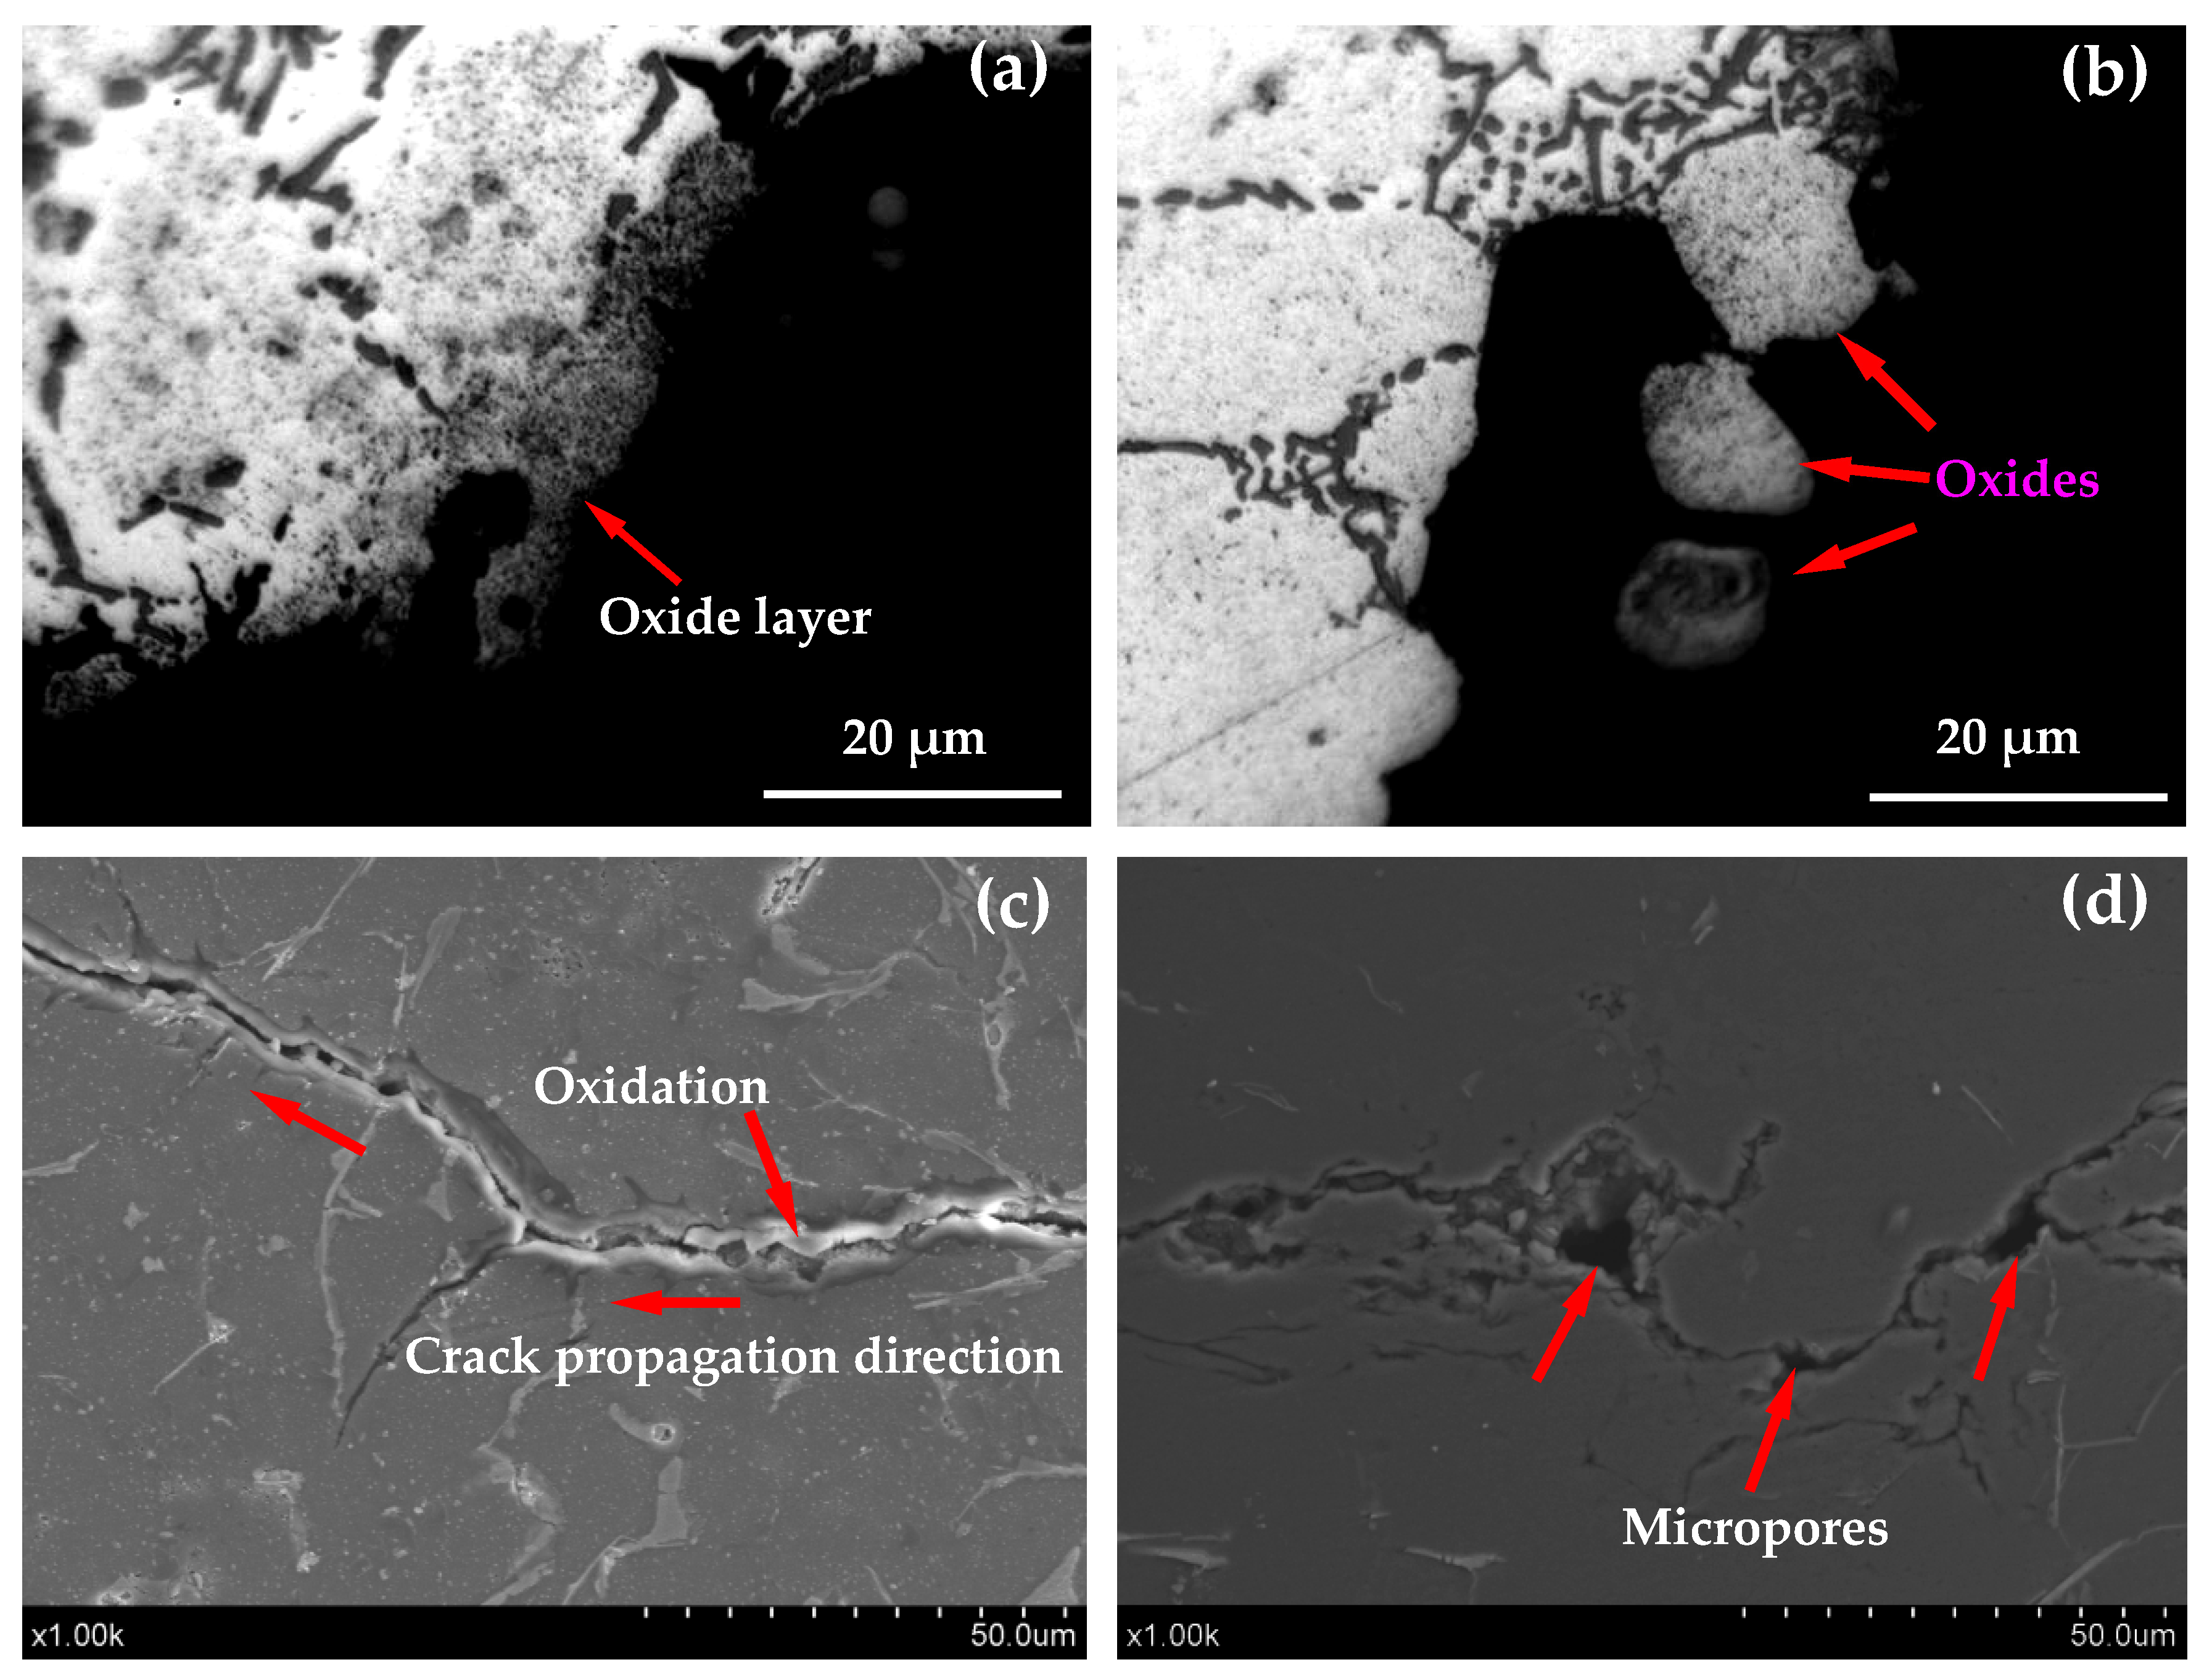
3.5.2. Effect of Oxidation
3.5.3. Effect of Residual Stress
3.6. Thermal Fatigue Crack Propagation Process and Mechanism
4. Conclusions
- (1)
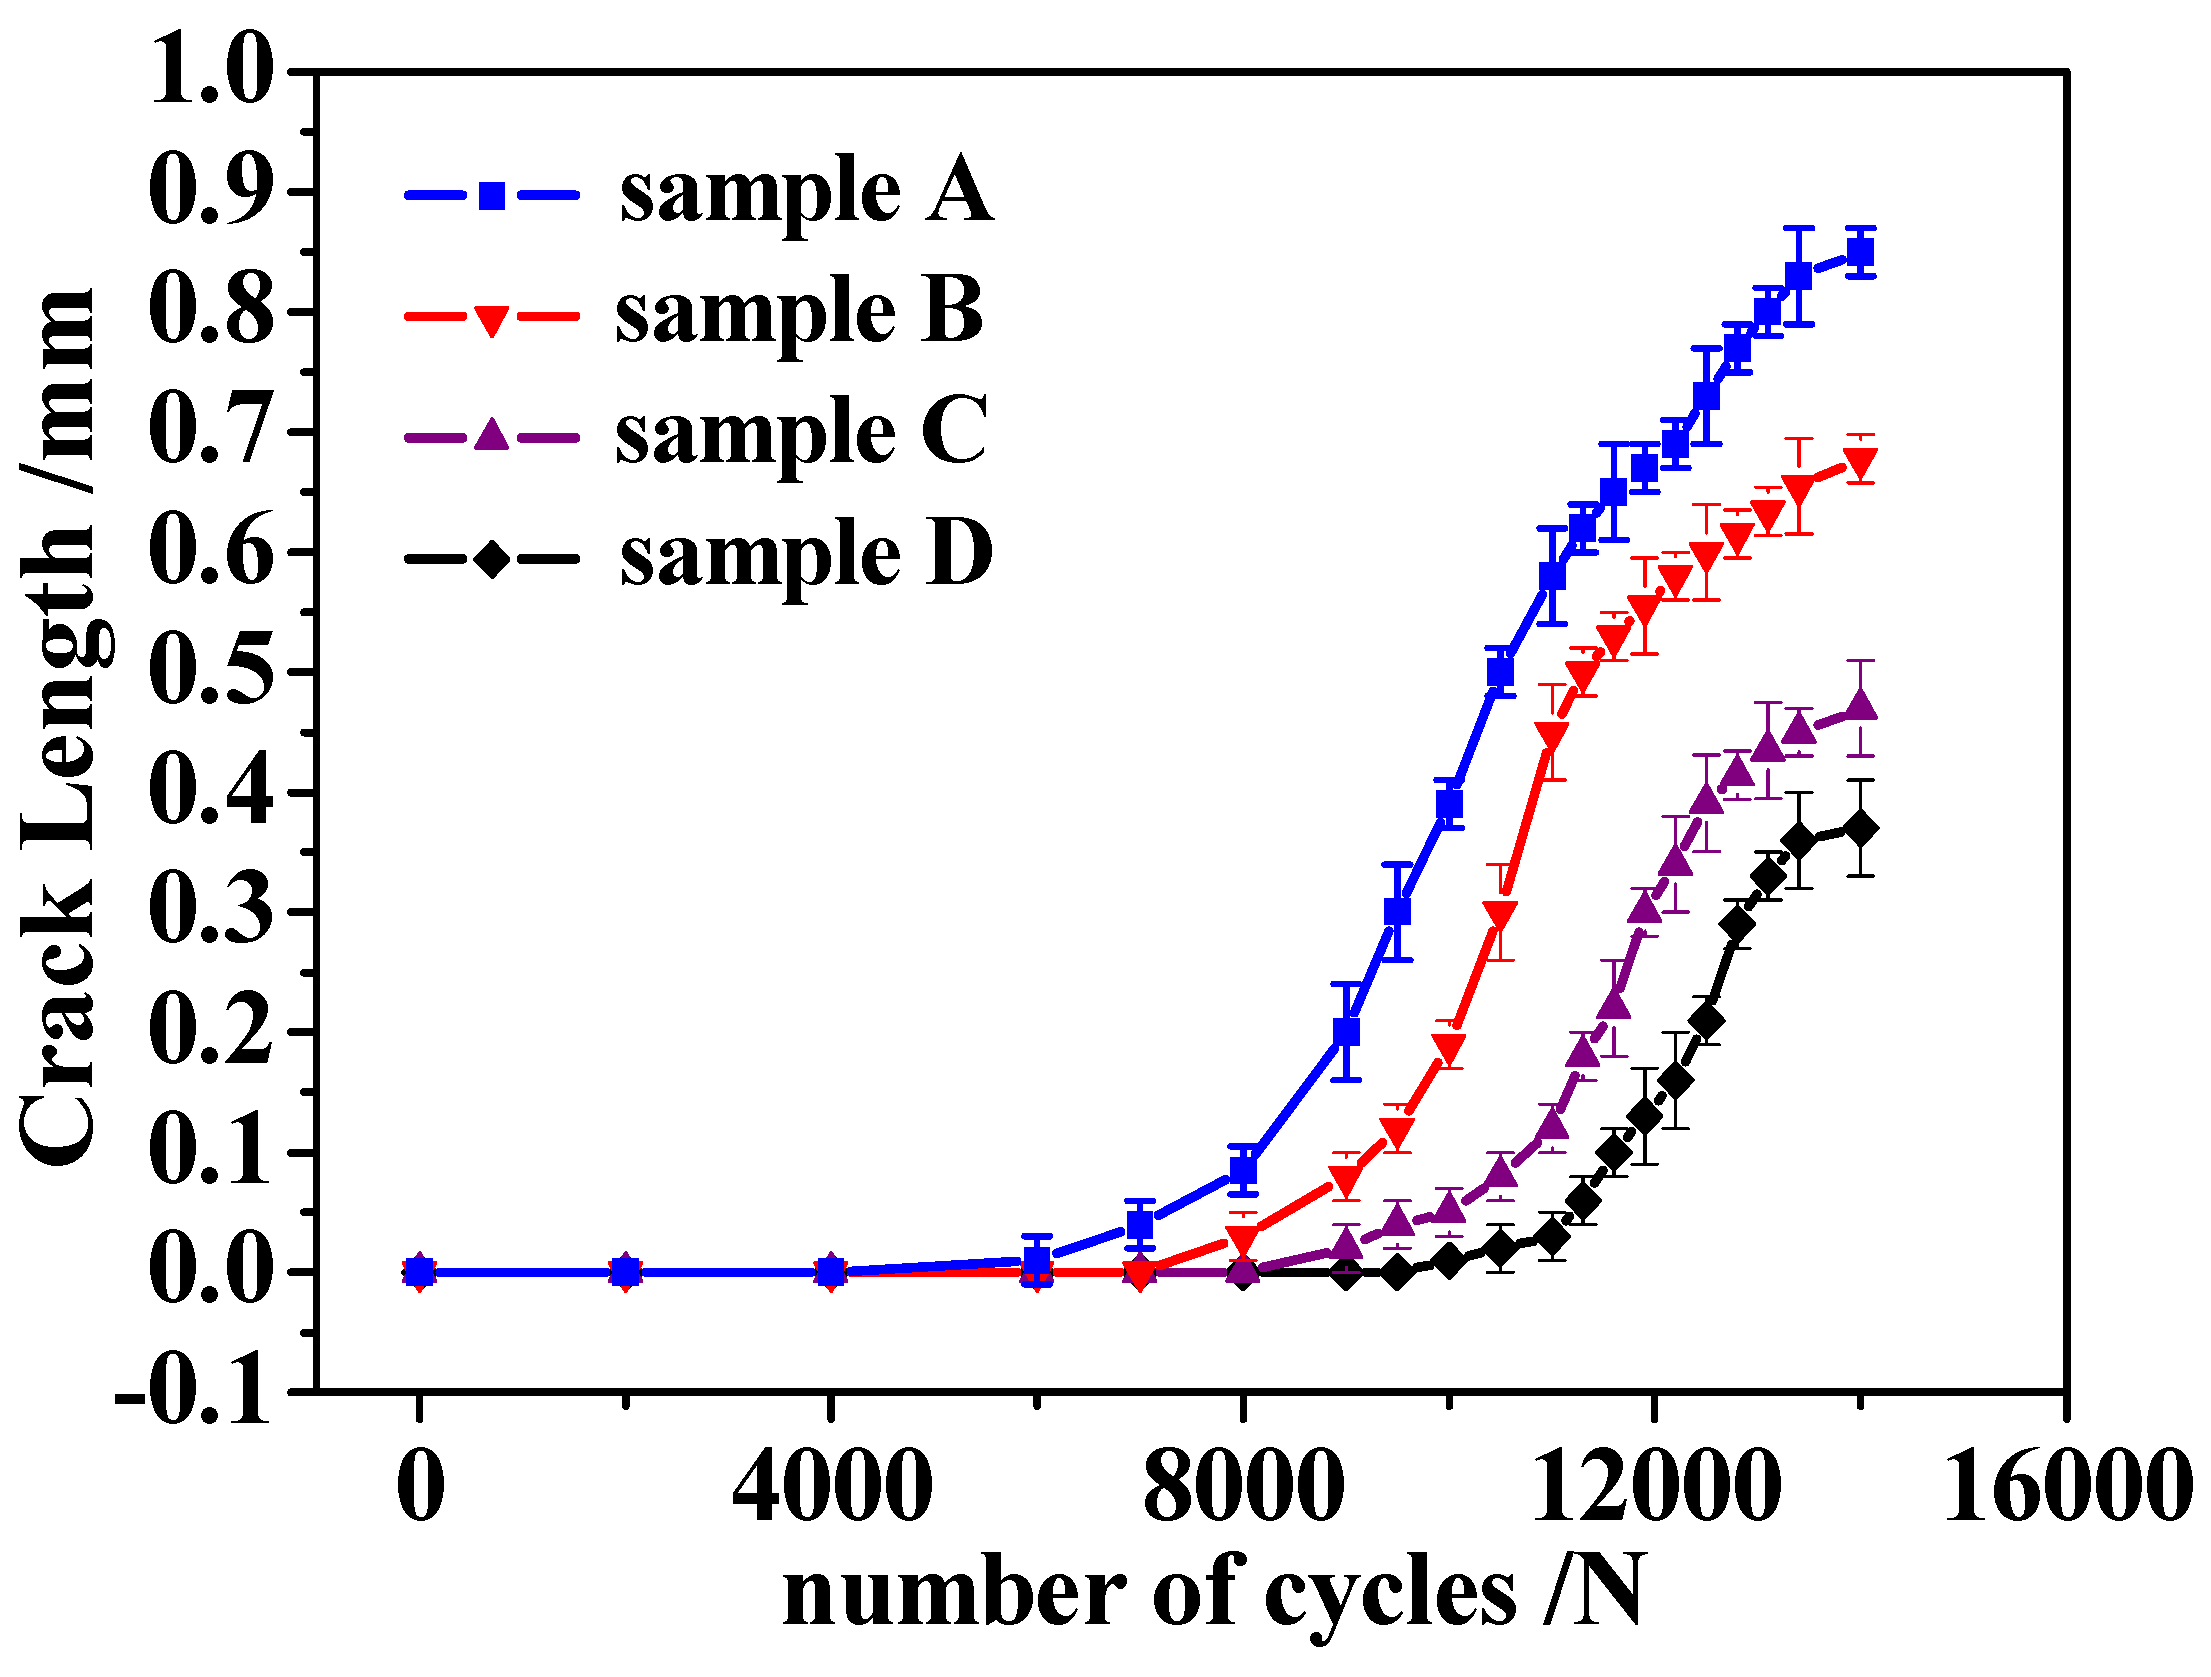
- When the temperature amplitude was 20 °C↔350 °C and the number of thermal cycles was N = 11,600 cycles, the crack of specimen A increases rapidly, the crack length reaches nearly 0.65 mm, and the crack length of specimen B is about 0.53 mm. At this time, the crack propagation of specimen C and specimen D was relatively short, and the crack length was about 0.22 mm and 0.10 mm, respectively, which had exceeded or reached the specified crack length of the surface of the specimen crack initiation a = 0.10 mm. The thermal fatigue resistance of C and D specimens was much higher than that of specimens in both A and B.
- (2)
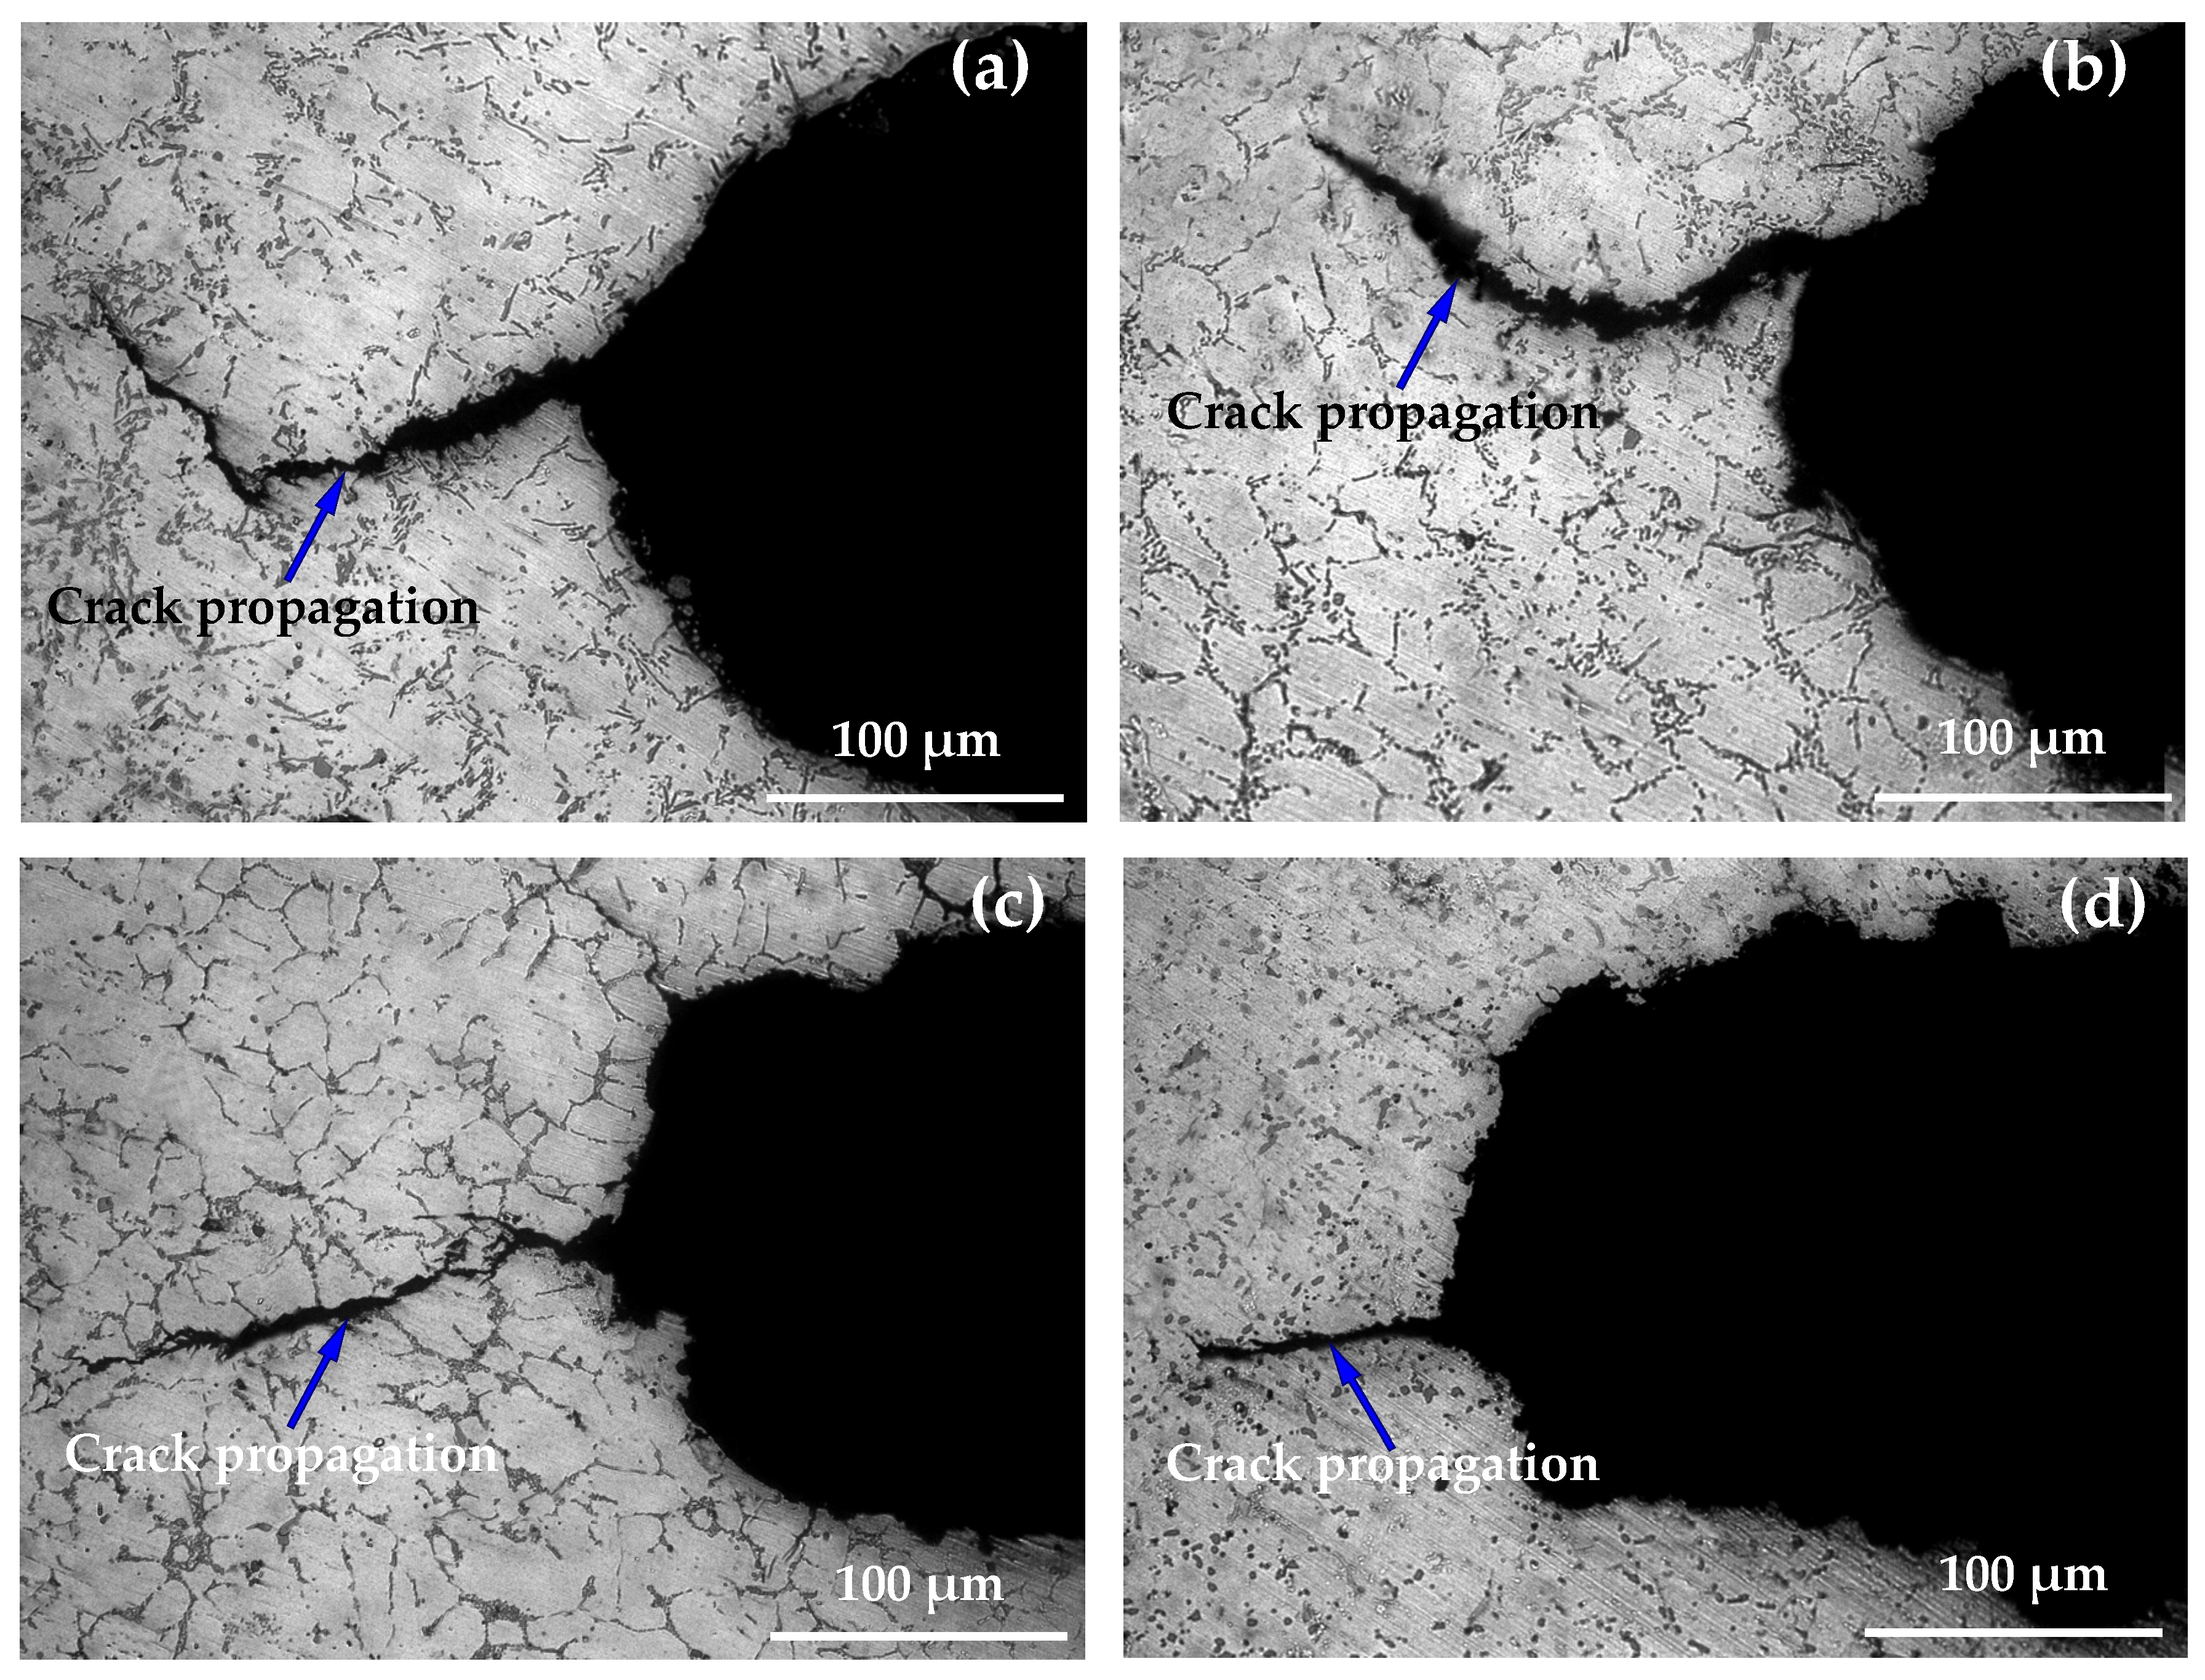
- When the number of thermal cycles N = 27,500 cycles, the crack propagation of specimen A had the highest curvature, the longest length, and the largest width and unevenness. The cracks of B, C, and D specimens were relatively straight and fine, especially specimen D, which had the smallest length and narrowest width. Good microstructure and suitable heat treatment process can significantly improve the thermal fatigue resistance of the alloy and reduce crack propagation.
- (3)
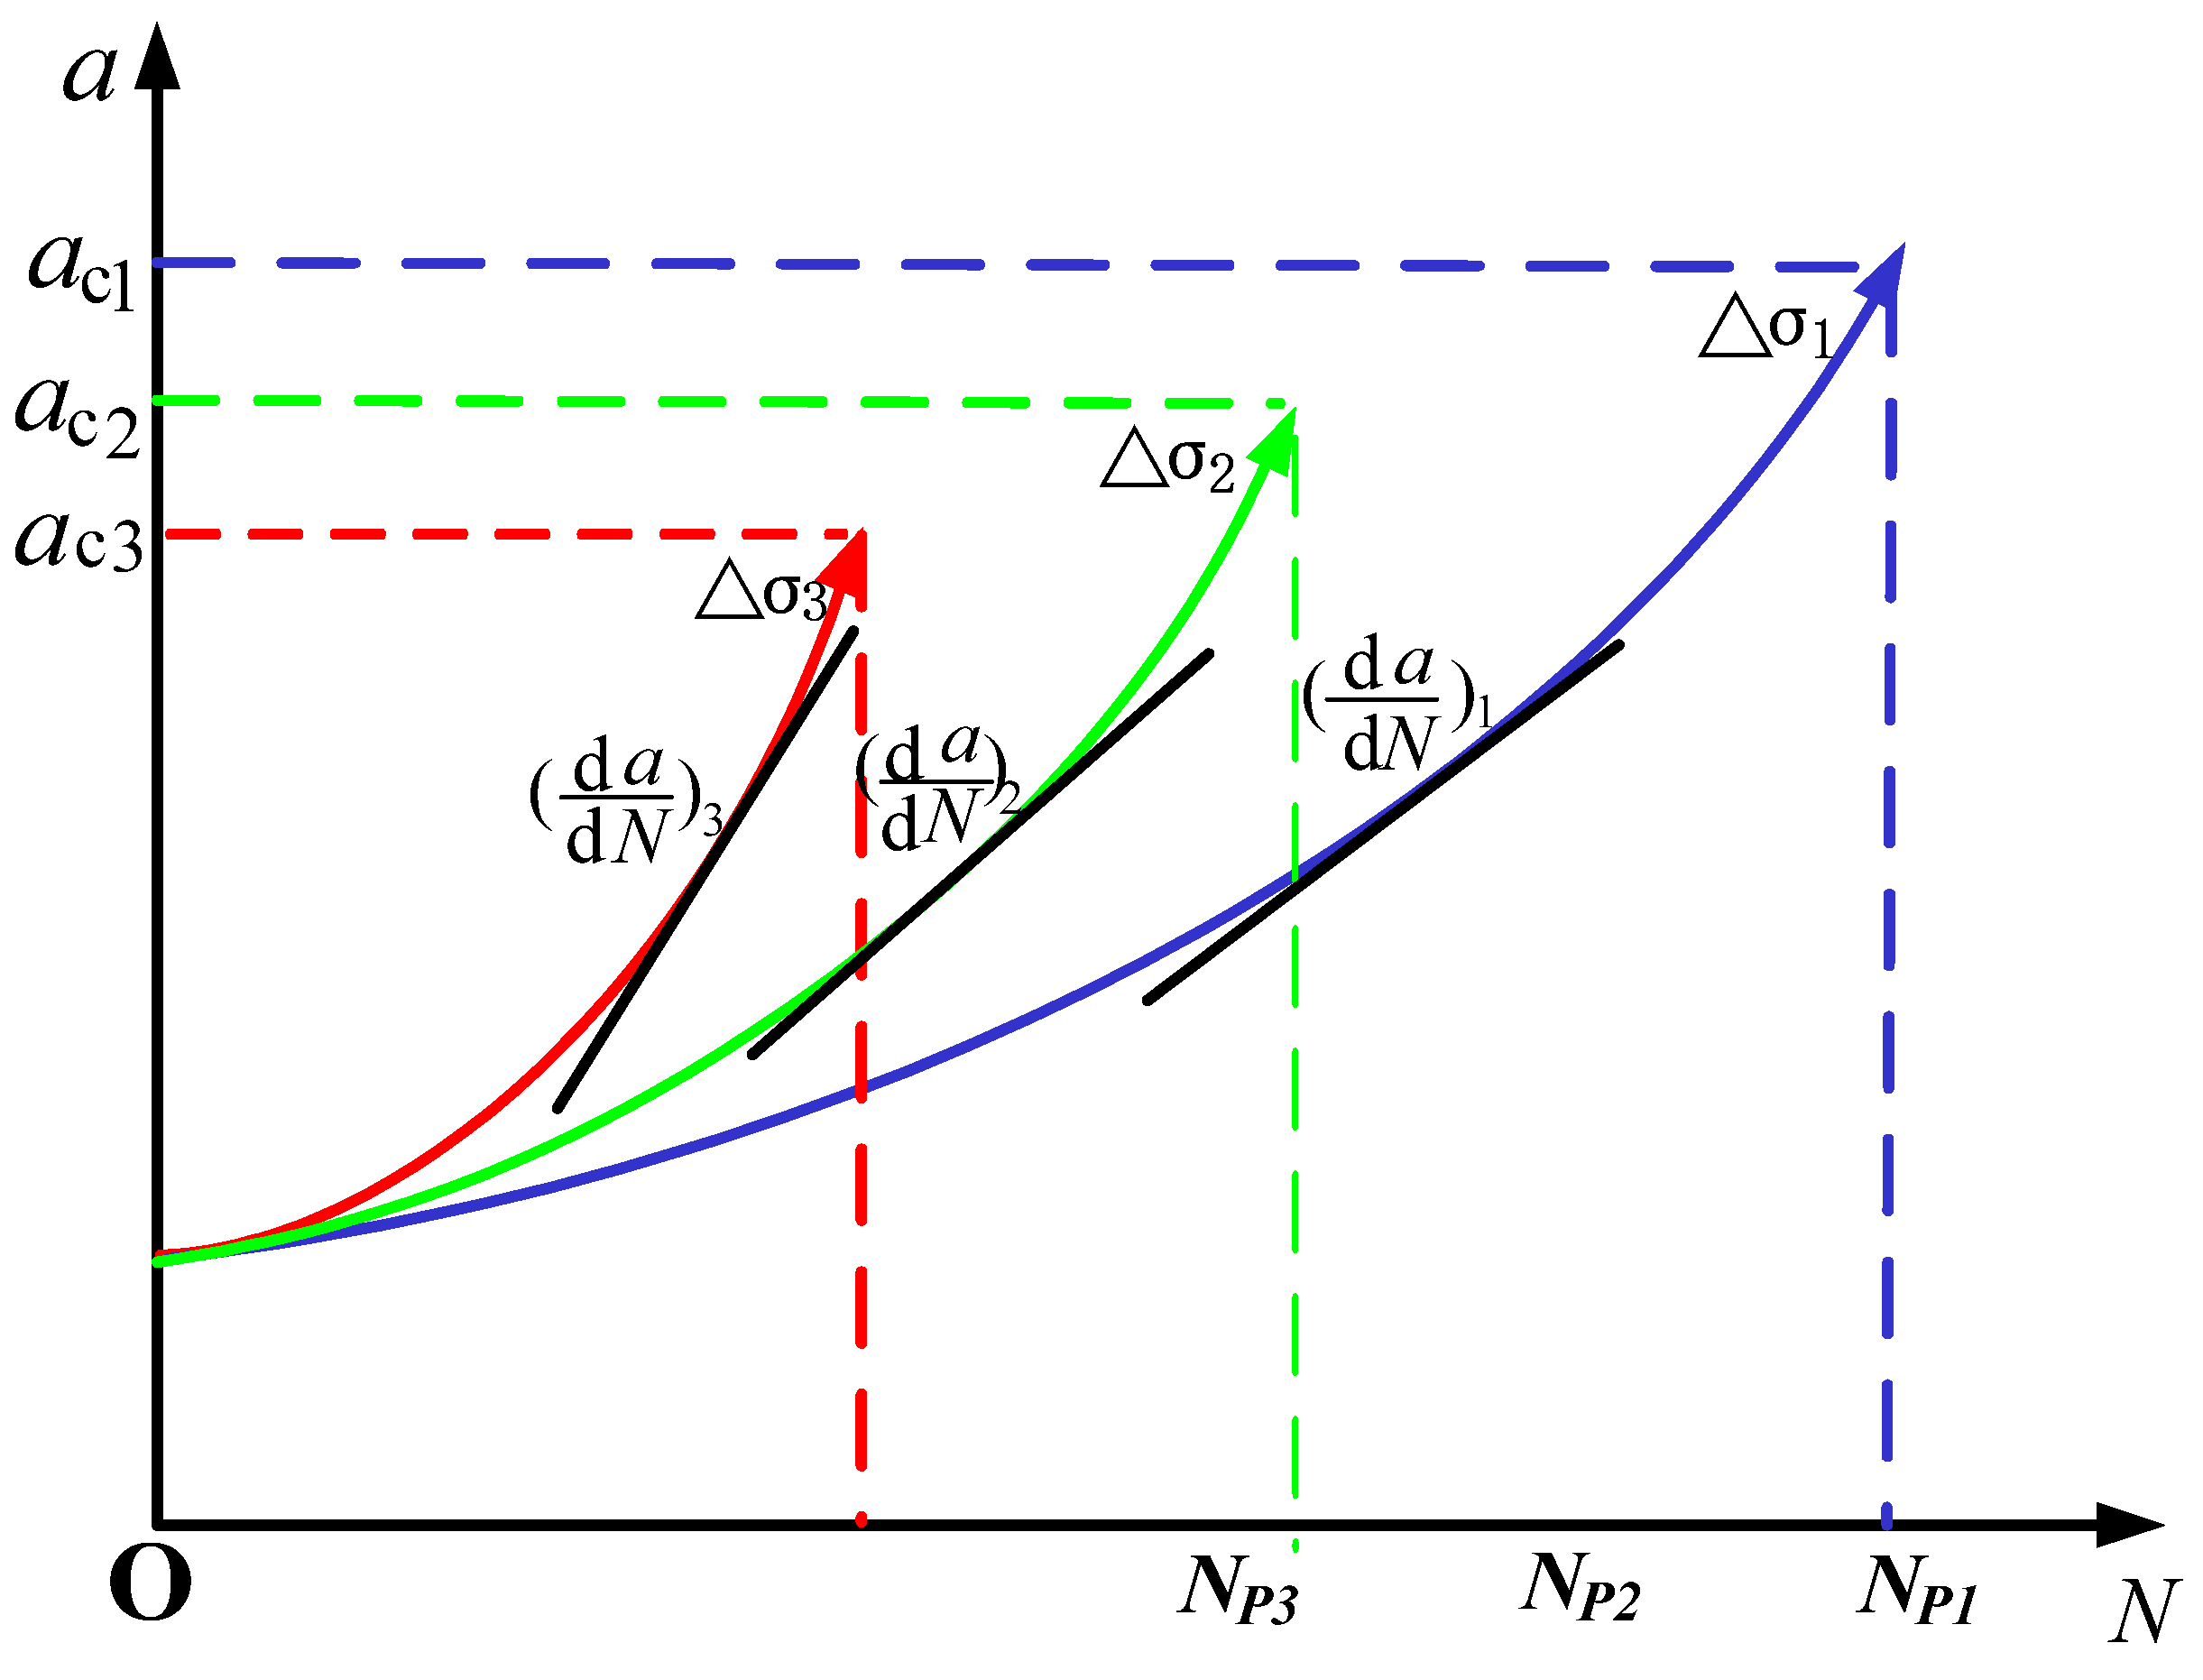
- Under the same lower limit temperature, increasing the upper limit temperature can make the thermal fatigue specimens reach the critical crack propagation size in a shorter cycle, resulting in thermal fatigue crack instability propagation.
- (4)
- With the increase of the number of heating cycles, the oxidation corrosion of the thermal fatigue specimen also increases. The oxide will fall off under the thermal stress on the surface of the specimen, forming a “bridging” phenomenon.
- (5)
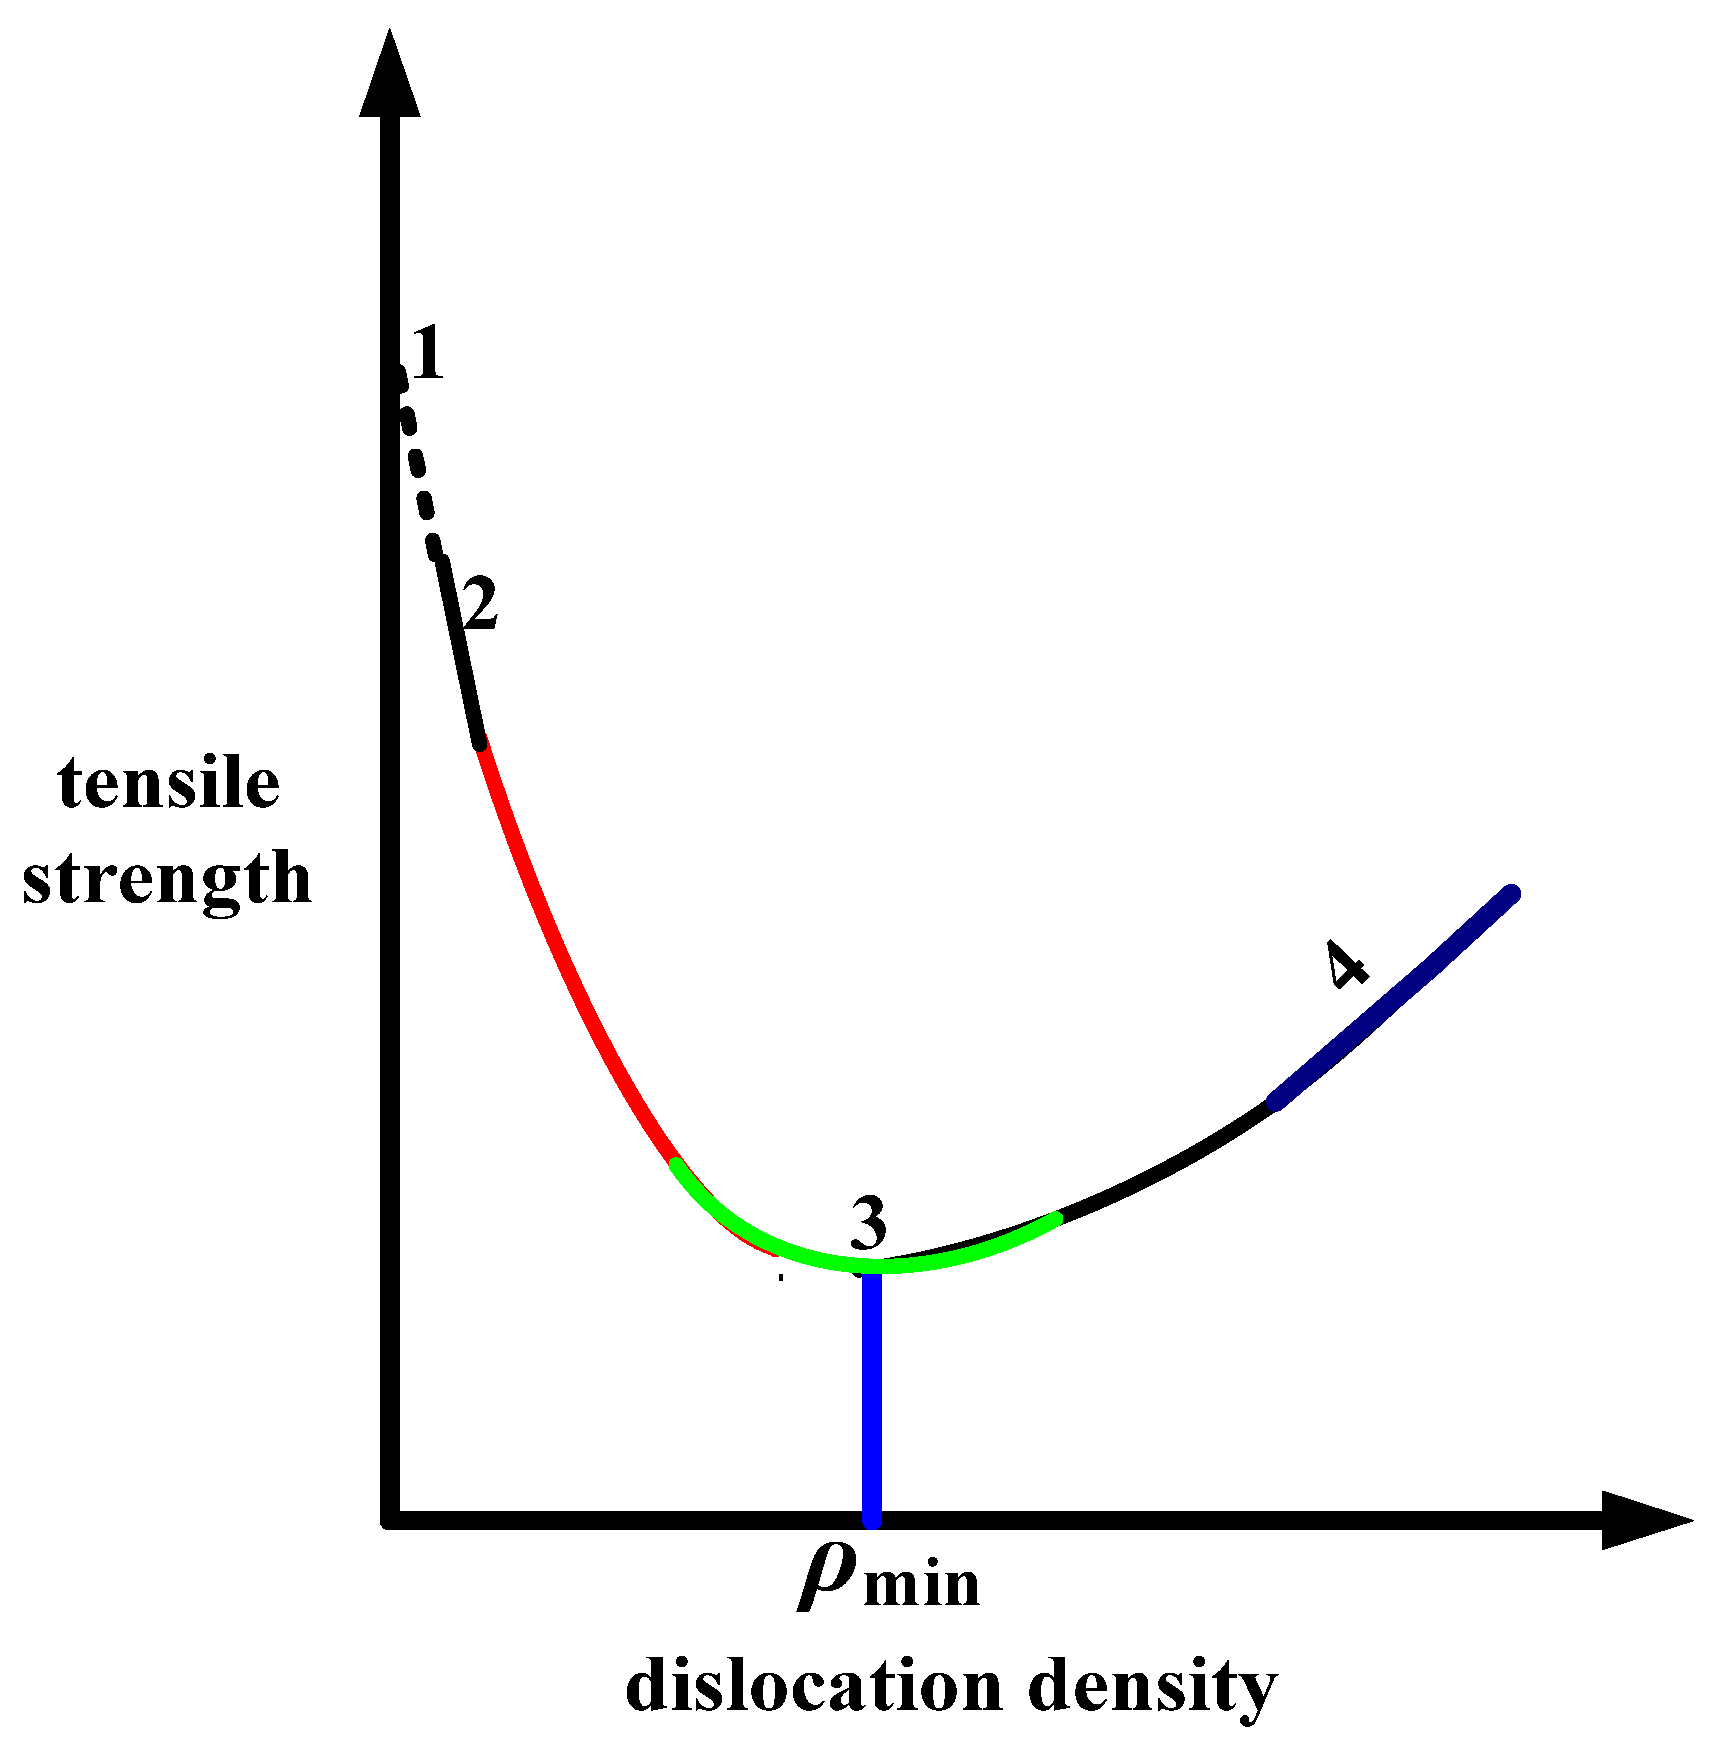
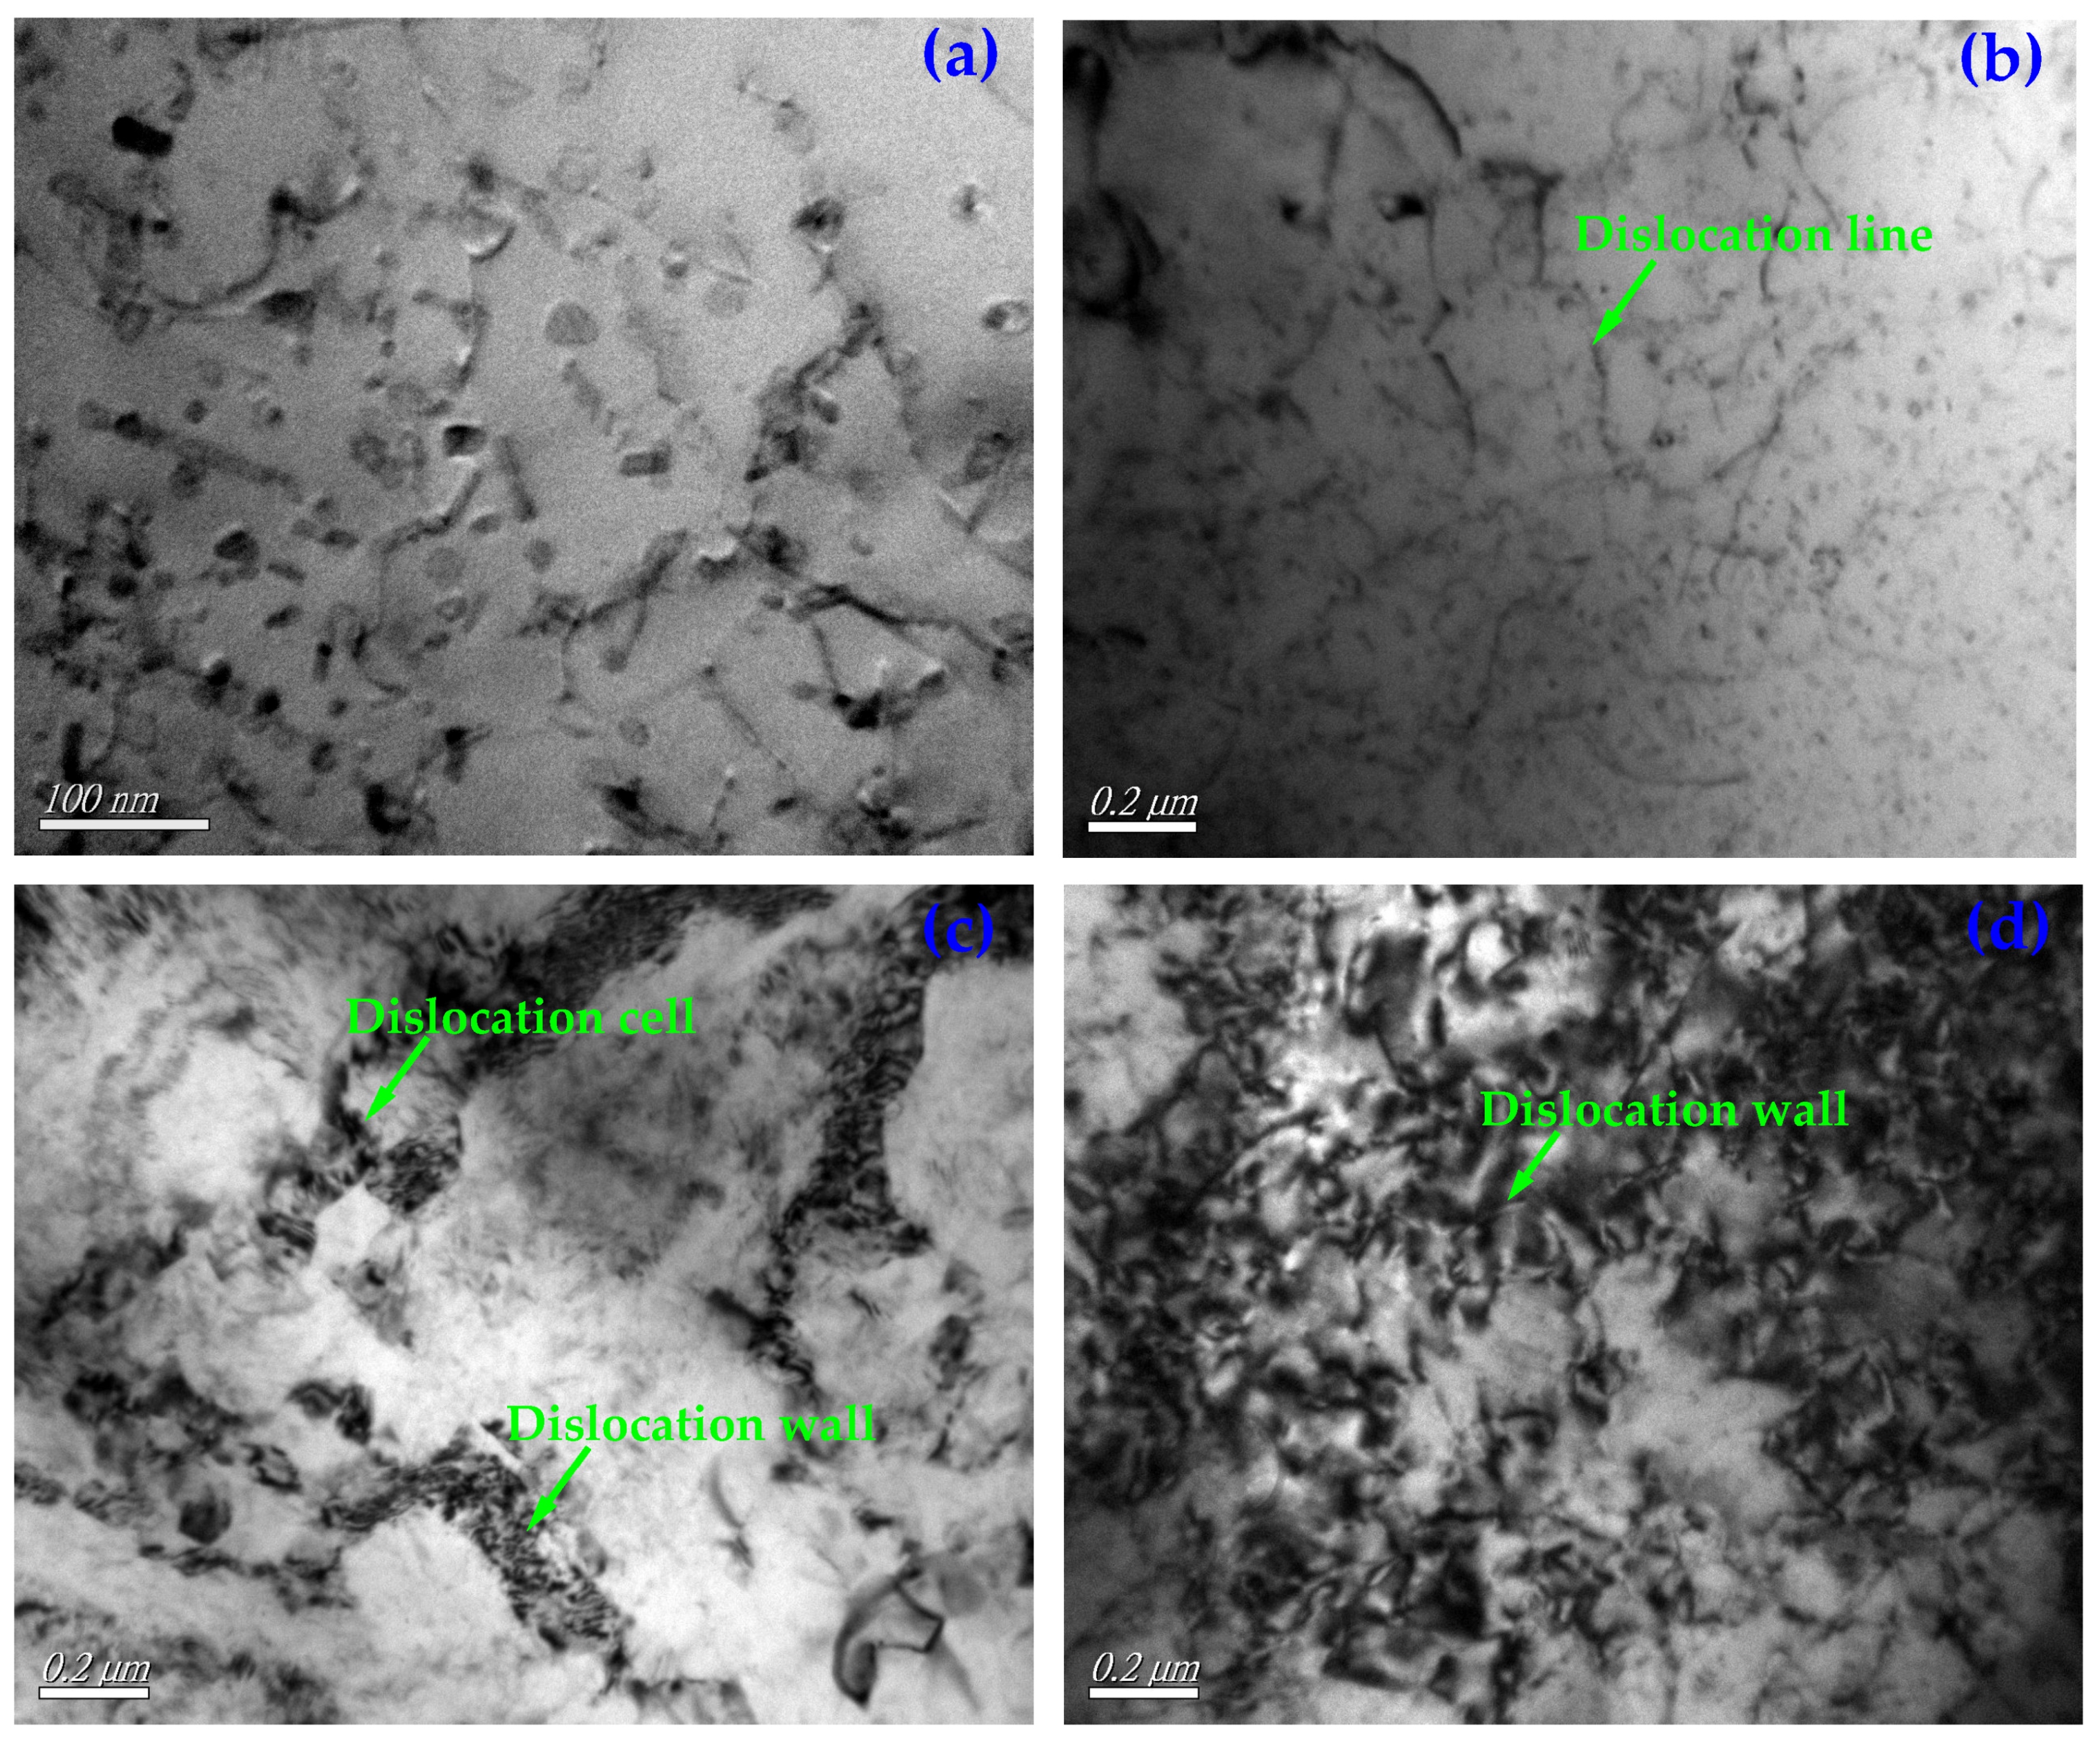
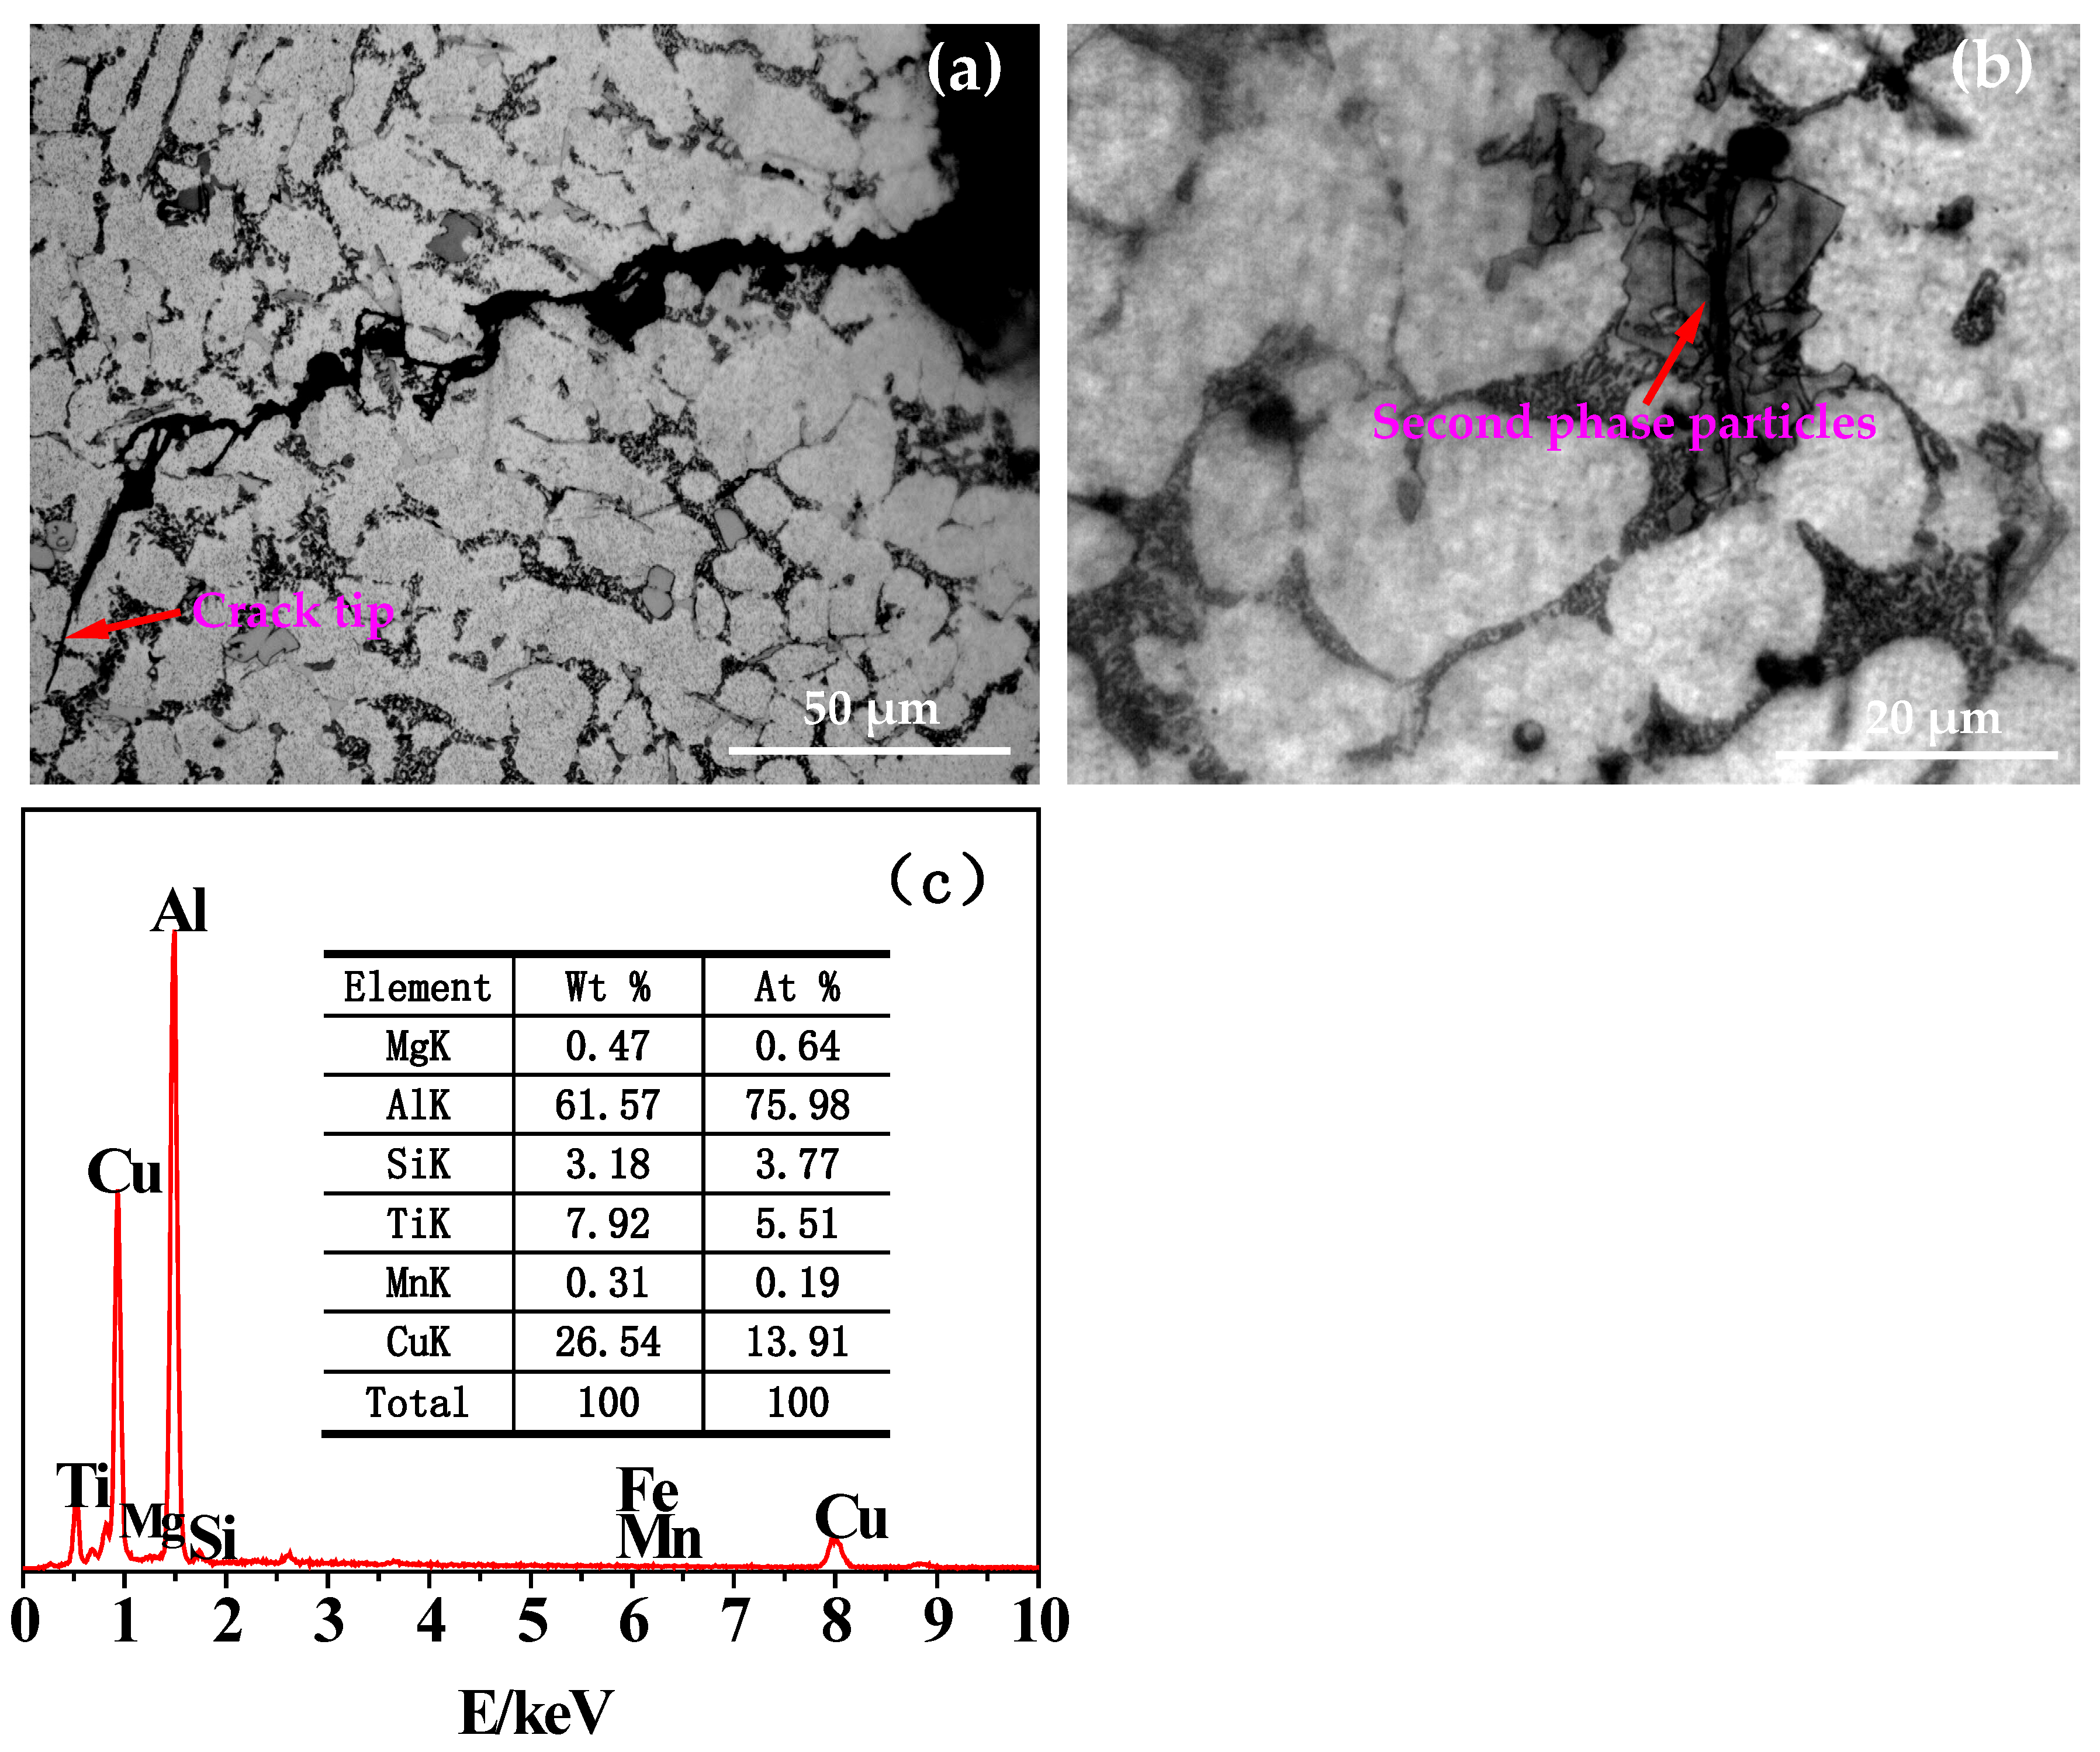
- With the increase of the number of thermal cycles, the plastic deformation of the thermal fatigue specimen accumulated continuously. The sliding occurred along the crystal plane with the highest atomic density (closely arranged plane) and the crystal direction with the highest density above it (closely arranged direction), resulting in great stress concentration and damage to the crack core, growth. Some silicon phases, second phases, or inclusion particles (mainly including Al2Cu, AlSiTiCu, etc.) in the thermal fatigue specimen broke under the action of thermal stress, generating microcracks inside and absorbing the driving force required for the propagation of some main cracks.
- (6)
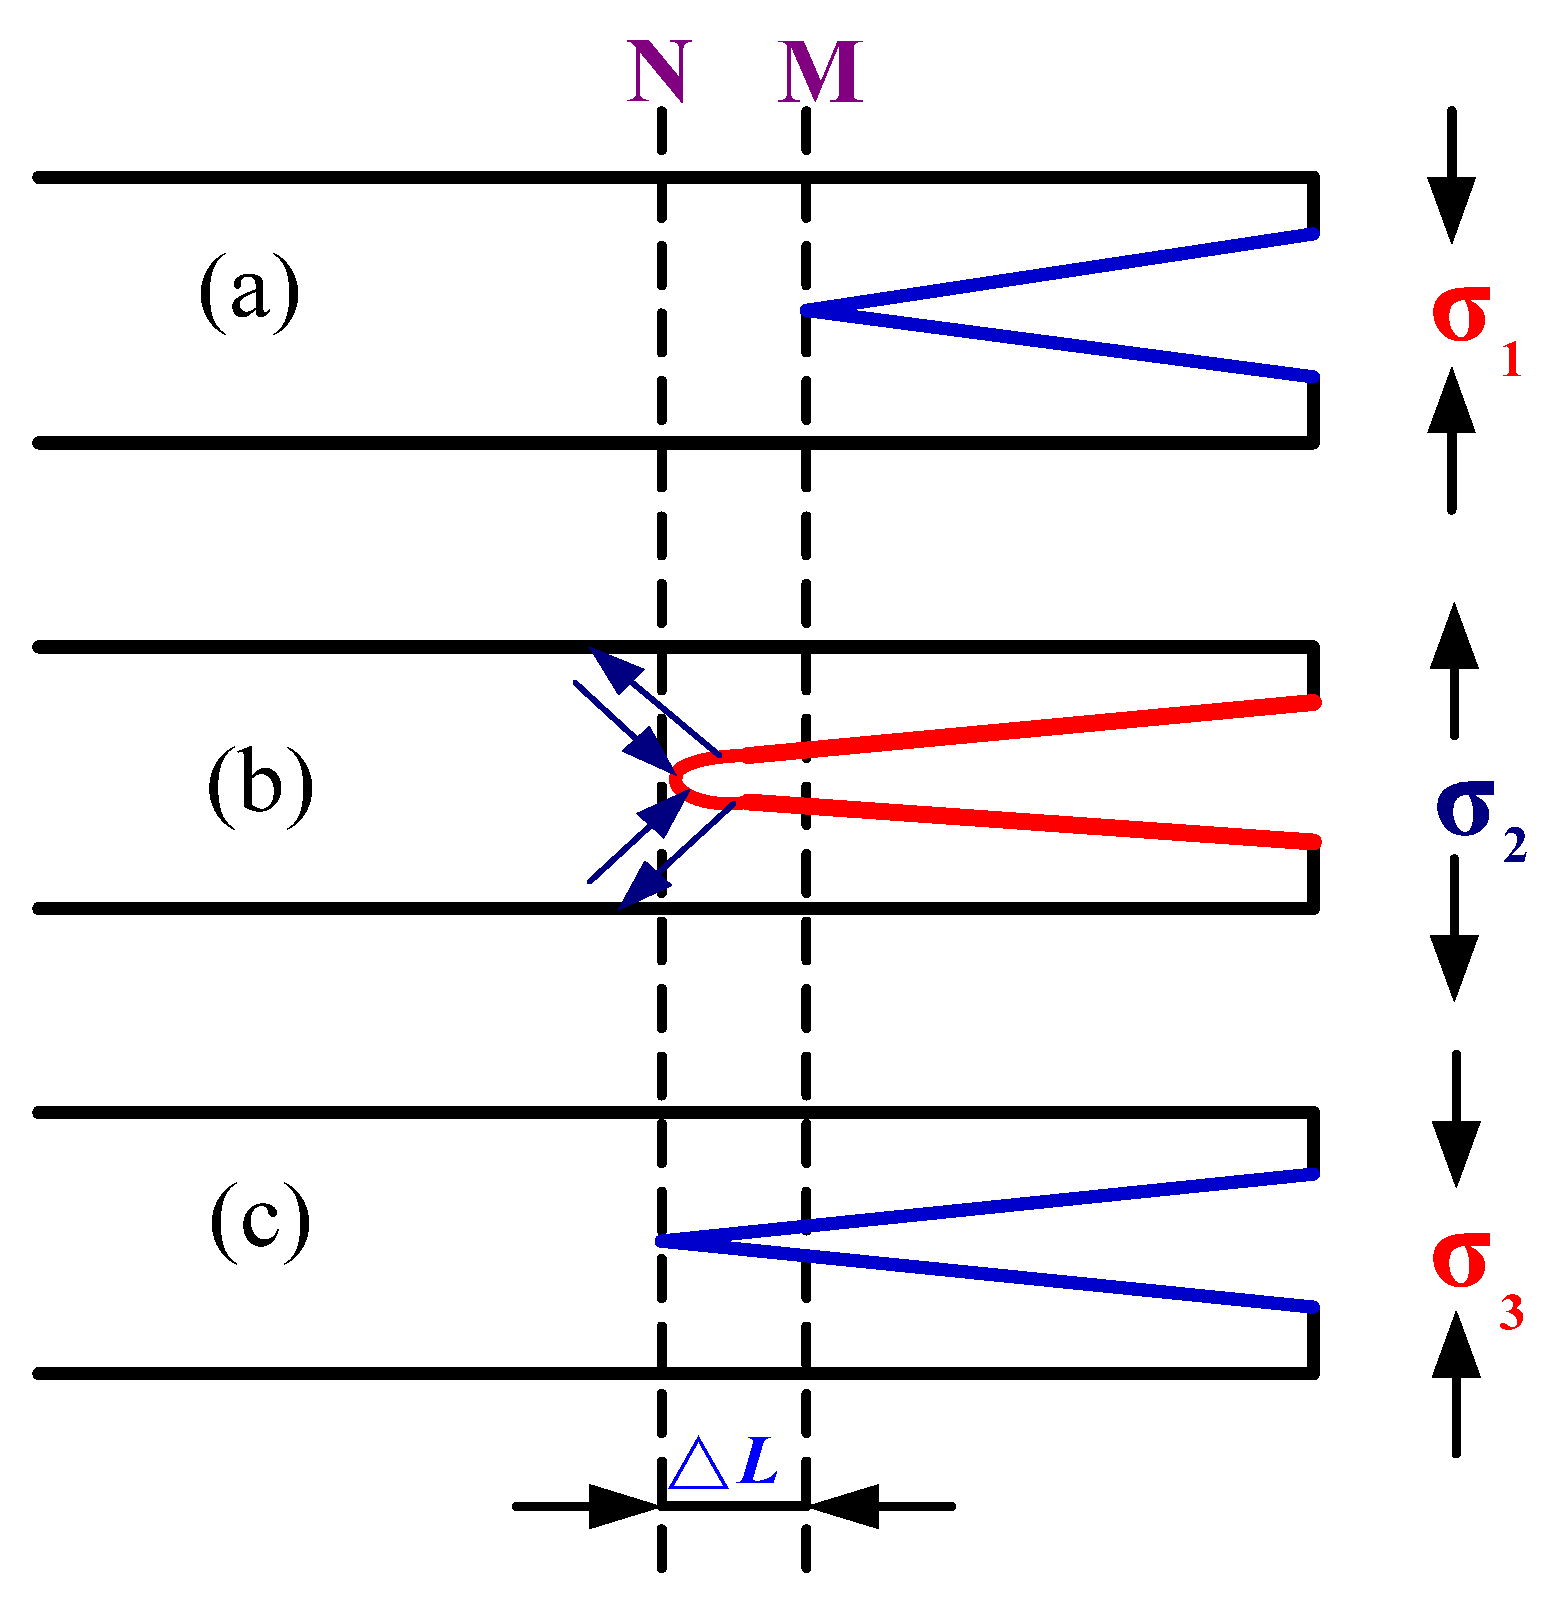
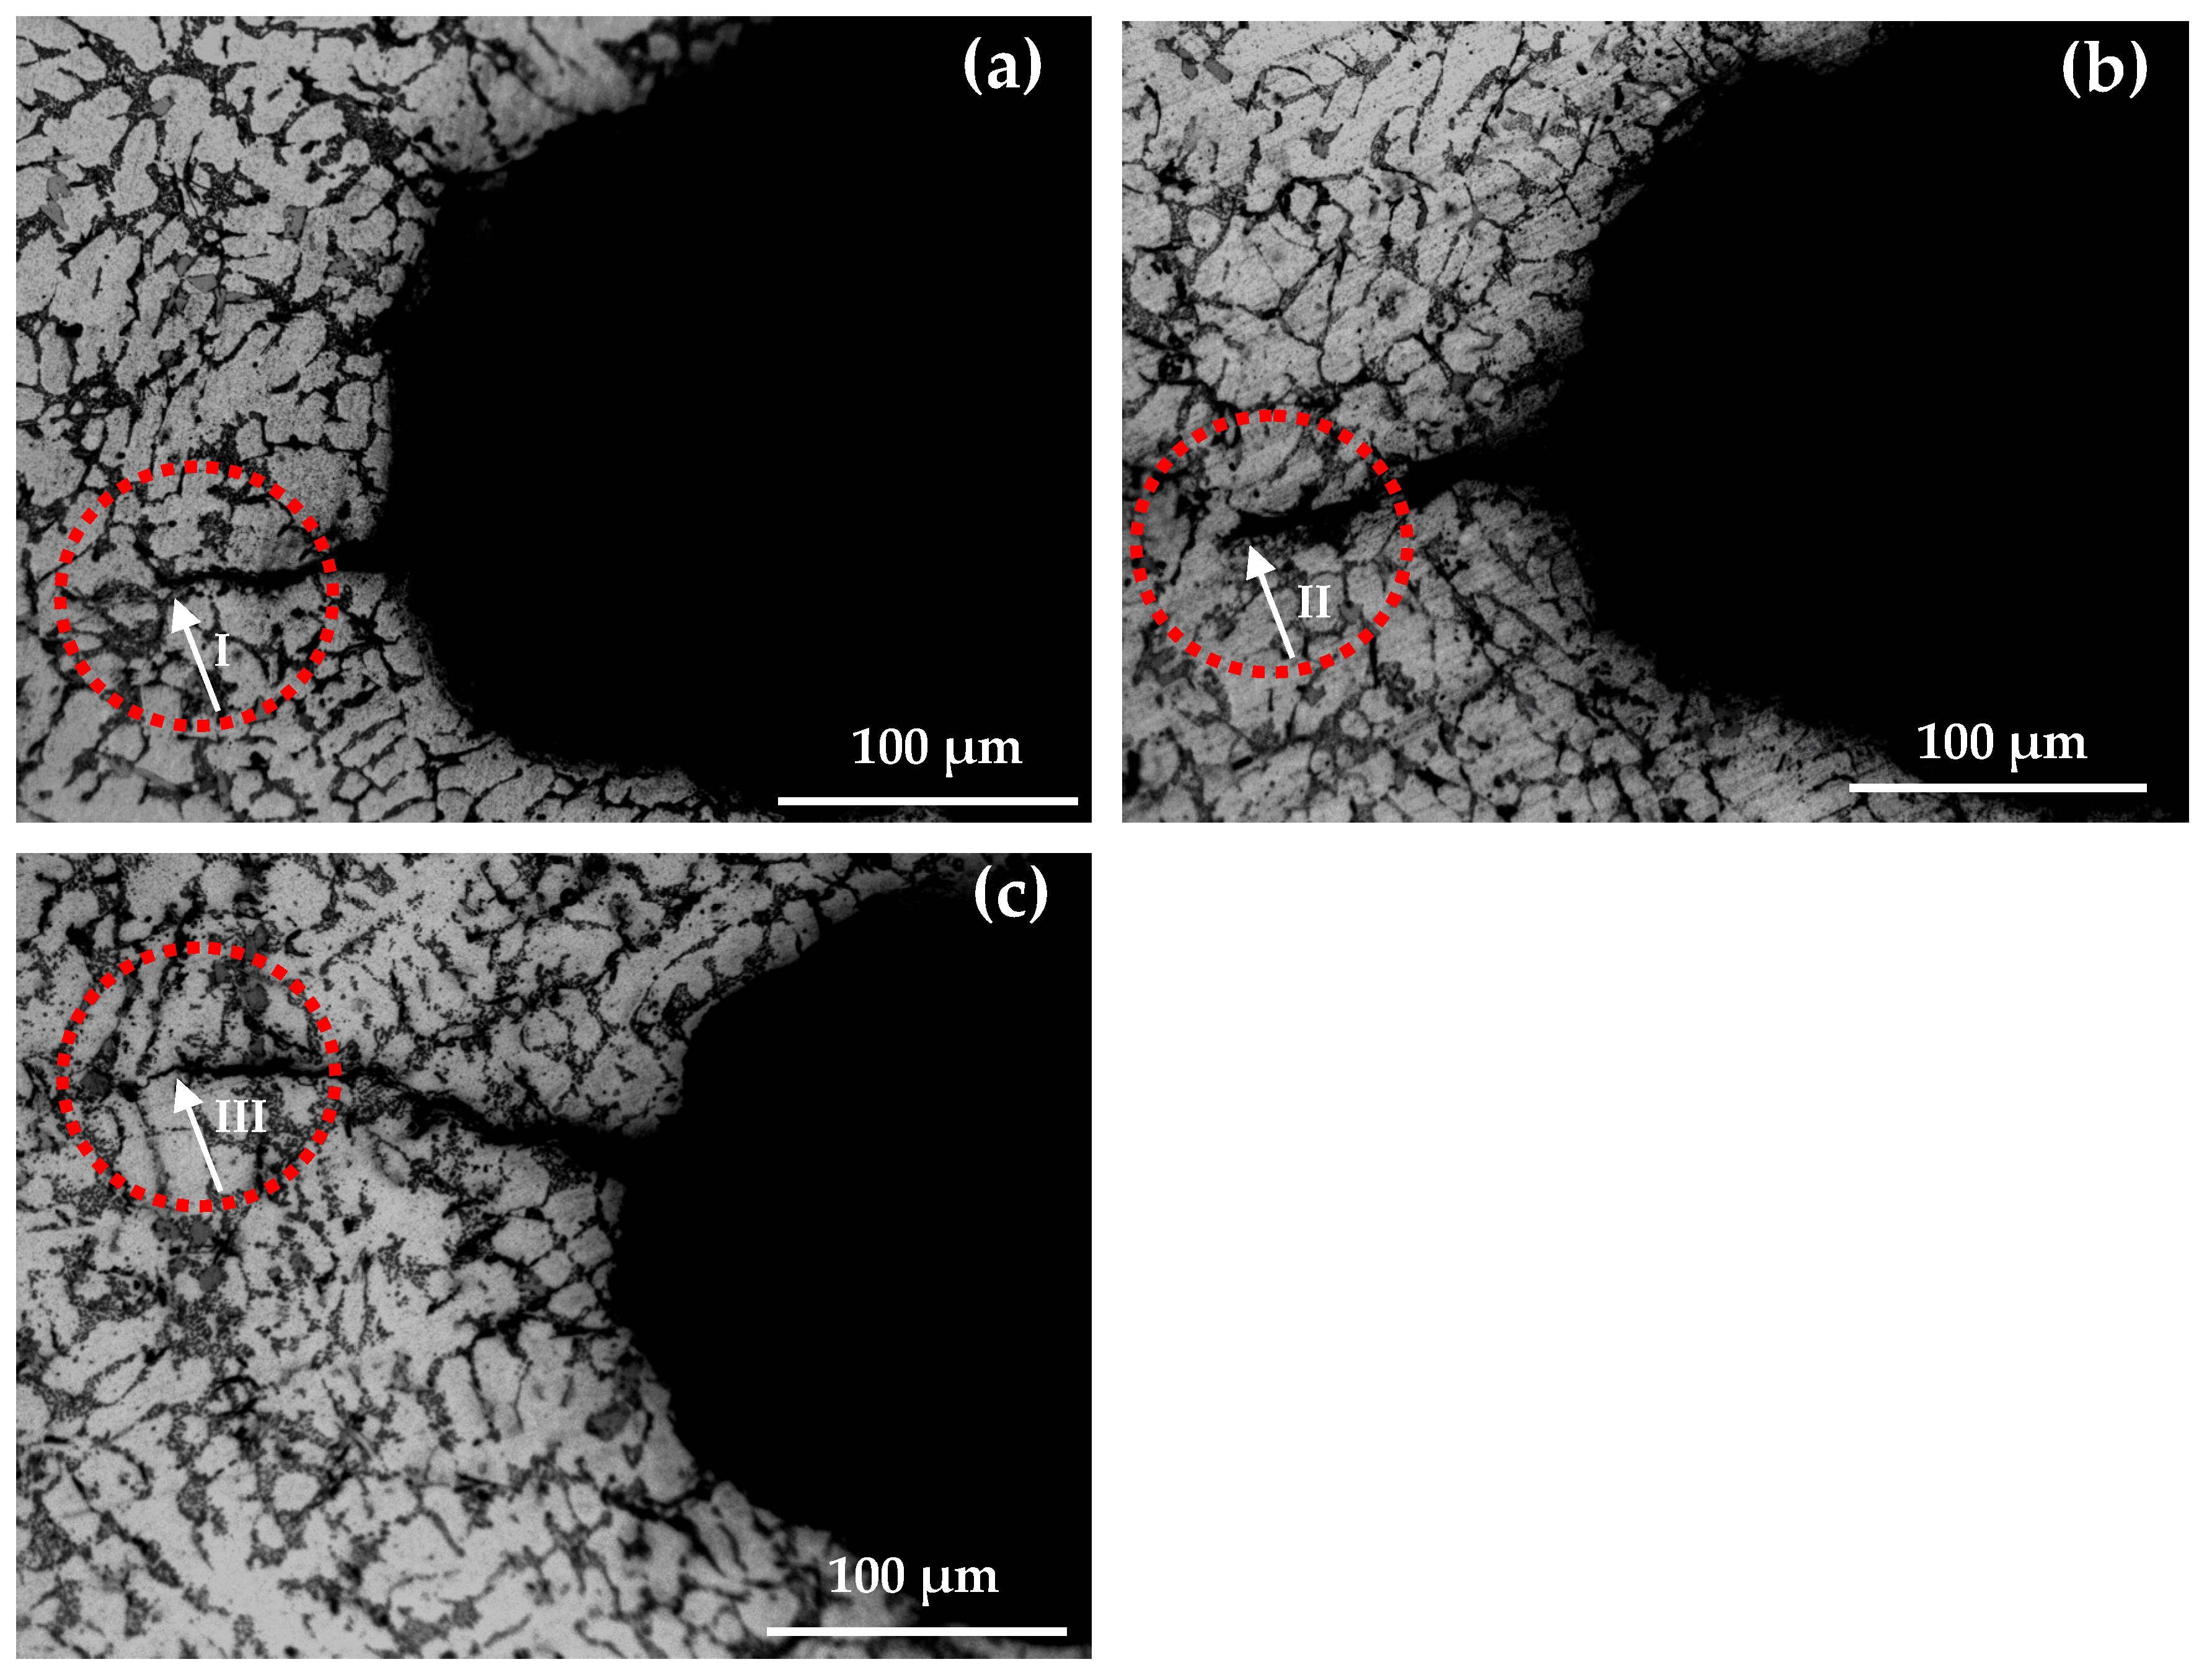
- Under the action of alternating cyclic thermal stress, only a few microcracks can continue to quickly propagate or preferentially propagate into the main crack. The crack tip changes the cycle in a way of sharpening→passivation→ sharpening repeatedly alternating, and the crack intermittently propagates forward from its tip in a way that expansion→stopping→expansion until the specimen breaks and fails.
Author Contributions
Funding
Data Availability Statement
Conflicts of Interest
References
- Zhao, H.; Chakraborty, P.; Ponge, D.; Hickel, T.; Sun, B.; Wu, H.; Gault, T.; Raabel, D. Hydrogen trapping and embrittlement in high-strength Al alloys. Nature 2022, 602, 437–441. [Google Scholar] [CrossRef] [PubMed]
- Feng, D.; Xu, R.; Li, J.; Huang, W.; Wang, J.; Liu, Y.; Zhao, L.; Li, C.; Zhang, H. Microstructure Evolution Behavior of Spray-Deposited 7055 Aluminum Alloy during Hot Deformation. Metals 2022, 12, 1982. [Google Scholar] [CrossRef]
- Feng, D.; Zhu, T.; Zang, Q.; Lee, Y.; Fan, X.; Zhang, H. Solution Behavior of Spray-Formed Hypereutectic AlSiCuMg Alloy. Acta Metall. Sin. 2022, 58, 1129–1140. [Google Scholar]
- Dong, X.; Feng, L.; Wang, S.; Ji, G.; Addad, A.; Yang, H.; Nyberg, E.; Ji, S. On the exceptional creep resistance in a die-cast Gd-containing Mg alloy with Al addition. Acta Mater. 2022, 232, 117957. [Google Scholar] [CrossRef]
- Njuguna, B.; Li, J.; Tan, Y.; Sun, Q.; Li, P. Grain refinement of primary silicon in hypereutectic Al-Si alloys by different P-containing compounds. China Foundry 2021, 18, 37–44. [Google Scholar] [CrossRef]
- Cao, Y.; Chen, X.; Wang, Z.; Chen, K.; Pan, S.; Zhu, Y.; Wang, Y. Synergistic influence of La and Zr on microstructure and me chanical performance of an Al-Si-Mg alloy at casting state. J. Alloys Compd. 2022, 902, 163829. [Google Scholar] [CrossRef]
- Jayasheel, K.; Ramesha, C.; Srinath, M.; Navaneeth, B. Fabrication and post processing techniques to enhance the strength of Al-Si alloy. Mater. Today Proc. 2022, 59, 483–488. [Google Scholar] [CrossRef]
- Dong, Y.; Jia, Z.; Wen, B.; Liu, Y.; Liu, Q.; Wu, J.; Gao, S. Effect of rare earth Sm on microstructure of Al-7Si-0.3Mg alloy. Chin. J. Nonferrous Met 2020, 30, 479–488. [Google Scholar]
- Zhao, L.; Xin, Y.; Jin, Z.; Wang, J.; Feng, B.; Liu, Q. Thermal stability of different texture components in extruded Mg-3Al-1Zn alloy. J. Alloy. Compd. 2019, 7, 577–583. [Google Scholar] [CrossRef]
- Lam, T.-N.; Chin, H.-H.; Zhang, X.; Feng, R.; Wang, H.; Chiang, C.-Y.; Lee, S.Y.; Kawasaki, T.; Harjo, S.; Liaw, P.K.; et al. Tensile overload-induced texture effects on the fatigue resistance of a CoCrFeMnNi high-entropy alloy. Acta Mater. 2023, 245, 118585. [Google Scholar] [CrossRef]
- Shk, A.; Dwh, A.; Hkk, B. Fatigue strength evaluation of self-piercing riveted joints of AZ31 Mg alloy and cold-rolled steel sheets. J. Magnes. Alloy. 2020, 8, 241–251. [Google Scholar] [CrossRef]
- Ning, J.; Na, S.; Zhang, L.; Wang, X.; Long, J.; Cho, W. Improving thermal efficiency and stability of laser welding process for magnesium alloy by combining power modulation and subatmospheric pressure environment. J. Magnes. Alloy. 2022, 10, 2788–2800. [Google Scholar] [CrossRef]
- Bazhenov, V.; Koltygin, A.; Sung, M.; Sh, P.; Kv, M. Development of Mg-Zn-Y-Zr casting magnesium alloy with high thermal conductivity. J. Magnes. Alloy. 2021, 9, 1567–1577. [Google Scholar] [CrossRef]
- Pan, L.; Han, J.; Yang, Z.; Li, X.; Wang, J.; Li, Z.; Li, W. Thermal fatigue crack behavior of SiCp/A356 composites prepared by stirring casting. Results Phys. 2017, 7, 927–933. [Google Scholar] [CrossRef]
- Rohatgi, P.; Gupta, N.; Alaraj, S. Thermal expansion of alu-minum-fly ash cenosphere composites synthesized by pressure in-filtration technique. J. Compos. Mater. 2006, 40, 1163–1174. [Google Scholar] [CrossRef]
- Huang, Y.; Hort, N.; Dieringa, H. Investigations on thermal fatigue of aluminum-and magnesium-alloy based composites. Int. J. Fatigue Int. J. Fatigue 2006, 28, 1399–1405. [Google Scholar] [CrossRef] [Green Version]
- Xin, Q. Durability and reliability in diesel engine system design. In Diesel Engine System Design; Woodhead Publishing: Cambridge, UK, 2013; pp. 113–202. [Google Scholar] [CrossRef]
- Tayebi, M.; Tayebi, M.; Rajaee, M.; Ghafarnia, V.; Asiye, M. Improvement of thermal properties of Al/Cu/SiC composites by tailoring the reinforcement microstructure and comparison to thermoelastic models. J. Alloys Compd 2021, 853, 156794. [Google Scholar] [CrossRef]
- Zare, R.; Sharifi, H.; Saeri, M.; Tayebi, M. Investigating the effect of SiC particles on the physical and thermal properties of Al6061/SiCp composite. J. Alloys Compd. 2019, 801, 520–528. [Google Scholar] [CrossRef]
- Wu, C.; Han, G. Thermal fatigue behaviour of SiCp/Al composite synthesized by metal infiltration. Compos. Part A Appl. Sci. Manuf. 2006, 37, 1858–1862. [Google Scholar] [CrossRef]
- Birol, Y. Thermal fatigue testing of Inconel 617 and Stellite 6 alloys as potential tooling materials for thixoforming of steels. Mater. Sci. Eng. A 2010, 527, 1938–1945. [Google Scholar] [CrossRef]
- Mousavi, S.F.; Sharifi, H.; Tayebi, M.; Hamawandi, B.; Behnamian, Y. Thermal cycles behavior and microstructure of AZ31/SiC composite prepared by stir casting. Sci. Rep. 2022, 12, 15191. [Google Scholar] [CrossRef] [PubMed]
- Zhou, X.; Hu, X.; Jiang, F. Thermal fatigue property of a new type hot-work die steel. Heat Treat. Met. 2011, 36, 107–109. [Google Scholar]
- Wang, H. Quantitative Assessment of Fatigue and Fracture Properties of Materials; Northwestern Polytechnical University: Xi’an, China, 2002. [Google Scholar]
- Hu, H.; Lu, C. Non-equilibrium statistical theory for the thermal fatigue of metals. J. Beijing Inst. Technol. 2001, 4, 146–150. [Google Scholar]
- He, Y.; Xi, H.; Ming, W.; Shao, Q.; Shen, R.; Lai, Y.; Wu, C.; Chen, J. Thermal stability and precipitate microstructures of Al-Si-Mg-Er alloy. Trans. Nonferrous Met. Soc. China 2021, 31, 1–10. [Google Scholar] [CrossRef]
- Cui, X.; Meng, C.; Shi, B.; Bai, P.; Du, Z.; Zhao, X.; Wang, H. Microstructure Evolution and Mechanism of Refinement and Modification in As-casting Al-Si-Mg-Sc Alloy. Rare Met. Mater. Eng. 2022, 51, 2529–2535. [Google Scholar]
- Huang, H.; Jia, Z.; Xing, Y.; Wang, X.; Liu, Q. Microstructure of Al-Si-Mg alloy with Zr/Hf additions during solidification and solution treatment. Rare Met. 2019, 38, 1033–1042. [Google Scholar] [CrossRef]
- Lv, H.; Zhang, Z.; Luo, J.; Geng, Y.; Ju, H.; Yu, L.; Xu, J. Microstructure and Mechanical Properties of Al-Si-Mg-Zr Alloy Produced by Selective Laser Melting. Rare Met. Mater. Eng. 2023, 52, 1087–1093. [Google Scholar]
- Liu, G.; Si, N.; Sun, S.; Zhang, Z. Study on Thermal Fatigue Crack Initiation and Propagation of Multielement Al-7.5Si-4Cu Alloy. Acta Metall. Sin. 2013, 49, 303–310. [Google Scholar] [CrossRef]
- Cui, Z.; Qin, Y. Metallography and Heat Treatment; Mechanical Industry Press: Beijing, China, 2007. [Google Scholar]
- Wang, Z.; Dong, C.; Wang, Z.; Zhang, Q.; Liu, J.; Chen, X. Thermal Fatigue Crack Initiation and Propagation Behavior of Multicomponent Al-7Si-0.3Mg Alloys. Rare Met. Mater. Eng. 2022, 51, 783–792. [Google Scholar]
- Chen, L.; You, X.; Yang, Q. Initiation and Propagation Mechanism of Thermal Fatigue Crack on the Surface of Co-P Coating. Rare Met. Cem. Carbides 2010, 38, 25–29. [Google Scholar]
- Shu, D. Mechanical Properties of Metal; Machinery Industry Press: Beijing, China, 1999. [Google Scholar]
- Li, J.; Shu, D.; Guo, X. Study on Thermal Fatigue Behaviors of Tungsten Hot Working Die Steel. J. Anhui Inst. Technol. 1988, 7, 21–31. [Google Scholar]
- Zhang, Z.; Si, N.; Sun, S.; Liu, G.; Wu, Q. Thermal fatigue crack growth of ZAlSi7Cu4 under different technological conditions. Chin. J. Nonferrous Met. 2012, 22, 3038–3044. [Google Scholar]
- Rozumek, D.; Hepner, M. Influence of oxygenation time on crack growth in titanium alloy under cyclic bending. Mater. Sci. 2011, 47, 89–94. [Google Scholar] [CrossRef] [Green Version]
- Si, N.; Fu, M. Non-Ferrous Metal Materials and Preparation; Chemical Industry Press: Beijing, China, 2006. [Google Scholar]
- Rozumek, D.; Hepner, M. Influence of microstructure on fatigue crack propagation under bending in the alloy Ti-6Al-4V after heat treatment. Mater. Und Werkst. 2015, 46, 1088–1095. [Google Scholar] [CrossRef]
- Shu, D. Mechanical Properties of Engineering Materials; Machinery Industry Press: Beijing, China, 2019. [Google Scholar]
- Han, Z. Effects of Temperature on Thermal Fatigue Proper ties of Some Wrought Superalloys. Gas Turbine Exp. Res. 2007, 20, 54–57. [Google Scholar]


| Element | Si | Mg | Cu | Mn | Ti | B | RE | Sr | Fe | Various Trace Elements | Al |
|---|---|---|---|---|---|---|---|---|---|---|---|
| A | 7.03 | 0.32 | - | - | - | - | - | - | - | ≤0.20 | Bal. |
| B | 7.03 | 0.32 | - | - | 0.042 | 0.0074 | 0.0086 | 0.032 | - | ≤0.20 | Bal. |
| C | 6.92 | 0.29 | 1.85 | 0.33 | 0.29 | 0.0076 | 0.0082 | 0.034 | 0.08 | ≤0.20 | Bal. |
| D | 6.92 | 0.29 | 1.85 | 0.33 | 0.29 | 0.0076 | 0.0082 | 0.034 | 0.08 | ≤0.20 | Bal. |
| Sample | Tensile Strength (MPa) | Yield Strength (MPa) | Elongation (%) | Vickers Hardness (HV) | Impact Toughness (J/cm2) |
|---|---|---|---|---|---|
| A | 177.56 | 128.21 | 1.17 | 72.50 | 8.36 |
| B | 258.74 | 196.35 | 7.73 | 83.41 | 13.19 |
| C | 282.36 | 223.89 | 6.96 | 101.80 | 20.31 |
| D | 352.45 | 267.58 | 5.75 | 120.30 | 26.25 |
Disclaimer/Publisher’s Note: The statements, opinions and data contained in all publications are solely those of the individual author(s) and contributor(s) and not of MDPI and/or the editor(s). MDPI and/or the editor(s) disclaim responsibility for any injury to people or property resulting from any ideas, methods, instructions or products referred to in the content. |
© 2023 by the authors. Licensee MDPI, Basel, Switzerland. This article is an open access article distributed under the terms and conditions of the Creative Commons Attribution (CC BY) license (https://creativecommons.org/licenses/by/4.0/).
Share and Cite
Wang, Z.; Liu, X.; Dong, C.; Chen, J.; Liu, L. Thermal Fatigue Crack Propagation Process and Mechanism of Multicomponent Al-7Si-0.3Mg Alloy. Crystals 2023, 13, 1068. https://doi.org/10.3390/cryst13071068
Wang Z, Liu X, Dong C, Chen J, Liu L. Thermal Fatigue Crack Propagation Process and Mechanism of Multicomponent Al-7Si-0.3Mg Alloy. Crystals. 2023; 13(7):1068. https://doi.org/10.3390/cryst13071068
Chicago/Turabian StyleWang, Zhengjun, Xinyang Liu, Chen Dong, Jie Chen, and Lianxiang Liu. 2023. "Thermal Fatigue Crack Propagation Process and Mechanism of Multicomponent Al-7Si-0.3Mg Alloy" Crystals 13, no. 7: 1068. https://doi.org/10.3390/cryst13071068