Article

Simulations and Experiments on the Microstructure and Property Evolution of In Situ TiC+Al3Ti-Reinforced Aluminum Coatings on AZ91D Magnesium Alloy

1
Department of Materials Science and Engineering, Jinzhong University, Jinzhong 030619, China
2
The Collaborative Innovation Center for the Modified Application of Lightweight Materials, Jinzhong University, Jinzhong 030619, China
3
College of Materials Science and Engineering, North University of China, Taiyuan 030051, China
4
School of Materials Science and Engineering, Taiyuan University of Science and Technology, Taiyuan 030024, China
*
Author to whom correspondence should be addressed.
Crystals 2023, 13(7), 1151; https://doi.org/10.3390/cryst13071151
Submission received: 28 June 2023 / Revised: 13 July 2023 / Accepted: 21 July 2023 / Published: 24 July 2023

Abstract

:
With the development of computational thermodynamics, it is possible to design a material based on its simulated microstructure and properties before practical operations. In order to improve the surface properties of AZ91D magnesium alloy, Jmatpro was used in this study to design an alloy system with in situ TiC+AlTi3-reinforced aluminum coatings. The Gibbs free energy, hardness, and phase diagrams of aluminum coatings with different ratios of Ti to B4C were simulated. According to the simulation results, TiB2, TiC, Al3Ti_DO22, and Al4C3 were formed in the coating while TiB2, TiC, Al3Ti_DO22, Al4C3, and Al3Mg2 were formed in the transition zone between the base metal and the coating. Based on the simulation results, different amounts of Ti were used with B4C (the ratios were 3:1, 4:1, 5:1, and 6:1) to fabricate TiC+Al3Ti reinforced aluminum coatings on AZ91D magnesium alloy via laser cladding. The microstructure and phase composition of the coating were studied using scanning electron microscopy (SEM) incorporated with energy- dispersive spectrometry (EDS) and X-ray diffraction (XRD). The results indicated that intermetallic phases, such as AlTi3(C, N)0.6, AlMg, Al3Mg2, Al3Ti, and TiC were formed in the coatings. As the Ti content increased, the content of Al3Ti increased and the content of TiC decreased in the coatings, which is consistent with the simulation results. The average hardness of the coatings was approximately four to five times that of the magnesium alloy substrate, and the corrosion current density of the coatings was around 2.5 × 10⁻⁶, which is two orders of magnitude lower than that of AZ91D magnesium alloy.

1. Introduction

As the lightest metal structural material, magnesium alloy has advantages such as high specific strength and stiffness, making it one of the best metals used in the aviation and aerospace fields [1,2,3]. However, widespread use of magnesium alloy is limited due to its poor wear and corrosion resistance [4,5,6]. Researchers have tried different approaches to improve the properties of magnesium alloy through surface modification [7,8,9,10]. Laser cladding utilizes a precise laser beam to deposit a coating with desired properties on a substrate, and this technique has developed rapidly in recent years owing to its many particular advantages [11,12,13]. In order to improve the performance of laser-cladded coatings, ceramic particles with high hardness and temperature stability, such as TiC, TiB, and SiC, are often used as the reinforcing phase [14,15]. However, direct addition of ceramic particles to the alloy powder always brings severe cracks due to the thermal expansion difference between the alloy coating and the ceramic particles [16]. Compared to direct addition of ceramic phases, the in situ synthesis technique forms evenly distributed ceramic particles in the coating via laser cladding, which also has good wetting behavior with the matrix [17]. For example, Savalani M. M. et al. used Ti and carbon nanotube mixed powders to form Ti-based coatings using the in situ synthesis technique [18], and the wear resistance and hardness of the cladding layer increased with an increase in the carbon nanotube content. Y. P. Pu studied the in situ formation of TiN/Ti3Al, TiC/Ti3Al, and SiC/Ti3Al composite coatings using laser cladding on titanium substrate [19].
In order to synthetize in situ ceramic coatings on magnesium alloy, the alloy system must be well designed to make sure the in situ ceramic coatings are successfully generated with the required properties. Furthermore, the morphology of the phases must be carefully controlled, which directly affects the properties of the coatings. Numerical calculation methods and simulation software are widely used by researchers to simulate microstructure. Therefore, an alloy system with a TiC+Al3Ti reinforced aluminum coating can be designed and the content can be optimized based on the simulated microstructure and properties before practical operations.
The most commonly used numerical calculation methods include deterministic methods, probabilistic methods and phase field methods. Because numerical calculation is always time-consuming and complex, professional software such as Thermo-calc and JMatPro based on the CALPHAD technology have been developed, which are useful for simulating complex multi-component alloy systems. Compared to the Thermo-calc software, the JMatPro software is more intuitive and is widely used to simulate material properties [20,21]. To study the effect of alloy composition, Jooyoung Park et al. simulated the phase transformation and mechanical properties of pore-free samples using JMatPro [22]. Jae-Hyeok Shim et al. calculated the thermodynamics and kinetics of a Fe-0.30C-0.23Si-1.37Mn-0.14V-0.22Cu (in wt%) alloy system using MatCalc and JMatPro software [23].
To improve the surface properties of AZ91D magnesium alloy, the JMatPro software was used in this paper to simulate the phase diagram of aluminum coatings with different (Ti+B4C) contents. The Gibbs free energy, hardness and phase diagrams of the coatings were simulated and used to predict the phase content in the coatings with different ratios of Ti to B4C. Furthermore, to verify the simulation results and optimize the performance of the coating, different amounts of Ti were used with B4C and Y2O3 to control the morphology of the phases in the in situ Al–TiC–Al3Ti composite coating. The effect of Ti on the morphology of in situ generated TiC and Al3Ti phases was then investigated.

2. Simulation

According to the thermodynamic principle, minimal Gibbs free energy and equal chemical potential are required for ensuring the phase equilibrium of an alloy system. Therefore, the following assumptions can be made:
G m ( α ) X i = G m ( β ) X i
μ i α = μ i ( β )
Assuming that component i exists in the α phase and the β phase, the chemical potentials of i in the α phase and the β phase are equal. Unbalanced distribution of i will cause phase transitions in the system. By using the CALPHAD technology, it is possible to calculate the molar Gibbs free energy for each phase as shown in Formula (3).
G m = i X i G i 0 + R T i X i l n X i + i j X i X j Ω V ( X i X j ) k
Among the thermodynamic terms, G i 0 is the Gibbs free energy and X i is the mole fraction of component i. The first term represents the overall Gibbs free energy when the components are simply mixed. The interaction of the components also has an impact on the overall Gibbs free energy, which can be calculated using the last two terms. The second term represents a change in Gibbs free energy caused by the formation of an ideal solution state between the components, in which the particle sizes are supposed to be approximately equal. The third term is the excess free energy caused by the deviation from the ideal solution state.
Based on the above thermodynamic theoretical assumptions, the JMatPro software was used to simulate the phase diagram and properties of the TiC–Al3Ti reinforced aluminum coatings. The phase diagram was used to design the alloy system and predict the phase formed in the coatings during the laser cladding process.

2.1. Simulation of Coatings with Different (Ti+B4C) Contents

In order to form in situ TiC–Al3Ti-reinforced aluminum coatings, Al+(Ti+B4C) mixed powder was designed and used for laser cladding. According to the reaction formula “5Ti+B4C→TiC+4TiB”, the ratio of Ti to B4C was tentatively set as 5:1. The content of (Ti+B4C) powder decides the amount and morphology of TiC and Al3Ti in the coating. Therefore, to optimize the content of (Ti+B4C), the JMatPro software was used to simulate the phase diagram of the coatings with different contents of (Ti+B4C).
The phase diagram and the important nodes of the simulation results are shown in Figure 1. The liquid phases containing Al, TiB2, TiC, Al3Ti_DO22, and Al4C3 are presented in the phase diagram. The important nodes listed in Figure 1 provide detailed information regarding the phase change. The starting temperature of the simulation is 1300 °C and the end temperature is 100 °C. When the temperature is 1300 °C, a liquid phase containing TiB2 and TiC is found. The content of TiB2 is constant and the content of TiC decreases gradually when the temperature decreases from 1300 °C to 100 °C. At point L4, the liquid phase decreases gradually and Al3Ti increases gradually because Al in the liquid phase reacts with Ti to form Al3Ti. When the temperature reaches 789.66 °C, the liquid phase decreases and the content of Al3Ti increases suddenly because the TiC decomposes, and excess Ti and C elements react with Al to form Al3Ti and Al4C3. When the temperature is 664.78 °C, the liquid phase begins to solidify to form an aluminum solid phase. The content of Al3Ti increases gradually between 664.78 °C and 100 °C.
As indicated in Figure 1, with an increase in (Ti+B4C) content, the contents of TiB2, TiC, Al4C3 and Al3Ti_DO22 increase gradually. When the content of (Ti+B4C) is 30%, the contents of Al3Ti and TiC reach their highest, which are 43.45% and 5.98%, respectively. The formation of a high level of the hard phase will lead to an increase in the brittleness of the coating. Therefore, the content of 25% (Ti+B4C) was selected for further calculation.

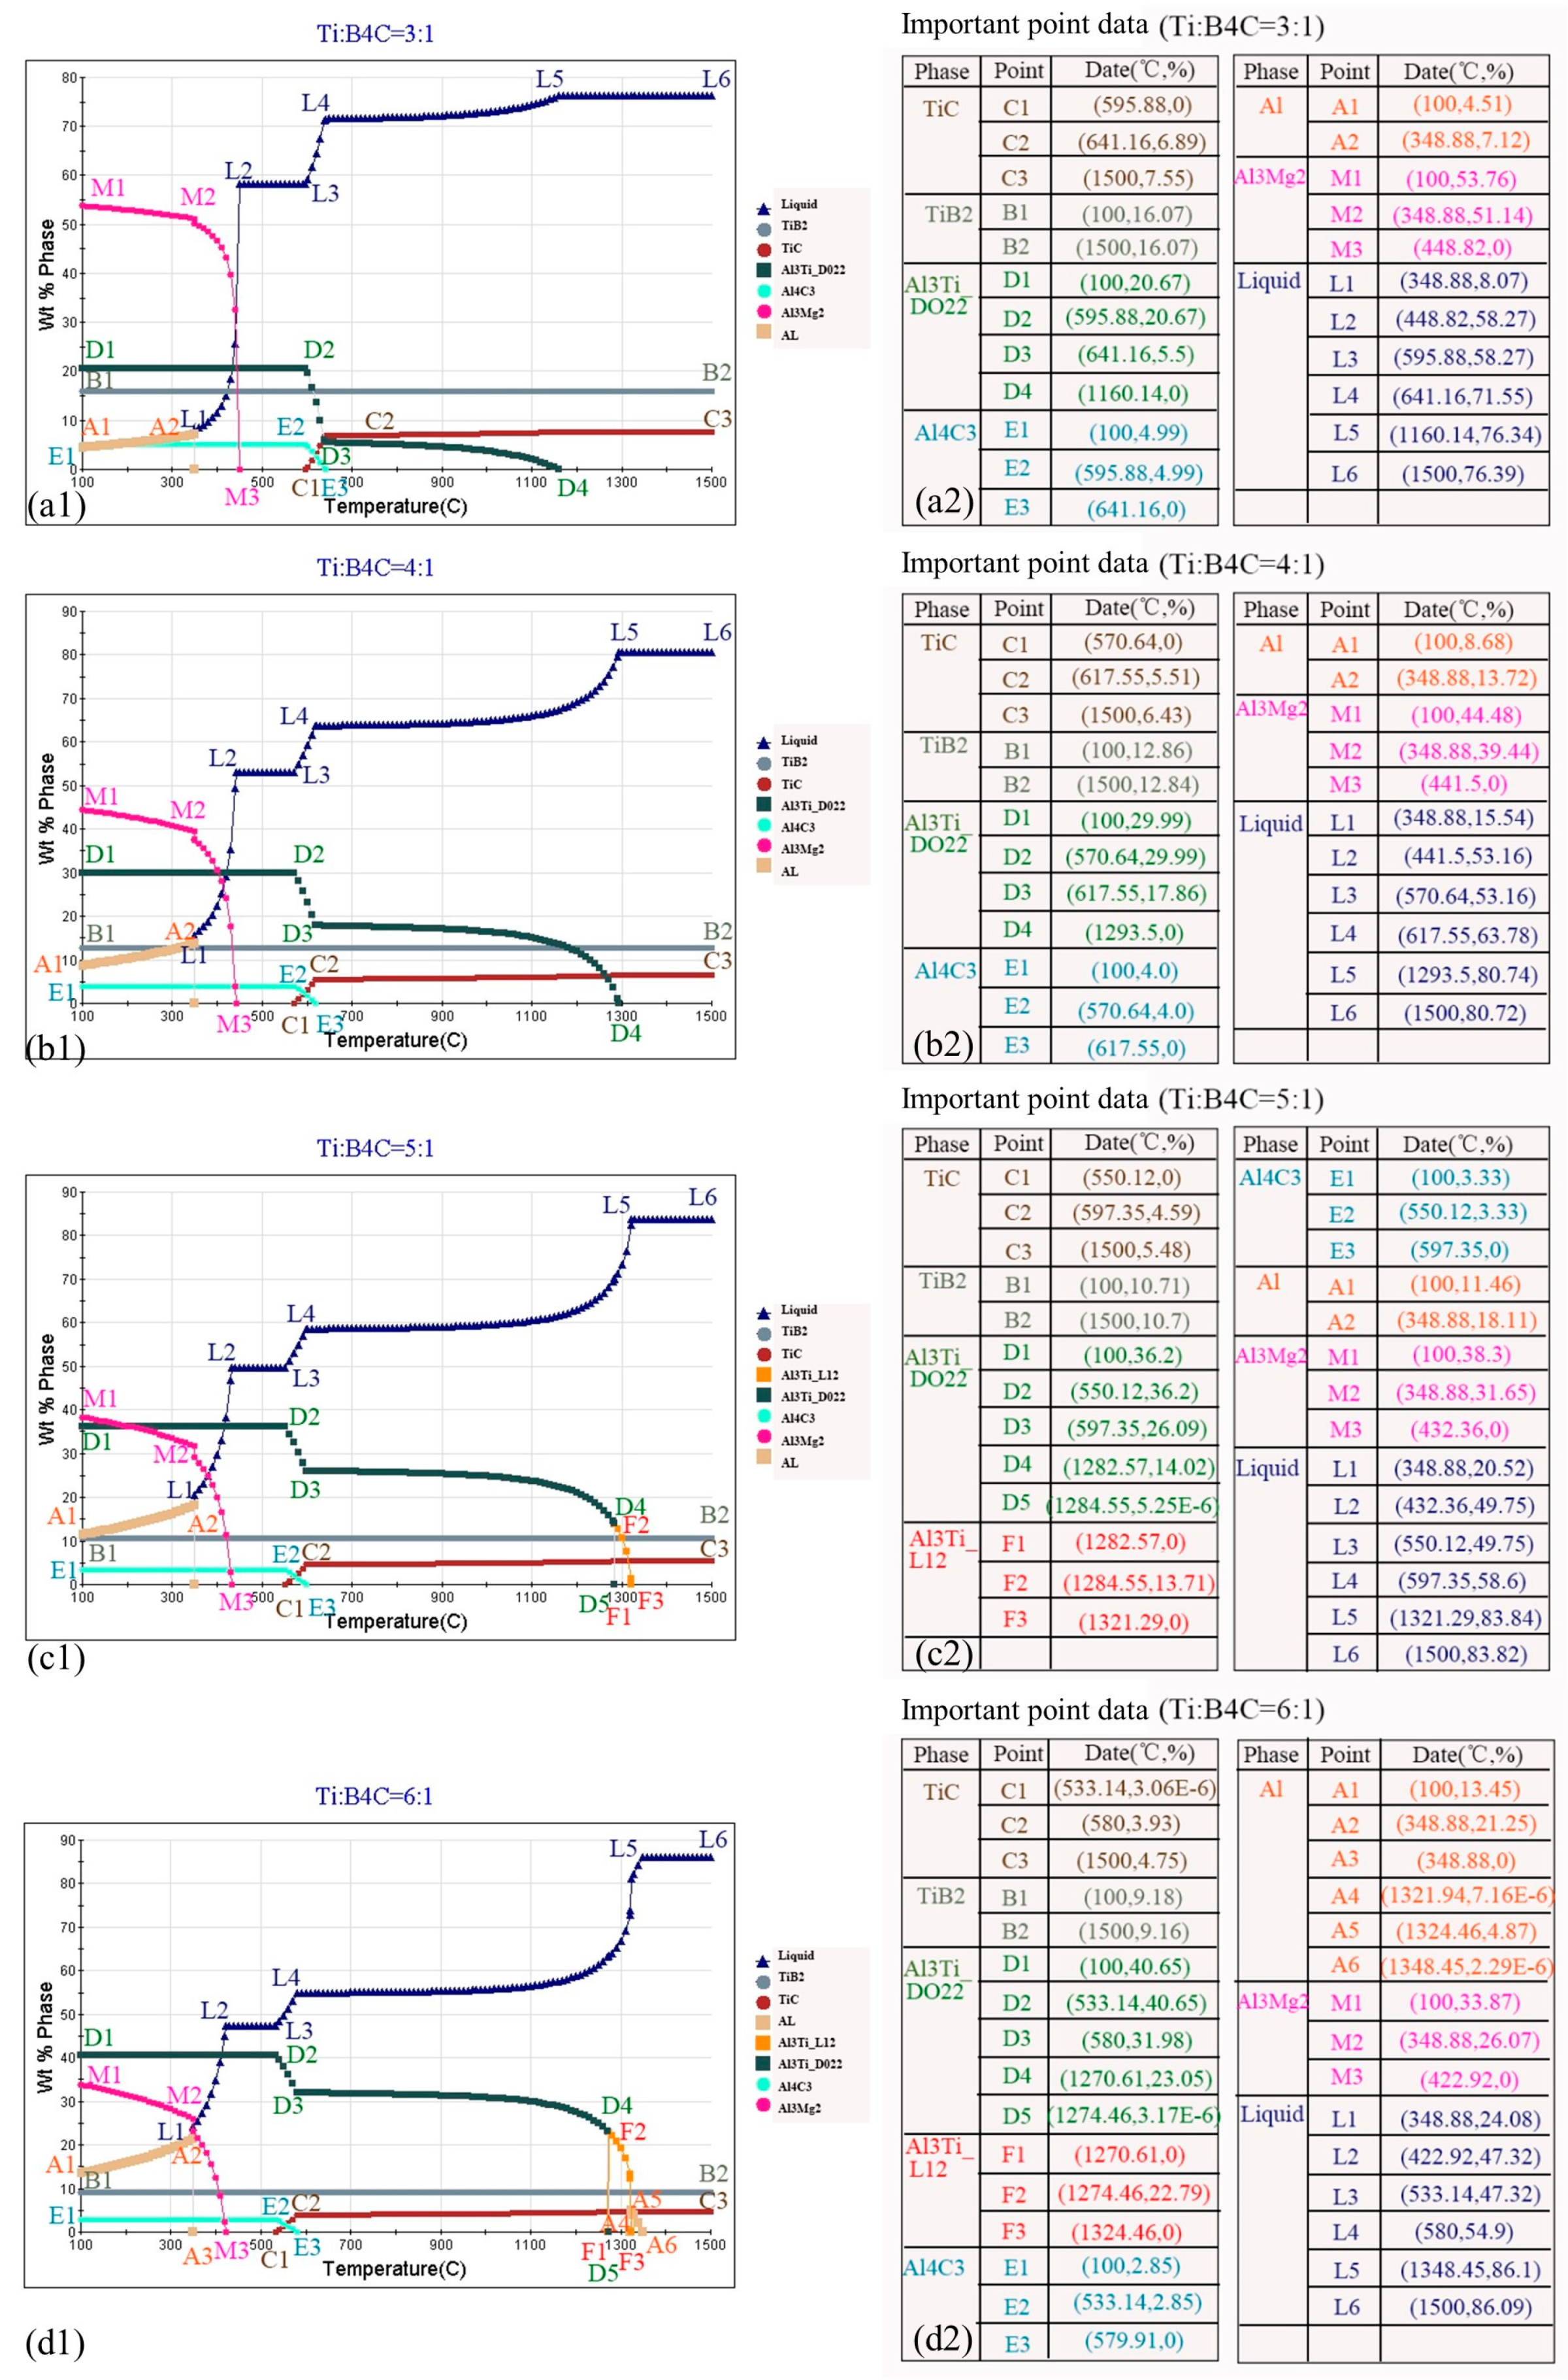
2.2. Simulation of Coatings with Different Ratios of Ti to B4C

Besides the content of (Ti+B4C) powder, the ratio of Ti to B4C also has a significant impact on the performance of coatings. Therefore, as shown in Figure 2, phase diagrams were simulated for the 25% (Ti+B4C) coatings with different ratios of Ti to B4C (Ti:B4C = 3:1, 4:1, 5:1, 6:1). The liquid phase containing TiB2, TiC, Al3Ti_DO22, Al4C3 and Al is presented in the phase diagram.
As shown in Figure 2, as the ratio of Ti to B4C increases, the content of Al decreases gradually when the temperature is 100 °C. As the ratio of Ti to B4C increases, Al3Ti_DO22 precipitate at higher temperature and the content of Al3Ti_DO22 increases gradually. In contrast, the contents of TiB2, Al4C3, and TiC decrease gradually.

2.3. Simulation of Coatings with Consideration of Mg Dilution

The above simulations were carried out on the coatings without considering the effect of the substrate. However, when a magnesium alloy is used as the matrix, the melted Mg substrate can easily diffuse into the coating and a transition zone between the coating and the substrate is formed. To predict the phase formed at the transition zone, the JMatPro software was used to simulate the phase diagrams of the transition zone. The simulation results and the data of the important nodes are shown in Figure 3.
As shown in Figure 3, a liquid phase containing Al, TiB2, TiC, Al3Ti_D022, Al4C3, and Al3Mg2 is found in the transition zone. Al3Ti_L12 is formed when the ratios of Ti to B4C were 5:1 and 6:1, respectively. The starting temperature of the simulation is 1500 °C and the end temperature is 100 °C. The content of TiC decreases gradually with decreasing temperature. However, the magnitude of the change is not large. When the temperature is lowered at the point L5, the content of the liquid phase begins to decrease. This is because Al in the liquid phase reacts with Ti to form Al3Ti. As the liquid phase decreases, the content of Al3Ti gradually increases. The content of TiC in the liquid phase suddenly decreases when the temperature is at point L4. This is because Al in the liquid phase reacts with Cand Ti to form Al4C3 and Al3Ti. As the content of TiC in the liquid phase decreases, the contents of Al3Ti and Al4C3 gradually increase. When the temperature reaches the L2 point, the content of the liquid phase is drastically reduced. However, the contents of Al3Ti, TiB2, and Al4C3 do not change. The reason for the decrease in the content of the liquid phase is that Al and Mg react in the liquid phase to form Al3Mg2. The content of Al3Mg2 greatly increases as the content of the liquid phase is reduced. The liquid phase disappears until the temperature reaches 348.88 °C. At this time, Al is found. As the Al content decreases, the content of Al3Mg2 increases. It is worth noting that Al3Ti_L12 is found in the transition phase diagram when the ratios of Ti to B4C are 5:1 and 6:1. When the ratio of Ti to B4C is 5:1, the appearance temperature of Al3Ti_L12 corresponds to the temperature at which the liquid phase begins to decrease. When the ratio of Ti to B4C is 6:1, Al first precipitates when the temperature reaches point L5. Al3Ti_L12 was found when the temperature reached point A5. Generally, Al3Ti has a tetragonal DO22 crystal structure with a low symmetry. The L12 phase structure is a crystal structure with a higher symmetry than the DO22 structure. It provides more slip system than the DO22 structure. The plasticity of the alloy is improved due to the increase in the slip system. Therefore, the performance of the coatings containing Al3Ti_L12 is considered to be better.
Comparing the phase diagrams of the transition zone, the contents of Al4C3, TiC, TiB2 and Al3Mg2 decrease gradually with an increase in the ratio of Ti to B4C. The content of Al3Ti_DO22 gradually increases. Moreover, the disappearance temperature of Al3Ti_DO22 also gradually increases. Al3Mg2 is formed in this transition zone. This is because the Mg element in the melted matrix diffuses into the coating to form a compound with the Al element in the coating. Al3Ti_L12 is found in the transition phase diagram when the ratios of Ti to B4C are 5:1 and 6:1. The content of Al3Ti_L12 gradually increases with an increase in the ratio of Ti to B4C. In order to study the cause of the change in phase content in the coating, a thermodynamic simulation was carried out.

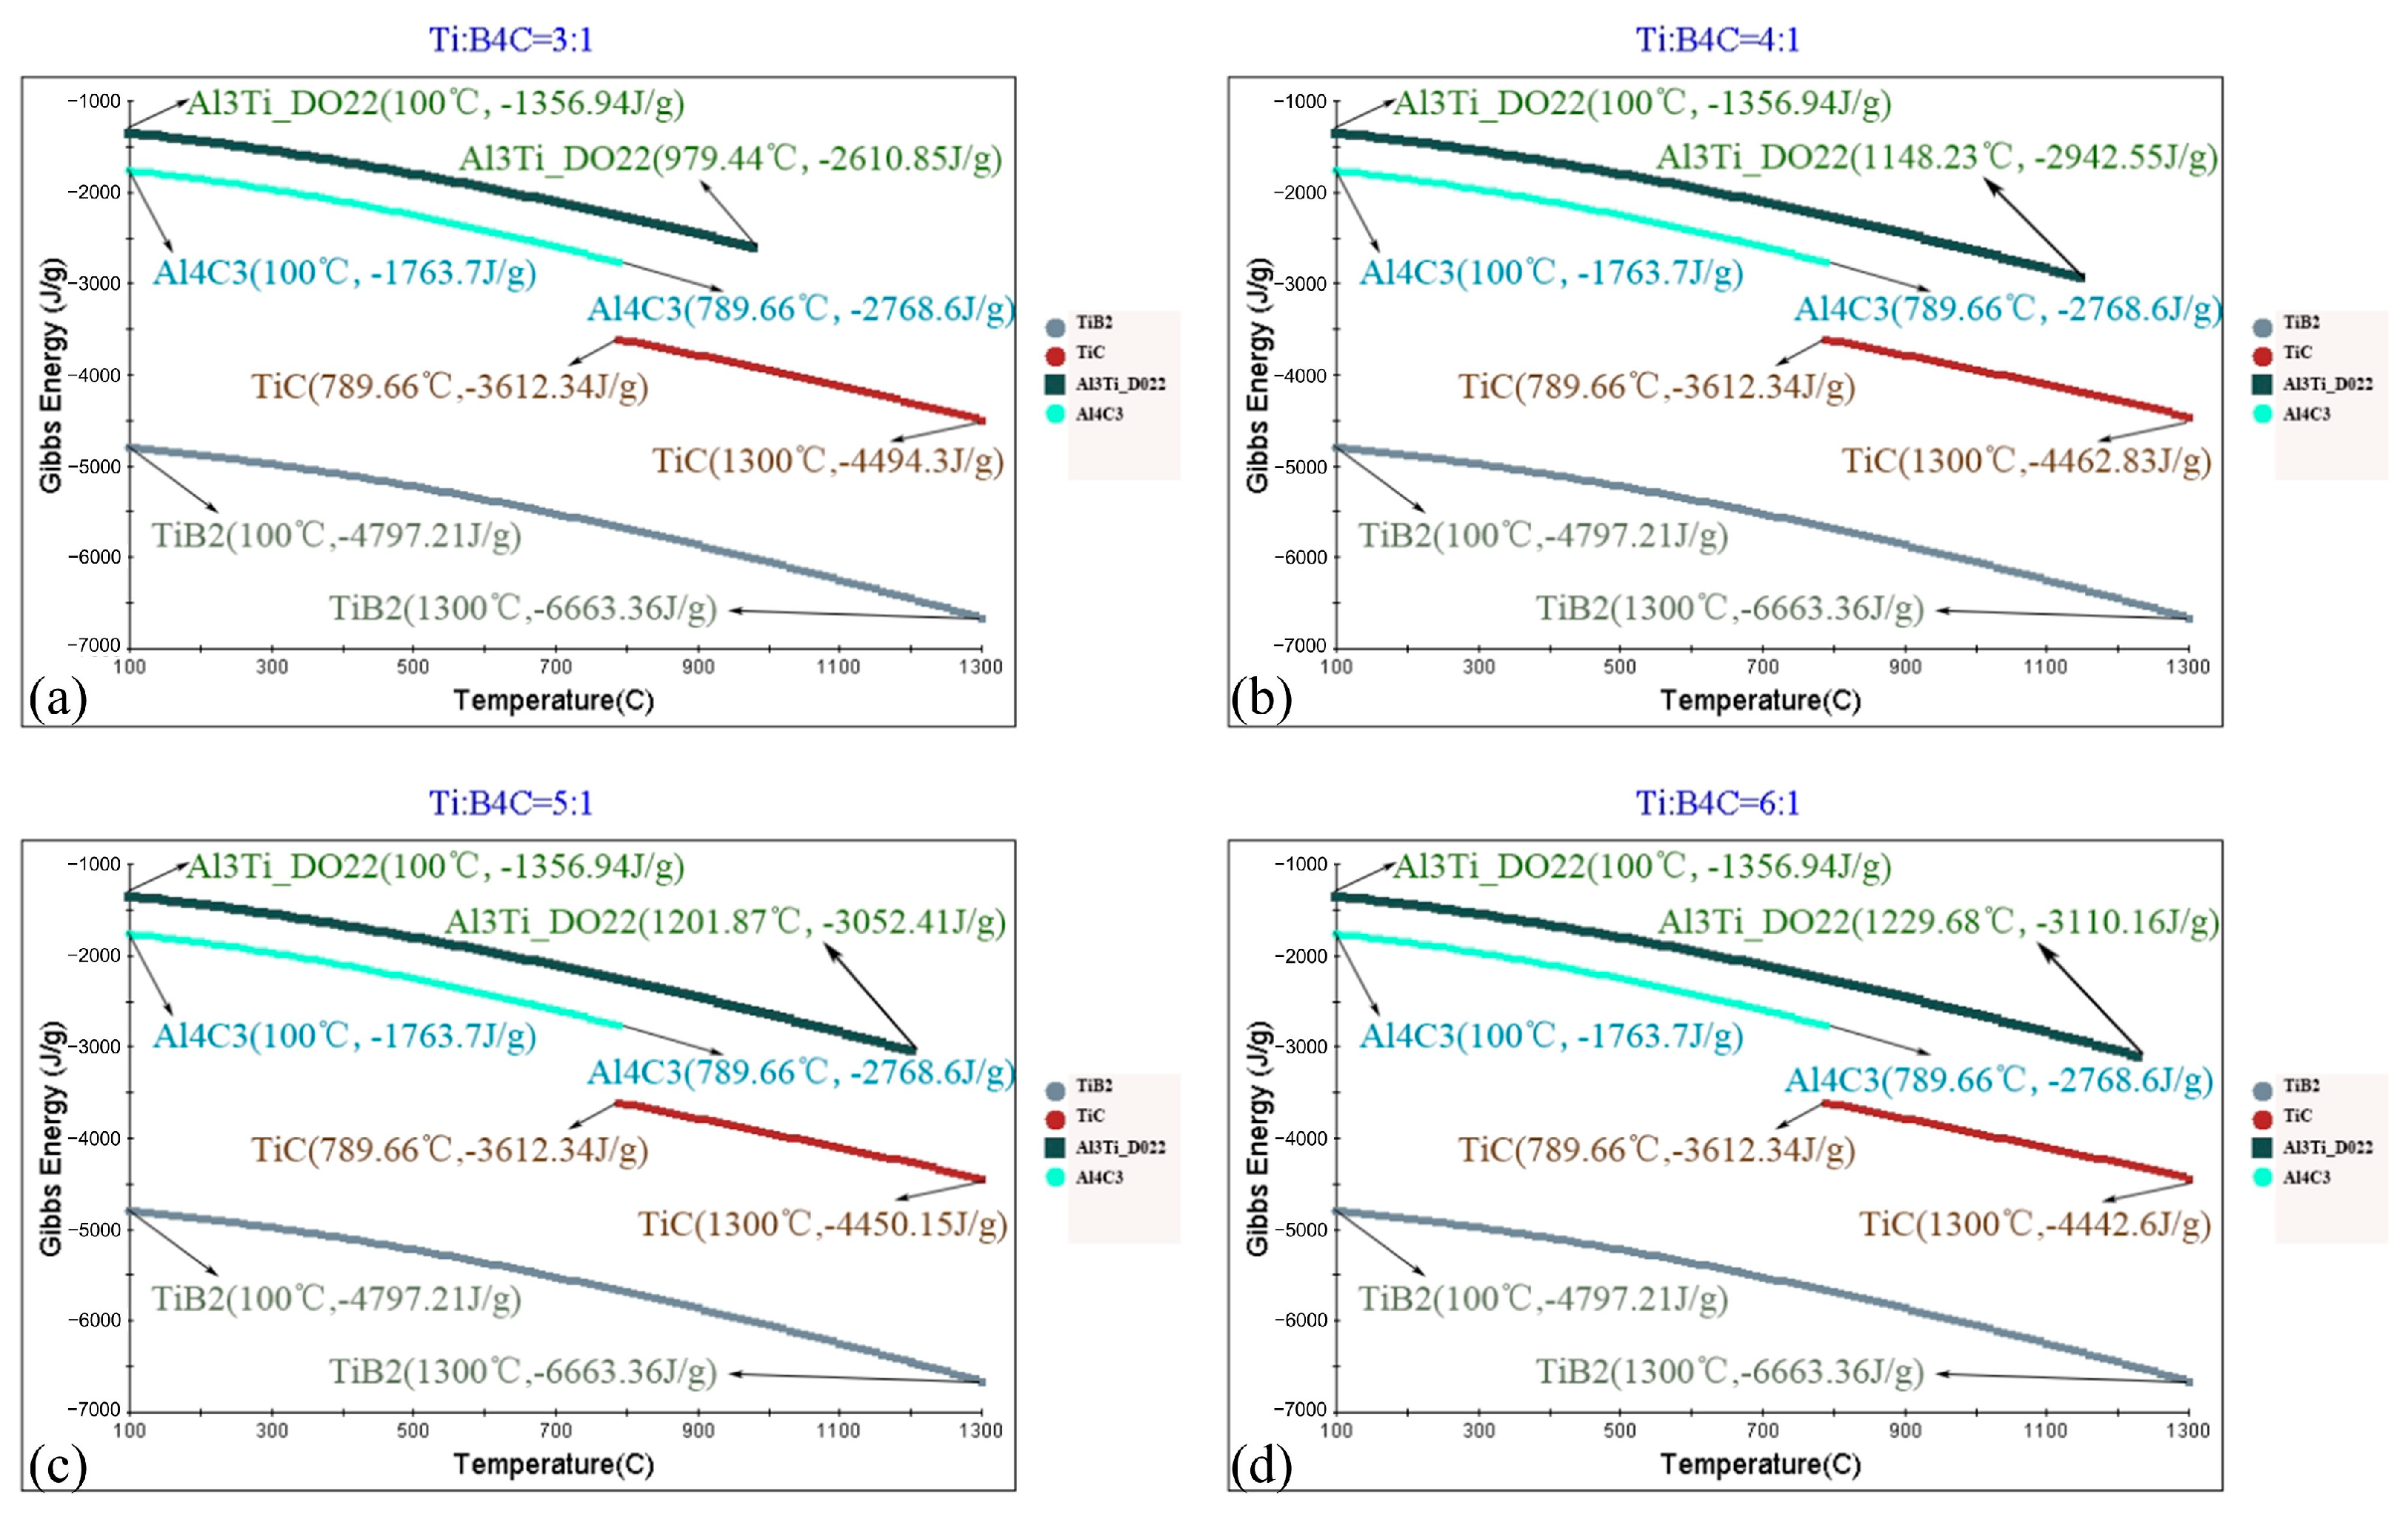
2.4. Thermodynamic Simulation

According to the thermodynamic mechanism, the Gibbs free energy is an important parameter which determines the occurrence of a chemical reaction. The chemical reaction can proceed spontaneously when the Gibbs free energy is negative [24]. Otherwise, the reaction cannot proceed spontaneously. The smaller the Gibbs free energy, the greater the thermodynamic driving force for chemical reaction. The JMatPro software was used to simulate the Gibbs free energy of the reaction occurring in the coating, and the results are shown in Figure 4. The Gibbs free energy of all phases becomes smaller with an increase in temperature. That is to say, the reaction spontaneously occurs as the temperature rises. The Gibbs free energy of TiB2 and Al4C3 remains constant as the ratio of Ti to B4C changes. Al3Ti disappears at elevated temperatures with an increase in the ratio of Ti to B4C, which corresponds to the phase diagram. The Gibbs free energy of Al3Ti decreases while the Gibbs free energy of TiC increases with an increase in the ratio of Ti to B4C. Therefore, Al3Ti is easily formed, whereas TiC is less likely to be formed with an increase in the ratio of Ti to B4C.
Based on the simulation results, the formed phases in situ in the coating can be predicted, and the subsequent reaction is carried out during the laser cladding process.
B 4 C 4 B + C
3 A l + T i A l 3 T i
T i + C T i C
T i + 2 B T i B 2
4 A l + 3 C A l 4 C 3
3 A l + 2 M g A l 3 M g 2
The simulation results confirm that TiC+Al3Ti-reinforced aluminum coatings were formed via laser cladding in this study. In the transition zone, Al3Mg2 was generated and Al3Ti_L12 was formed when the ratios of Ti to B4C were 5:1 and 6:1.

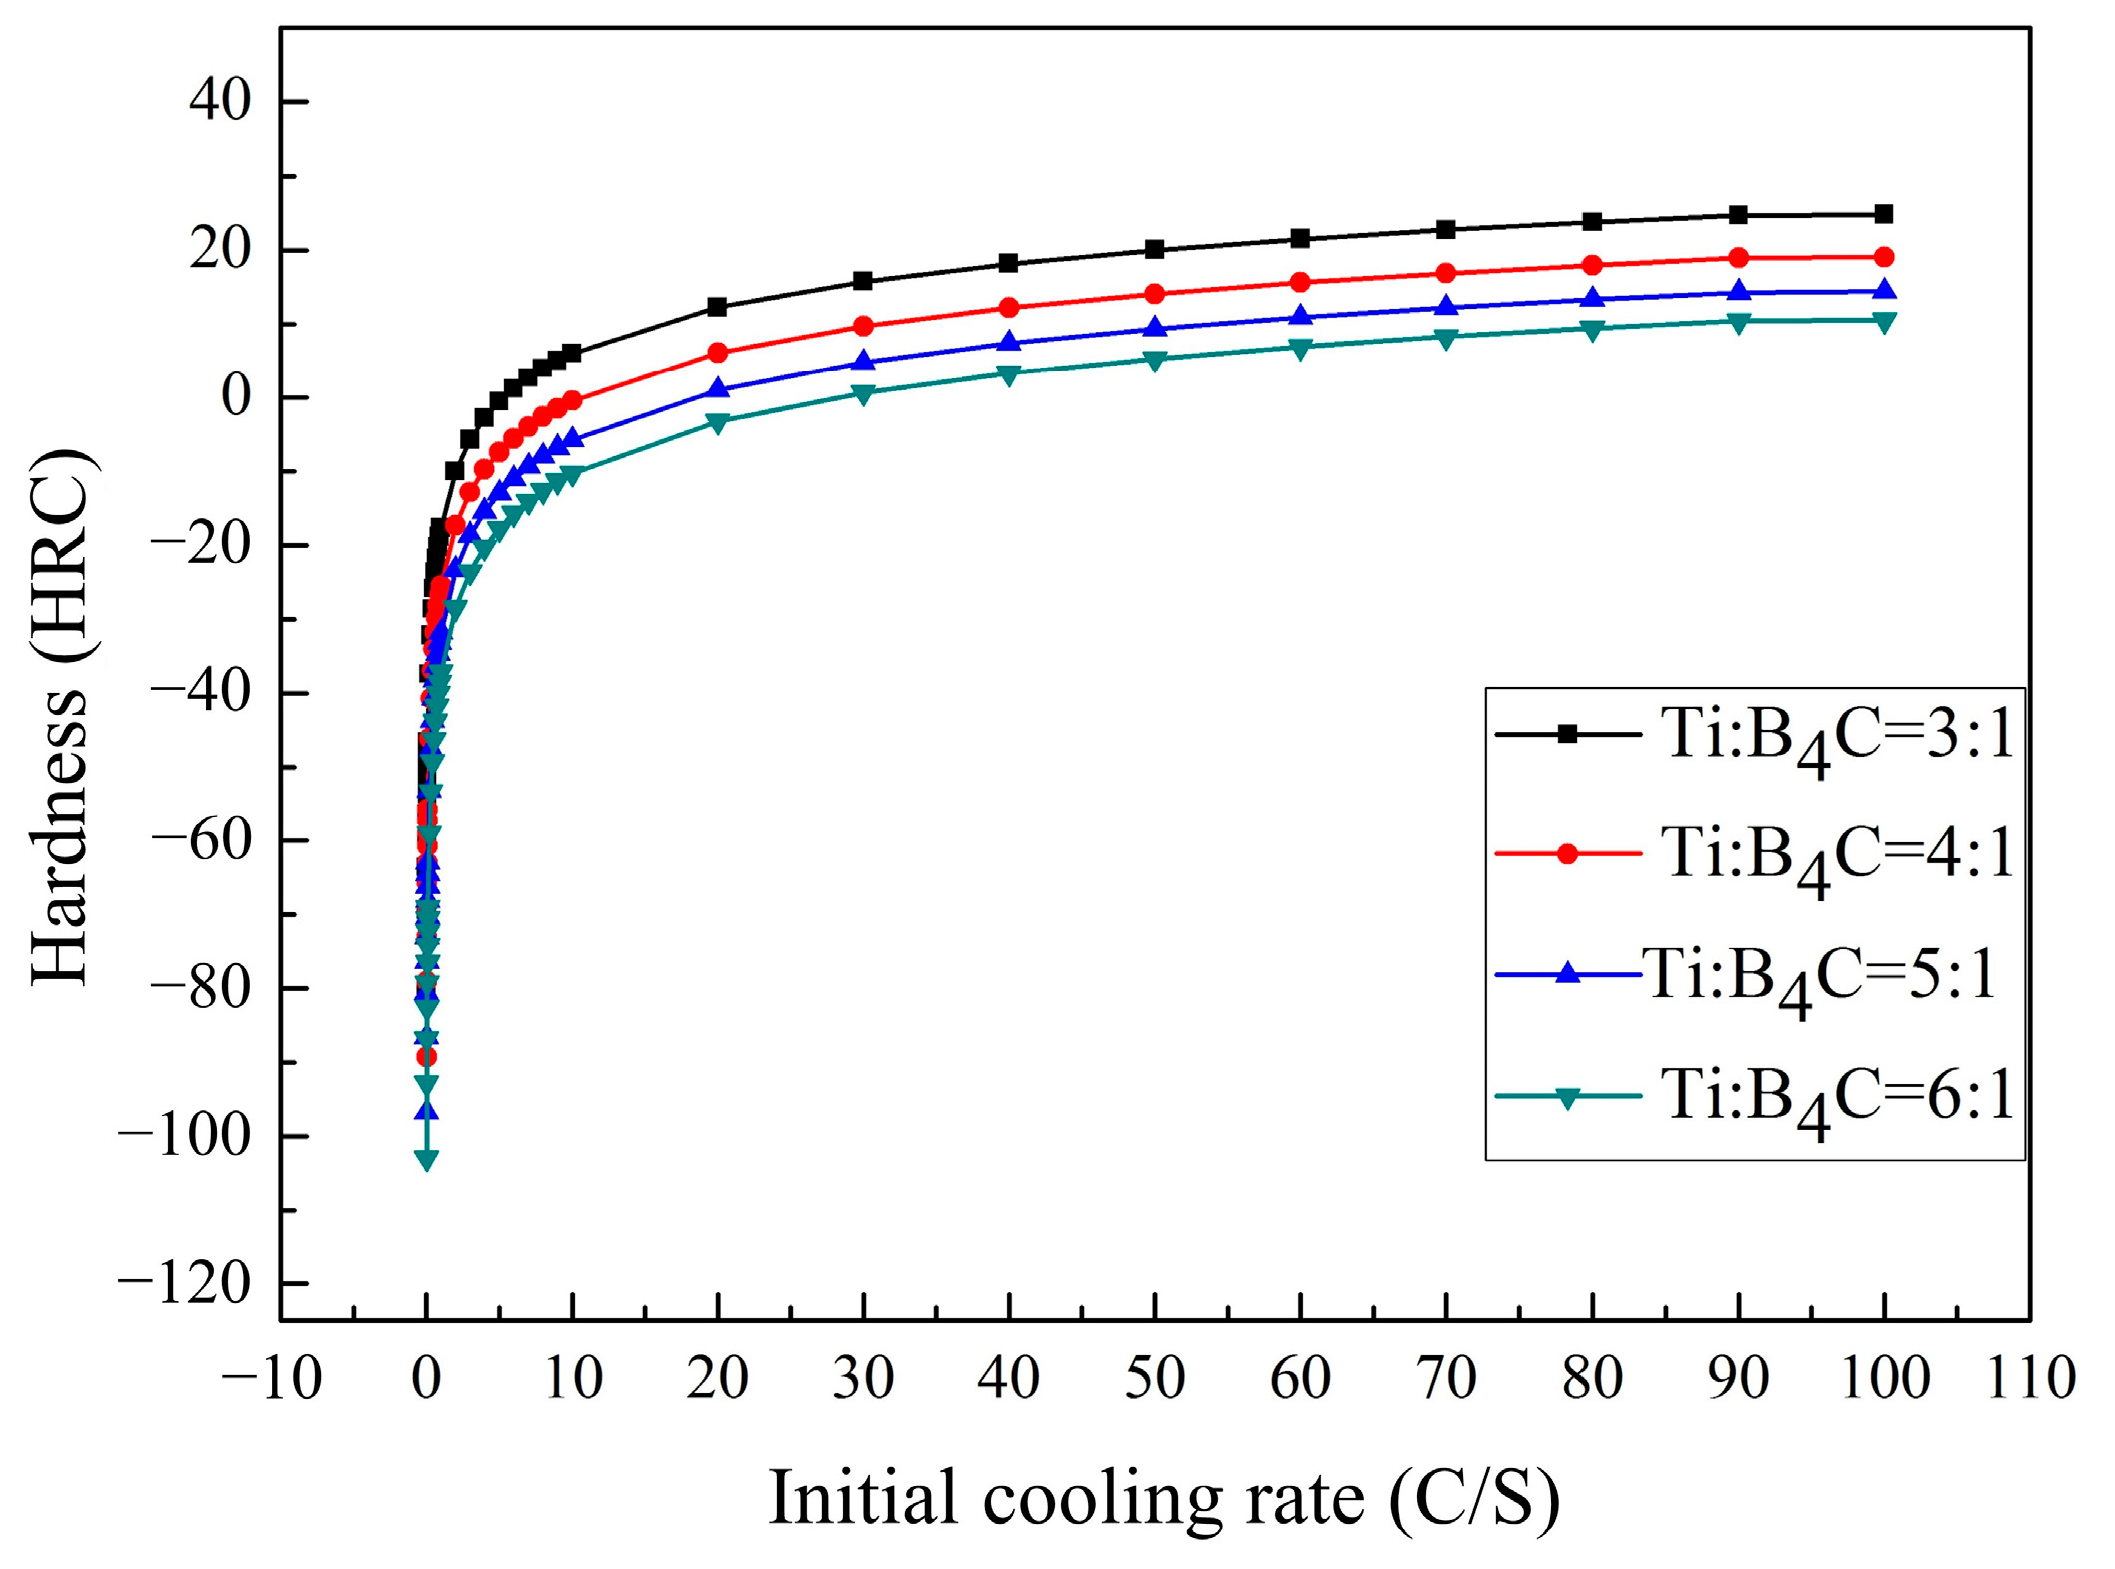
2.5. Simulation of Coating Hardness

Hardness is an important indicator of the performance of TiC+Al3Ti reinforced aluminum coatings. The hardness of the coatings was simulated with consideration of different cooling rates and ratios of Ti to B4C, and the results are shown in Figure 5. It is clear that the faster cooling rate forms a coating with a higher hardness. With an increase in the ratio of Ti to B4C, the hardness of the coating decreases gradually.

3. Experiments

3.1. Materials and Methods
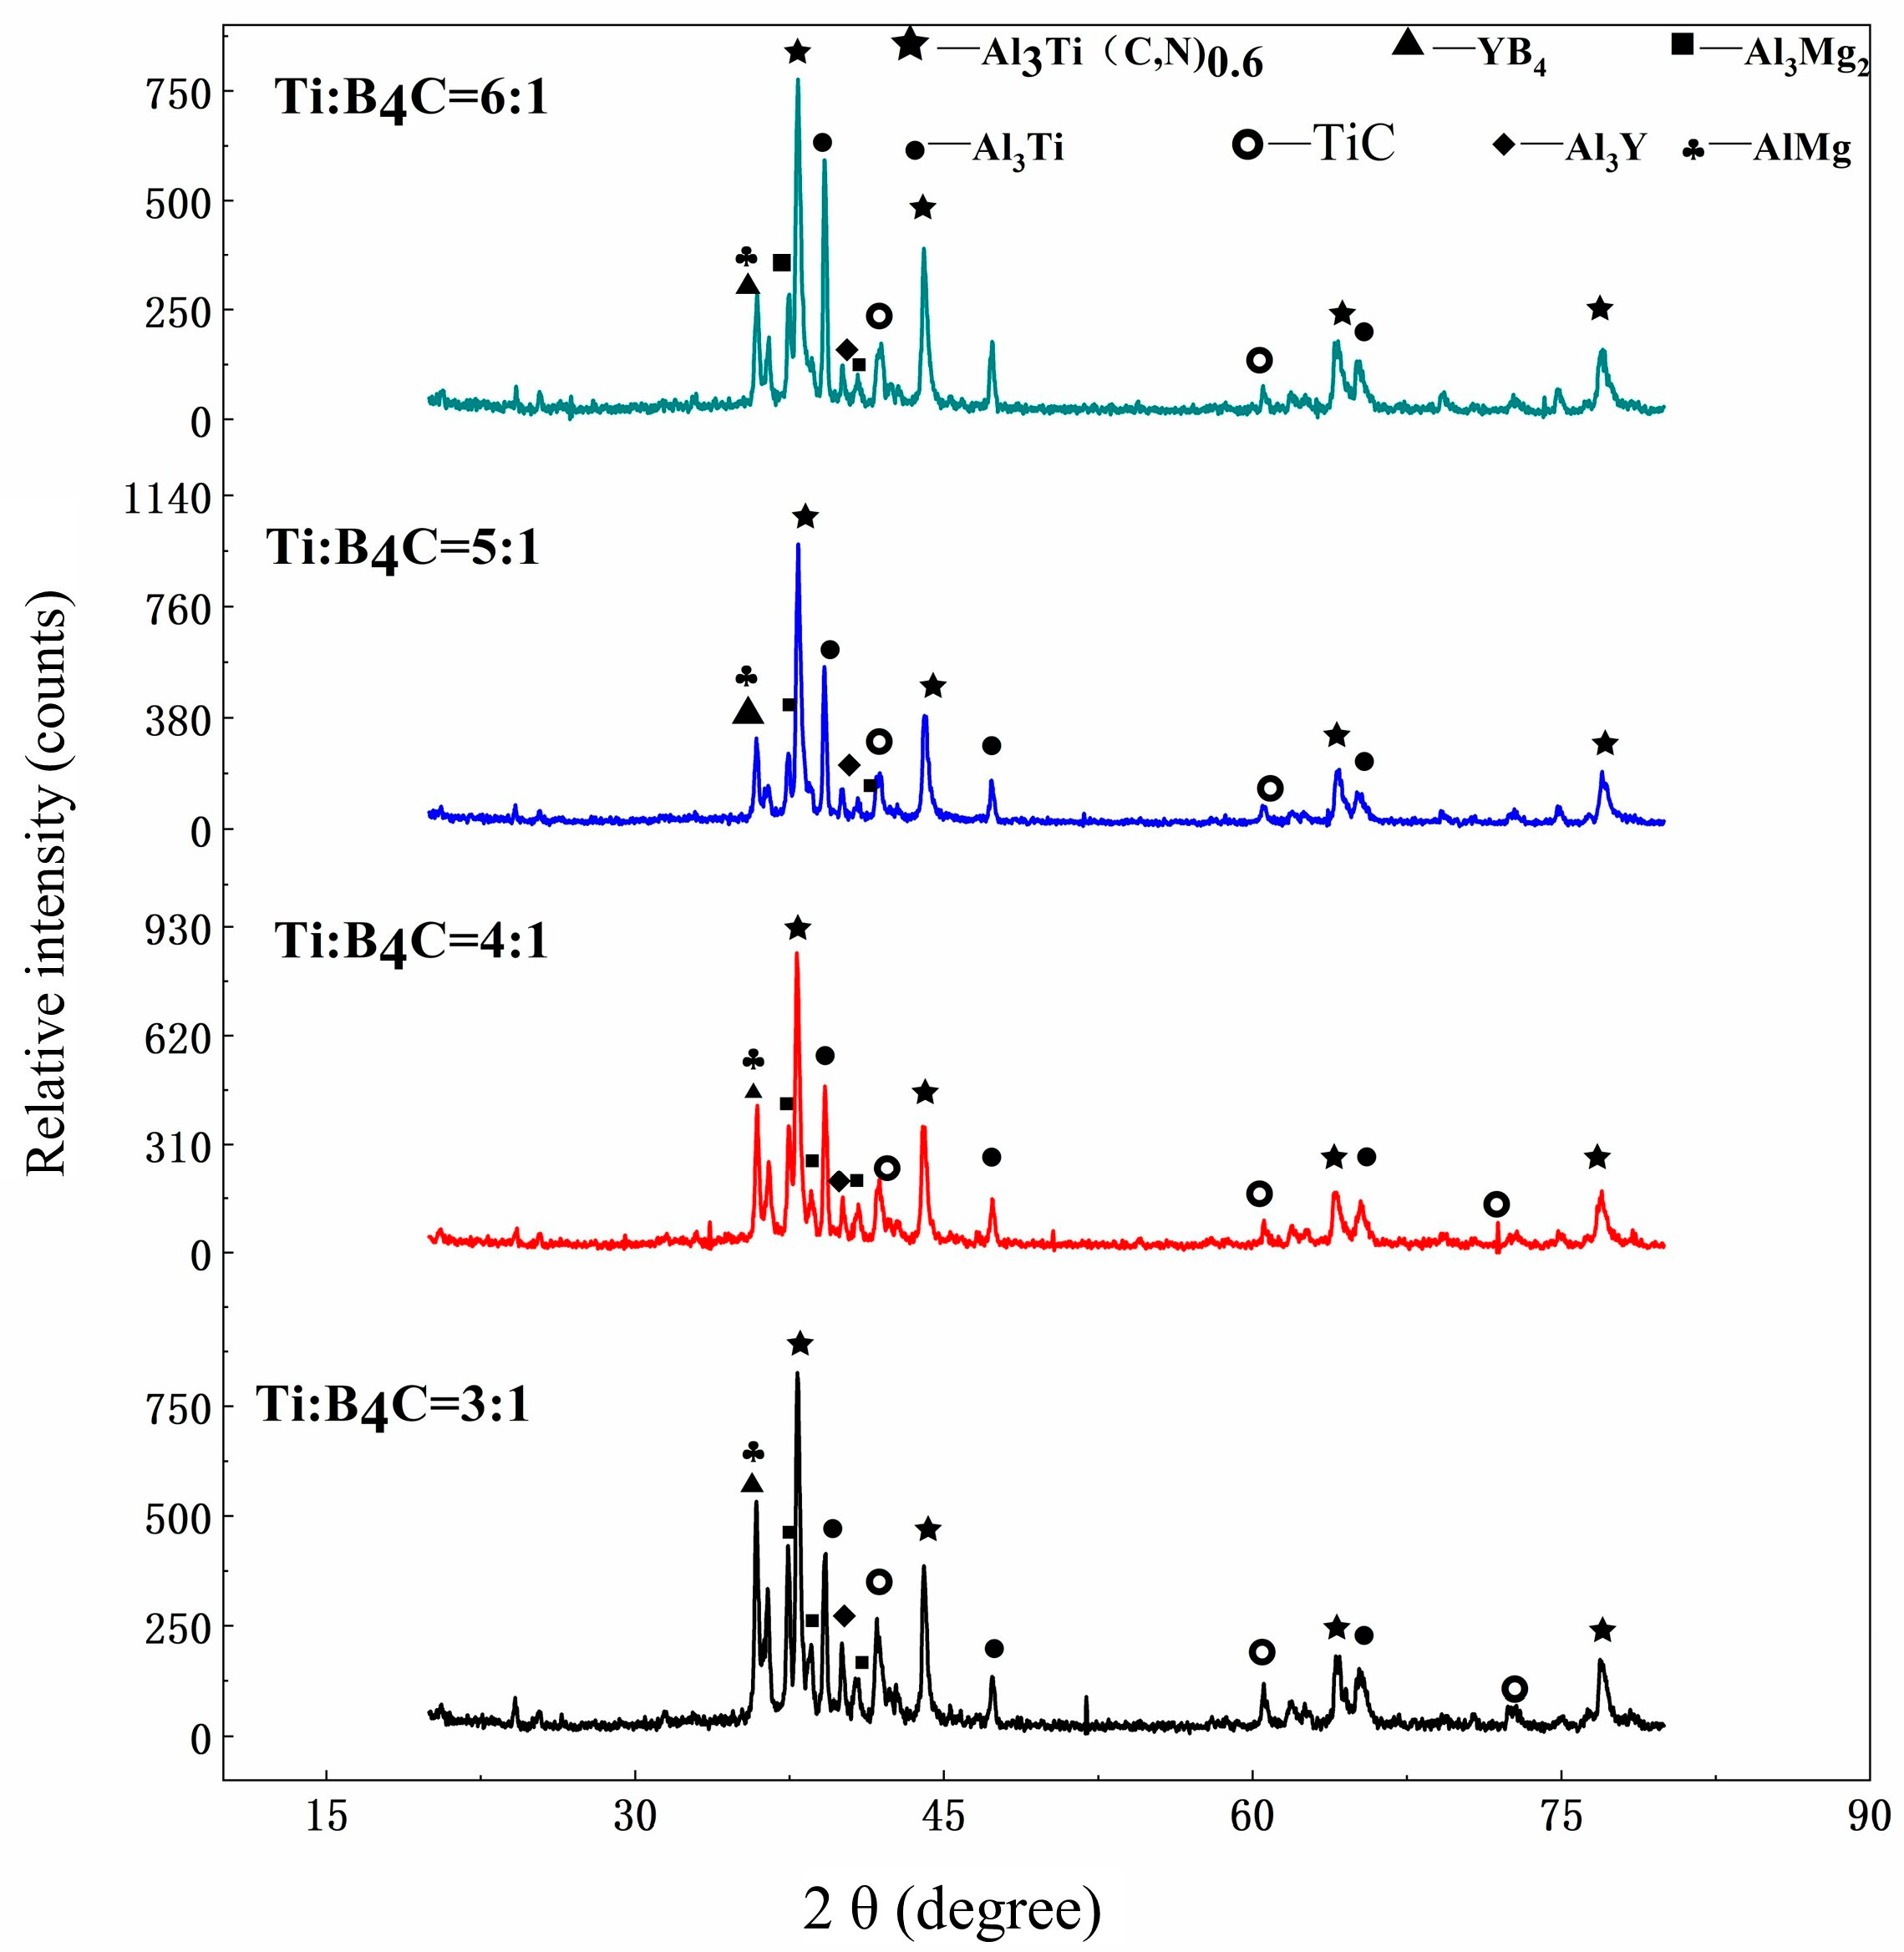
In order to verify the simulation results and study the properties of the coating, corresponding experiments were performed. The substrate material used in these experiments was the AZ91D magnesium alloy and the dimension of the substrate was 20 mm in length, 15mm in width and 4mm in thickness. The chemical composition of AZ91D magnesium alloy is shown in Table 1. The surface of the substrate was polished using metallographic sandpaper and cleaned using an alcohol solution prior to the experiments.
Al (99.99% purity, 8 μm), Ti (99.99% purity, 48 μm), B4C (purity, 3 μm) and Y2O3 were selected as the pre-alloyed powders for laser cladding. The weight percentage of the Ti+B4C mixed powder was 25%, and the weight percentage of the Y2O3 powder was 1.5%. The ratios of Ti to B4C were 3:1, 4:1, 5:1, and 6:1. The Al+Ti+B4C+Y2O3 powder was mixed for 40 min in a grinding bowl, and a water glass was used as the binder. The thickness of the pre-coating layer was 0.5 mm.
The laser cladding experiments were carried out using a 0.4 KW pulsed Nd:YAG laser with a beam diameter of 1 mm. The parameters of the laser are shown in Table 2. Ar with a gas flow of 9 L/min was used as a shielding gas during the laser cladding process.
The cross sections of the laser-clad samples were characterized by a JSM-6510 scanning electron microscope incorporated with an energy-dispersive spectrometer (20 kV, WD = 10.0 mm). The microstructural changes in the cross sections of the samples’ coatings were studied. The morphology and quantity of the in situ phase were studied according to the results of scanning electron microscopic analysis. A D/MAX-RB X-ray diffractometer was used to analyze the phase composition of the coating surface. The Cu target was used as the X-ray source with a voltage of 40 kV and a current of 100 mA. Before detection, the unmelted part on the surface of each sample was removed to ensure that only the coated area was left on the surface. The scanning speed was 3°/min, and the scanning angle was 20–80°. After detection, the phase type of the tested samples’ surface was determined by comparing the d value (interplanar spacing) and intensity corresponding to the X-ray diffraction spectrum of the tested sample with data in the PDF card. The microhardness at different distances from the coating surface was tested by a DHV-1000 Vickers microhardness tester under a load of 0.98 N, and the test time was 15 s. For each distance, three points were selected for measurement, and the average value of these three points was taken as the final hardness value. The corrosion potential, corrosion current density, and polarization curve were detected in 1.5% NaCl solution using a rst 5200 electrochemical workstation.

3.2. Phase Analysis

The X-ray diffraction pattern of the coatings with different ratios of Ti and B4C is shown in Figure 6. The phases in the coatings with different amounts of Ti powder were similar, and AlTi3(C, N)0.6, Al3Mg2, Al3Ti, TiC, YB4, Al3Y, and AlMg were found in the coatings.
During laser cladding, the pre-alloyed powders were melted and B4C particles were decomposed into B and C elements, which rapidly diffused with the stirring of the molten pool. Since Ti is a strong carbide-forming element, the decomposed C elements reacted with Ti to form a TiC ceramic phase. The Y elements from Y2O3 reacted with Al to form Al3Y. Since there is no Y element in the Al alloy module in the JMatPro software, the Y element does not appear in the simulation results. An Al3Ti strengthening phase was also formed in the coating through the chemical reaction between Al and Ti elements. A small amount of the matrix was melted into the coating and reacted with Al to form Al–Mg compounds. This is consistent with the simulation results of the transition zone. As shown in Figure 6, the intensity of Al3Ti increases gradually as the ratio of Ti to B4C increases from 3:1 to 6:1. In contrast, the intensity of the TiC ceramic phase is basically the same in coatings with different Ti contents. This is consistent with the simulation results. Therefore, as the Ti content in the mixed powder increases and more Ti reacts with Al to form an Al3Ti hard phase. The presence of Al3Ti and TiC improves the hardness and wear resistance of the coatings. However, excessive hard phases will increase the crack tendency of the coating [25], which may reduce the overall performance of coatings. The morphology of the hard phase in the coatings also has a great influence on the properties of the coatings. When comparing the X-ray diffraction pattern and the simulation results, it could be observed that TiB2 was not present in the coatings. This is because a large amount of Ti elements was used to form TiC, Al3Ti, and AlTi3(C, N)0.6. The decomposed B elements reacted with Y to form YB4. In the process of laser cladding, the B elements might evaporate. As a result, the B elements were not detected by X-ray diffraction.

3.3. Microstructure

The microstructural images and elemental distribution of the coating (Ti:B4C = 3:1) are shown in Figure 7. Among the subfigures, Figure 7b–d shows the distribution images of the surface elements in Figure 7a. As shown in Figure 7, a crack-free and high standard metallurgical bonded coating is formed. In Figure 7b, the Mg elements are found to diffuse from the substrate to the coating and Mg–Al alloy compounds are formed in the coating.
The upper, middle, and lower parts of the coating (Ti: B4C = 3:1) were magnified for detailed investigation, and the results are shown in Figure 8a,c,e. Figure 8b,d,f show the corresponding element distribution. The distribution of the element content at points 1–5 in Figure 8 is shown in Table 3. Fine particles and phases can be seen in Figure 8, which were caused by the rapid heating and cooling rate of the laser cladding [26], and the growth rate of the generated reinforcing phase was suppressed. Bright white precipitates, gray precipitates and black dotted precipitates were found in the coating. Combined with EDS and XRD results, it could be inferred that the bright white precipitates were TiC ceramic phases (point 1 and point 3), the gray precipitates were Al3Ti hard phases (point 4 and point 5), and the black spot precipitates were Al–Mg compounds.
When comparing the upper, middle, and lower parts of the coating, the number of precipitates in the coating decreased gradually from the top to the bottom of the cladding layer. The dilution of the cladding layer by the melted base metal caused a graded distribution of the elements, which helped to form the different distribution of precipitates in the coating. The size of the Al3Ti phases increased gradually from the top to the bottom, which might be caused by the different cooling rates and thermal conductivities in the selected points of the coating [27]. Therefore, at the interface between the coating and the substrate, the number of precipitates decrease and the size of precipitates increase.
The microstructure of the coatings with different Ti contents is shown in Figure 9. As can be observed in Figure 9, the amount of bright white precipitates (TiC) decreases with the increase in Ti content. The number of gray precipitates (Al3Ti) increases gradually. This is consistent with the simulation results. According to the Al–Ti binary phase diagram, AlTi3 metal compounds are formed when the mass fraction of Al atoms ranges from 35% to 51%. AlTi metal compounds are formed when the Al atom mass fraction is in the range of 35% to 51%. Al3Ti is formed when the Al content is greater than 62% and the temperature drops to 1350 °C. In this study, the Al content in all samples was greater than 62%. Therefore, Al3Ti was formed. With an increase in the Ti content, more Al3Ti hard phase was formed. The root cause of this phenomenon is that the Gibbs free energy of Al3Ti becomes increasingly smaller as the ratio of Ti to B4C gradually increases. The more negative the Gibbs free energy is, the easier it is to form Al3Ti. As the ratio of Ti to B4C increases, the content of C in the coating gradually decreases. This results in insufficient C element in the coating to react with Ti to form TiC. According to the simulation results, the Gibbs free energy of TiC gradually increases with an increase in the ratio of Ti to B4C. Therefore, the content of TiC is reduced.
Ti elements in the liquid phase gradually increase when the ratio of Ti to B4C increases. More Ti elements react with Al to form an Al3Ti hard phase during laser cladding. The morphology of Al3Ti in the coating gradually grows from dots to rods. Since Al3Ti has a DO22-type square crystal structure, it preferentially grows in the direction of the largest density and easily forms rod-like structures. The growth rate of the lattice in the other directions is relatively slow. Al3Ti rapidly grows in the direction of the maximum density at the tip to form an X-shaped structure. During the experiments, when the ratio of Ti to B4C was 5:1, the Al3Ti rod-like structures gathered together to form a petal-like organization. When the ratio of Ti to B4C was 4:1, a large amount of TiC agglomerated in the lower part of the coating. This led to a serious non-uniform distribution of the hard phase in the coating.
According to the above analysis, it can be concluded that the following chemical reactions occur in the molten bath during laser cladding:
B 4 C 4 B + C
2 Y 2 O 3 4 Y + 3 O 2
3 A l + T i A l 3 T i
T i + C T i C
3 A l + 2 M g A l 3 M g 2
B + Y Y B 4
3 A l + Y A l 3 Y
Al +   Mg AlMg

4. Coating Performance Test

4.1. Micro-Hardness

The micro-hardness distribution of the coatings with different ratios of Ti to B4C is shown in Figure 10. As can be seen from the figure, the hardness of the coatings is much higher than that of the AZ91D magnesium alloy substrate. On the one hand, the microstructure of the coatings is fine due to rapid cooling during the laser processing. This plays a role in grain strengthening. On the other hand, the TiC ceramic phase and Al3Ti metal compounds were formed in situ in the coatings. The micro-hardness of the coating is increased due to the presence of these hard phases. According to the analysis of the previous simulation results, it can be concluded that the hard phase was formed during the laser cladding process, which greatly improves the hardness of the coating. Compared to the simulation results, higher hardness was measured in the experiment. This is because the hardness value calculated in the simulation is the average hardness of the coatings. The hardness value obtained in the experiment is the average of the hardness of the points.
The distribution of the micro-hardness of the coating was seriously uneven when the ratio of Ti to B4C was 4:1. The appearance of this phenomenon has a significant relationship with the distribution of the microstructure of the coating. According to the analysis of the microstructure, a large amount of TiC in the in situ ceramic phase agglomerated together when the ratio of Ti to B4C was 4:1. Obviously, the part where the hard phase was concentrated had higher micro-hardness. This is why the hardness distribution was not uniform. When the ratio of Ti to B4C was 6:1, the micro-hardness of the coating reduced. Al3Ti in the coating greatly increased due to the excessive addition of Ti. Al–Ti intermetallic compounds have a large brittleness value at room temperature. Thus, cracks are easily generated during the cooling process. Therefore, the performance of the coating will be reduced due to the excessive generation of Al3Ti. When the ratio of Ti to B4C was 5:1, the coating had the highest average hardness (273 HV), which is about 4.6 times higher than that of the magnesium alloy substrate and the distribution of micro-hardness was even.

4.2. Corrosion

The corrosion potentials and corrosion current densities of the coatings with different ratios of Ti to B4C are shown in Table 4. The polarization curve of the coatings is shown in Figure 11. The results show that the corrosion potentials of the coatings satisfy the following rule: Ecorr(AZ91D) < Ecorr(Ti:B4C = 4:1) < Ecorr(Ti:B4C = 6:1) < Ecorr(Ti:B4C = 5:1) < Ecorr(Ti:B4C = 3:1). The corrosion current densities of the coating satisfy the following rule: Icorr(Ti:B4C = 3:1) > Icorr(Ti:B4C = 4:1) > Icorr(Ti:B4C = 6:1) > Icorr(Ti:B4C = 5:1). It was found that the corrosion resistance of the laser-treated coatings was better than that of the substrate. When the ratio of Ti to B4C was 5:1, the corrosion potential of the coating was −1.012 V, which is higher than that of the substrate (−1.455 V). The corrosion current density of the coating was 2.501 × 10⁻⁶, which is two orders lower than that of AZ91D. Thus, the corrosion resistance of the coating increased. On the one hand, the corrosion resistance of Al–Mg compounds was better than that of the magnesium alloy substrate. On the other hand, the corrosion potential of the coating increased due to the generation of TiC and Al3Ti in the coating.

5. Conclusions

(1)
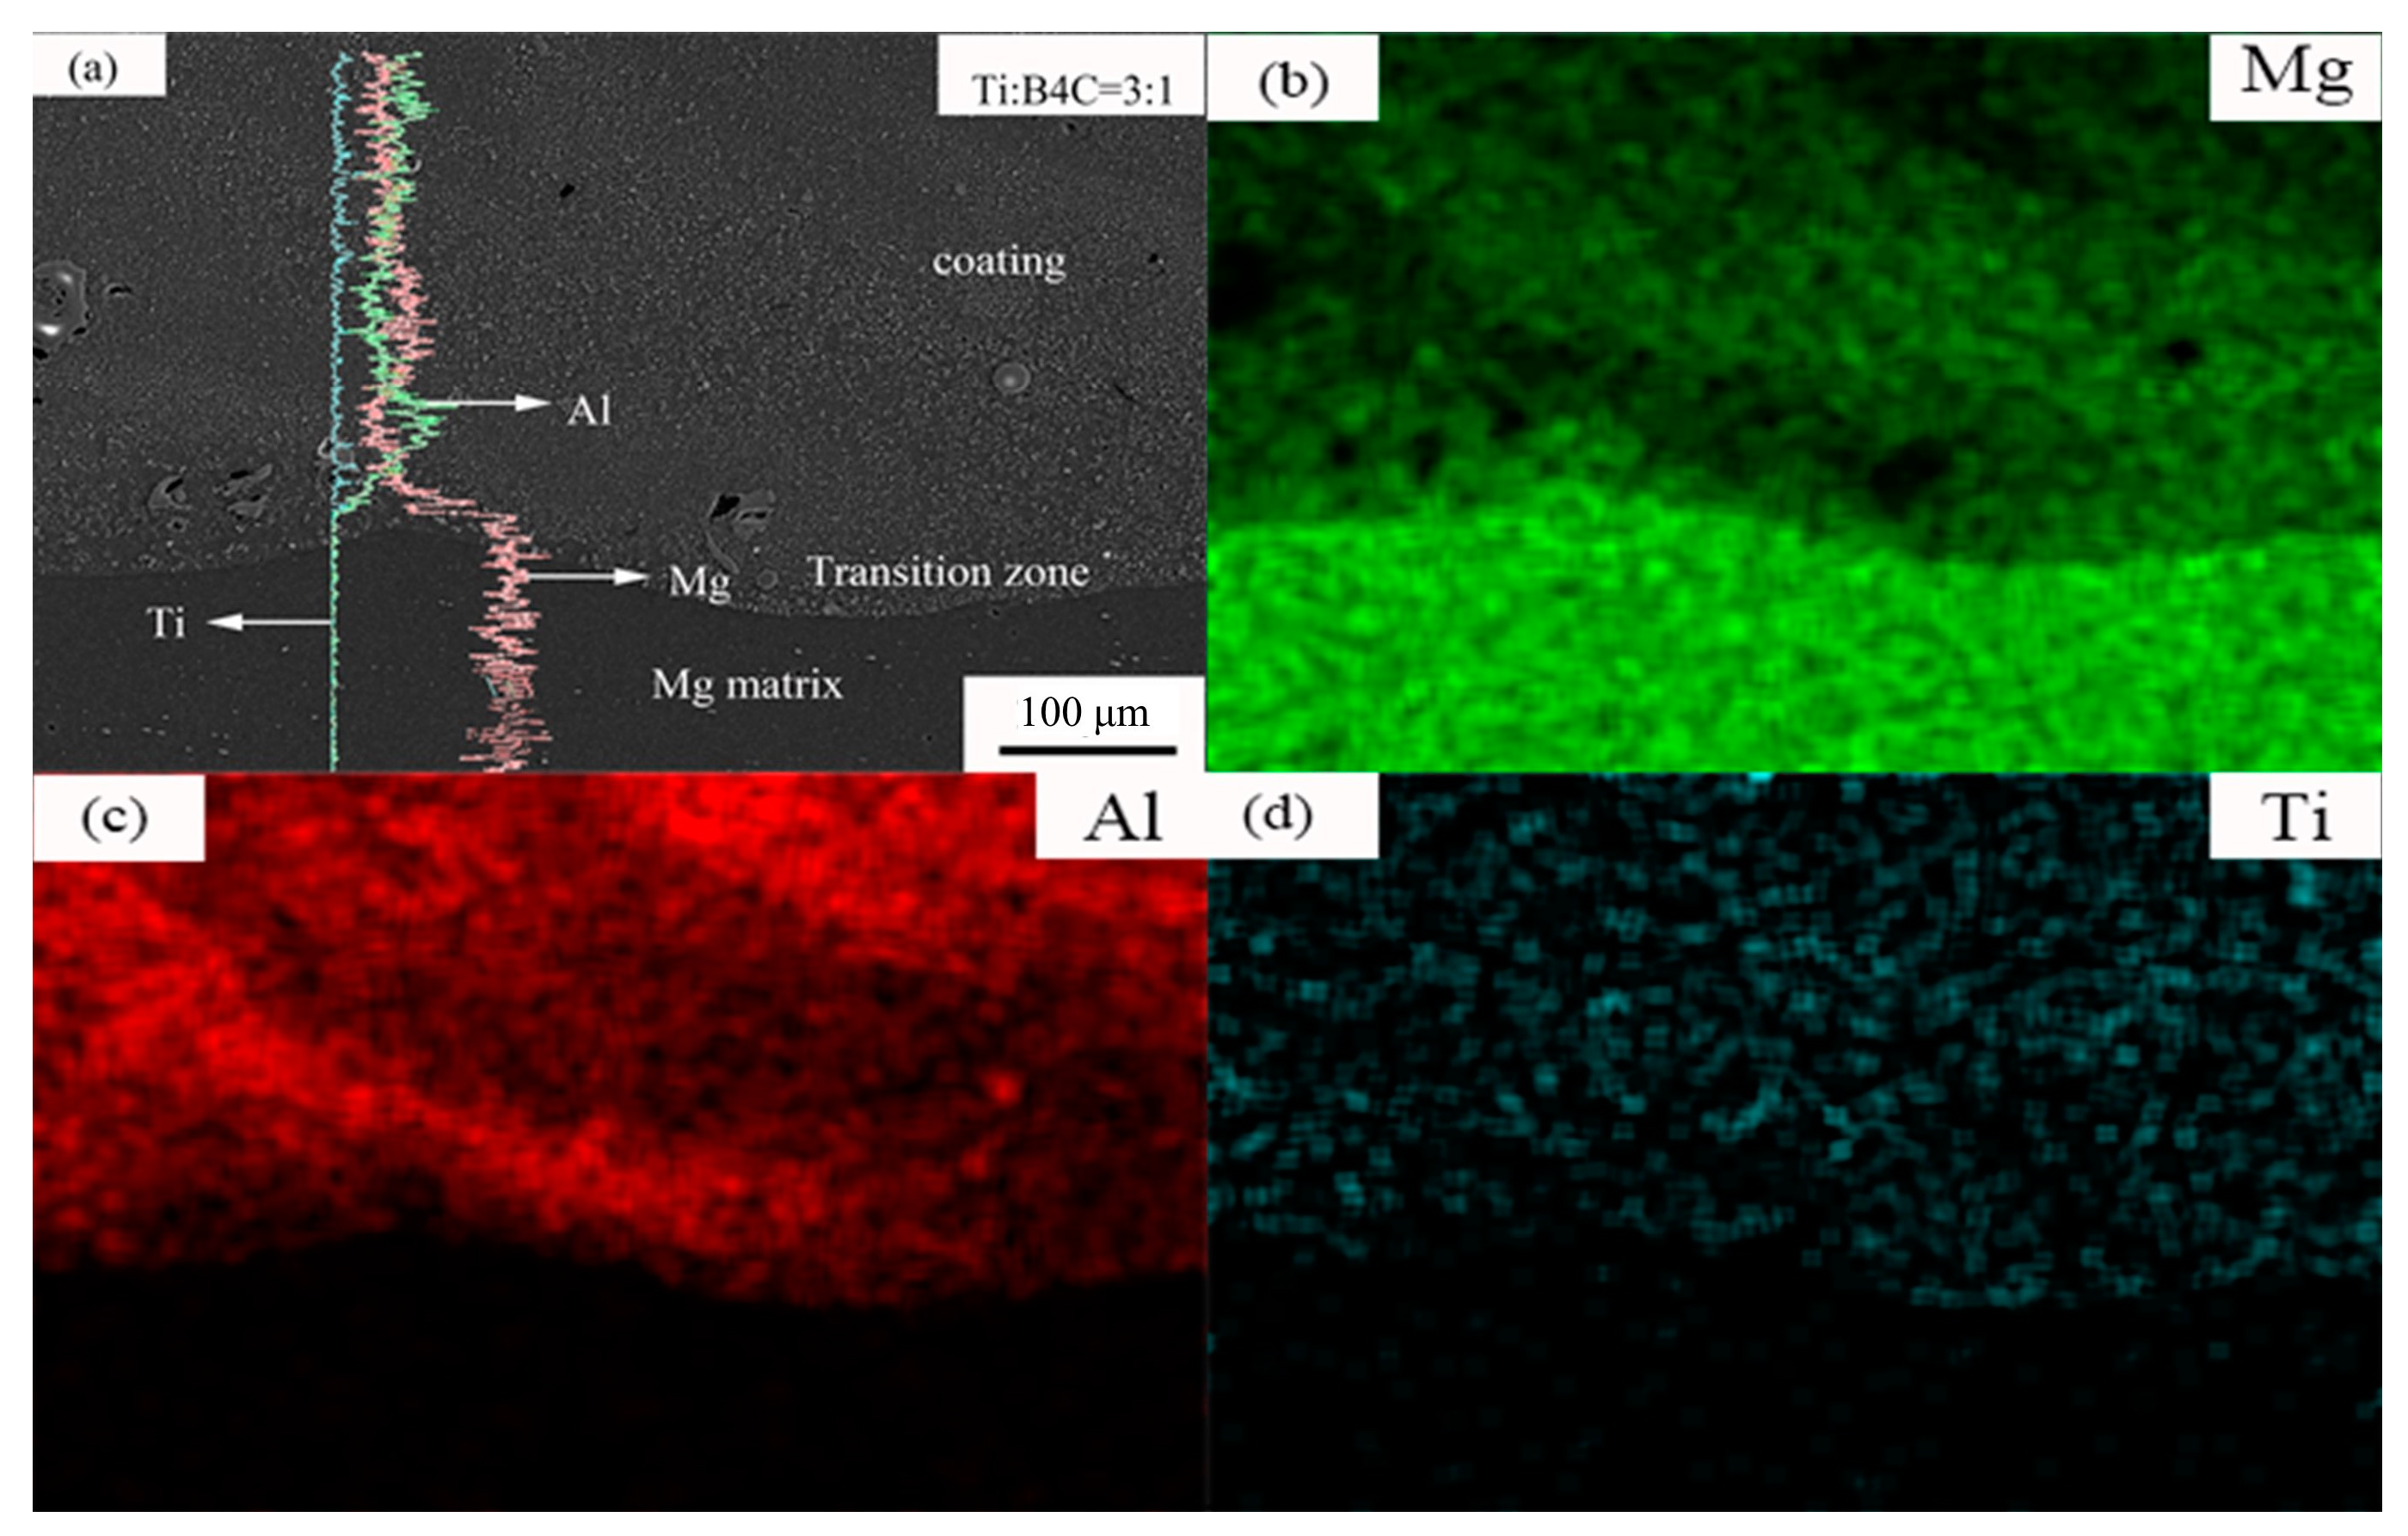
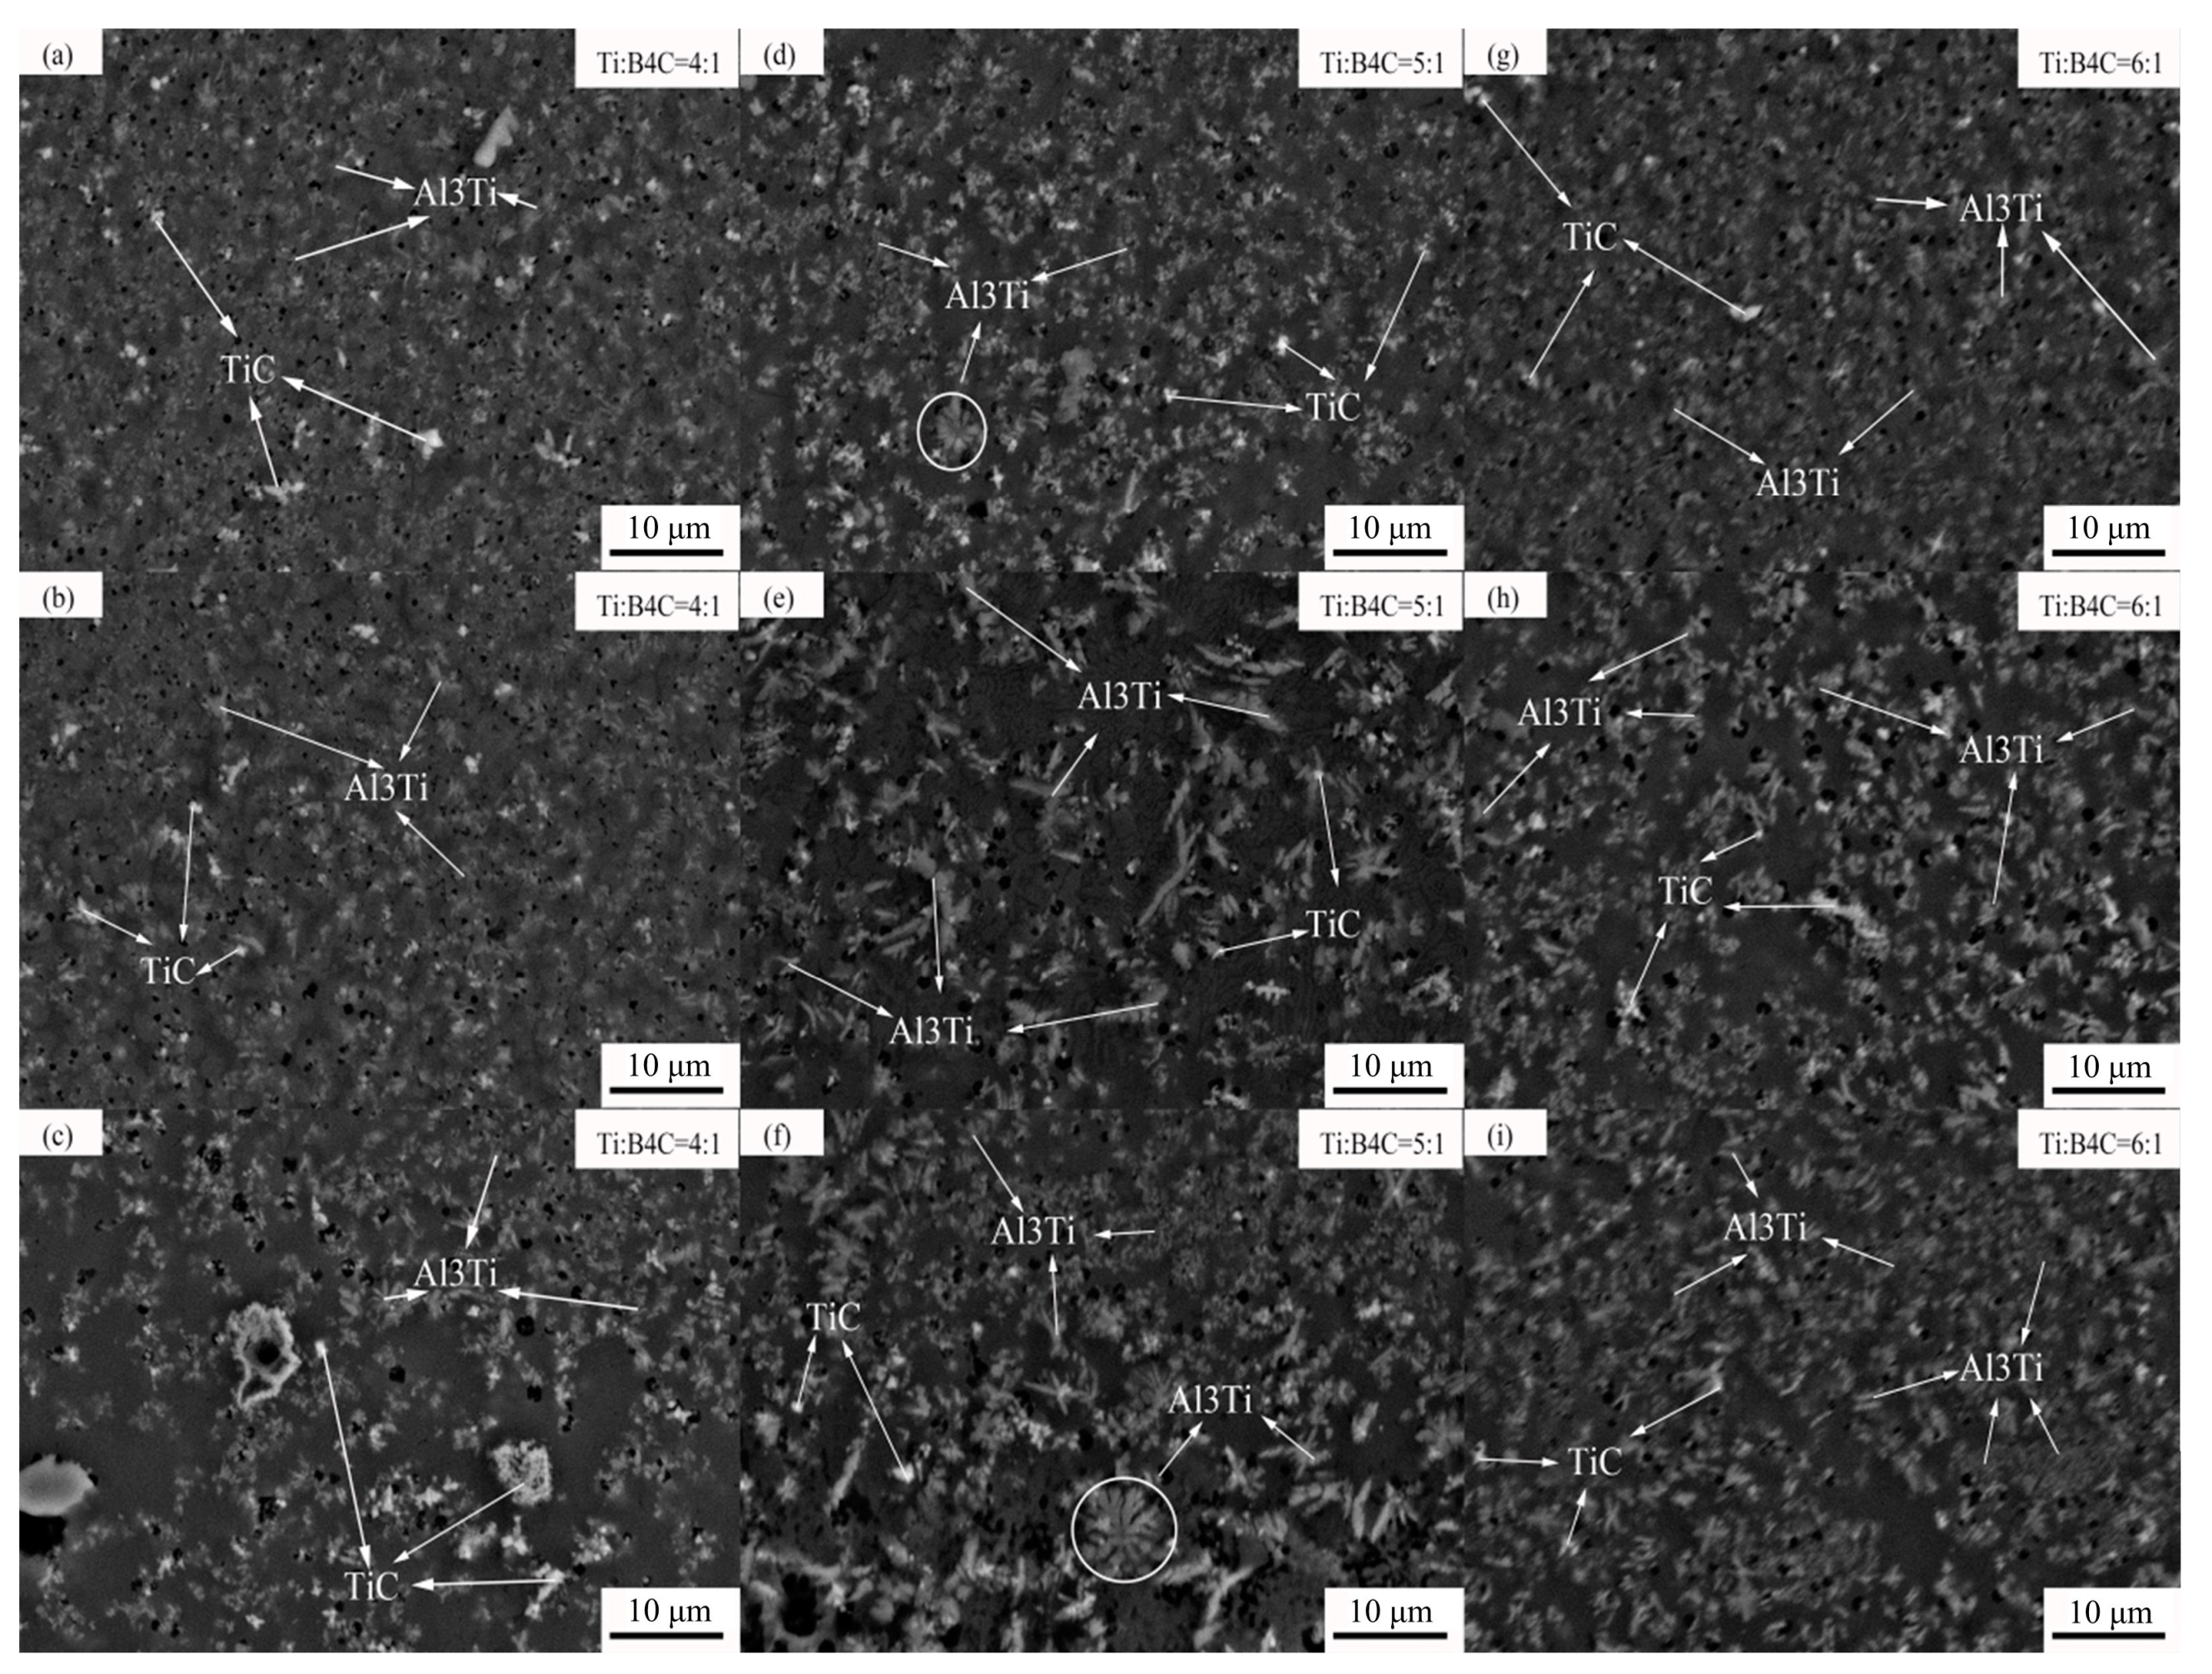
According to the simulation results, TiB2, TiC, Al3Ti_DO22, Al4C3 and Al were formed in the laser-cladded coating while Al, TiB2, TiC, Al3Ti_DO22, Al4C3, and Al3Mg2 were formed in the transition zone between the coating and the base metal. Al3Ti_L12 was formed in the transition zone when the ratio of Ti to B4C was 5:1 or 6:1. With an increase in the ratio of Ti to B4C, the content of Al3Ti gradually increased. In contrast, the content of TiC gradually decreased.
(2)
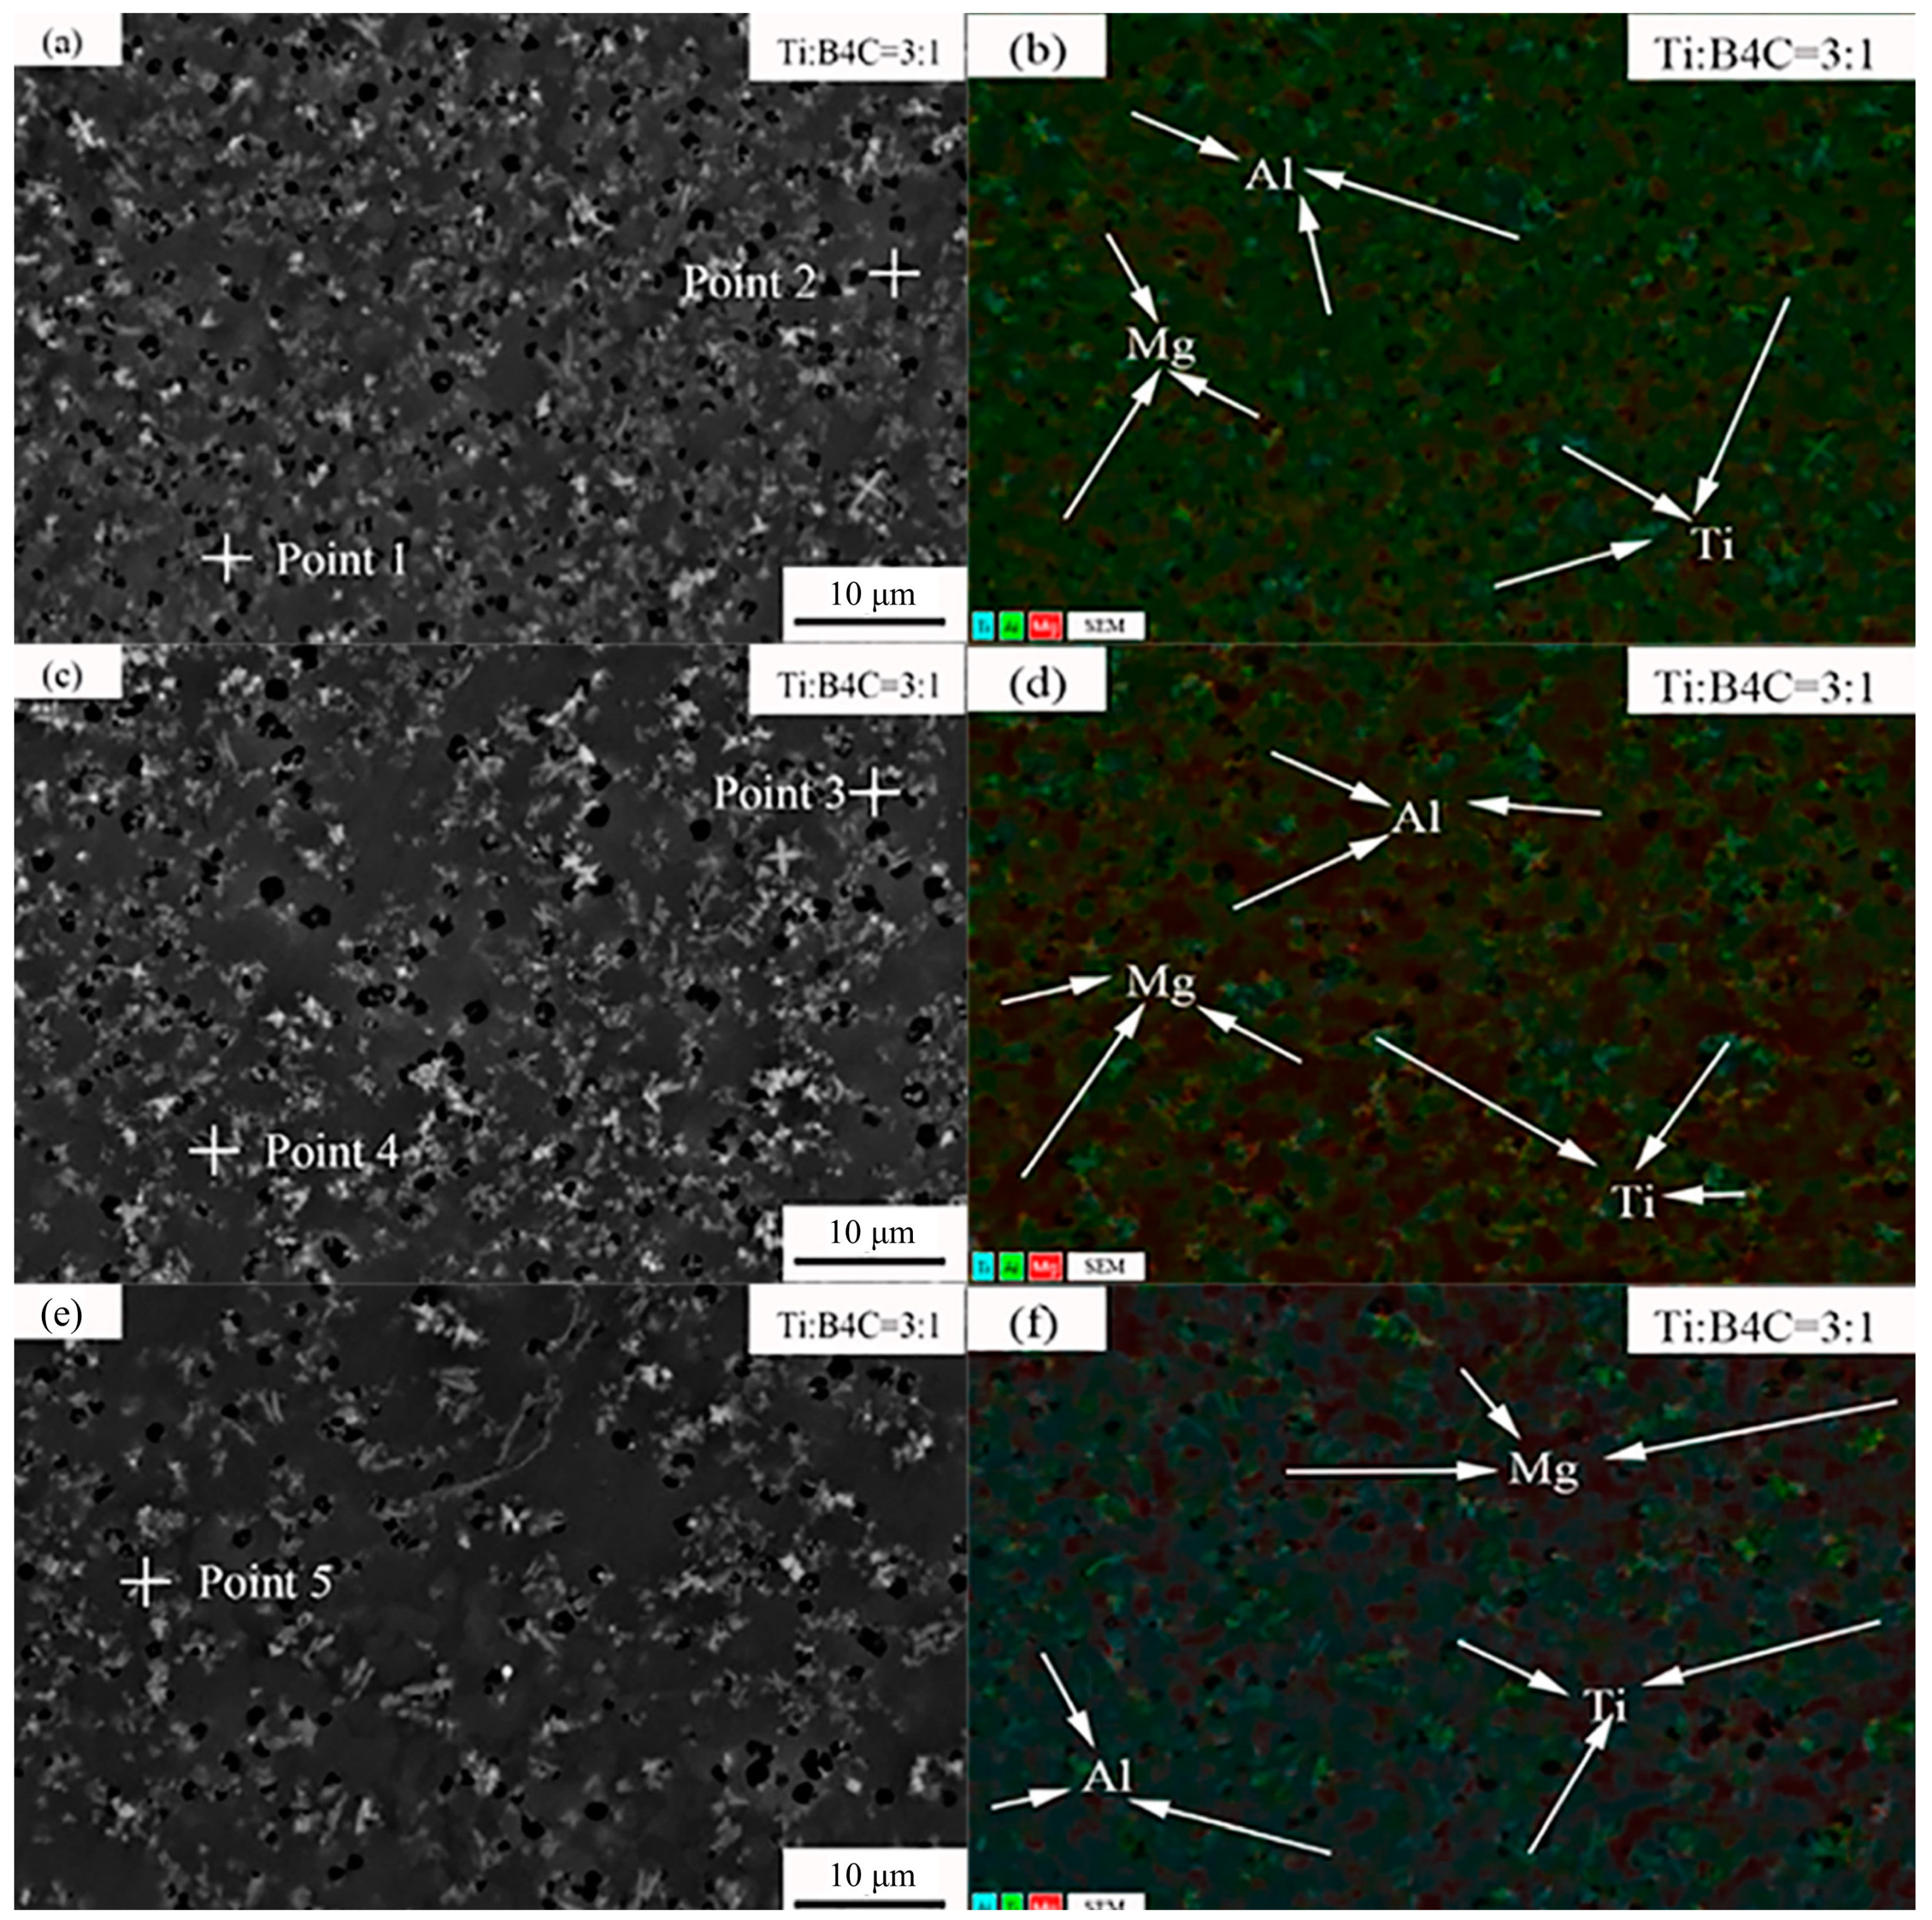
An Al–TiC coating was successfully prepared via laser cladding on AZ91D magnesium alloy. A TiC ceramic phase was generated in situ during laser cladding. AlTi3(C, N)0.6, AlMg, Al3Mg2, Al3Ti, TiC, and Al3Y were found in the coating. When the ratio of Ti to B4C was 5:1, the coating had the best performance.
(3)
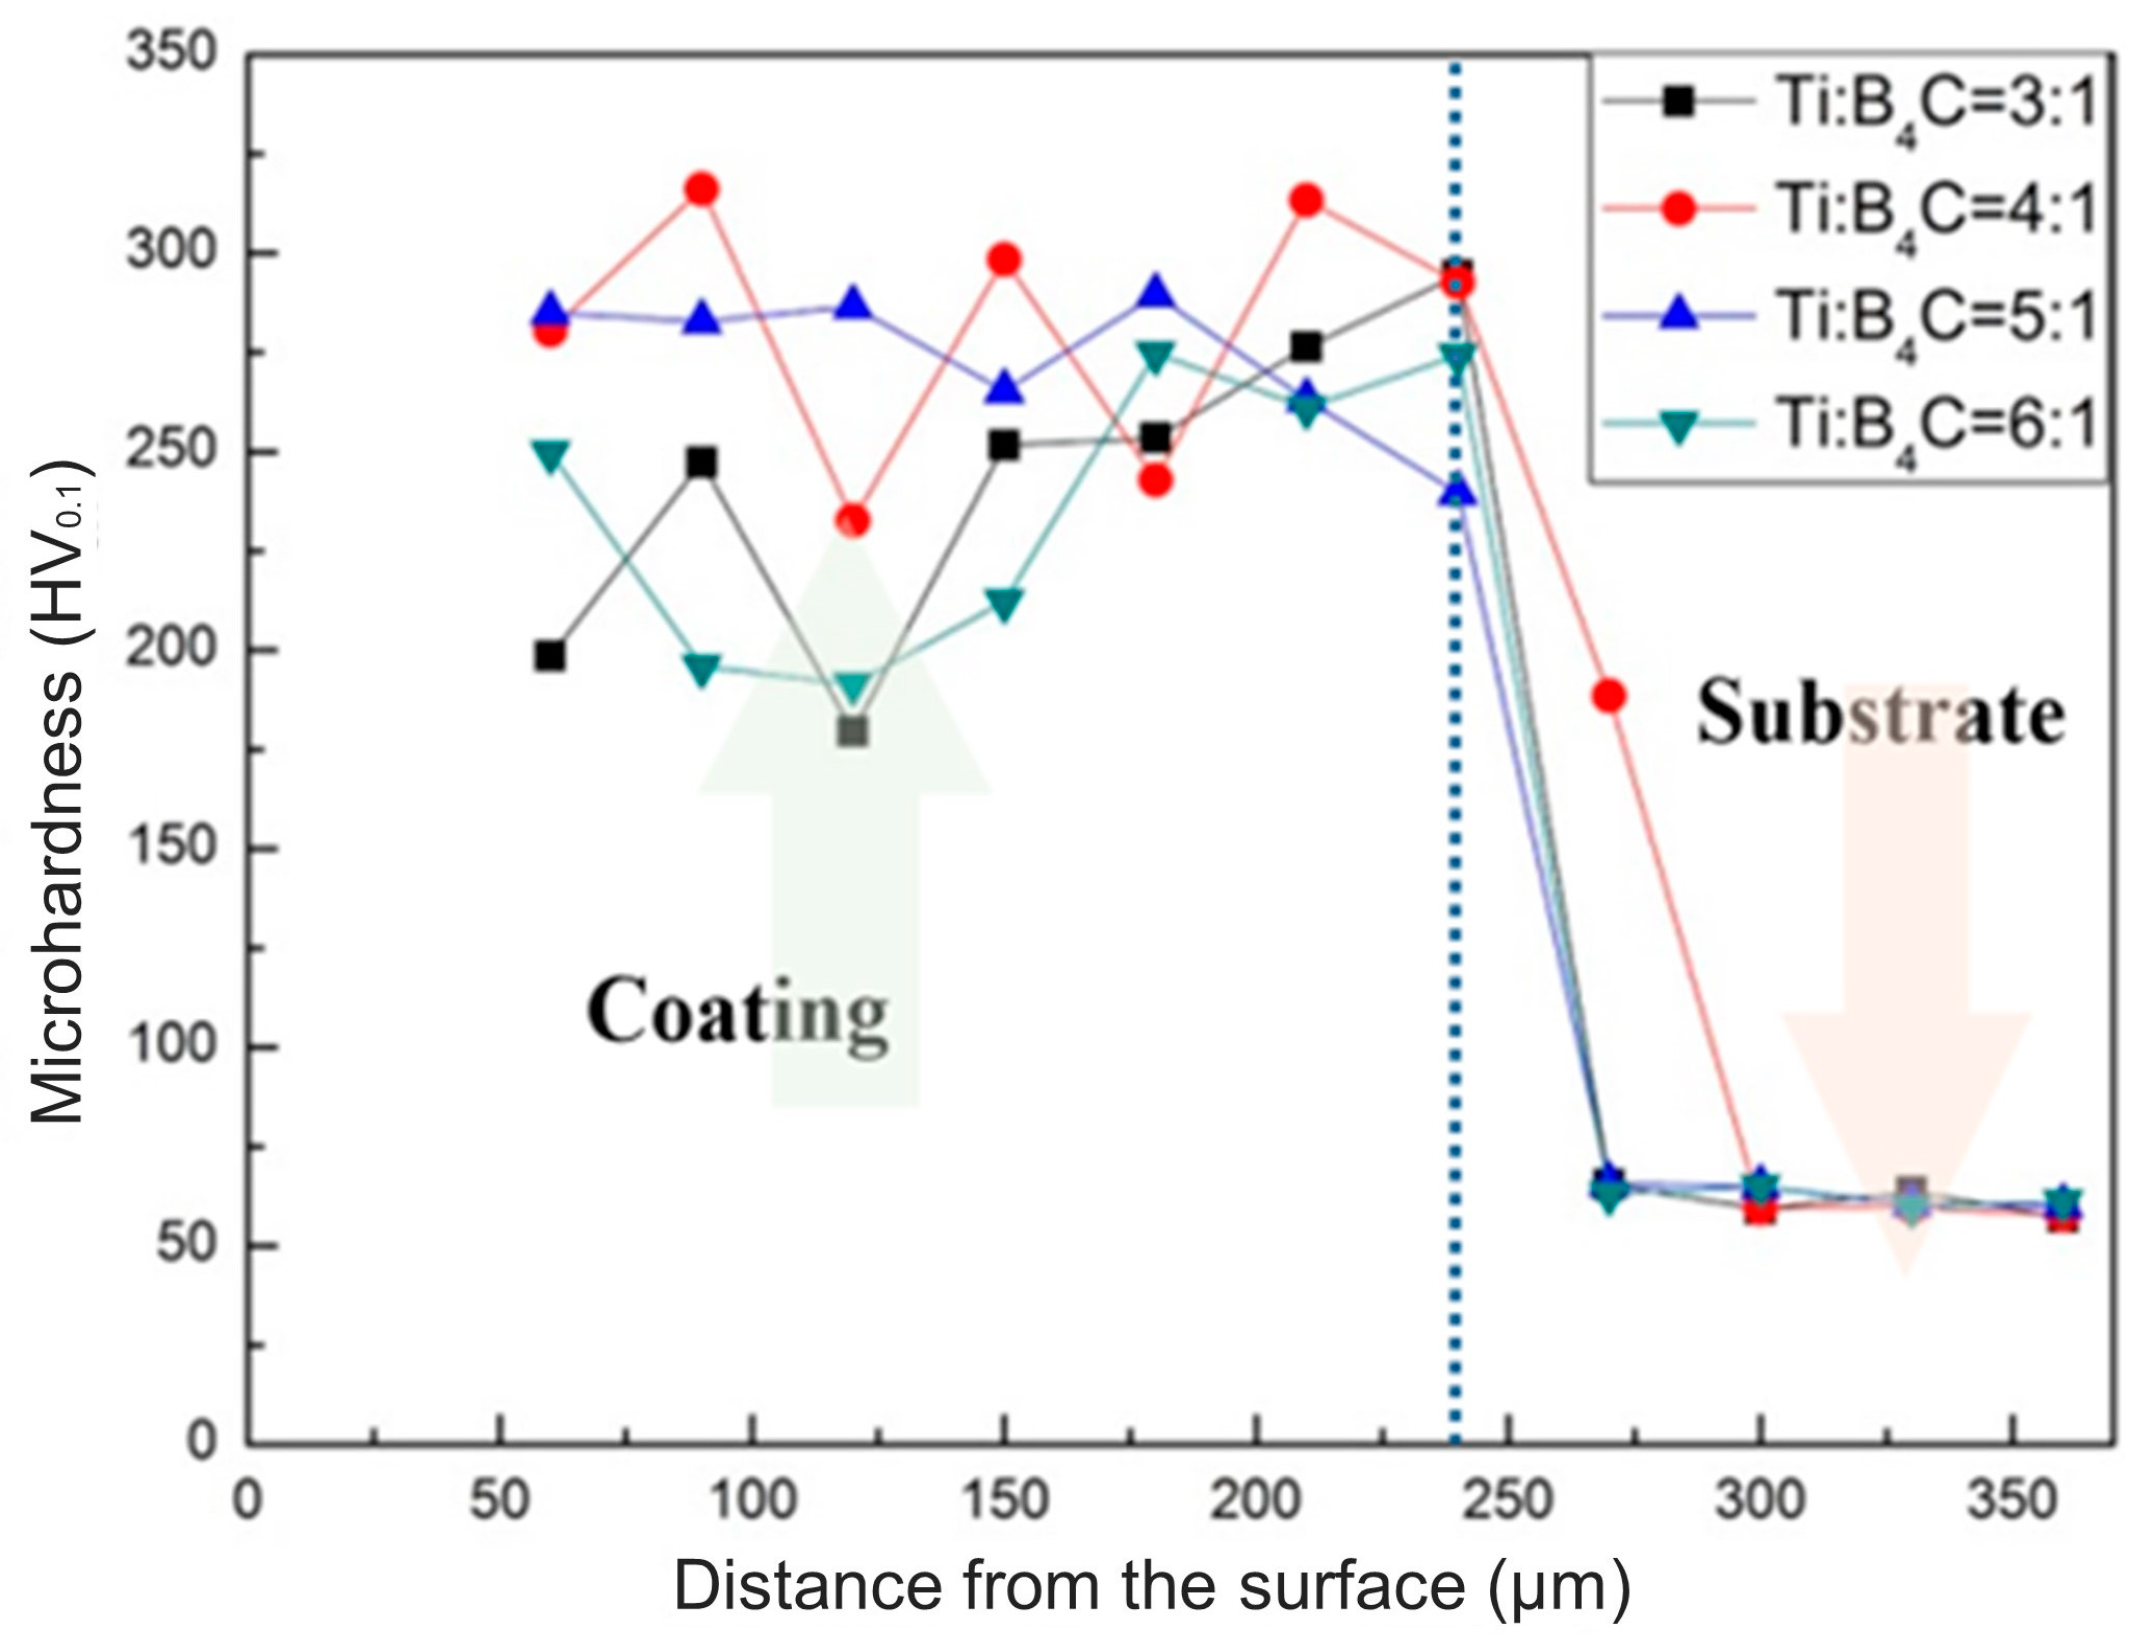
The hardness of the coating was much higher than that of the AZ91D magnesium alloy substrate. According to the simulation results, the hard phase was generated during the laser cladding process, which greatly improved the performance of the coating. When the ratio of Ti to B4C was 5:1, the coating had the highest average hardness (273 HV), which is about 4.6 times higher than that of the magnesium alloy substrate.
(4)
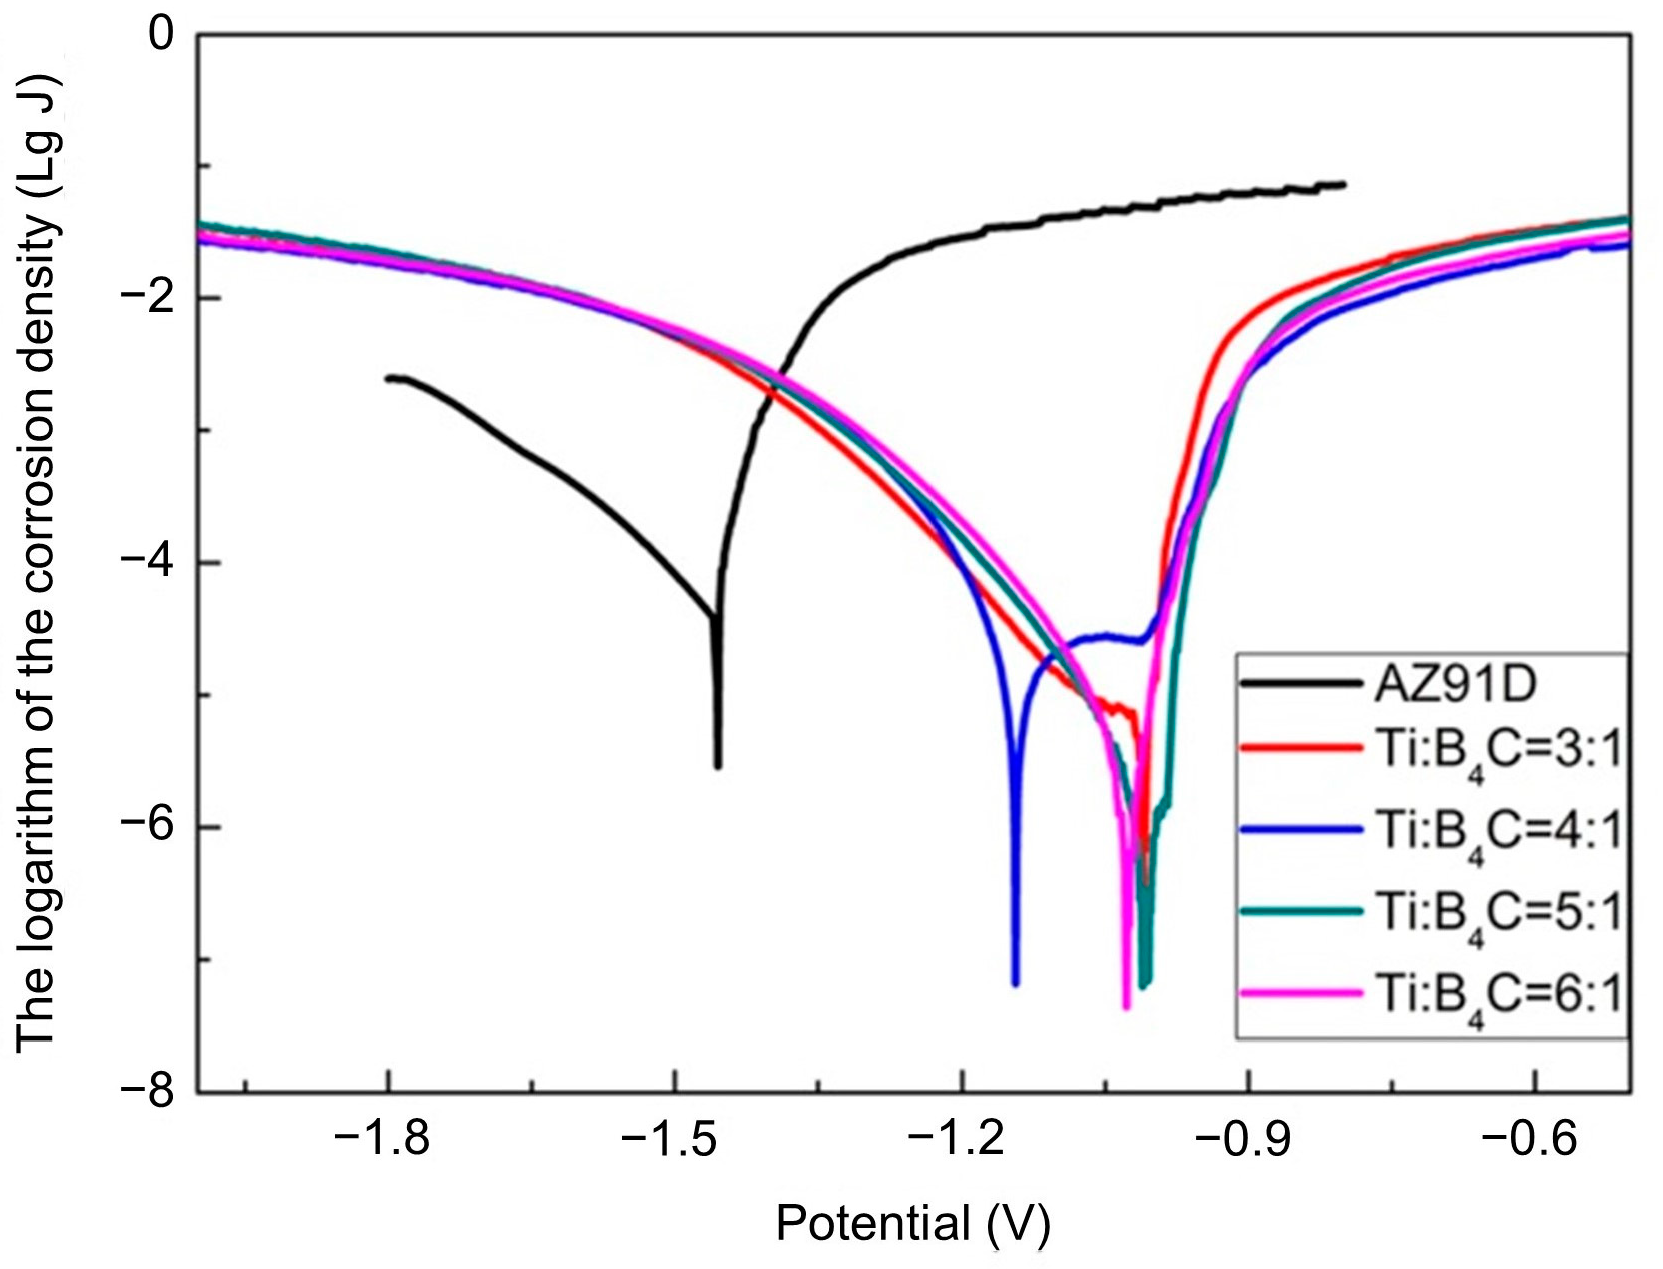
The corrosion resistance of the laser-treated coating was better than that of the substrate. When the ratio of Ti to B4C was 5:1, the corrosion potential of the coating was −1.012 V, which is higher than that of the substrate (−1.455 V). The corrosion current density of the coating was 2.501 × 10⁻⁶, which is two orders lower than that of AZ91D magnesium alloy.

Author Contributions

Conceptualization, L.Y. and Z.L.; software, L.Y. and Y.J.; validation, L.Y.; formal analysis, L.Y.; investigation, L.Y.; data curation, L.Y.; writing—original draft preparation, L.Y.; writing—review and editing, Z.L., B.L., Y.Z. and S.W. All authors have read and agreed to the published version of the manuscript.

Funding

This research was funded by Scientific and Technological Innovation Programs of Higher Education Institutions of Shanxi Province (2022L494); The Collaborative Innovation Center for the modified application of lightweight materials; Shanxi Province Science and Technology Innovation Young Talents Team (202204051001005), Natural Science Research Project of Shanxi Province (202103021224306), Basic Research Program of Shanxi Province (No. 202203021212507), Scientific and technological innovation projects of colleges and universities in Shanxi Province (No. 2022L493).

Data Availability Statement

The raw/processed data required to reproduce these findings cannot be shared at this time as the data also form part of an ongoing study.

Acknowledgments

The work described in this paper was financially supported by The Collaborative Innovation Center for the modified application of lightweight materials; Shanxi Province Science and Technology Innovation Young Talents Team (202204051001005).

Conflicts of Interest

The authors declare no conflict of interest.

References

  1. Riquelme, A.; Rodrigo, P. An Introduction on the Laser Cladding Coatings on Magnesium Alloys. Metals 2021, 11, 1993. [Google Scholar] [CrossRef]
  2. Istrate, B.; Munteanu, C.; Antoniac, I.V.; Lupescu, S.C. Current Research Studies of Mg-Ca-Zn Biodegradable Alloys Used as Orthopedic Implants-Review. Crystals 2022, 12, 1468. [Google Scholar] [CrossRef]
  3. Zhang, Y.Q.; Guo, J.; Xu, G.D.; Li, Z.Y.; Wei, S.Z. Effect of Nd2O3 on microstructure, corrosion and wear properties of laser cladding Zr-based amorphous composite coatings on AZ91D magnesium alloy. Appl. Surf. Sci. 2023, 611, 155587. [Google Scholar] [CrossRef]
  4. Zhang, Y.Q.; Li, Z.Y.; Liu, S.Y.; Wei, S.Z. Al-WC composite coating on AZ91D Mg alloy by low power pulsed laser cladding. Kov. Mater. 2020, 58, 169–179. [Google Scholar] [CrossRef]
  5. Ren, Z.Q.; Zhao, Y.; Han, G.F.; Wang, W.Y.; Zhou, K.B.; He, T.P.; Sun, Y. Laser-Arc Hybrid Cladding of Al-Mg Alloy Coating on AZ80 Mg Alloy: Effect of Laser Beam Oscillations Amplitude. Materials 2022, 15, 7272. [Google Scholar] [CrossRef]
  6. Zhang, Y.Q.; Jin, K.; Li, Z.Y.; Wei, S.Z.; Guo, J. Microstructures, Wear and Corrosion Behaviors of Laser Cladding In Situ Synthetic Al3Ti/AlNi/AlNi3/MgNi2 Composite Coatings on Magnesium Alloy using Al as Middle Layer. J. Mater. Eng. Perform. 2022, 32, 4216–4228. [Google Scholar] [CrossRef]
  7. Yao, H.; Li, Z.Y.; Zhang, Y.Q.; Wei, S.Z.; Xu, G.D.; Yan, S.; Ren, J.L. Study on laser cladding system of the high-entropy alloy layer on the AZ91D magnesium. J. Laser Appl. 2022, 34, 032007. [Google Scholar] [CrossRef]
  8. Li, N.; Wang, Q.; Dong, F.; Liu, X.; Han, P.; Han, Y. Research Progress of Coating Preparation on Light Alloys in Aviation Field: A Review. Materials 2022, 15, 8535. [Google Scholar] [CrossRef]
  9. Wan, X.F.; Tian, C.; Li, Y.; Zhou, J.L.; Qian, S.Q.; Su, L.H.; Wang, L. Effect of Y2O3 Addition on Microstructure and Properties of Laser Cladded Al-Si Coatings on AZ91D Magnesium Alloy. Materials 2023, 16, 338. [Google Scholar] [CrossRef]
  10. Jiang, L.P.; Cui, X.F.; Jin, G.; Tian, H.L.; Tian, Z.M.; Zhang, X.R.; Wan, S.M. Synthesis and microstructure, properties characterization of Ni-Ti-Cu/Cu-Al functionally graded coating on Mg-Li alloy by laser cladding. Appl. Surf. Sci. 2022, 575, 151645. [Google Scholar] [CrossRef]
  11. Qi, Z.W.; Chen, C.Y.; Wang, C.Y.; Zhou, Z.K.; Zhou, J.; Long, Y. Effect of different laser wavelengths on laser cladding of pure copper. Surf. Coat. Technol. 2023, 454, 129181. [Google Scholar] [CrossRef]
  12. Baltatu, M.S.; Sandu, A.V.; Nabialek, M.; Vizureanu, P.; Ciobanu, G. Biomimetic Deposition of Hydroxyapatite Layer on Titanium Alloys. Micromachines 2021, 12, 1447. [Google Scholar] [CrossRef] [PubMed]
  13. Liu, Y.Y.; Gao, S.Y.; Zhao, W. Laser cladding of Mg-Zn-Y-Zr alloy using Al with different ratios of micro- and nano-SiC powder. J. Mater. Sci. 2020, 55, 13270–13293. [Google Scholar] [CrossRef]
  14. Yue, T.M.; Su, Y.P. Laser cladding of SiC reinforced Zr65Al7.5Ni10Cu17.5 amorphous coating on magnesium substrate. Appl. Surf. Sci. 2008, 255, 1692–1698. [Google Scholar] [CrossRef]
  15. Carcel, B.; Sampedro, J.; Ruescas, A.; Toneu, X. Corrosion and wear resistance improvement of magnesium alloys by laser cladding with Al-Si. Phys. Procedia 2011, 12, 353–363. [Google Scholar] [CrossRef] [Green Version]
  16. Muvvala, G.; Karmakar, D.P.; Nath, A.K. In-process detection of microstructural changes in laser cladding of in-situ Inconel 718/TiC metal matrix composite coating. J. Alloys Compd. 2018, 740, 545–558. [Google Scholar] [CrossRef]
  17. Liu, Y.H.; Ding, J.Q.; Qu, W.C.; Su, Y.; Yu, Z.S. Microstructure Evolution of TiC Particles In Situ, Synthesized by Laser Cladding. Materials 2017, 10, 281. [Google Scholar] [CrossRef] [Green Version]
  18. Wang, D.G.; Chen, C.Z.; Ma, J.; Zhang, G. In situ synthesis of hydroxyapatite coating by laser cladding. Colloids Surf. B Biointerfaces 2008, 66, 155–162. [Google Scholar] [CrossRef]
  19. Li, J.; Luo, X.; Li, G.J. Effect of Y2O3 on the sliding wear resistance of TiB/TiC-reinforced composite coatings fabricated by laser cladding. Wear 2014, 310, 72–82. [Google Scholar] [CrossRef]
  20. Li, Q.T.; Lei, Y.P.; Fu, H.G. Laser cladding in-situ NbC particle reinforced Fe-based composite coatings with rare earth oxide addition. Surf. Coat. Technol. 2014, 239, 102–107. [Google Scholar] [CrossRef]
  21. Savalani, M.M.; Ng, C.C.; Li, Q.H.; Man, H.C. In situ formation of titanium carbide using titanium and carbon-nanotube powders by laser cladding. Appl. Surf. Sci. 2012, 258, 3173–3177. [Google Scholar] [CrossRef]
  22. Pu, Y.; Guo, B.; Zhou, J.; Zhang, S.; Zhou, H.; Chen, J. Microstructure and tribological properties of in situ synthesized TiC, TiN, and SiC reinforced Ti3Al intermetallic matrix composite coatings on pure Ti by laser cladding. Appl. Surf. Sci. 2008, 255, 2697–2703. [Google Scholar] [CrossRef]
  23. Yang, L.; Li, Z.; Zhang, Y.; Wei, S.; Liu, F. Al-TiC in situ composite coating fabricated by low power pulsed laser cladding on AZ91D magnesium alloy. Appl. Surf. Sci. 2018, 435, 1187–1198. [Google Scholar] [CrossRef]
  24. Prasanthi, T.N.; Sudha, R.C.; Saroja, S. Explosive cladding and post-weld heat treatment of mild steel and titanium. Mater. Des. 2016, 93, 180–193. [Google Scholar] [CrossRef]
  25. Rai, A.K.; Trpathy, H.; Hajra, R.N.; Raju, S.; Saroja, S. Thermophysical properties of Ni based super alloy 617. J. Alloys Compd. 2016, 698, 442–450. [Google Scholar] [CrossRef]
  26. Park, J.; Lee, S.; Kang, S.; Jeon, J.; Lee, S.H.; Kim, H.K.; Choi, H. Complex effects of alloy composition and porosity on the phase transformations and mechanical properties of powder metallurgy steels. Powder Technol. 2015, 284, 459–466. [Google Scholar] [CrossRef]
  27. Shim, J.-H.; Hwang, B.; Lee, M.-G.; Lee, J. “Invited Paper” Computer-aided alloy designs of grade 600 MPa reinforced steel bars for seismic safety based on thermodynamic and kinetic calculations: Overview. Calphad 2018, 62, 67–74. [Google Scholar] [CrossRef]
Figure 1. The phase composition diagram with different content of (Ti+B4C): (a1,a2) 10%(Ti+B4C); (b1,b2) 15%(Ti+B4C); (c1,c2) 20%(Ti+B4C); (d1,d2) 25%(Ti+B4C); (e1,e2) 30%(Ti+B4C).
Crystals 13 01151 g001
Figure 2. The phase diagram with different ratios of Ti to B4C: (a1,a2) Ti:B4C = 3:1; (b1,b2) Ti:B4C = 4:1; (c1,c2) Ti:B4C = 5:1; (d1,d2) Ti:B4C = 6:1.
Crystals 13 01151 g002
Figure 3. The phase composition diagram of the transition zone: (a1,a2) Ti:B4C = 3:1; (b1,b2) Ti:B4C = 4:1; (c1,c2) Ti:B4C = 5:1; (d1,d2) Ti:B4C = 6:1.
Crystals 13 01151 g003
Figure 4. Gibbs free energy of the coating with different Ti and B4C ratios: (a) Ti:B4C = 3:1; (b) Ti:B4C = 4:1; (c) Ti:B4C = 5:1; (d) Ti:B4C = 6:1.
Crystals 13 01151 g004
Figure 5. Simulation of coating hardness.
Crystals 13 01151 g005
Figure 6. X-ray diffraction spectrum of laser claddings with different ratios of Ti and B4C.
Crystals 13 01151 g006
Figure 7. The microstructure image (a) and elemental distributions of Mg (b), Al (c), Ti (d) of the coating (Ti:B4C = 3:1).
Crystals 13 01151 g007
Figure 8. The microstructures of the coating in the (a,b) upper, (c,d) middle, and (e,f) lower parts of the coating (Ti: B4C = 3:1).
Crystals 13 01151 g008
Figure 9. The microstructures of the coatings with Ti: B4C ratios of 4:1 (ac), 5:1 (df), 6:1 (gi) in the upper, middle, and lower parts, respectively.
Crystals 13 01151 g009
Figure 10. Micro-hardness distribution of coatings.
Crystals 13 01151 g010
Figure 11. Polarization curve of the coatings.
Crystals 13 01151 g011
Table 1. Chemical composition (wt.%) of AZ91D.
Chemical CompositionMgAlZnMnSiBeOthers
Relative amount (%)89.978.990.710.250.0480.0071≤0.002
Table 2. The parameters of laser cladding process.
The ParametersValue
Velocity (mm/min)150
Pulse width (ms)4
Current (A)120
Frequency (HZ)18
Overlap rate (%)50
Table 3. Point element content distribution.
PointMgAlTiCSiO
118.328.323.230.2--
232.259.95.7-2.1-
324.821.624.128.5--
429.623.315.126.10.55.4
537.551.89.5-1.3-
Table 4. Corrosion parameters of different specimens in 1.5% NaCl solution.
Specimen GroupCorrosion Potential (V)Corrosion Current Density (A/cm2)
AZ91D−1.4551.444 × 10−4
Ti:B4C = 3:1−1.0111.785203 × 10−4
Ti:B4C = 4:1−1.1452.389 × 10−5
Ti:B4C = 5:1−1.0122.501 × 10−6
Ti:B4C = 6:1−1.0284.596 × 10−6
Disclaimer/Publisher’s Note: The statements, opinions and data contained in all publications are solely those of the individual author(s) and contributor(s) and not of MDPI and/or the editor(s). MDPI and/or the editor(s) disclaim responsibility for any injury to people or property resulting from any ideas, methods, instructions or products referred to in the content.

