Article

Effect of Pulse Frequency on Microstructure, Friction and Wear Properties of Inconel 718 Coatings Prepared via Laser Cladding

1
Department of Mechanical Engineering, Quzhou University, Quzhou 324000, China
2
Academician Expert Workstation, Jinhua Polytechnic, Jinhua 321017, China
3
Mechanical and Electrical Engineering, Quzhou College of Technology, Quzhou 324000, China
*
Authors to whom correspondence should be addressed.
Crystals 2023, 13(7), 986; https://doi.org/10.3390/cryst13070986
Submission received: 18 May 2023 / Revised: 9 June 2023 / Accepted: 13 June 2023 / Published: 21 June 2023
(This article belongs to the Section Crystalline Metals and Alloys)

Abstract

:
The Inconel 718 alloy clad coating was successfully prepared via pulsed laser deposition. The effect of pulse frequency on the evolution of microstructure, hardness and tribological properties of the as-deposited samples were analyzed via scanning electron microscopy (SEM), microhardness tester and ball-on-plate tribometer. The results showed that with the decrease in pulse frequency, the cooling rate of molten pool increases gradually, which effectively refines the γ-(Ni, Cr, and Fe) dendrites and restrains Nb segregation. Hence, the morphology of the brittle Laves phase changed from long chained to granular and its volume fraction decreased from 6.59% to 2.41%. The hardness of the coating increased from 261 HV0.1 to 297 HV0.1 and the tribological property also improved simultaneously. The friction coefficient decreased from 0.2387 to 0.2066, and the wear rate decreased from 27.30 × 10⁻⁴ mg·N−1·m−1 to 19.15 × 10⁻⁴ mg·N−1·m−1. It can also be observed that the wear area of the counterpart, Si3N4 ball, increased from 2.016 mm2 to 2.662 mm2. The increase in the hardness and tribological property were attributed to the grain refining strengthening.

1. Introduction

Inconel 718 is a type of precipitation-hardening superalloy which has been extensively used in nuclear reactor core, space turbine engine, turbine blade, high temperature fastener and structural parts due to its excellent high temperature mechanical properties, weldability and oxidation resistance [1,2,3]. However, the component often suffers wear-out failure caused by machining damage and complex service environment, resulting in higher economic cost [4,5]. Hence, several methods were introduced to repair the complex components, such as laser shock peening, ultrasonic shot peening, and laser additive manufacturing, which eventually would increase the service life of the component [6,7,8,9,10]. During LAM, non-equilibrium solidification of the molten pool under high-energy laser irradiation would lead to the constitutional undercooling. It would lead to the segregation of Nb, and Mo in the inter-dendritic region. Thus, the brittle Laves phase (Ni, Fe, Cr)2(Mo, Nb, Ti) can be formed [11]. The morphology and volume fraction of Laves phase also show great influence on the mechanical properties of the alloy. It is reported that the increase in coarse long-chained Laves phase remarkably increased the crack sensitivity of the alloy [12,13,14]. Therefore, it is of great significance to find an effective way to eliminate Nb and Mo segregation to suppress the formation of the Laves phase [15,16,17]. It has been found that adjusting the processing parameters, that is, lower G/R (the ratio of the temperature gradient and growth rate) and higher cooling rate, can decrease the dendrite primary arm spacing of the γ phase and make the Laves phase finer and more dispersive, thereby improving the hot cracking resistance of the alloy [18,19,20,21]. However, the Laves phase with continuous chain morphology has not been eliminated via these methods. It was found that the pulsed laser can effectively reduce element segregation, which has been applied to the laser additive manufacturing of nickel-based alloys as a way of regulating the microstructure of the alloy [22,23,24]. Song et al. [2] reported that Nb segregation was reduced, and fine and discrete Laves phase was obtained in the LAM-ed Inconel 718 via a pulsed laser, which is attributed to the high cooling rate of the molten pool. Compared with the alloy obtained via continuous-wave laser, the mechanical properties obtained via this method are better due to finer dendrite microstructure, reduced Nb segregation, and fine and discrete Laves phase. Although pulsed laser has been proven as an effective way to improve the mechanical properties by reducing Nb, and Mo segregation, it is crucial to find the appropriate pulse frequency [25]. If the pulse frequency is too low, the melting of the powder will be affected by the long silence time of the laser, resulting in defects, such as collapse and incomplete fusion, which is detrimental to the mechanical properties. However, if the pulse frequency is too high, the grain will coarsen. Moreover, the anti-wear ability of the LAM Inconel 718 obtained via a pulsed laser has not been studied yet. Therefore, it is necessary to explore the effect of different plus frequency on the controlling of element segregation and mechanical properties (hardness and anti-wear ability) of the Inconel 718 alloy [26].
In order to suppress the formation of Laves phase and improve the mechanical properties of the coating, single-track deposition coating of Inconel 718 alloy is obtained via pulsed laser in this paper. The effect of different pulse frequency (62.5 Hz, 125 Hz, 250 Hz, and 500 Hz) on the γ-(Ni, Cr, and Fe) dendrites and Laves phases was studied. The hardness and anti-wear ability of the coating were also studied, and the effect of different pulse frequency was systematically analyzed.

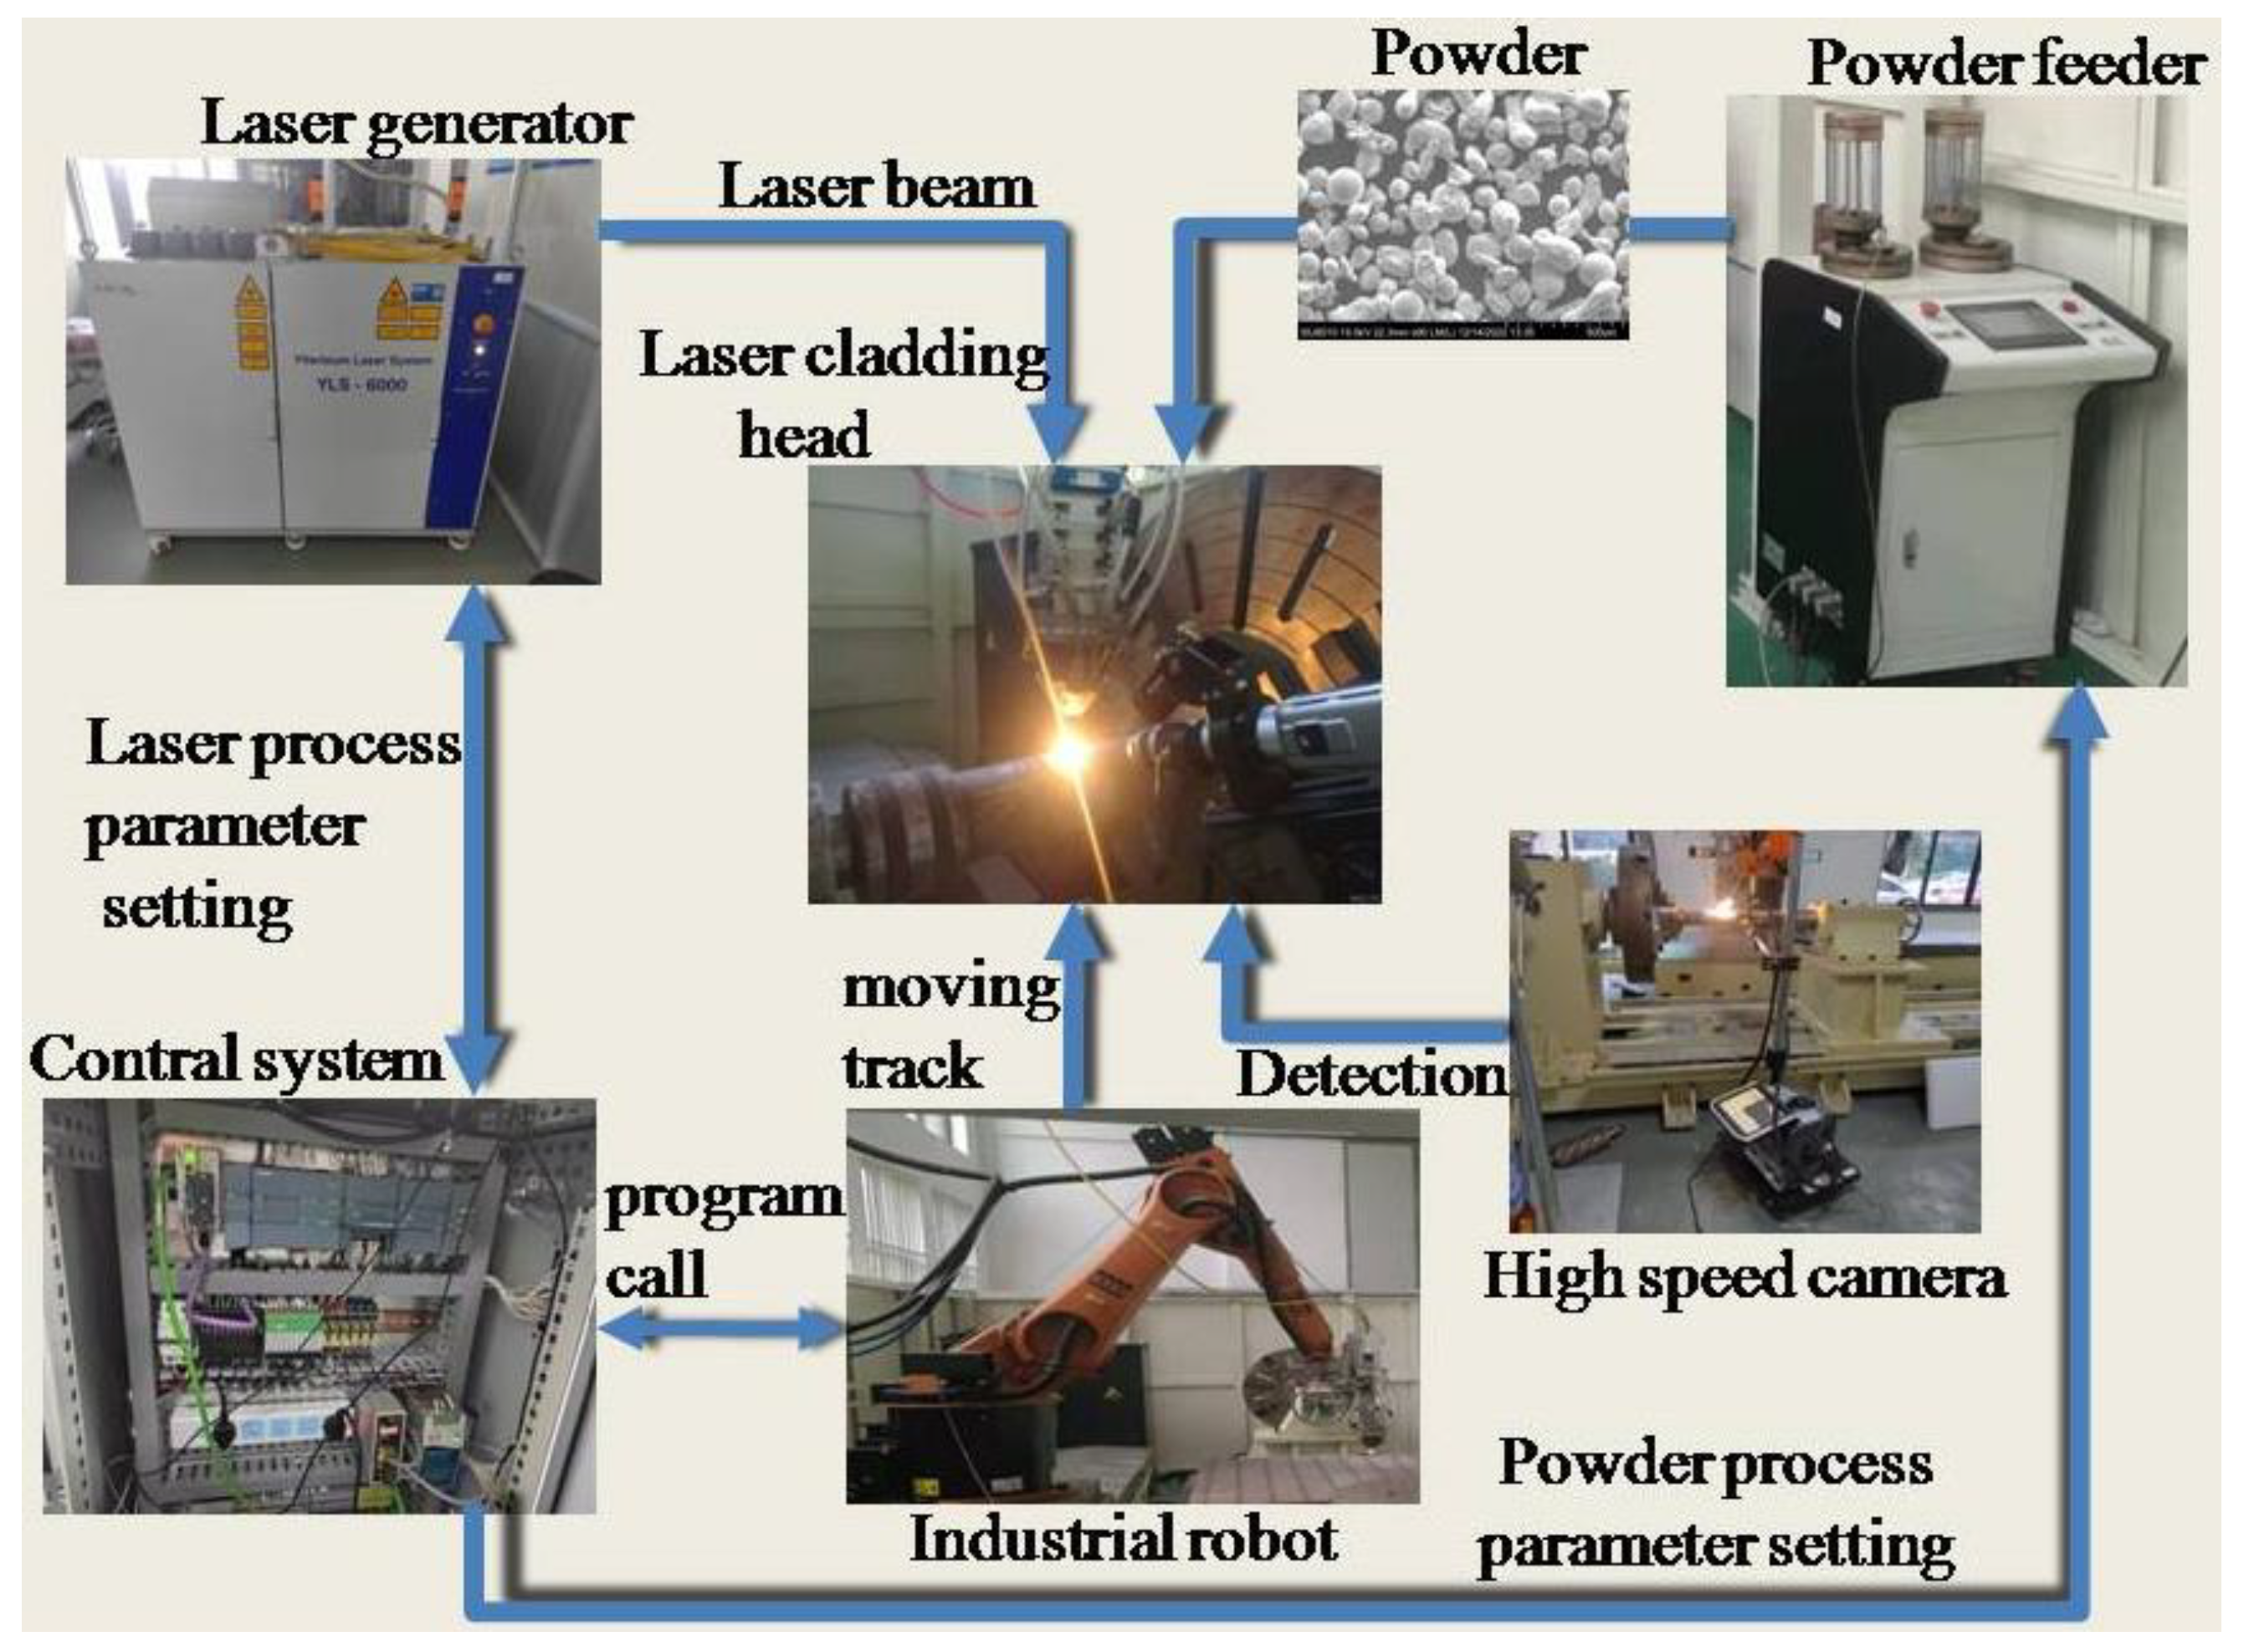
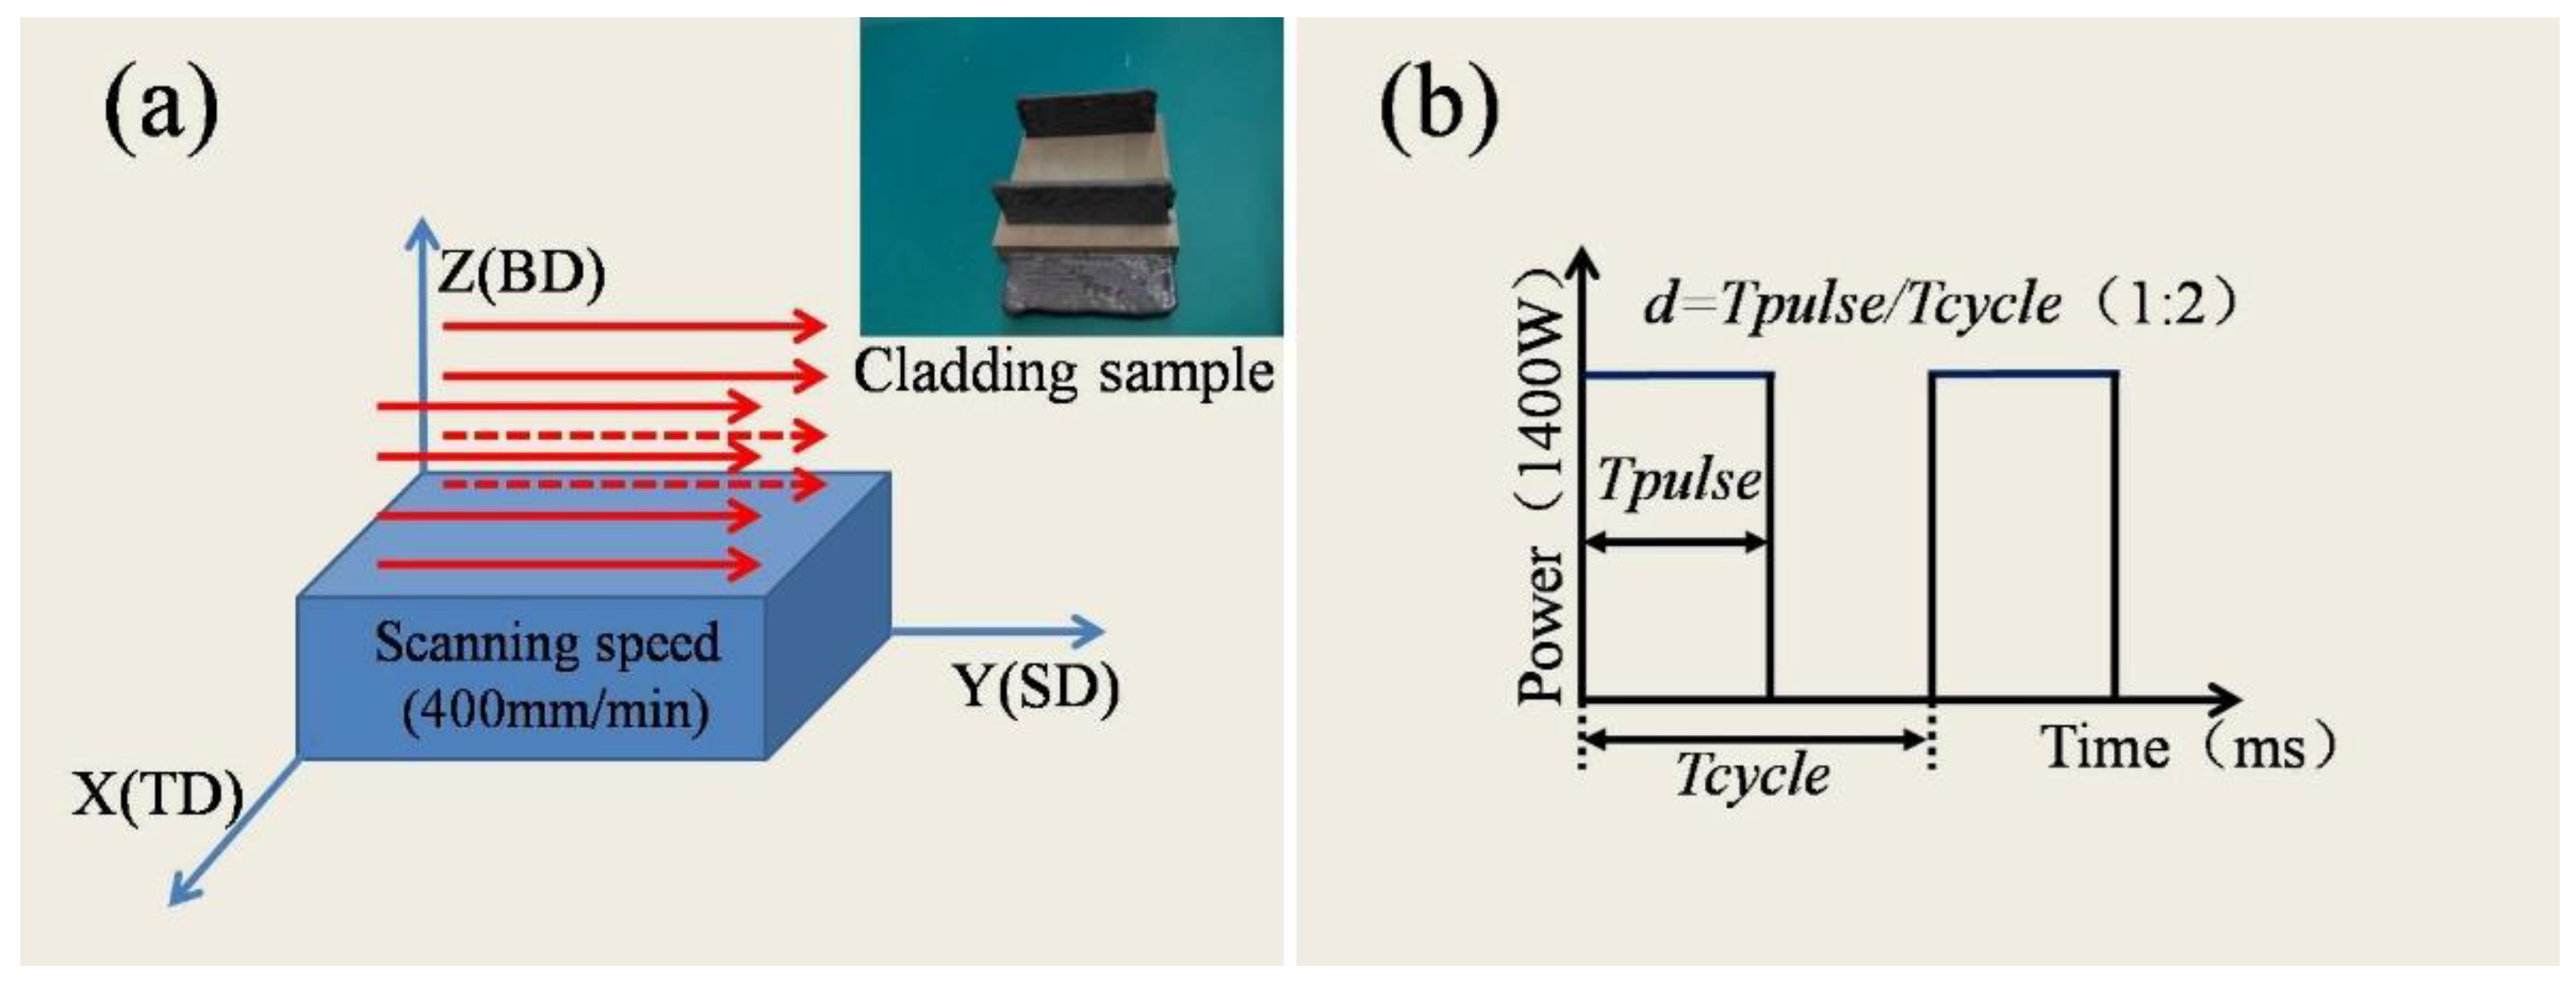
2. Materials and Methods

Figure 1 shows the laser prototyping system of Coaxial powder feeding. The cladding coating was fabricated using the LAM system which is composed of a fiber laser (IPG YLS-6000, Massachusetts, USA) with a wave length of 1070 nm and a beam diameter of 3 mm. The pulse frequencies (62.5 Hz, 125 Hz, 250 Hz, and 500 Hz) were set using the cyclic algorithm program with the software LaserNet V2.101.1. The molten pool at different pulse frequency were monitored in real-time via a high speed camera (KEYENCE VW-9000, Osaka, Japan) and a monochromatic infrared thermometer (PROCESS SENSORS Metis M316 773 k-3573 k, Frankfort, Germany) as illustrated in Figure 1.
Figure 2 shows the schematic diagram of the scanning process strategy and pulsed laser. Figure 2a presents the route diagram and Figure 2b highlights the schematic diagram of a pulsed laser. Inconel 718 powders with particle size from 53 to 150 μm were chosen as the depositing material and its nominal chemical composition (wt.%) is Cr 20.67, Nb 5.49, Mo 3.31, Ti 0.76, Ni 54.81, Fe 14.58, Al 0.3, and C 0.08. Inconel 718 plates with dimension of 60 mm × 60 mm × 10 mm was selected as the substrates. Other processing parameters are as follows: laser power of 1400 W, scanning speed of 400 mm/min, powder feeding rate of 10 g/min, shielding gas flow of 15 L/min and distance interval along Z-direction of 0.5 mm. The coating was fabricated layer by layer with six-axis industrial robot (KUKA) and high purity argon (99.9%) was used as the shielding gas in the scanning process strategy shown in Figure 2a.
After the deposition, the sample were cut via the wire-electrode cutting process (ZHENGFEI DK7735, JiangSu, China), then polished, and then etched for 10 s with Kalling’s reagent (5 g CuCl2 + 100 mL HCl + 100 mL C2H5OH). The microstructure of samples of different pulse frequencies were analyzed using optical microscope (OM, KEYENCE, Osaka, Japan) and scanning electron microscope (SEM, Hitachi, SU8010, Tokyo, Japan). The volume fraction of the Laves phase were calculated using Image Pro Plus. The hardness of samples was determined via a microhardness tester (DUH-211, Kyoto, Japan). Tribological tests were carried out on ball-on-plate tribometer (HT-1000, Lanzhou, China) and the wear rate ω was calculated using the following formula.
ω = M / F × S
where, M was the mass loss in mg, F is the load in N, and S is the total sliding distance in mm. The parameters for tribological test are as follows: grinding ball is Si3N4(hardness 18 GPa), load of 20 N, testing time of 20 min, radius length of 5 mm, speed of 600 r/min, and sliding distance of 376.8m at room temperature (25 °C). Then, the profiles of worn track and grinding ball were measured using a surface profilometer (Keyence, VHX-2000, Osaka, Japan).

3. Results and Discussion

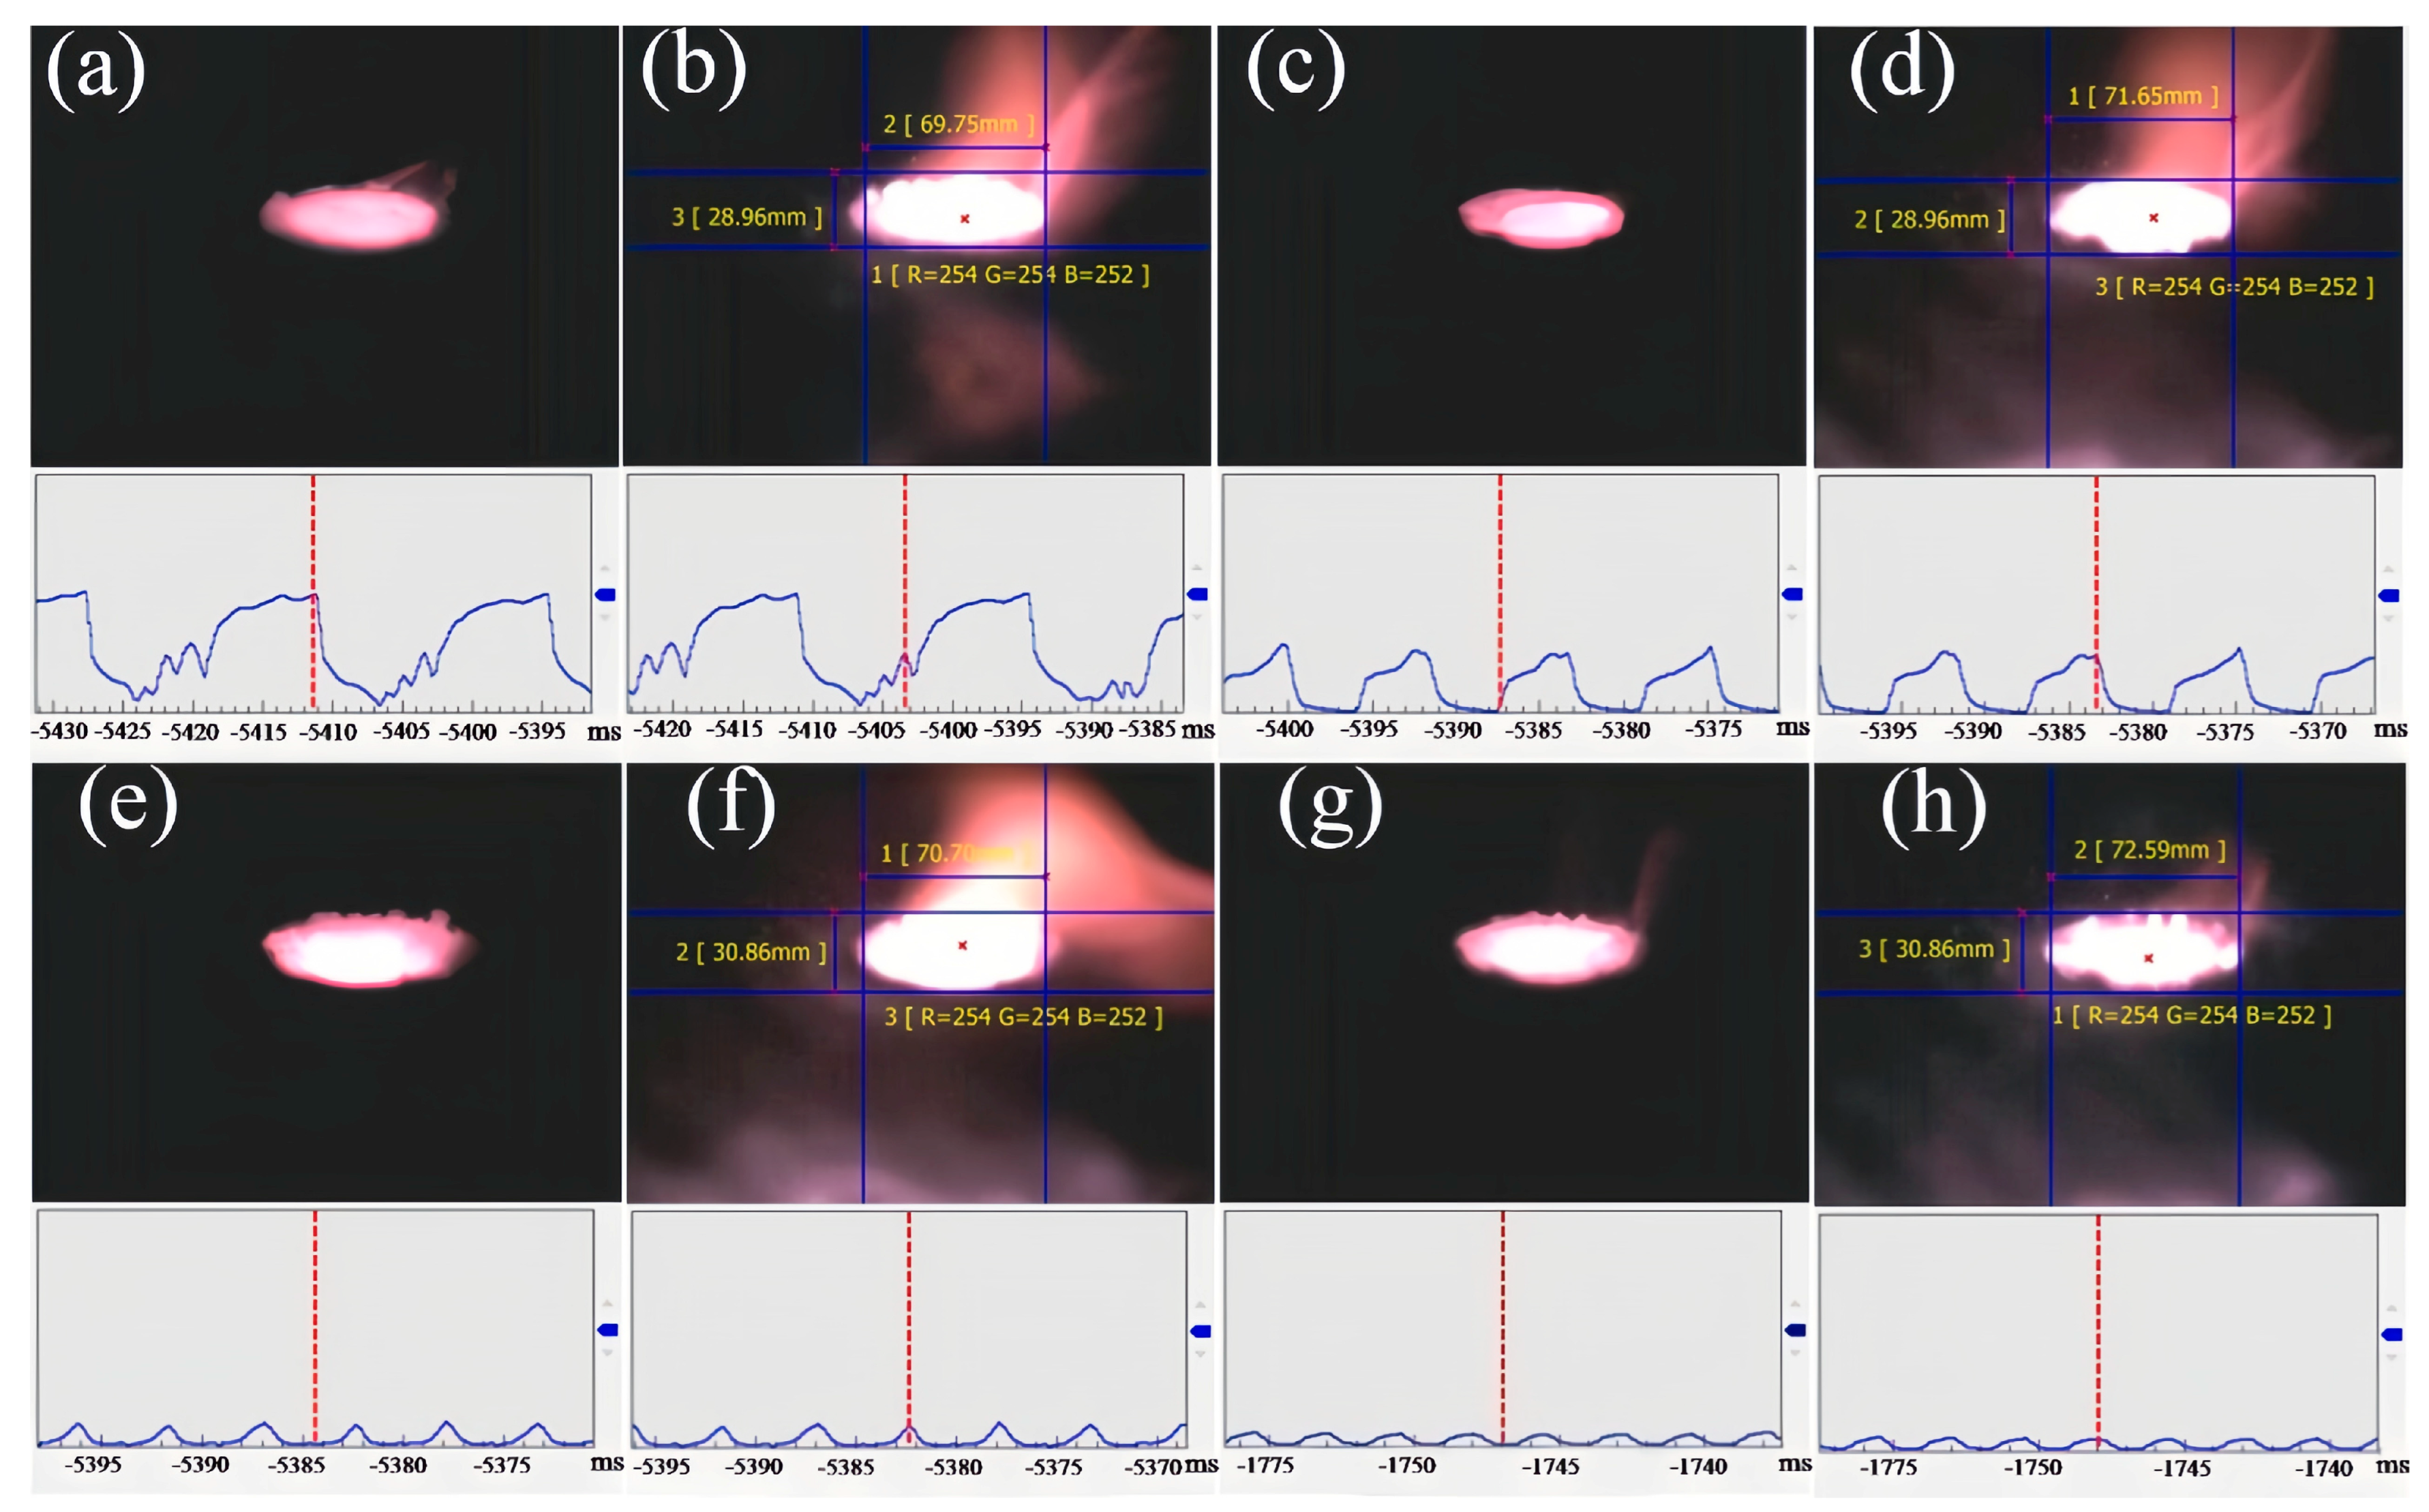
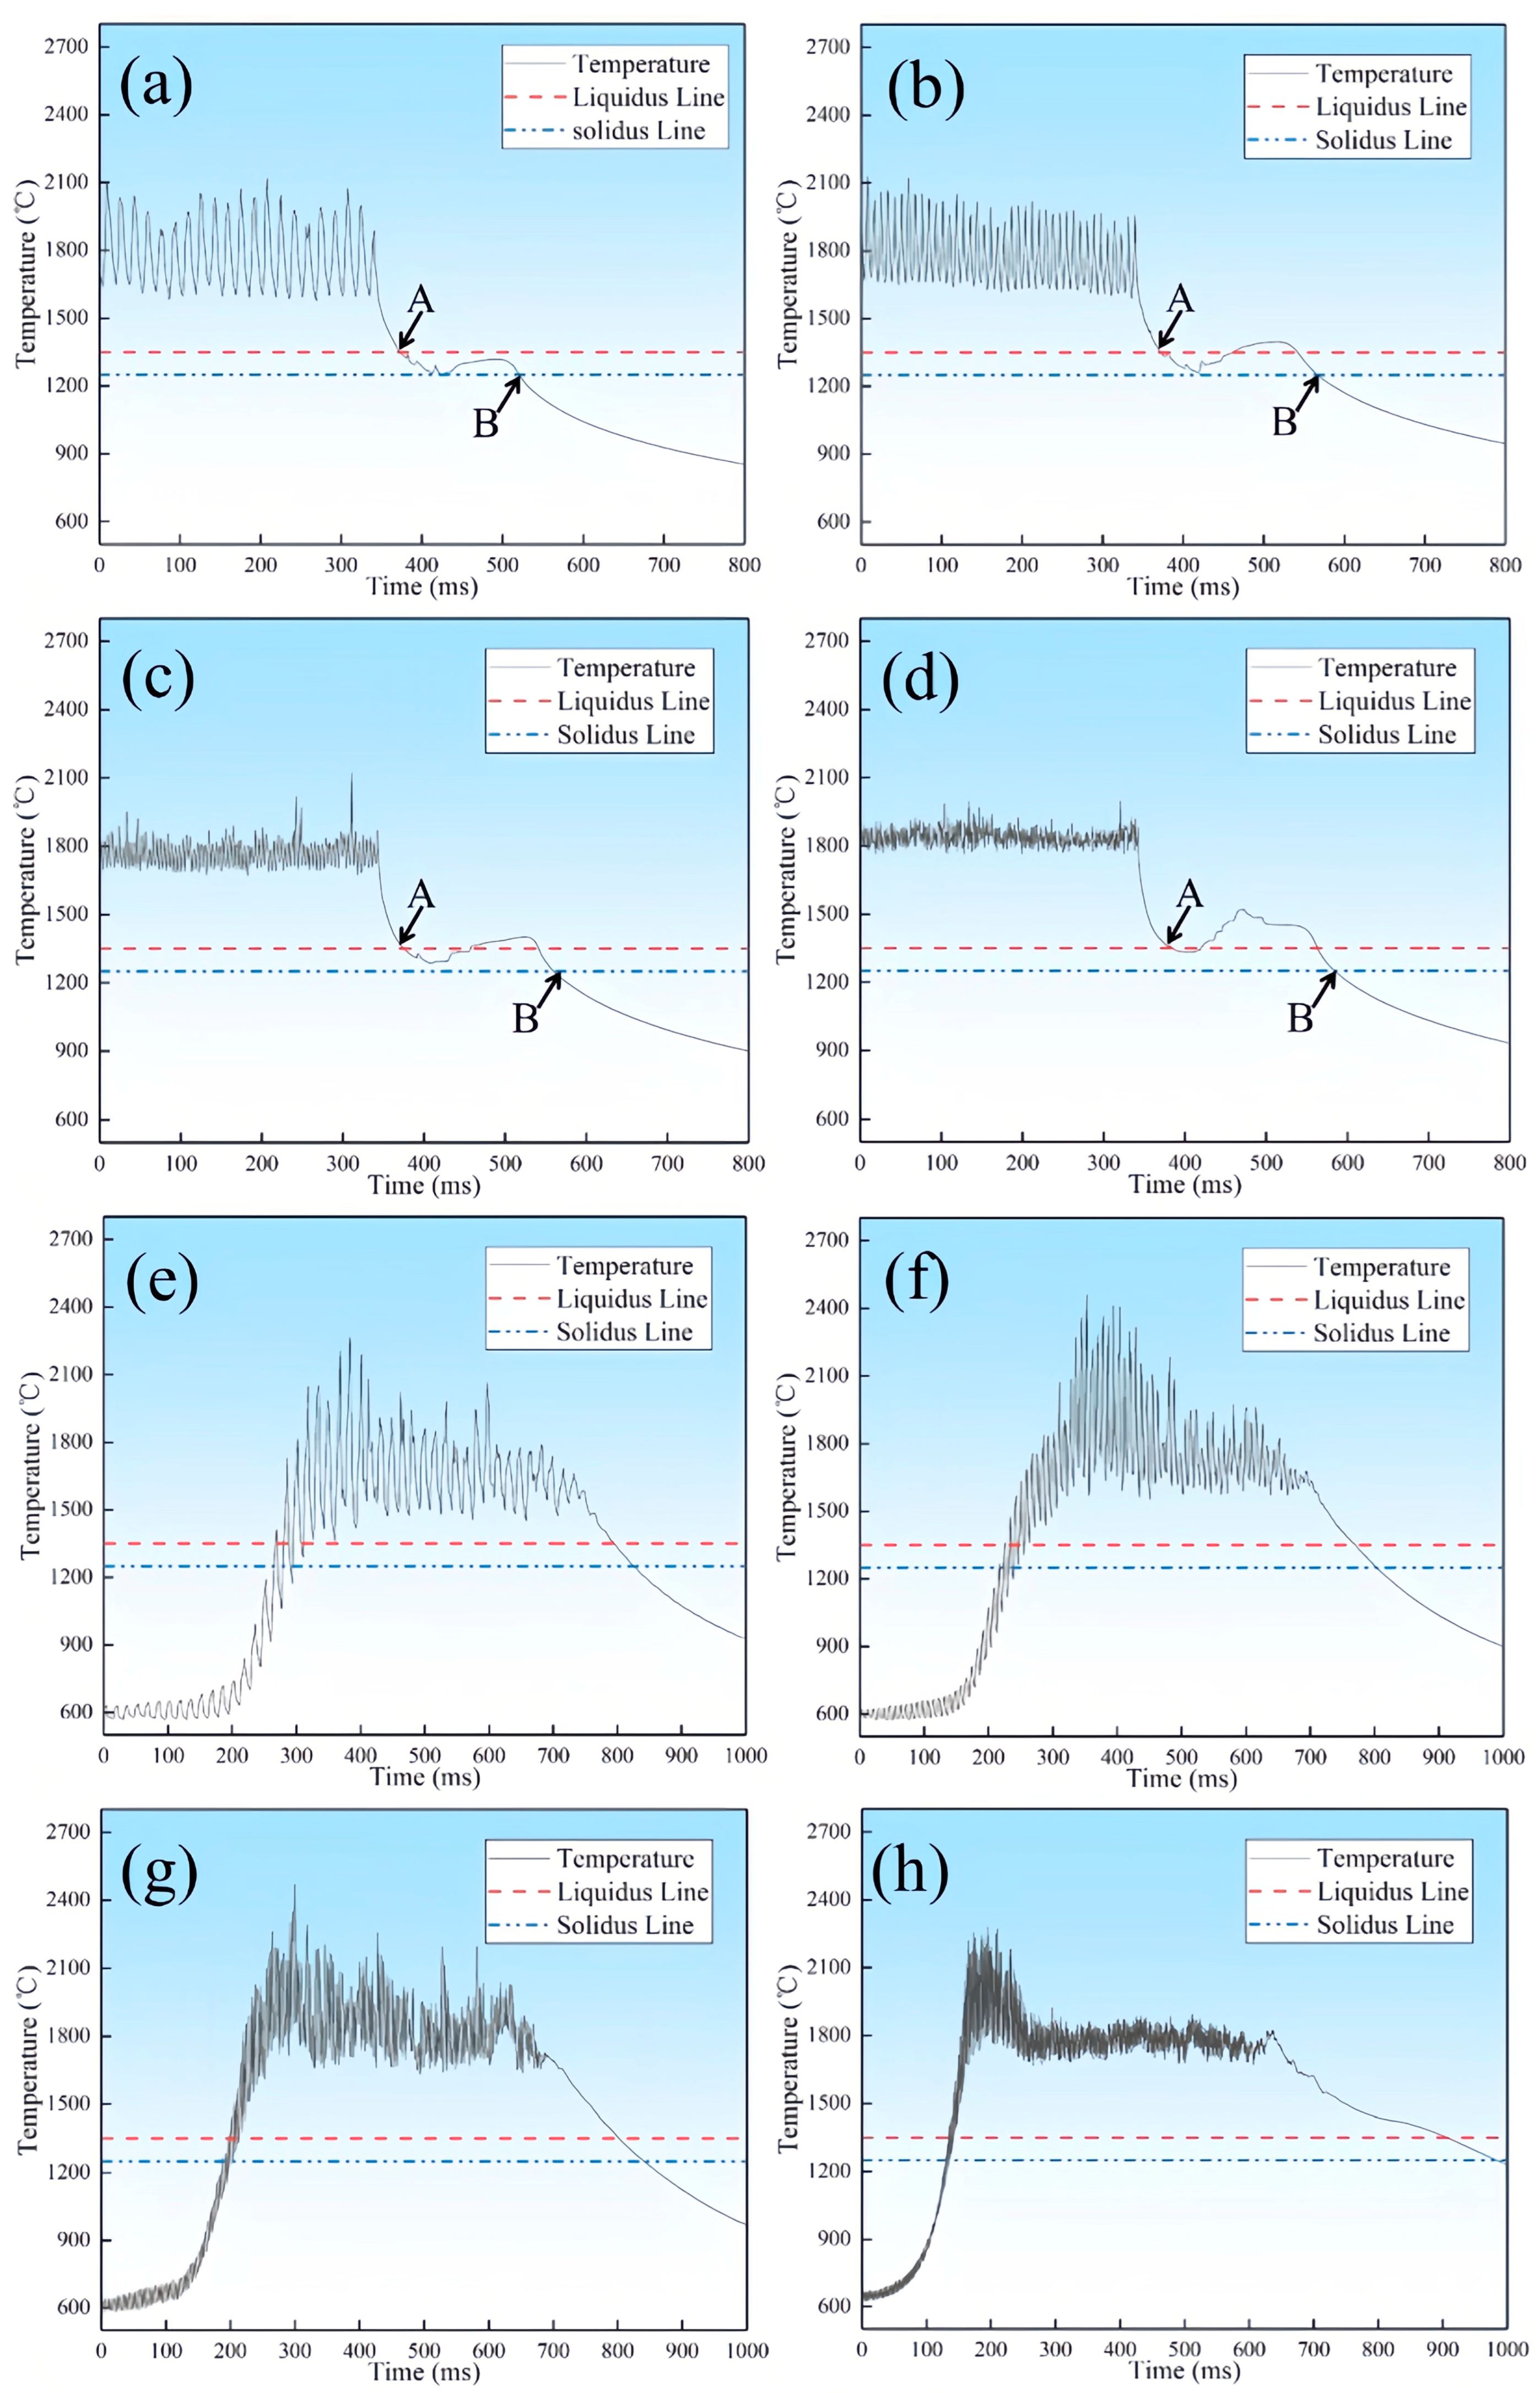
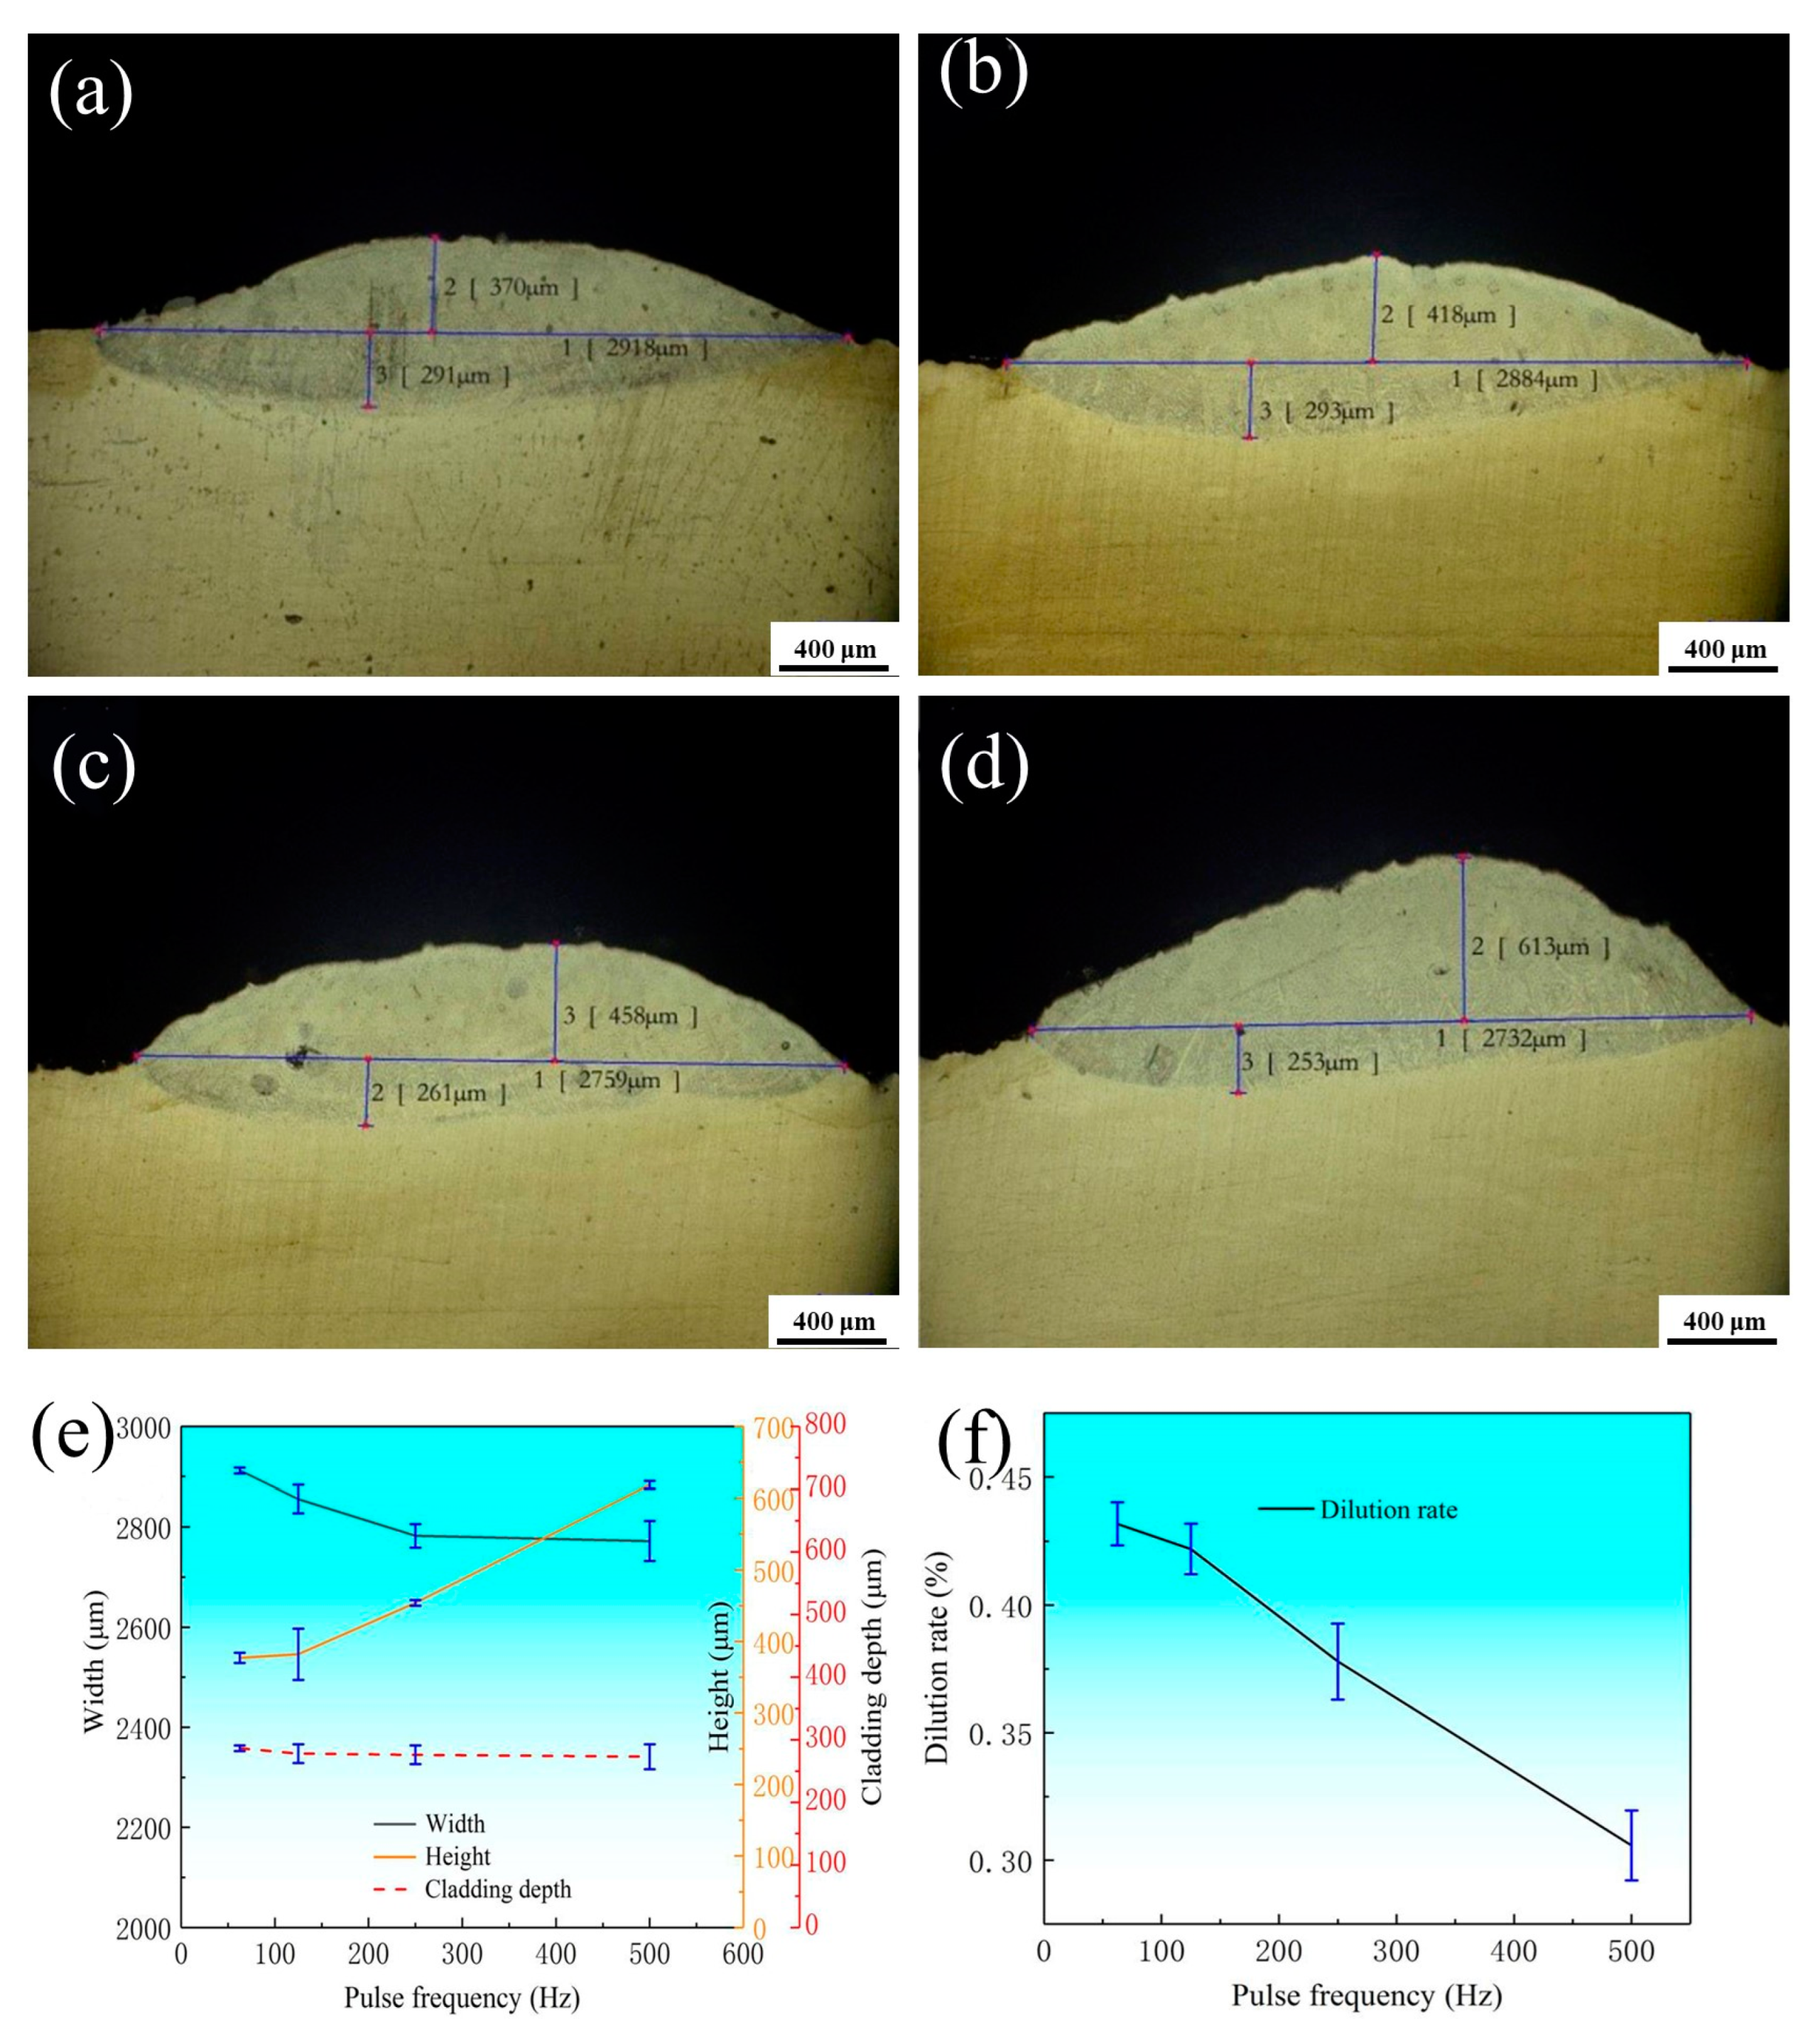
3.1. The Effect of Pulse Frequency on the Molten Pool

As shown in Figure 2, the parameters of pulsed laser are as follows: pulse period ( T c y c l e ), pulse duration ( T p u l s e ) and duty ratio ( d = T p u l s e / T c y c l e ). Table 1 presents that parameters of pulsed laser with different frequency. The pulsed laser was output in the form of modulated square wave with the parameters shown in Table 1. As seen in Table 1, with a laser power of 1400 W, the single pulse energy decreases as the frequency increases.
Figure 3 shows the comparison of high and low temperature states of pulsed laser molten pool at different frequencies. As shown in Figure 3b,d,f,h, the RGB threshold of high temperature molten pools at different frequencies are as follows: R = 254, G = 254, and B = 252, which indicates that the molten pool appears as highly bright white when the energy input is stable.
Furthermore, it was shown that the radius of the molten pool is about 2.8 mm, slightly smaller than the theoretical laser radius of 3 mm, which is related to the Gaussian distribution of laser energy. Due to the periodic supply of laser energy, the molten pool would constantly cycle in the following four stages: heating up, maintaining, cooling down and reheating. As observed from Figure 3a,c,e,g, with the decrease in pulse frequency, the brightness of the low temperature molten pool decreases gradually, which mainly occurs because with longer silent times of the laser, the frequency becomes decreases, and hence the cooling of the molten pool appears obvious. Python (Python Imaging Library) was applied to count the number of pixel whose RGB threshold is R = 254, G = 254, and B = 252, as shown in Figure 3a,c,e,g, and the results are 62.5 Hz = 0, 125 Hz = 10, 250 Hz = 802, and 500 Hz = 1071, respectively. Combined with the real-time threshold response curves for each frequency in Figure 3, it can be understood that the temperature fluctuation of the molten pool at a high pulse frequency is smaller than that at a low pulse frequency, hence, it is more stable to keep the thermal energy of the molten pool at a high pulse frequency.
Since the solidification process shows great influence on the microstructure, the change in molten pool temperature will play great effect on the solidification process. In this paper, the temperature of the molten pool was measured under both static and motion light source modes. Figure 4 shows the temperature curve of the molten pool under different light source modes. As observed from Figure 4a–d, when the light source is static, the transient temperature of the molten pool fluctuates periodically with the pulse frequency and the lowest temperature at each frequency is higher than the melting point of 1350 °C. It can also be seen that the temperature rises again between point A and B, which is the recalescence phenomenon during solidification. With the increase in pulse frequency, the average solidification time of the molten pool increases (142 ms < 161 ms < 167 ms < 174 ms), and the average cooling rate decreases (2455 °C/s < 2847 °C/s < 3181 °C/s < 3541 °C/s). As seen from Figure 4e–h, when the light source is in motion, the amplitude of the molten pools’ temperature at low pulse frequency is higher than that at high frequency and the thermal stability at high frequency is better. With the increase in pulse frequency, the average solidification time of the molten pool increases (31 ms < 33 ms < 36 ms < 43 ms), and the average cooling rate decreases (2524 °C/s < 3211 °C/s < 3476 °C/s < 3732 °C/s).
Figure 5 shows the variations in cladding coating morphology with pulse frequency. It is observed that with the increase in pulse frequency, the cladding layer thickens and the dilution ratio reduces (0.43 > 0.42 > 0.37 > 0.30), as shown in Figure 5e,f. When the frequency is 62.5 Hz, the cladding depth and width reaches the maximum, and the average values are 286 μm and 2912 μm, respectively. Compared to high frequency, the flowability of the molten pool is better at low frequency, which is attributed to the stronger Marangoni effect at low frequency. As mentioned before, the amplitude of transient temperature at low frequency is larger than that at high frequency, which signifies higher peak temperature of the molten pool at low frequency, hence a high temperature gradient ( d T / dx ) forms in the local area of the molten pool and the tension gradient ( d γ / d T ) along the x direction increases accordingly. As shown in Equation (2), owing to larger temperature gradient ( d T / dx ) and tension gradient ( d γ / d T ) at low frequency, the Marangoni effect(M) becomes stronger, thus resulting in better flowability of the molten pool. Meanwhile, since the single pulse energy is higher at low frequency, when the pulse impacts the surface of the substrate instantaneously, the powder will dissolve rapidly because of the high temperature generated by the pulse. Therefore, with the combination of better flowability and faster dissolution rate at low frequency, higher cladding depth and width were obtained. In addition, as the temperature of the molten pool is more stable at high pulse frequency, which is brought by the short interval between energy input, the powder will dissolve more sufficiently therein than at low frequency. Consequently, the cladding height of the molten pool increases with the increase in pulse frequency, leading to the reduction of dilution ratio [27].
M = d γ d T · d T d x · L 2 v β
where, T is temperature; γ is surface tension; L is cladding length; v is viscosity and β is the thermal diffusion coefficient.

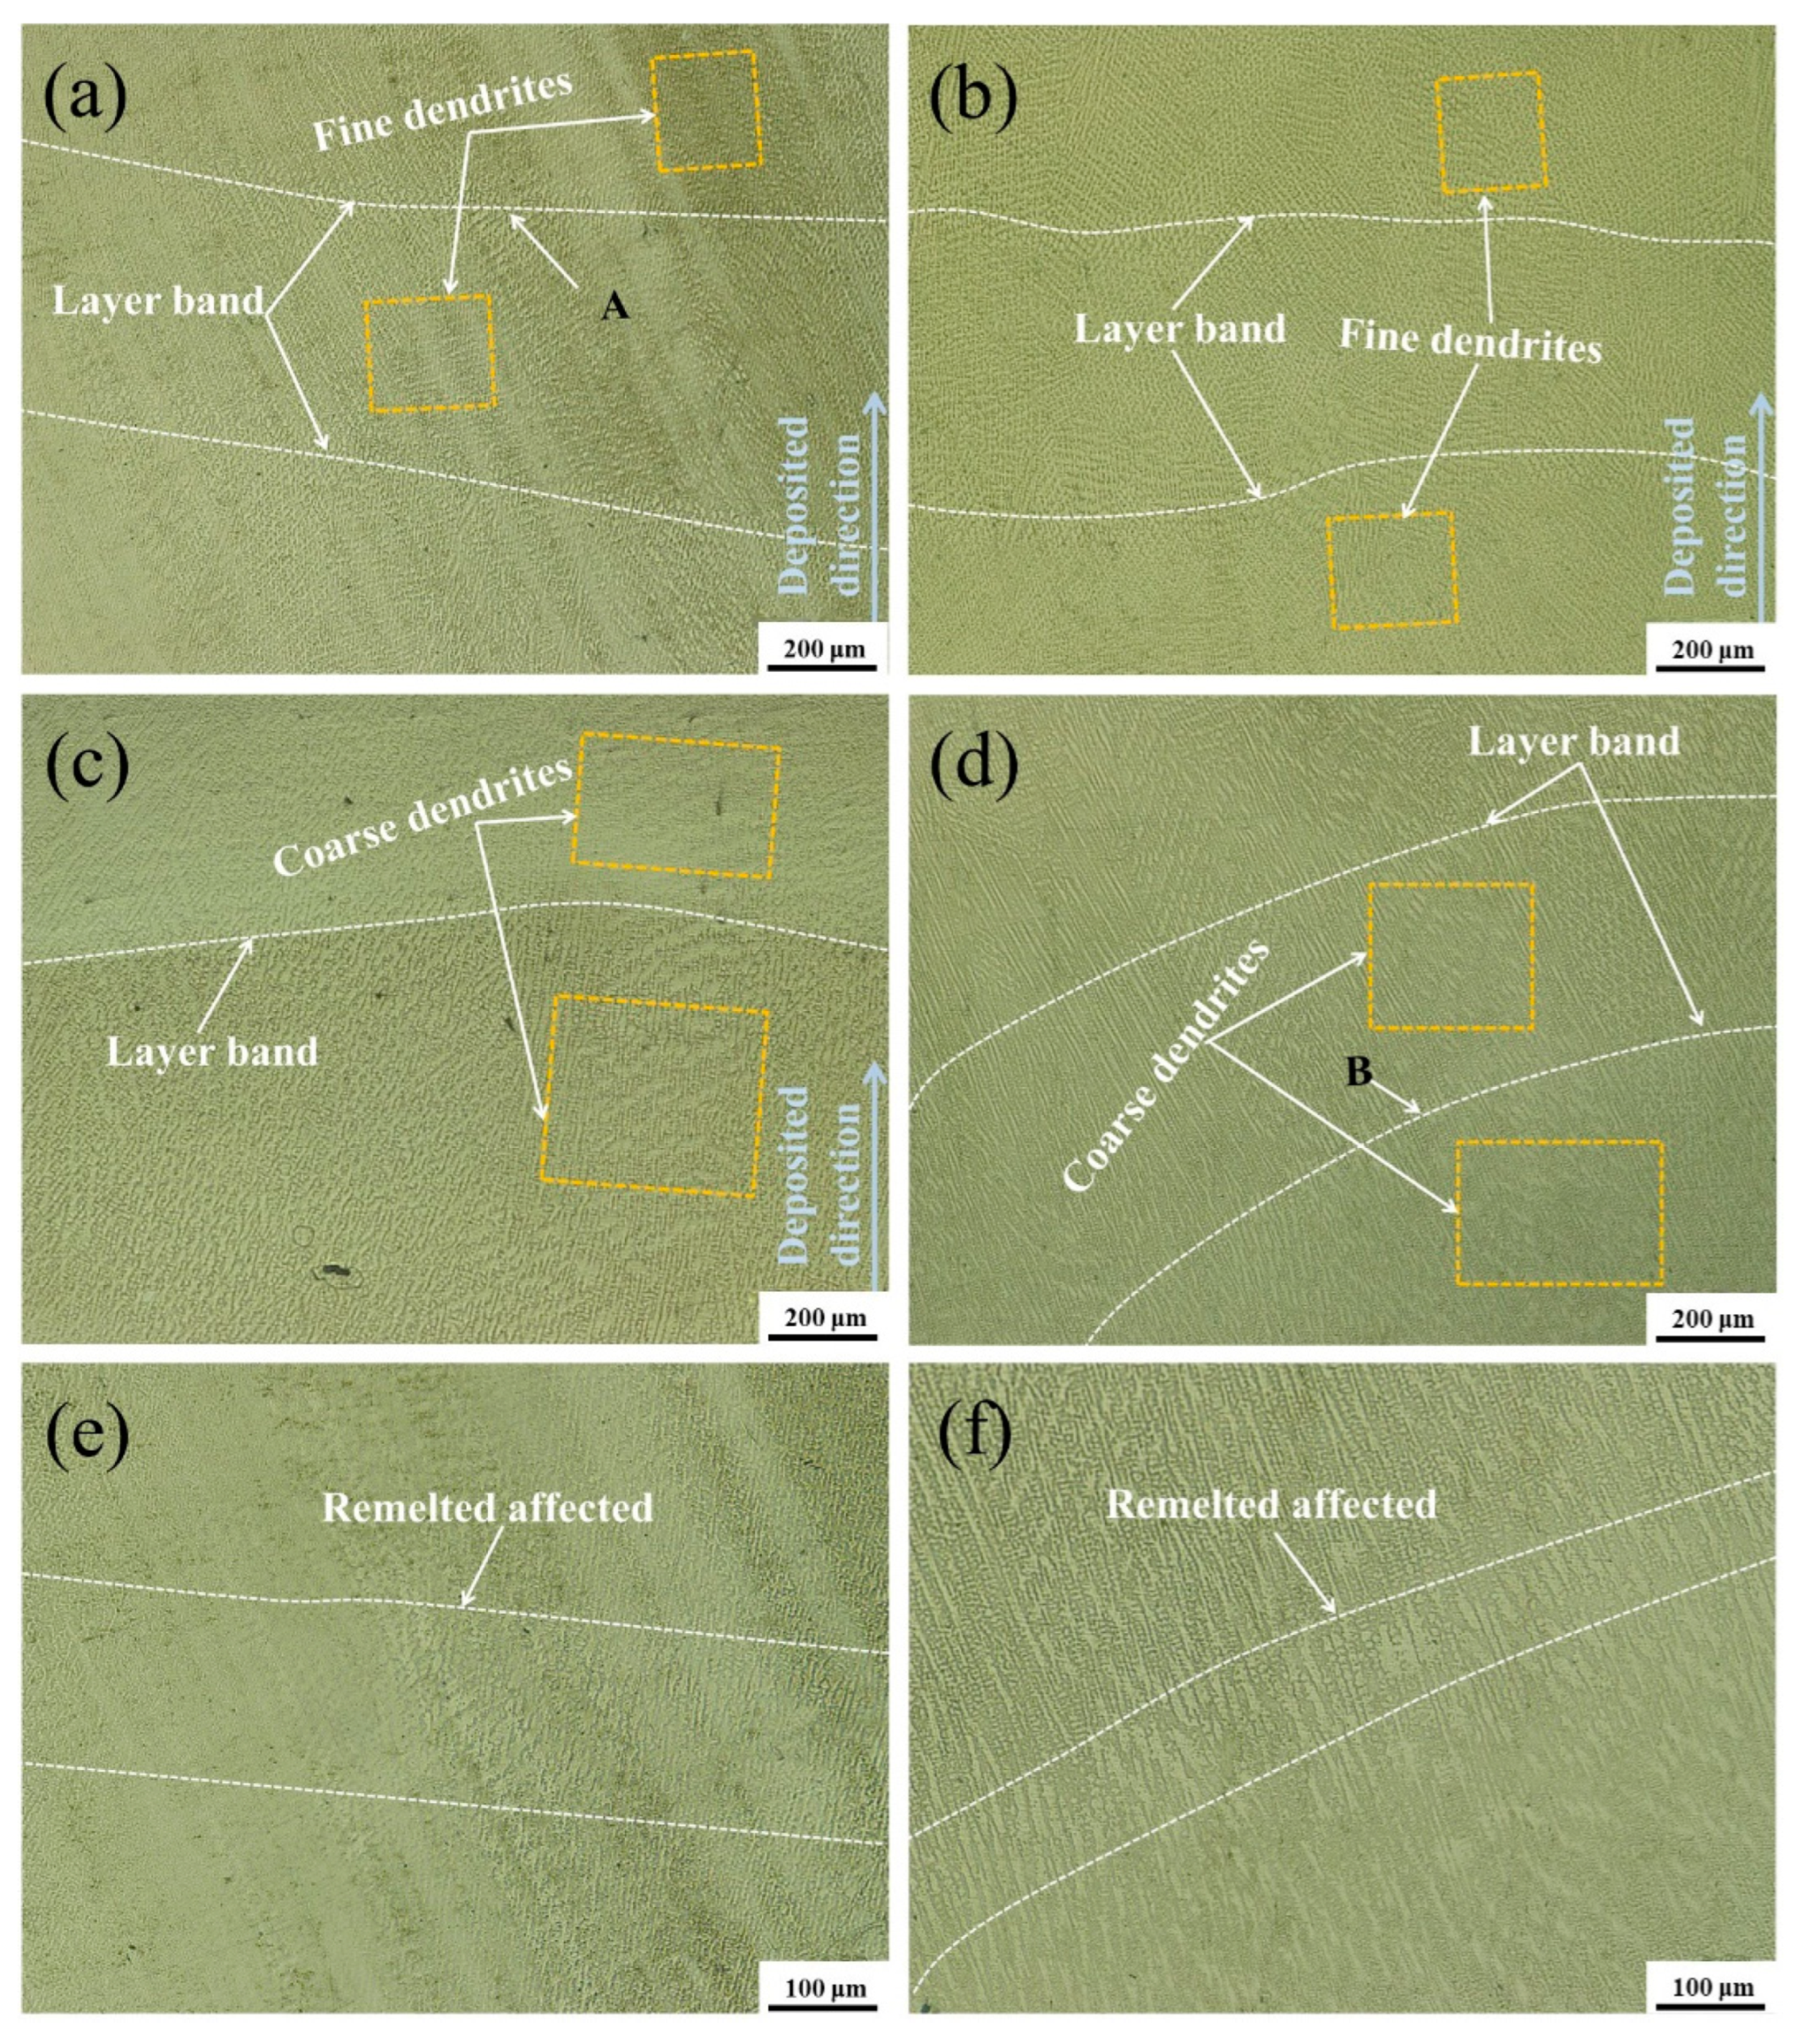
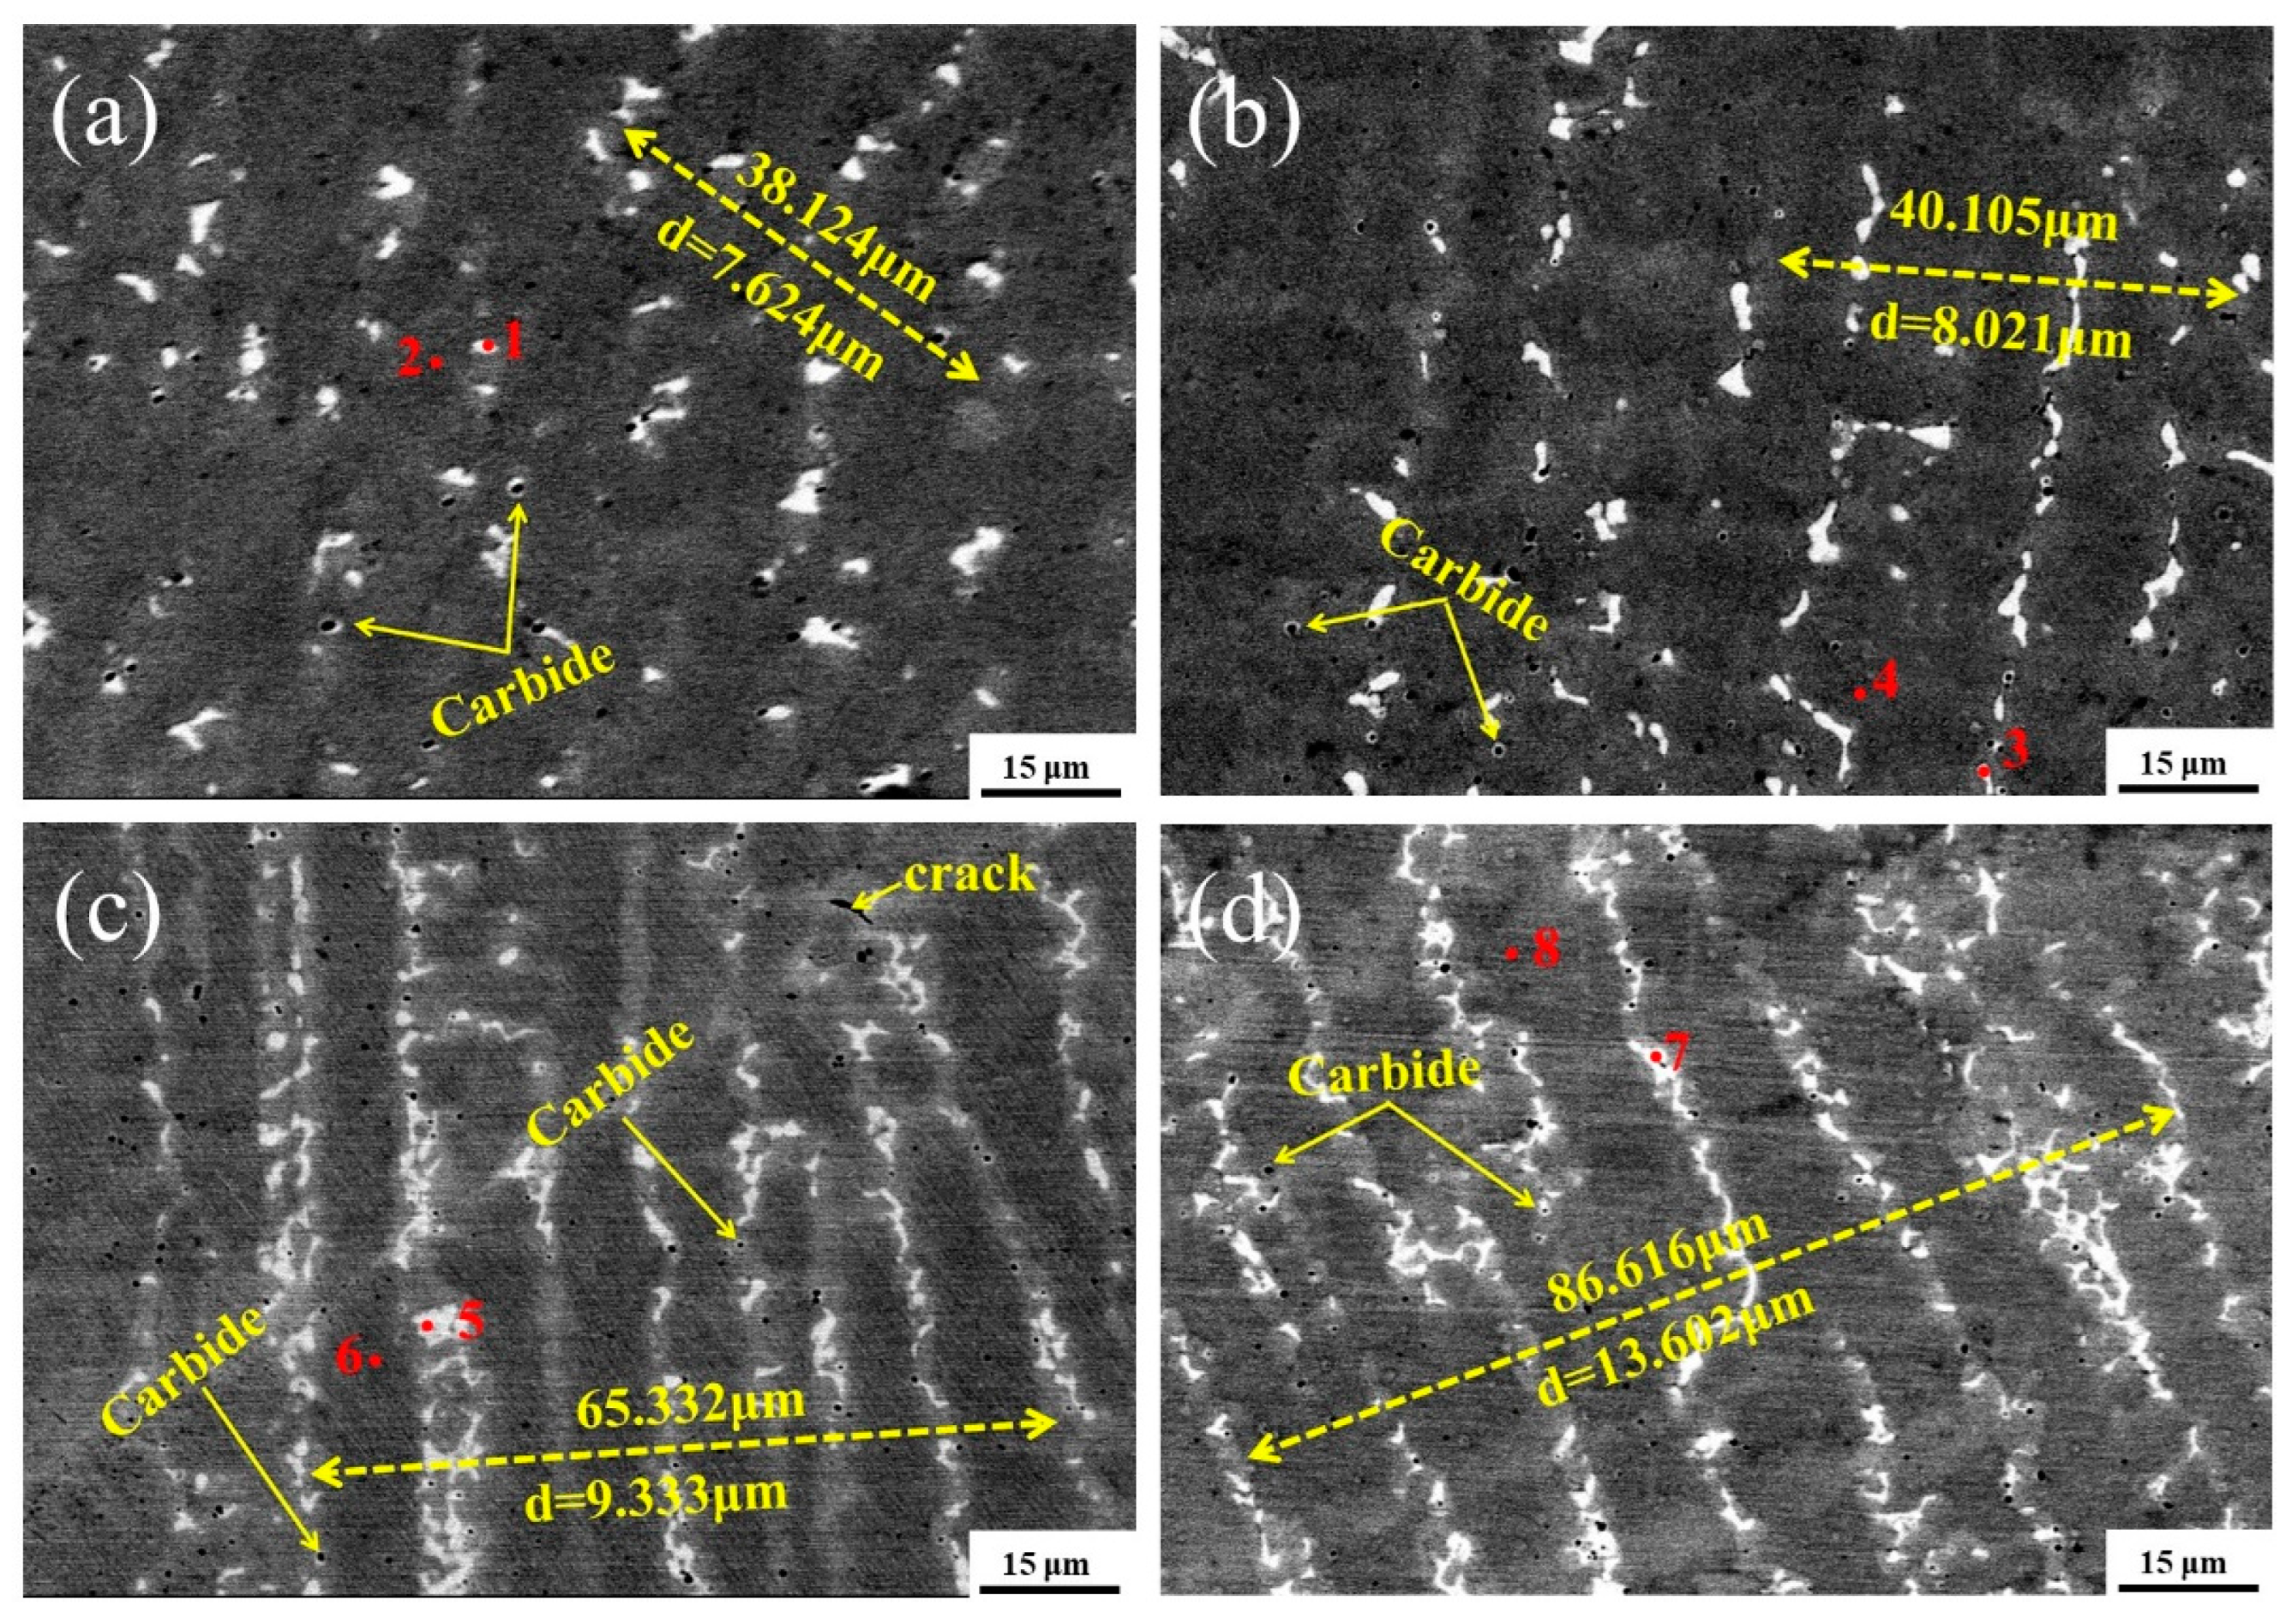
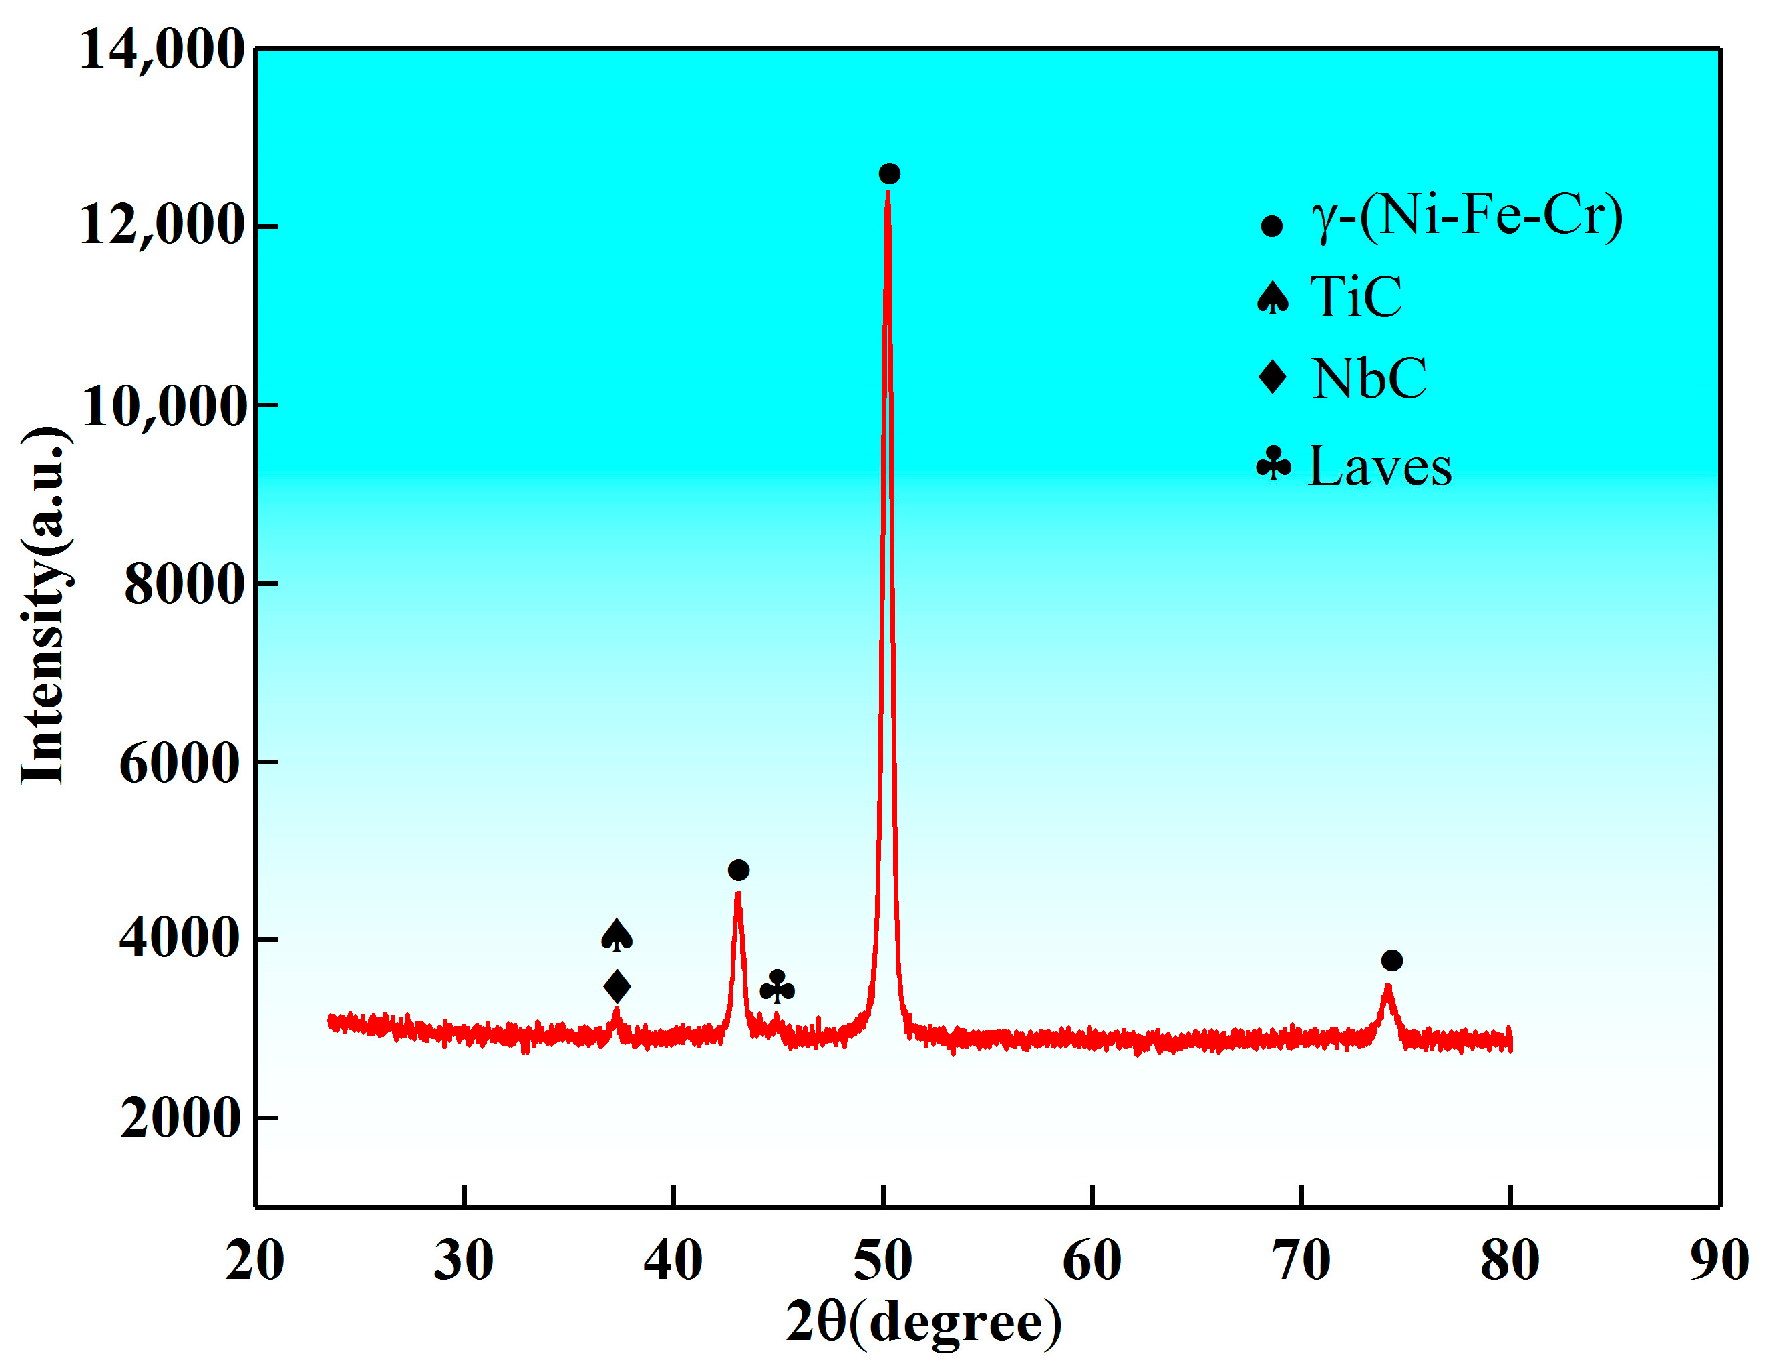
3.2. Effect of Pulse Frequency on the Microstructure Evolution

Figure 6 shows the optical micrographs of the Inconel 718 samples obtained at different pulse frequencies. From Figure 6a, it can be observed that there are many fine dendrites in the clad layer when the pulse frequency is 62.5 Hz. Since the direction of maximum thermal gradient of the molten pool constantly changes as the temperature of the molten pool varies periodically, the growth of columnar dendritic was suppressed. Simultaneously, the cooling time of the molten pool increases. It is beneficial to dissipate heat and increase the cooling rate of the molten pool, which would subsequently decrease the supercooling and then decrease the critical nucleation radii, and increase the nucleation rate and nuclei number of the dendrites [28,29]. From Figure 6b–d, it can be seen that with the increase in pulse frequency, the dendrites coarsen gradually. This is because the interval between energy input reduces as the frequency scales up, hence, the transient temperature is relatively stable and the molten pool solidified at a slower rate as compared to that at low frequency, thereby resulting in the coarsen of the dendrite. Meantime, it can be inferred from Figure 6 that all dendrites grow epitaxially along the deposited direction and the growth direction is roughly parallel to the deposited direction, which mainly resulted from the heat flow direction during the solidification of the molten pool [30,31]. Due to the effect of the thermal effect of coating, inapparent curve bands between the adjacent coatings are formed [22,32]. Figure 6e,f present the enlarged view of point A and B, respectively, and it can be seen that the dendrite near the remelted affected band layer is larger than that in the other area of the adjacent band layer.
Figure 7 shows the backscattered electron image of different samples. As seen, the average arm spacing of the dendrites decreases from 13.60 μm to 7.62 μm with the reduction in pulse frequency, which is because the increasing cooling rate can effectively suppress the grain coarsening [15]. Table 2 presents the EDS result of each position in Figure 7. In contrast to the dendrite, white phases were also formed along the interdendritic boundaries, as shown in Figure 7. From Table 2, it can be inferred that the dark dendrite is γ-(Ni, Fe, and Cr) and the white phase is the Laves phase enriched with Nb, Mo and Ti. Simultaneously, there are many round black particles which are surrounded by the white circle in the matrix. Figure 8 shows the EDS results of the black particle, from which it is known that the chemical composition of the black particle is Ni18.01-Nb8.19-Mo1.90-Ti-8.26-C42.04-Cr8.83-Fe7.69 (wt%). It can be deduced that the black particle is mainly composed of C and surrounded by the white circle which is enriched with Nb, Mo and Ti [26]. Due to the strong affinity between C, Nb, Ti, Mo and low Gibbs free energy for the formation of (Ti, M)C carbide(M is Nb, Mo, etc.) during the solidification process, large amount of Nb, Mo and Ti are prone to be rich around the C particles, which will grow into the dispersive strengthening phase marked as carbide in Figure 7. In order to further study the phase constitution of the surface, XRD was conducted. It can be seen in Figure 9 that γ phase, TiC, NbC and Laves phase were formed in the Inconel 718 coatings.
The Laves phase often forms in the interdendritic region. To investigate the effect of pulse frequency on the morphology and volume fraction of the Laves phase, the software Image-Pro-plus V6.0 was used to characterize the volume fraction of the Laves phase at each pulse frequency. Figure 10 shows the volume fraction of the Laves phase for each sample. Figure 10a shows the Laves phase content with length-diameter ratios larger than 3 and Figure 10b presents the variation in volume fraction of the Laves phase. From Figure 10a, it can be seen that when the pulse frequency is 500 Hz, about 10.1% of the Laves phase is long chained, the volume fraction of Laves phase is about 25.96%. With the decrease in pulse frequency, the long-chained Laves phase decreases and the volume fraction is about 6.52%, which indicates that the long-chained Laves phase was replaced by the Laves phase particles. Furthermore, as shown in Figure 10b, the average volume fraction of the Laves phase decreases to 2.41%. The results show that with the decrease in pulse frequency, the long-chained Laves phase transforms to Laves particle and the volume fraction of the Laves phase reduces. Due to the reduction in pulse frequency, the cooling rate increases, hence, the solidification time shortens and insufficient time was left for Nb and Mo to diffuse from the solid phase to liquid, leading to the suppression of Nb and Mo segregation, which effectively reduces the volume fraction and changes the morphology of the Laves phase. It was proven that the above variation is beneficial to the precipitation of the strengthening phase γ′, γ′′ in subsequent heat treatment, which also reduces the possibility for grain coarsening during the heat treatment [28]. In addition, compared to the long-chain Laves phase fabricated at high pulse frequency, the microstructure composed of fine dendrites and Laves particles possesses lower crack sensitivity [20].

3.3. Effect of Pulse Frequency on Hardness

Figure 11 shows the microhardness of the samples for each frequency. Figure 11a presents the cross-section hardness at different positions and Figure 11b highlights the average hardness of the coating. As shown in Figure 11b, the average hardness of coating solidified at 62.5 Hz, 125 Hz, 250 Hz and 500 Hz is 297 HV0.1, 287 HV0.1, 275 HV0.1 and 261 HV0.1, respectively, which indicates that the average hardness of the coating decreases with the increase in pulse frequency. This is due to high cooling rate obtained by the low pulse frequency which can effectively suppress grain coarsening, refine the dendrite and reduce dendrite spacing. According to the Hall–Petch relationship, the decrease in the grain size will enhance the resistance of the sample to deformation, which plays an important role in the high hardness of the sample solidified at low pulse frequency. Additionally, the pinning effect of the fine composite carbides which are discretely distributed in the matrix can stop the extension of the crack, contributing to better mechanical performance of the Inconel 718 coating. As pulse frequency increases gradually, the energy input becomes more continuous, hence, there is sufficient heat for the growth of grain, resulting ultimately in grain coarsening.

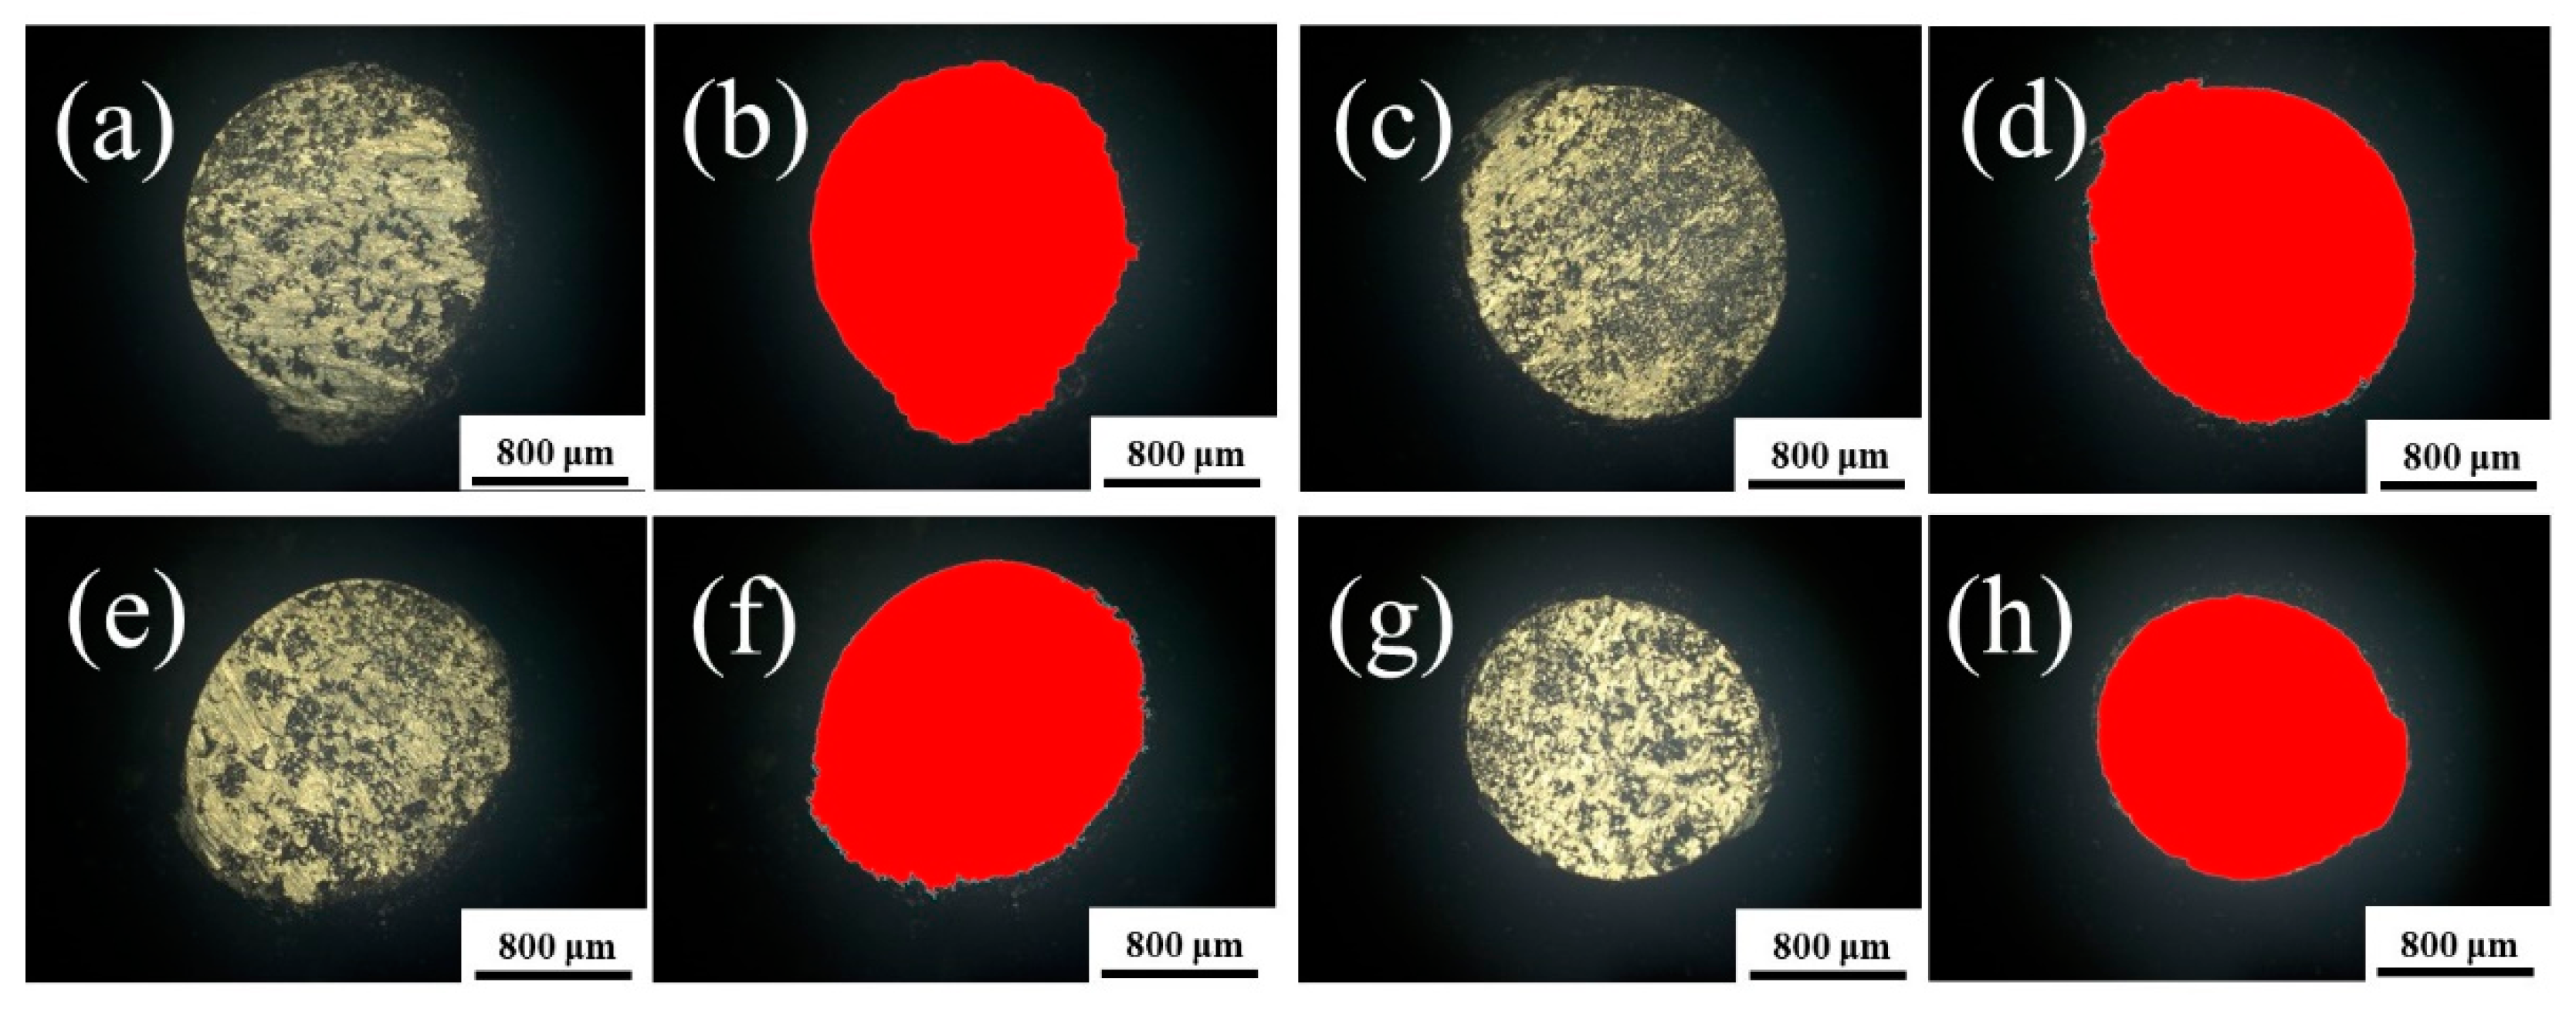
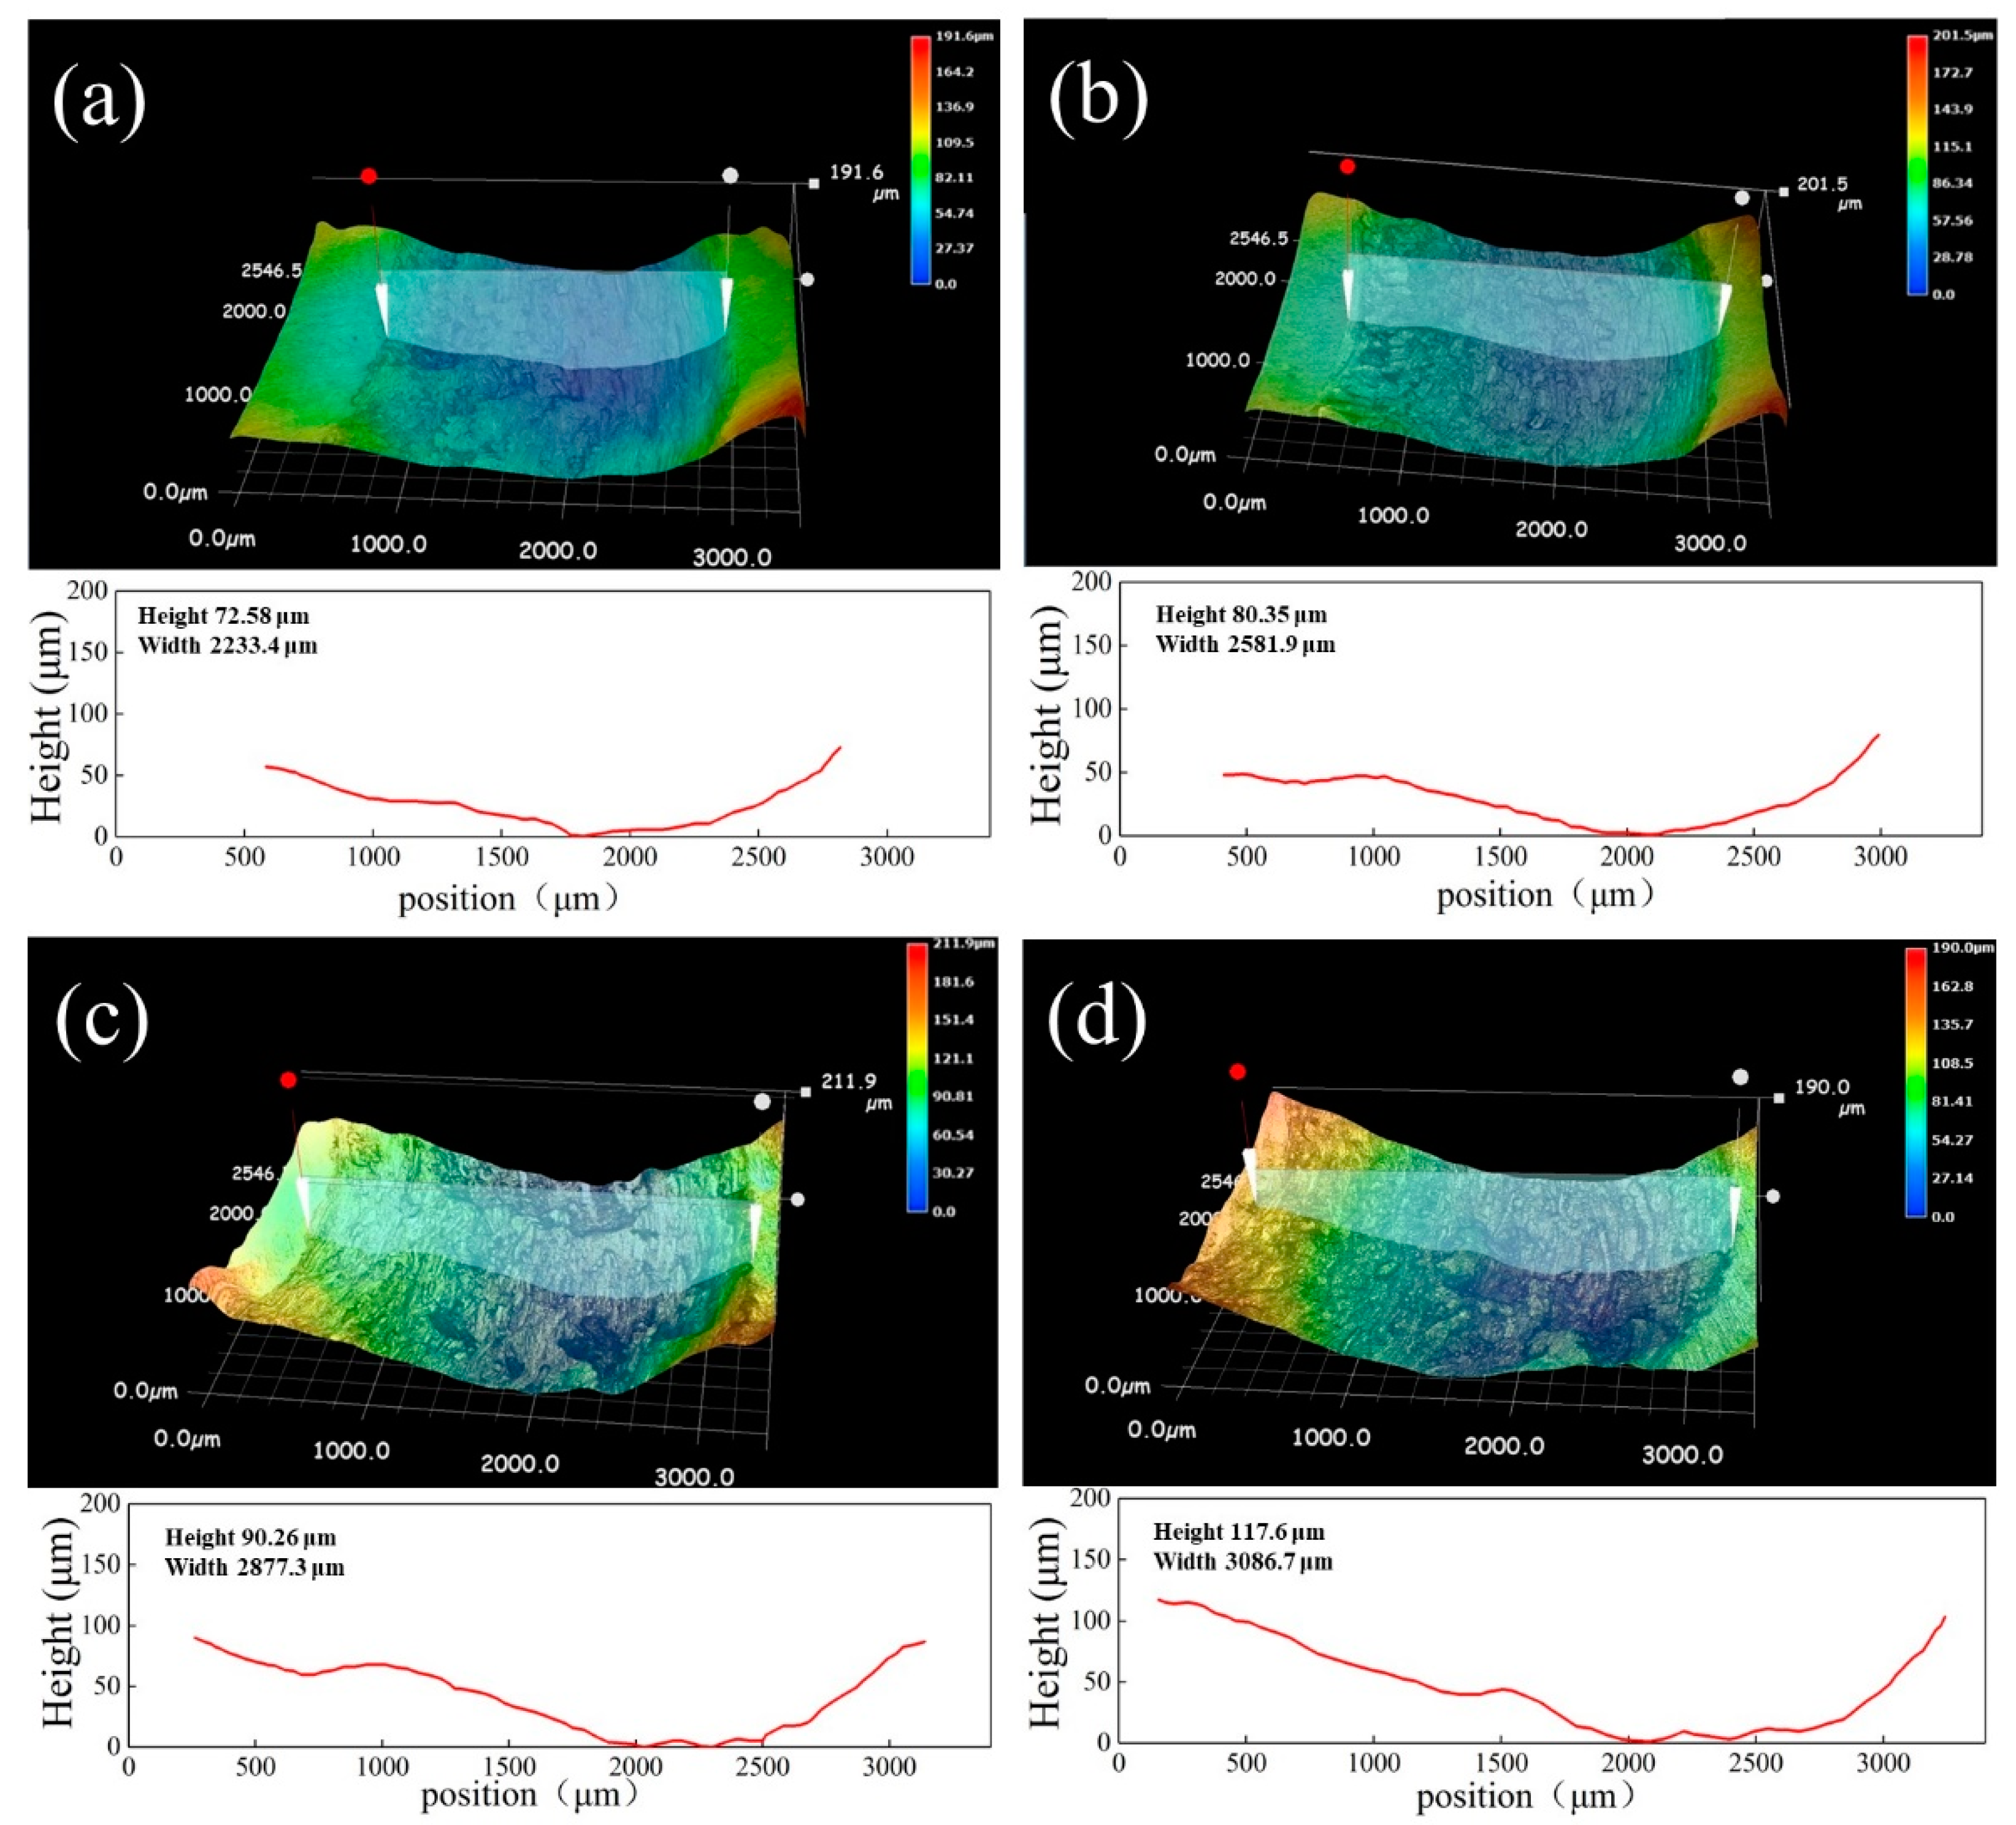
3.4. Effect of Pulse Frequency on Wear and Friction Resistance

Figure 12 shows the friction coefficient of the specimens for each frequency. Therein, it can be observed that the friction coefficient of the samples increases sharply at the beginning and then displays slight fluctuation, which is called the running-in stage. Subsequently, all the friction coefficient curves enter a steady stage. There are many reasons for this transition. First, due to the high-speed relative motion between the Si3N4 ball and the Inconel 718 coating, the contact area heat up rapidly because of the friction, resulting in the softening of the coating. With high hardness, Si3N4 ball will be pressed into the surface of the coating by the gravity of the applied load, making the contact between the friction pairs change from the original point contact to surface contact, which will then reduce the contact stress and slow down the wear rate of the friction pairs. Second, the work hardening behavior will prevent the acceleration of the wear and extend the steady stage. Additionally, it was shown in Figure 12 that with the increase in pulse frequency, the friction coefficient of coatings increases and the average friction coefficient of coatings solidified at different pulse frequencies (62.5 Hz, 125 Hz, 250 Hz and 500 Hz) is 0.2066, 0.2152, 0.2293 and 0.2387, respectively, which indicates that the coating solidified at 62.5 Hz shows the best antifriction property [33]. This is attributed to the high hardness of the coating solidified at 62.5 Hz, which endows the coating with good resistance to deformation under high load and effectively reduces the plastic flow caused by the squeeze between the friction pairs during the test.
Figure 13 shows the mass loss and wear rate of the samples. It can be seen therein that as the pulse frequency increases, the mass loss and wear rate of coating also increase, which is in accordance with the results of friction coefficient. According to the Holm–Archard wear law, the mass loss is inversely proportional to its hardness, which means that higher hardness shows better resistance to deformation. In this paper, the relationship between the hardness and mass loss of coatings at different pulse frequencies obtained is in accordance with the Holm–Archard wear law [34]. Especially, the coating solidified at 62.5 Hz shows the highest hardness and the lowest mass loss. Due to the effect of fine grain strengthening, there are more fine grain boundaries in the coating solidified at 62.5 Hz, thereby improving its resistance to dislocation slip, which enhances its resistance to deformation during the wear process. In addition, the dispersed distribution of small carbides reduces the mass loss of the coating in various wear mechanisms, which further improves the wear resistance of the coating.
Figure 14 shows the friction and wear morphology of each sample. As seen therein, exfoliation and furrow were found in samples at all pulse frequencies. Thus, it can be understood that the wear mechanisms of the Inconel 718 coating are adhesive wear and abrasive wear. The exfoliation was the result of peeling the material off on the surface of the Inconel 718 coating. During the friction, the asperity on the surface of the Inconel 718 coating plastically deformed due to high temperature and contact stress induced by friction, and then was welded with the Si3N4 ball. When the welding strength is higher than the shear strength of the coating, the material on the surface of the Inconel 718 coating will be peeled off, resulting in the occurrence of exfoliation. Simultaneously, a part of the growing welding point will transfer to the surface of the Si3N4 ball and become a new asperity which causes two-body abrasive wear. In addition, the other part of the welding point fractured and fell off, becoming the debris which causes three-body abrasive wear. The above two abrasive wears cause the appearance of a furrow. From Figure 14, it can be observed that at high pulse frequency, the size of exfoliation and the width of furrow are larger than that at low pulse frequency. Adhesive wear is the main wear mechanism for coatings at high frequency. With the decrease in pulse frequency, both the size of exfoliation and the furrow decreases gradually, with some minor scratches on the worn surface occurring at the same time, which indicates that the abrasive wear is becoming the dominant wear mechanism. This is because at high frequency, the coating is prone to deform plastically due to its low hardness, which results in the large area of exfoliation and furrow with long width. However, when the frequency is low, the coating possesses greater resistance to deformation and is not easy to peel off because of its high hardness, thereby reducing the size of the exfoliation and the furrow width.
Figure 15 shows the EDS results at the fracture. As seen therein, the chemical composition is C18.70-O5.63-Nb1.59-Mo1.01-Cr14.97-Fe14.01-Ni43.64-Si0.44 (wt.%). Due to the high content of C and Cr, and considering the low Gibbs free energy for the combination of the two elements, it would be reasonable to identify this phase as chromium carbide. Because of its high hardness and distribution along the grain boundaries, this type of chromium carbide is detrimental to the roughness and the elongation of the material. During friction, it is prone to become the brittle crack source, causing the peeling off and fracture at the coating surface.
To further investigate the effect of pulse frequency on the Si3N4 ball, the friction and wear morphology of the Si3N4 ball were analyzed. Figure 16 shows the friction and wear morphology of the ball head. It seen therein, the contact surface of the Si3N4 ball has transformed from a smooth arc shape to a rough plane and there are abundant of transferred material adhesive to its surface. With the increase in the hardness of coatings, it becomes harder for the Si3N4 ball to be pressed into the surface of the coating and the ball will grind together with the debris and asperities on the surface of the ball, which intensifies the abrasive wear of coatings and increases the worn surface area of the ball. Meanwhile, with the aggravation of abrasive wear, a large number of uneven black substrates are exposed in the wear area. The abrasion morphology shows that the wearing trace of layer is deep furrow, as presented in Figure 16a. However, protected by the welding with large amount of transferred material, the coatings whose main wear mechanism is adhesive wear possess a lower area of worn surface. No obvious furrow can be found in Figure 16g, and there is also no obvious peeling-off area in Figure 16g. Image recognition and analysis were carried out on the worn surface of the Si3N4 ball and edge detection was performed on the worn surface of the Si3N4 ball based on the Sobel operator. The results show that the area of worn surface of the Si3N4 ball for 62.5 Hz, 125 Hz, 250 Hz and 500 Hz is 2.662 mm2, 2.633 mm2, 2.526 mm2 and 2.016 mm2, respectively.
Figure 17 shows the friction and wear morphology of each sample. It can be seen therein that with the increase in pulse frequency, the depth of the worn surface increases from 77.58 μm to 117.6 μm and the width of worn surface increases from 2233.4 μm to 3086.7 μm, which indicates that the sample solidified at low frequency can better resist the intrusion of the Si3N4 ball and it possesses better anti-wear property.

4. Conclusions

  • With the increase in pulse frequency, the temperature fluctuation of the molten pool reduces and the thermal stability enhances gradually. The average solidification time of the molten pool increases from 31 ms to 43 ms, and the average cooling rate decreases from 3732 °C/s to 2524 °C/s. The flowability of the molten pool is better at low frequency. The cladding depth and width reaches the maximum, and their average values are 286 μm and 2912 μm, respectively.
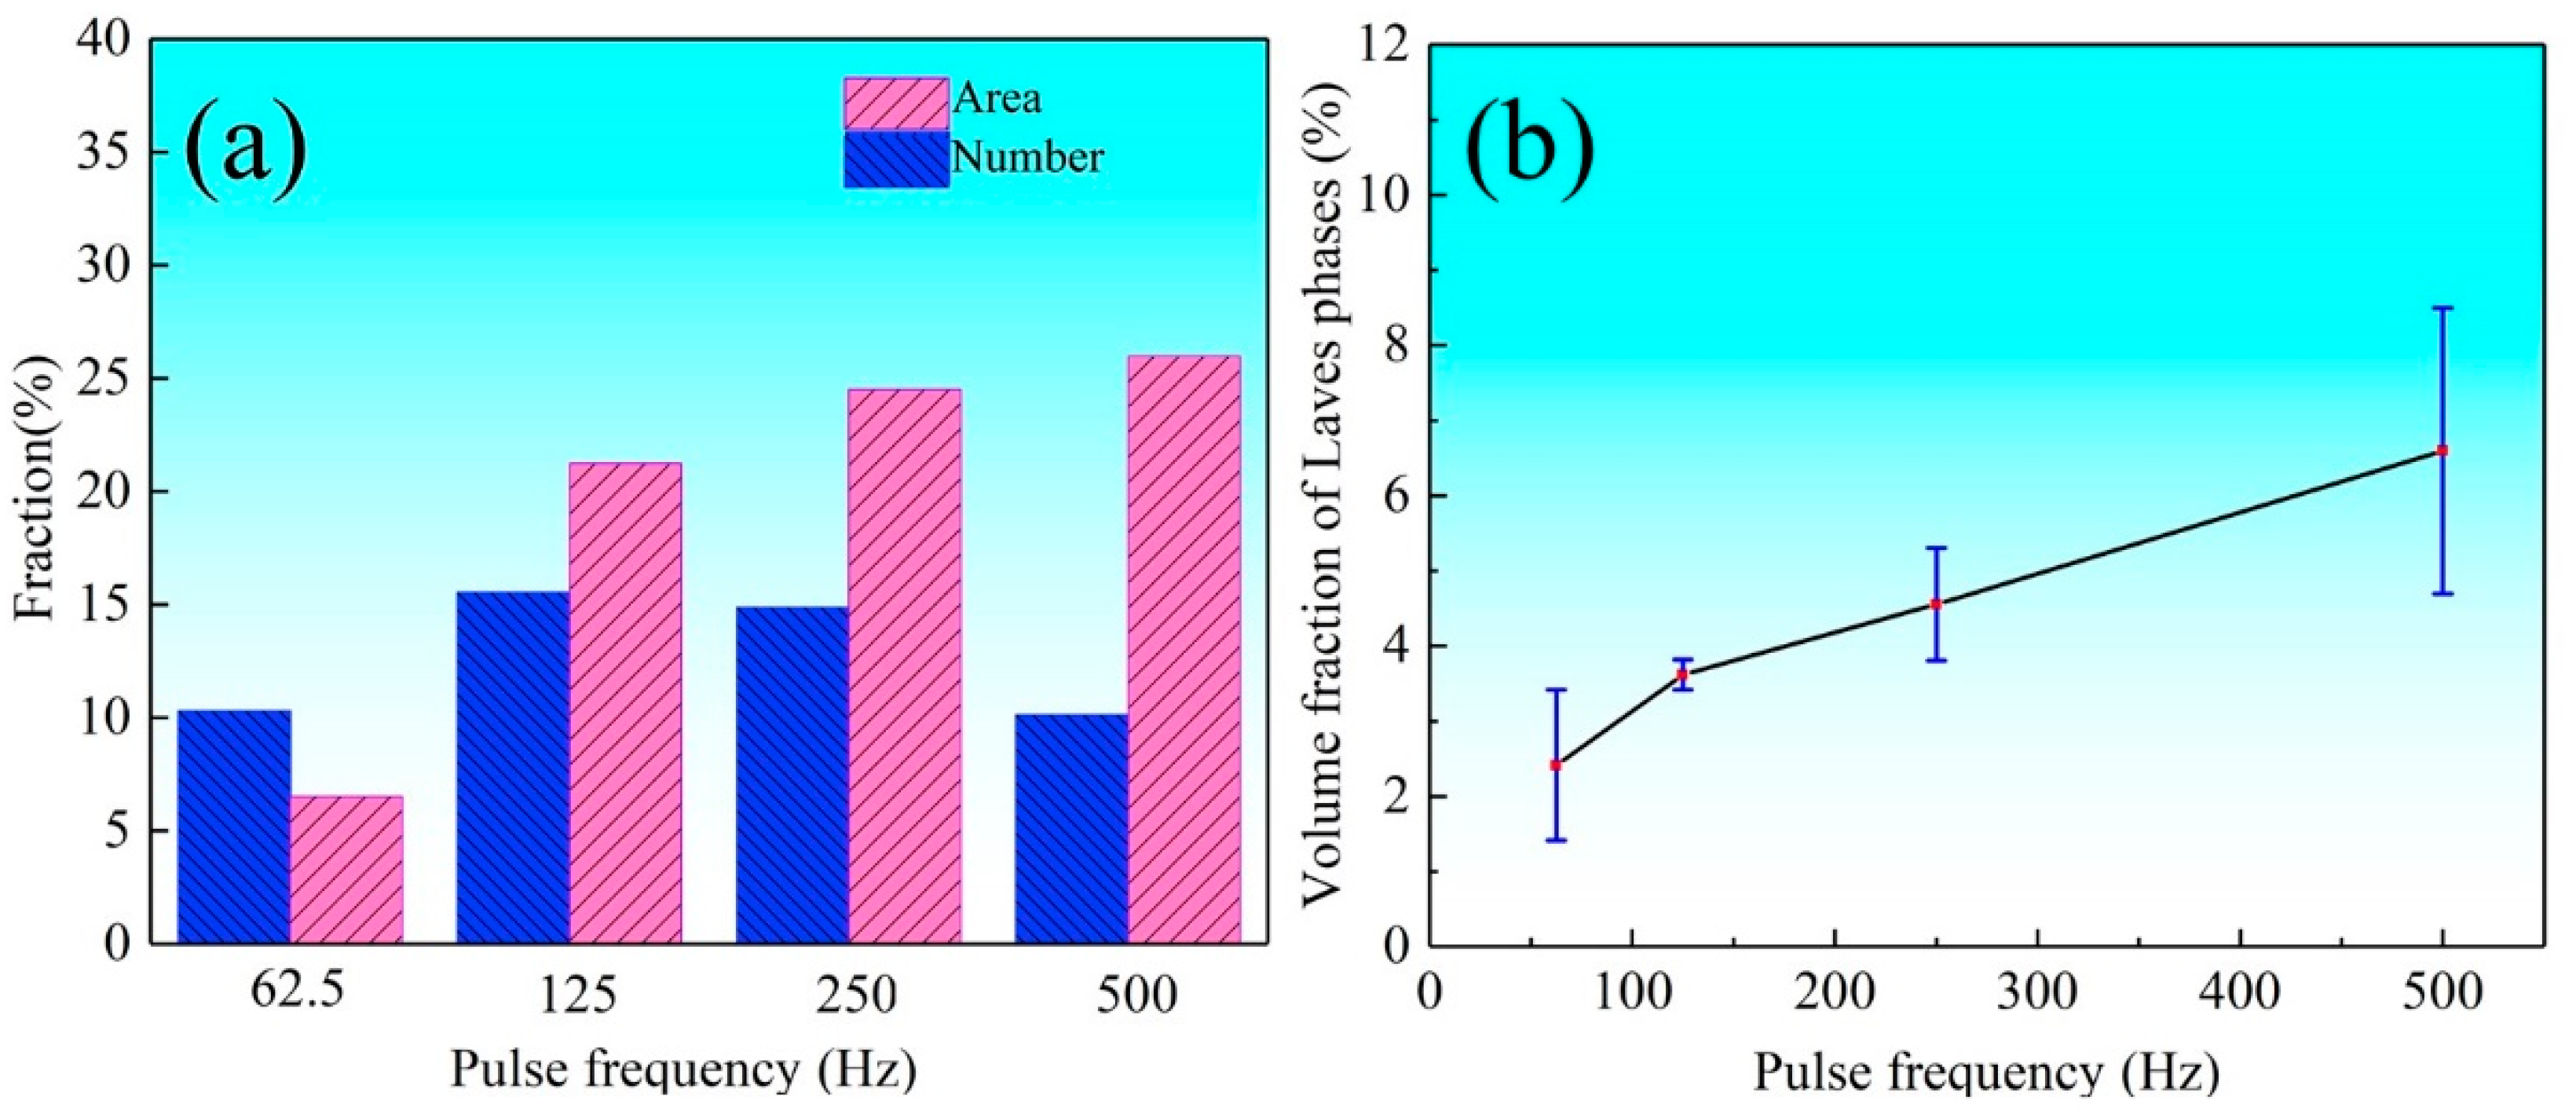
  • At lower frequency, dendrites are refined, and the morphology of the Laves phase changes from chain block to granular, and the volume fraction decreases from 6.59% to 2.41%. The formation of the Laves phase was effectively suppressed. With the decrease in pulse frequency, the hardness of coating increases. Under the action of fine grain strengthening and dispersion strengthening of the primary carbide, the hardness of the coating increased from 261 HV0.1 to 297 HV0.1,
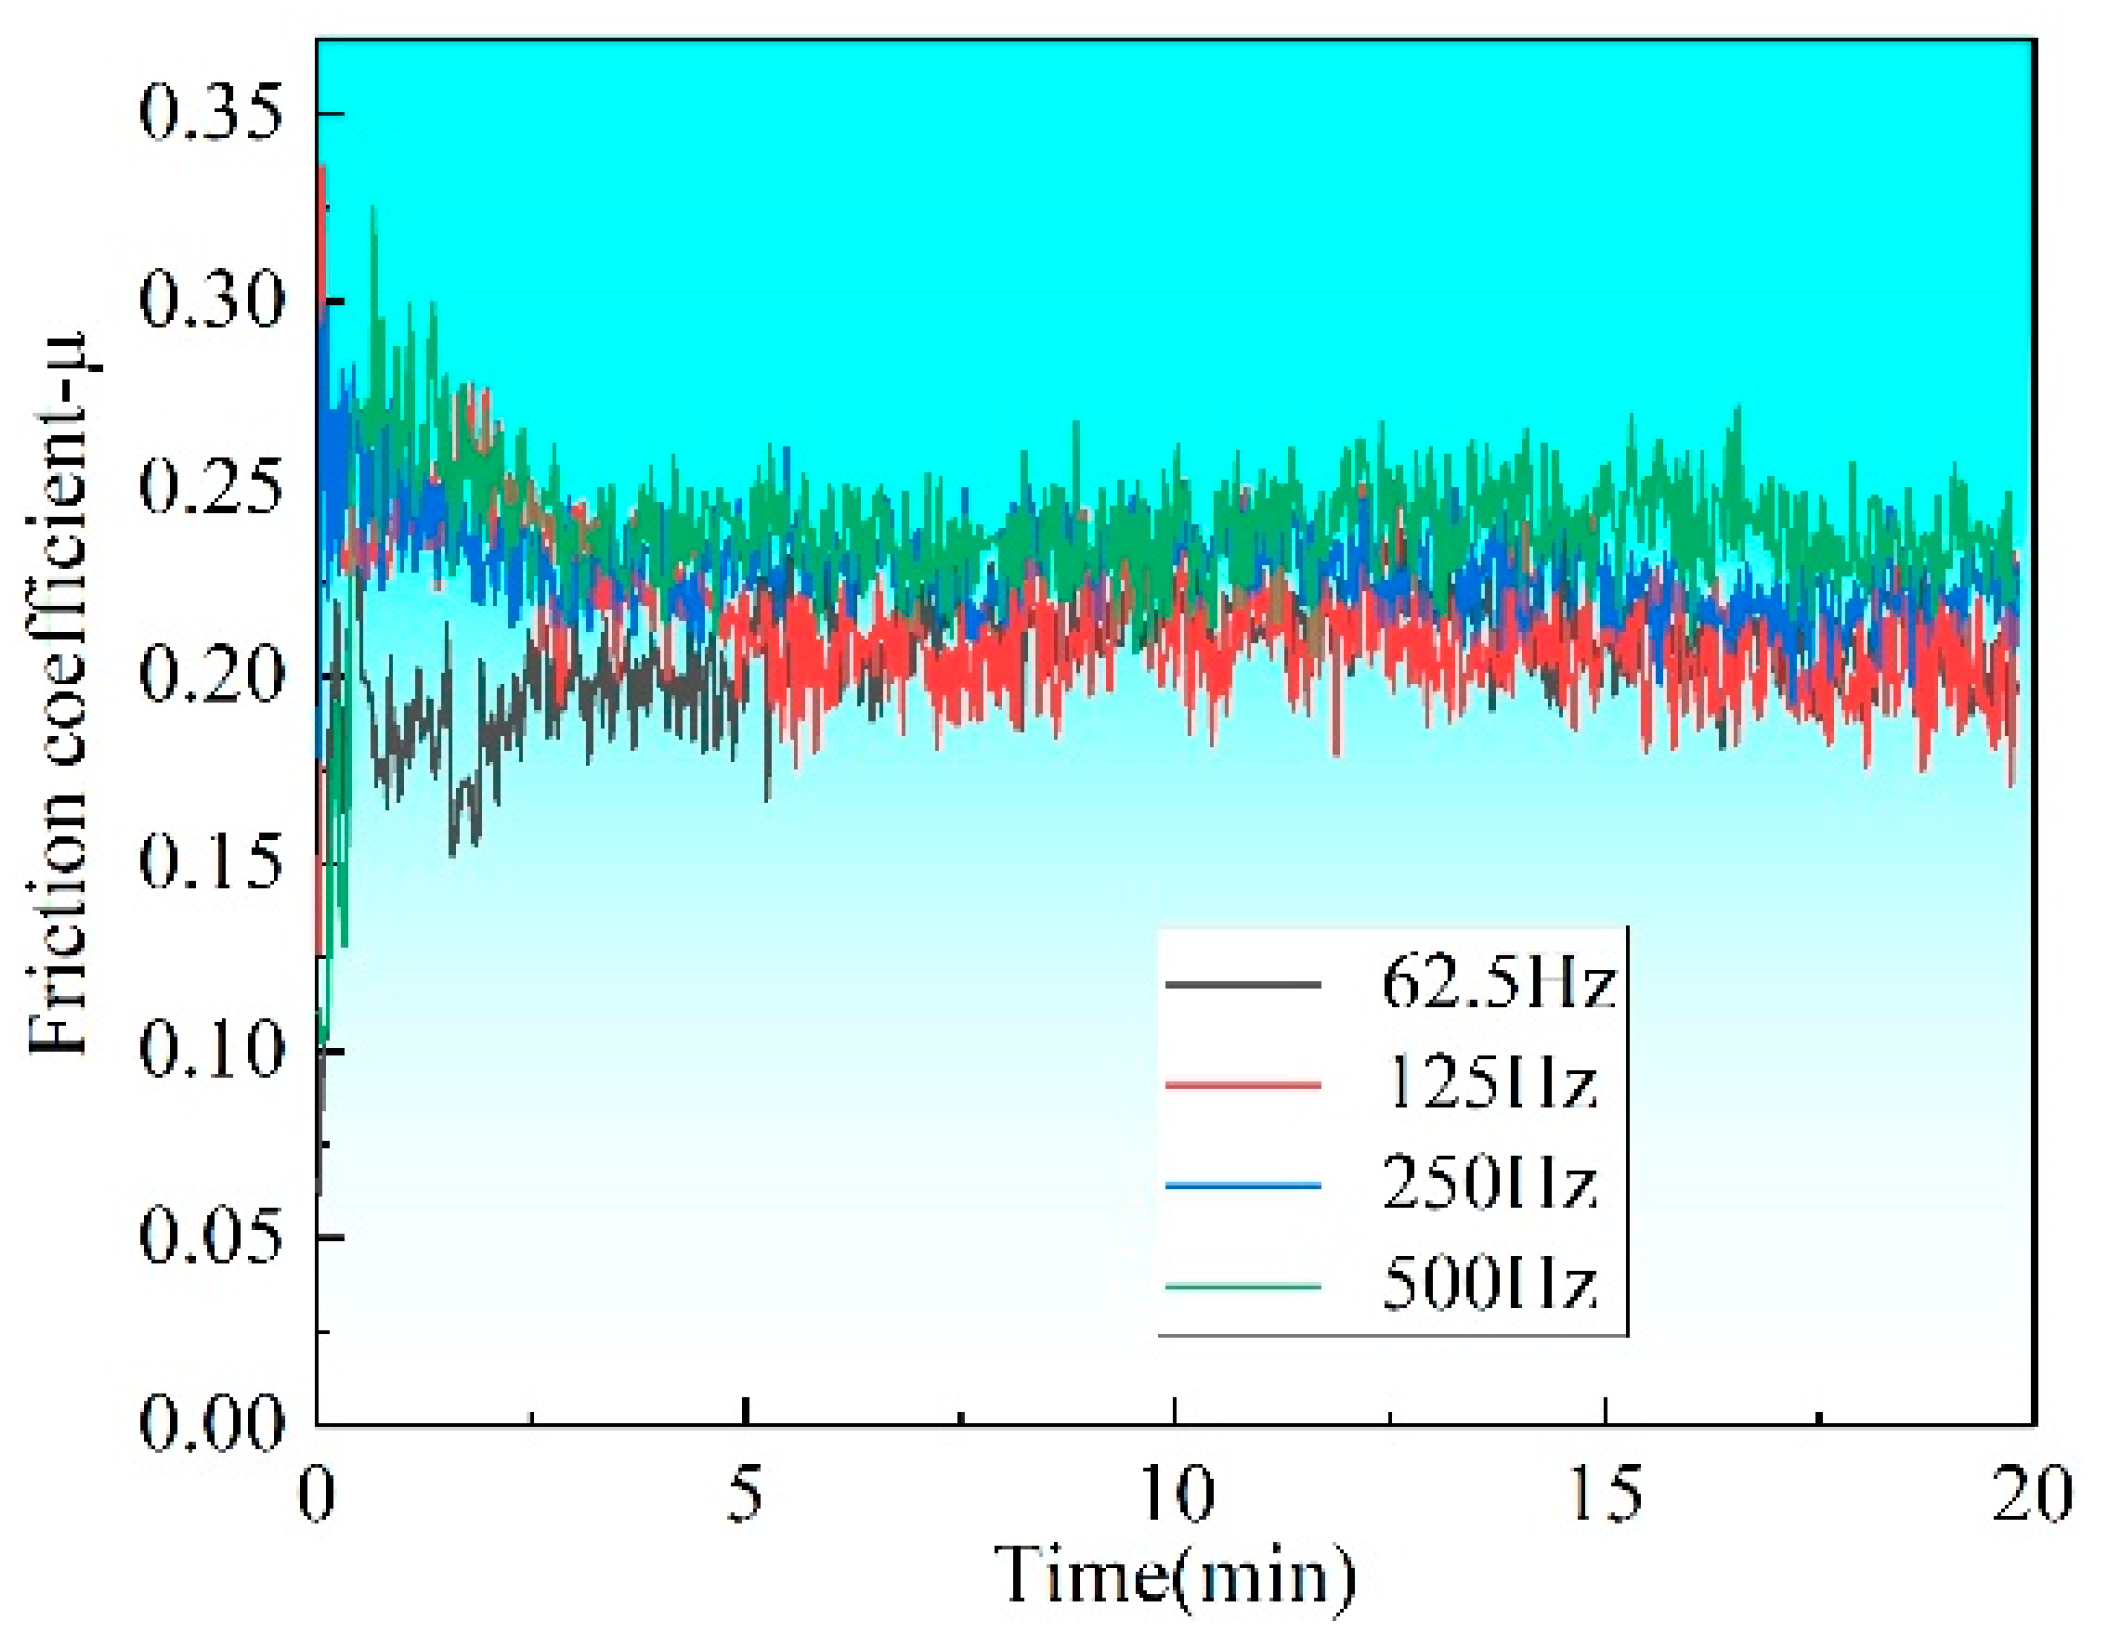
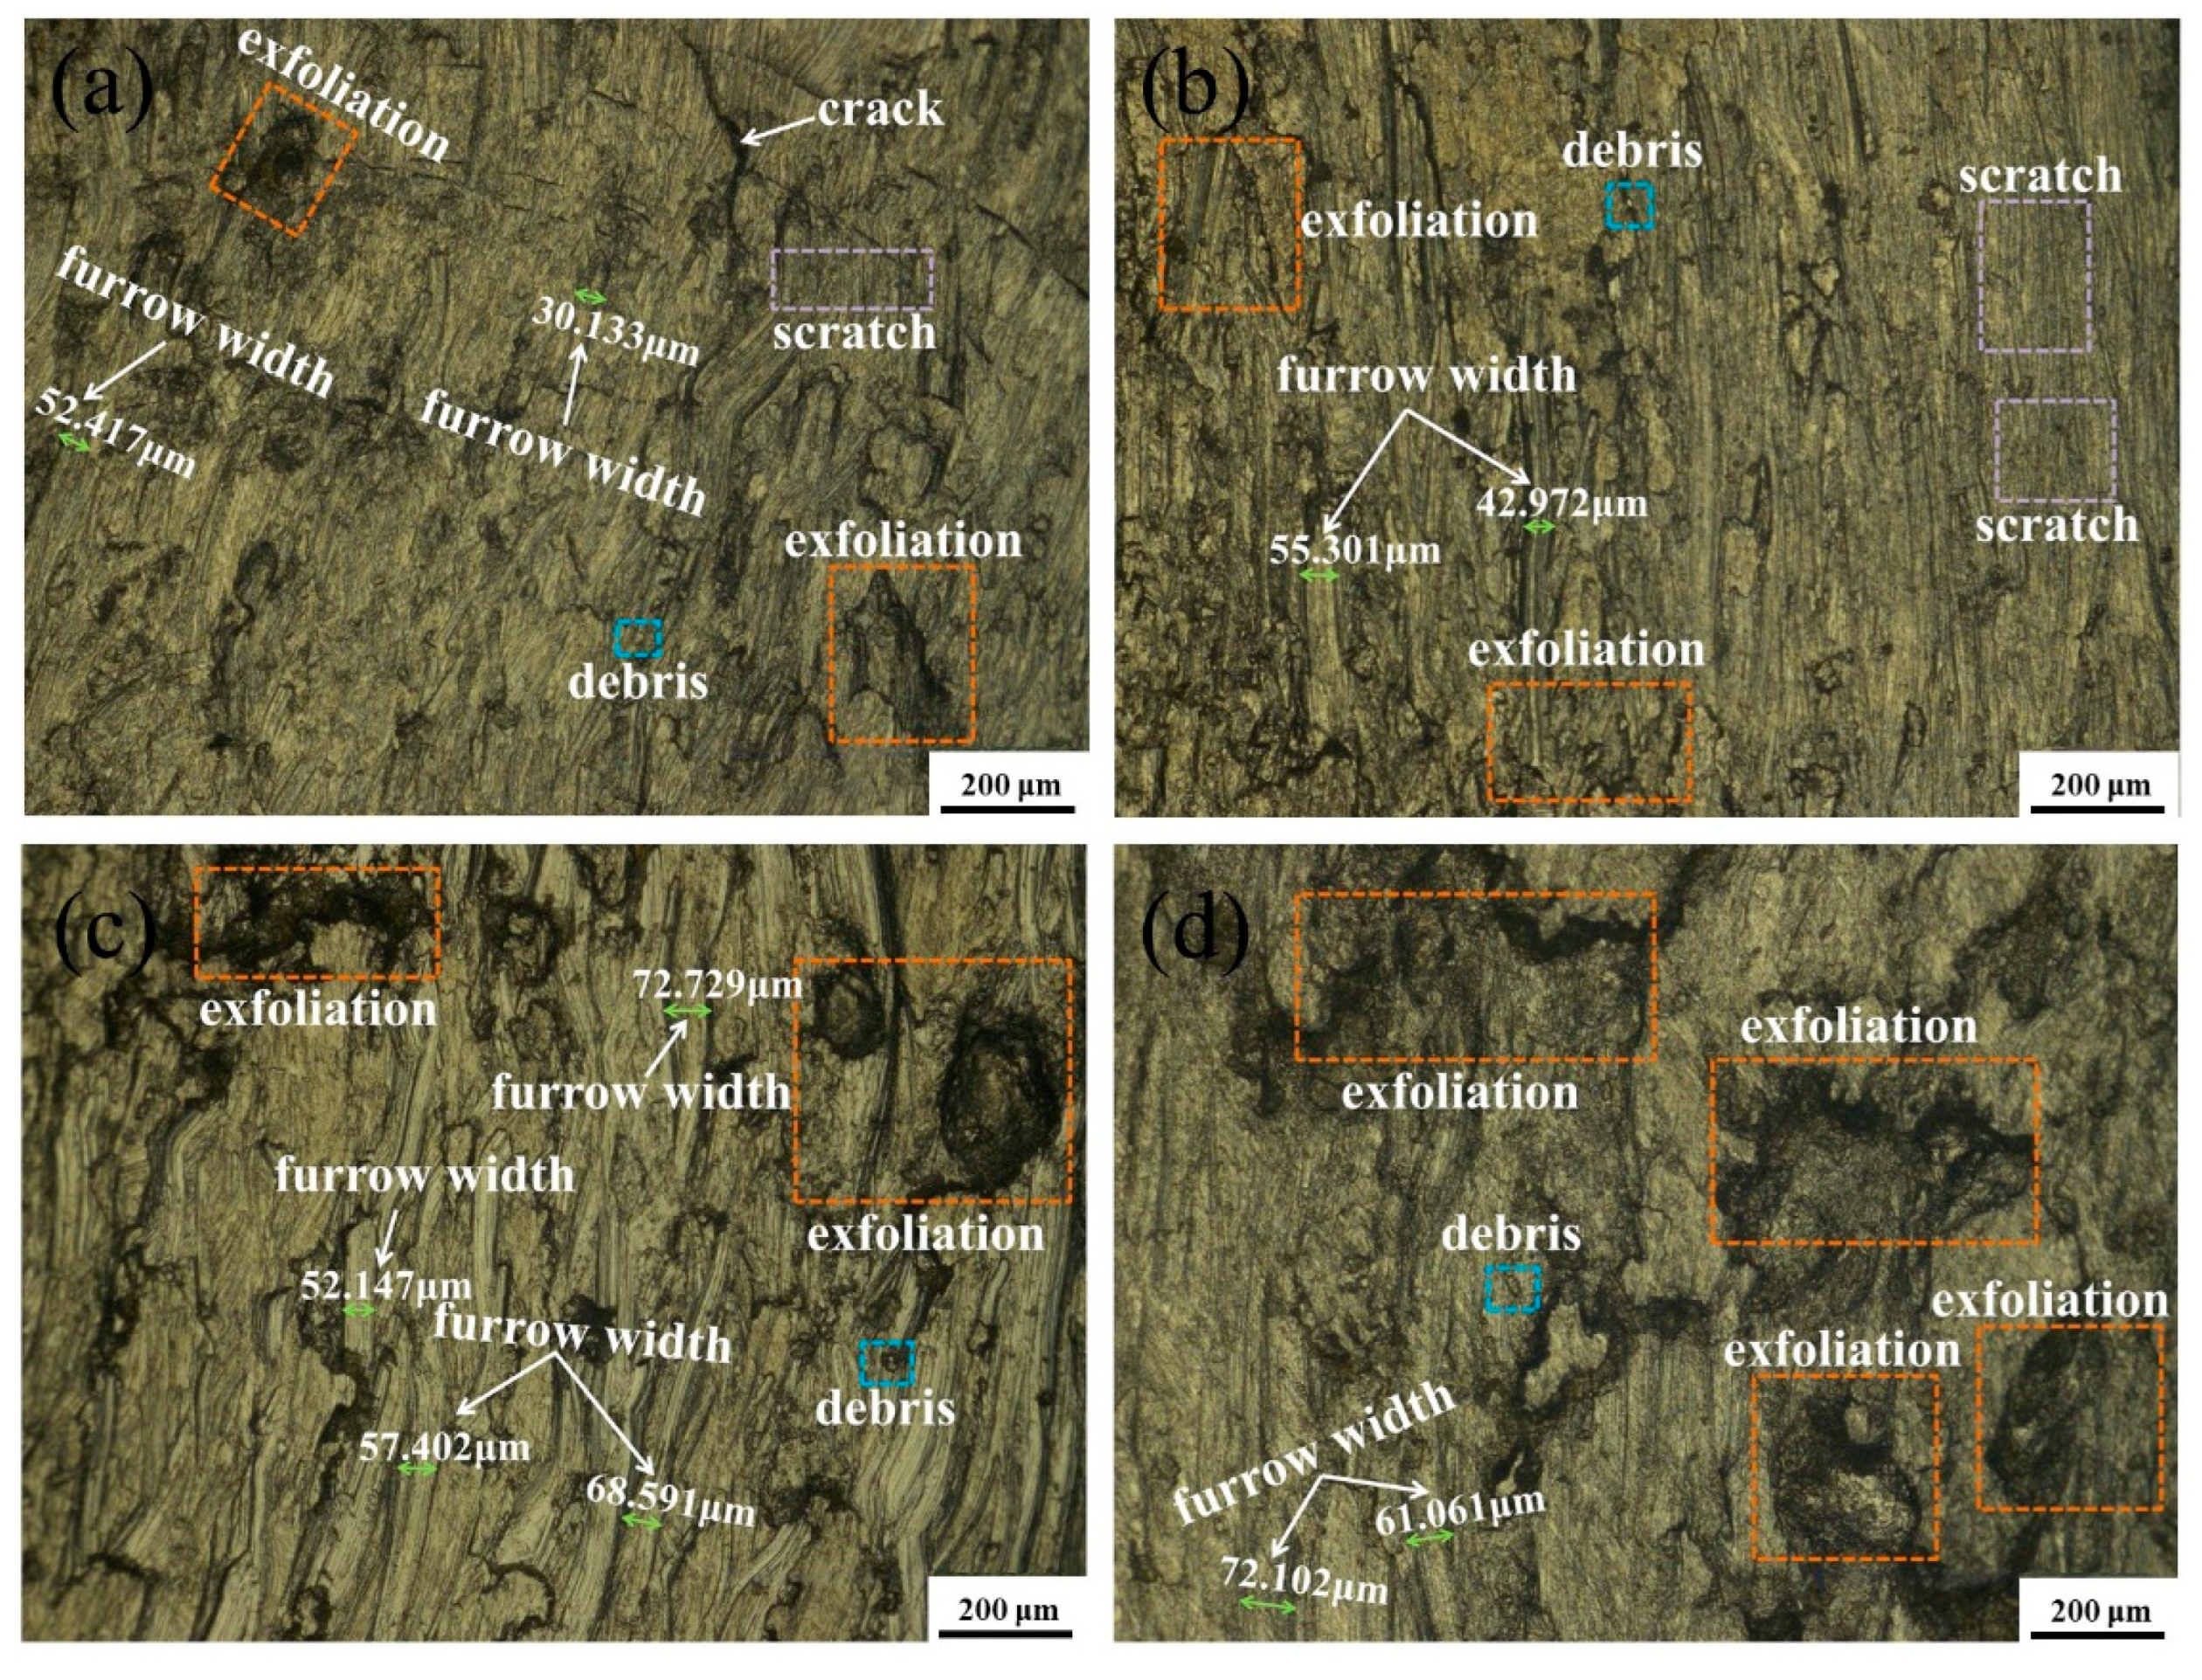
  • At low frequency, the samples possess higher hardness and better antifriction and anti-wear property. With the decrease in pulse frequency, both the size of exfoliation and the furrow decrease gradually. Additionally, the friction coefficient reduces from 0.2387 to 0.2066, and the wear rate decreases from 27.30 × 10⁻⁴ mg·N−1·m−1 to 19.15 × 10⁻⁴ mg·N−1·m−1. The abrasive wear of the Si3N4 ball becomes more serious, which is caused by debris, and the area of worn surface of the Si3N4 ball increases from 2.016 mm2 to 2.662 mm2. The results show that low pulse frequency is beneficial to improve the wear resistance of the Inconel 718 coating.

Author Contributions

Conceptualization, J.W.; methodology, J.C., X.Y. and S.W.; formal analysis, X.Y.; investigation, J.W., S.W. and D.L.; resources, D.L. and H.Z.; data curation, J.W.; writing—original draft preparation, J.W.; writing—review and editing, J.C. and X.Y. All authors have read and agreed to the published version of the manuscript.

Funding

The work was supported by the Public Welfare Technology Research Projects of Zhejiang Province (Grant No.: LTGC23E050001).

Informed Consent Statement

Informed consent was obtained from all subjects involved in the study.

Data Availability Statement

Not applicable.

Conflicts of Interest

The authors declare no conflict of interest.

References

  1. Sui, S.; Tan, H.; Chen, J.; Zhong, C.; Li, Z.; Fan, W.; Gasser, A.; Huang, W. The influence of Laves phases on the room temperature tensile properties of Inconel 718 fabricated by powder feeding laser additive manufacturing. Acta Mater. 2019, 164, 413–427. [Google Scholar] [CrossRef]
  2. Xiao, H.; Li, S.; Han, X.; Mazumder, J.; Song, L. Laves phase control of Inconel 718 alloy using quasi-continuous-wave laser additive manufacturing. Mater. Des. 2017, 122, 330–339. [Google Scholar] [CrossRef]
  3. Zhang, Y.; Yang, L.; Dai, J.; Huang, Z.; Meng, T. Grain growth of Ni-based superalloy IN718 coating fabricated by pulsed laser deposition. Opt. Laser Technol. 2016, 80, 220–226. [Google Scholar] [CrossRef]
  4. Muvvala, G.; Karmakar, D.; Nath, A. In-process detection of microstructural changes in laser cladding of in-situ Inconel 718/TiC metal matrix composite coating. J. Alloys Compd. 2018, 740, 545–558. [Google Scholar] [CrossRef]
  5. Cao, J.; Yang, X.; Wang, S.; Zhang, H.; Yang, L.; Qiao, Y.; Li, C. Wear and Corrosion Resistance of Laser Cladding Ni60-TiC Ceramic Coating on 45 Steel Surface. Rare Met. Mater. Eng. 2020, 49, 611–617. [Google Scholar]
  6. He, S.Y.; Liu, X.D.; Zhao, S.Z. Microstructure and Wear Resistance of Carbon Fibers Reinforced 316L Stainless Steel Prepared Using Laser Cladding. Chin. J. Lasers 2020, 47, 502010. [Google Scholar]
  7. Liu, Z.H.; Liu, Y.F.; Zhang, L.L. Microstructure and High-Temperature Friction and Wear Properties of TiC/CaF2/Inconel 718 Composite Fabricated Using Laser Melting Deposition Technique. Chin. J. Lasers 2020, 47, 0102008. [Google Scholar]
  8. Wang, L.; Xia, H.C.; Hu, Y. Porosity Defects Suppression in Narrow V-Groove Laser Remanufacturing Zone through Electromagnetic Composite Field. Chin. J. Lasers 2020, 47, 0602003. [Google Scholar] [CrossRef]
  9. Chauhan, P.; Shadangi, Y.; Bhatnagar, A.; Singh, V.; Chattopadhyay, K. Influence of Surface Nano-Structuring on Microstructure, Corrosion Behavior and Osteoblast Response of Commercially Pure Titanium Treated Through Ultrasonic Shot Peening. J. Miner. Met. Mater. Soc. 2022, 74, 584–595. [Google Scholar] [CrossRef]
  10. Shadangi, Y.; Chattopadhyay, K.; Rai, S.B.; Singh, V. Effect of Laser shock peening on microstructure, mechanical properties and corrosion behavior of interstitial free steel. J. Surf. Coat. Technol. 2015, 280, 216–224. [Google Scholar] [CrossRef]
  11. Kong, D.; Dong, C.; Ni, X.; Zhang, L.; Man, C.; Zhu, G.; Yao, J.; Yao, J.; Wang, L.; Cheng, X.; et al. Effect of TiC content on the mechanical and corrosion properties of Inconel 718 alloy fabricated by a high-throughput dual-feed laser metal deposition system. J. Alloys Compd. 2019, 803, 637–648. [Google Scholar] [CrossRef]
  12. Zhong, L.Y.; Ning, L.W.; Ren, W.B.; Chen, S.X. Crack Analysis and Control of Laser Cladding Inconel 718 Alloy. Surf. Technol. 2020, 49, 233–243. [Google Scholar]
  13. Janaki Ram, G.D.; Venugopal Reddy, A.; Prasad Rao, K.; Madhusudhan Reddy, G. Control of Laves phase in Inconel 718 GTA welds with current pulsing. Sci. Technol. Weld. Join. 2004, 9, 390–398. [Google Scholar] [CrossRef]
  14. Yuan, K.; Guo, W.; Li, P.; Wang, J.; Su, Y.; Lin, X.; Li, Y. Influence of Process Parameters and Heat Treatments on the Microstructures and Dynamic Mechanical Behaviors of Inconel 718 Superalloy Manufactured by Laser Metal Deposition. Mater. Sci. Eng. A 2018, 721, 215–225. [Google Scholar] [CrossRef]
  15. Qi, H.; Azer, M.; Ritter, A. Studies of standard heat treatment effects on microstructure and mechanical properties of laser net shape manufactured Inconel 718. Metall. Mater. Trans. Part A 2009, 40, 2410–2422. [Google Scholar] [CrossRef]
  16. Zhao, X.; Jing, C.; Xin, L. Study on microstructure and mechanical properties of laser rapid forming Inconel 718. Mater. Sci. Eng. A 2008, 478, 119–124. [Google Scholar] [CrossRef]
  17. Chlebus, E.; Gruber, K.; Kuźnicka, B.; Kurzac, J.; Kurzynowski, T. Effect of heat treatment on the microstructure and mechanical properties of Inconel 718 processed by selective laser melting. Mater. Sci. Eng. A 2015, 639, 647–655. [Google Scholar] [CrossRef]
  18. Zhang, J.; Zhang, Q.L.; Yao, J.H.; Wu, Z.S.; Ding, H.Y. Effect of Laser Cladding Process Parameters on Microstructure and Element Segregation of IN718 Alloy. Hot Work. Technol. 2022, 51, 30–34. [Google Scholar]
  19. Chen, Y.; Lu, F.; Zhang, K.; Nie, P.; Hosseini, S.R.E.; Feng, K.; Li, Z. Dendritic microstructure and hot cracking of laser additive manufactured Inconel 718 under improved base cooling. J. Alloys Compd. 2016, 670, 312–321. [Google Scholar] [CrossRef]
  20. Nie, P.L.; Ojo, O.A.; Li, Z.G. Numerical modeling of microstructure evolution during laser additive manufacturing of a nickel-based superalloy. Acta Mater. 2014, 77, 85–95. [Google Scholar] [CrossRef]
  21. Zhang, Y.C.; Li, Z.G.; Nie, P.L.; Wu, Y.X. Effect of ultrarapid cooling on microstructure of laser cladding IN718 coating. Surf. Eng. 2013, 29, 414–418. [Google Scholar] [CrossRef]
  22. Cheng, M.; Xiao, X.; Luo, G.; Song, L. Integrated control of molten pool morphology and solidification texture by adjusting pulse duration in laser additive manufacturing of Inconel 718. Opt. Laser Technol. 2021, 142, 107137. [Google Scholar] [CrossRef]
  23. Lai, J.; Lu, Y.Y.; Zhang, H.; Chen, H.; Lin, S.G.; Liu, D.J. Liquation Cracks in Superalloys Repaired by Low-heat Input Pulsed Laser. Chin. J. Lasers 2019, 46, 402011. [Google Scholar]
  24. Li, Y.F.; Shi, Y. Influences of Pulse Frequency on Microstructure and Properties in Laser Cladding Layers. China Mech. Eng. 2021, 32, 2108–2124. [Google Scholar]
  25. Xiao, H.; Li, S.M.; Xiao, W.J.; Li, Y.Q.; Cha, L.M.; Mazumder, J.; Song, L.J. Effects of laser modes on Nb segregation and Laves phase formation during laser additive manufacturing of nickel-based superalloy. Mater. Lett. 2017, 188, 260–262. [Google Scholar] [CrossRef]
  26. Shi, C.X.; Liu, Y.F.; Li, Y.; Sun, G.B.; Zhang, Z.; Feng, Z.C. Microstructure and High Temperature Wear Resistance of TiC/Inconel 718 Composites In-situ Synthesized by Plasma Melting Deposition Technique. Rare Met. Mater. Eng. 2019, 48, 1497–1504. [Google Scholar]
  27. Wang, Y.W. Numerical Simulation and Experimental Study of Molten Pool Flow Behavior in Pulsed Laser Melting Deposition. Master’s Thesis, Dalian University of Technology, Dalian, China, 2021; pp. 53–54. [Google Scholar]
  28. Zhang, H.; Zou, Y.; Zou, Z.; Zhao, W. Comparative study on continuous and pulsed wave fiber laser cladding in-situ titanium–vanadium carbides reinforced Fe-based composite layer. Mater. Lett. 2015, 139, 255–257. [Google Scholar] [CrossRef]
  29. Shah, K.; Pinkerton, A.J.; Salman, A.; Li, L. Effects of Melt Pool Variables and Process Parameters in Laser Direct Metal Deposition of Aerospace Alloys. Mater. Manuf. Process. 2010, 25, 1372–1380. [Google Scholar] [CrossRef] [Green Version]
  30. Liu, F.; Lin, X.; Leng, H.; Cao, J.; Liu, Q.; Huang, C.; Huang, W. Microstructural changes in a laser solid forming Inconel 718 superalloy thin wall in the deposition direction. Opt. Laser Technol. 2013, 45, 330–335. [Google Scholar] [CrossRef]
  31. Wan, H.Y.; Zhou, Z.J.; Li, C.P.; Chen, G.F.; Zhang, G.P. Effect of scanning strategy on grain structure and crystallographic texture of Inconel 718 processed by selective laser melting. Mater. Sci. Technol. 2018, 34, 1799–1804. [Google Scholar] [CrossRef]
  32. Liu, C.M.; Wang, H.M.; Tian, X.J.; Tang, H.B. Subtransus triplex heat treatment of laser melting deposited Ti–5Al–5Mo–5V–1Cr–1Fe near β titanium alloy. Mater. Sci. Eng. A 2014, 590, 30–36. [Google Scholar] [CrossRef]
  33. Tian, S.G.; Li, J.J.; Xie, J.; Zhou, X.M. Phase constituent and granularity distribution of γ’ phase in FGH95 nickel based superalloy. J. Shenyang Univ. Technol. 2011, 33, 635–639. [Google Scholar]
  34. Hu, G.X.; Cai, X.; Rong, Y.H. Fundamentals of Materials Science; Shanghai Jiao Tong University Press: Shanghai, China, 2006; pp. 124–125. [Google Scholar]
Figure 1. Laser prototyping system of Coaxial powder feeding.
Crystals 13 00986 g001
Figure 2. Schematic diagram of scanning process strategy and pulsed laser. (a) Route diagram; (b) Schematic diagram of a pulsed laser.
Crystals 13 00986 g002
Figure 3. Comparison of high and low temperature states of pulsed laser molten pool at different frequencies. (a) 62.5 Hz low temperature; (b) 62.5 Hz high temperature; (c) 125 Hz low temperature; (d) 125 Hz high temperature; (e) 250 Hz low temperature; (f) 250 Hz high temperature; (g) 500 Hz low temperature; (h) 500 Hz high temperature.
Crystals 13 00986 g003
Figure 4. Temperature curve of the molten pool under different light source modes. (a) static 62.5 Hz; (b) static 125 Hz; (c) static 250 Hz; (d) static 500 Hz; (e) motion 62.5 Hz; (f) motion 125 Hz; (g) motion 250 Hz; (h) motion 500 Hz.
Crystals 13 00986 g004
Figure 5. The variation in cladding coating morphology with pulse frequency. (a) 62.5 Hz; (b) 125 Hz; (c) 250 Hz; (d) 500 Hz; (e) Dimensional change in cladding coating; (f) Dilution rate change in cladding coating.
Crystals 13 00986 g005
Figure 6. Optical micrographs of Inconel 718 samples with different pulse frequencies. (a) 62.5 Hz; (b) 125 Hz; (c) 250 Hz; (d) 500 Hz; (e) A position; (f) B position.
Crystals 13 00986 g006
Figure 7. Backscattered electron morphologies of different samples. (a) 62.5 Hz; (b) 125 Hz; (c) 250 Hz; and (d) 500 Hz.
Crystals 13 00986 g007
Figure 8. EDS spectrum of composite carbides.
Crystals 13 00986 g008
Figure 9. X-ray diffraction patterns of 500 Hz.
Crystals 13 00986 g009
Figure 10. Variation in the Laves phase content for each samples. (a) Laves phase content with length-diameter meter ratio larger than 3; and (b) Volume fraction of Laves phase for different pulse frequency.
Crystals 13 00986 g010
Figure 11. Microhardness of specimens for each frequency. (a) cross-section hardness distribution; and (b) average hardness.
Crystals 13 00986 g011
Figure 12. Friction coefficient of specimens for each frequency.
Crystals 13 00986 g012
Figure 13. Mass loss and wear rate of test samples.
Crystals 13 00986 g013
Figure 14. Friction and wear morphology of each sample. (a) 62.5 Hz; (b) 125 Hz; (c) 250 Hz; (d) 500 Hz.
Crystals 13 00986 g014
Figure 15. EDS results of the fracture site.
Crystals 13 00986 g015
Figure 16. Friction and wear morphology of ball head. (a) 62.5 Hz morphology; (b) 62.5 Hz Contour extraction; (c) 125 Hz morphology; (d) 125 Hz Contour extraction; (e) 250 Hz morphology; (f) 250Hz Contour extraction; (g) 500 Hz morphology; (h) 500 Hz Contour extraction.
Crystals 13 00986 g016
Figure 17. Analysis of Friction and wear section profile of each sample. (a) 62.5 Hz; (b) 125 Hz; (c) 250 Hz; (d) 500 Hz.
Crystals 13 00986 g017
Table 1. Pulse laser parameters.
FrequencyPower T p u l s e T c y c l e d Pusle Energy
(Hz)(W)(ms)(ms)(%)(J)
62.514008165011.2
125140048505.6
250140024502.8
500140012501.4
Table 2. EDS scanning results of each position (wt.%).
PositionCrFeMoNbTiNiAlPossible Main Phase
116.2915.984.127.351.0248.930.03Laves
219.3418.752.692.811.2251.430.12γ-(Ni, Fe, and Cr)
314.0713.584.9811.270.9945.790.08Laves
418.4616.652.492.030.4348.440.04γ-(Ni, Fe, and Cr)
515.1614.896.3412.531.1448.010.12Laves
620.5019.252.071.600.4955.600.15γ-(Ni, Fe, and Cr)
713.3513.526.7715.011.4144.830.13Laves
820.1020.351.640.901.1252.650.08γ-(Ni, Fe, and Cr)
Disclaimer/Publisher’s Note: The statements, opinions and data contained in all publications are solely those of the individual author(s) and contributor(s) and not of MDPI and/or the editor(s). MDPI and/or the editor(s) disclaim responsibility for any injury to people or property resulting from any ideas, methods, instructions or products referred to in the content.

