Article

Comparison of Dislocation Structures in Cu Deformed at Strain Rates from Quasi-Static to Shock Loading Using X-ray Line Profile Analysis

1
Key Laboratory of Neutron Physics and Institute of Nuclear Physics and Chemistry, China Academy of Engineering Physics, Mianyang 621999, China
2
Institute of Fluid Physics, China Academy of Engineering Physics, Mianyang 621999, China
3
Department of Materials Physics, Eötvös University Budapest, P.O. Box 32, H-1518 Budapest, Hungary
*
Author to whom correspondence should be addressed.
Crystals 2023, 13(8), 1252; https://doi.org/10.3390/cryst13081252
Submission received: 30 June 2023 / Revised: 7 August 2023 / Accepted: 10 August 2023 / Published: 13 August 2023
(This article belongs to the Section Crystal Engineering)

Abstract

:
Polycrystalline copper samples were deformed in the range of strain rate between ~10−3 and 107 s−1 using a material testing machine, split Hopkinson pressure bar and electric gun. The quasi-static and Hopkinson bar samples were compressed at the strains of 0.1 and 0.4, and the electric gun samples were compressed at the shock pressures of 19, 25, 35 and 49 GPa. The dislocation structure in the recovered samples was determined using high-resolution X-ray line profile analysis. Compared to the quasi-static and Hopkinson bar tests, different characteristics of the evolution of dislocation density and arrangement were found in the planar plate impacts of the electric gun. The correlation between the flow stresses and the dislocation densities in the samples was discussed using the Taylor equation.

1. Introduction

Strain rate is one of essential variables that determine the behavior of plastic deformation. Under typical conditions of creep, rolling and shock loading, strain rates cover an extremely wide range from 10−7 s−1 to 109 s−1 and even higher [1]. In face-centered cubic (fcc) crystals such as copper, dislocations act as the major carrier of plastic deformation. At low strain rates, plastic strain can be carried out by the movement of dislocations and fresh dislocation loops are multiplied via the generation mechanism of the Frank–Read source [2]. As strain rate increases beyond about 106 s−1, dislocation generation, as opposed to dislocation movement, becomes more and more important to accommodate the strain rate. In shock loading experiments, activation energy for dislocation loop nucleation could approach zero when shock pressure is higher than ~3 GPa [3,4]. Thus, dislocation loops are readily formed by thermal activation, which accounts for most shear strains at high strain rates. Such a dislocation generation mechanism is called homogeneous nucleation. With an increasing strain rate, homogeneous nucleation rather than activation of Frank–Read sources has been proposed as the dominant mechanism responsible for the plastic relaxation at shock fronts [1,2].
As we know, the mechanical response of materials is highly dependent on the distribution and evolution of dislocations during plastic slip. In order to fully understand the connection between the strength and dislocation activity, it is quite necessary to investigate the dislocation structure in materials deformed in a wide range of strain rates. In recent years, the dislocation structure in monocrystalline and polycrystalline copper deformed at different strain rates [4,5,6,7,8] has been characterized extensively, especially using transmission electron microscopy (TEM). In the 1970s, Göttler [5] investigated the dislocation arrangement and cell structure of a single-crystal Cu tensile deformed along [100] orientation at the strain rate of 10−4 s−1. The dislocation densities were observed to be close to ~1015 m−2 when shear stress increased up to 100 MPa, and the average diameter of dislocation cells was inversely proportional to shear stress. To develop bulk nanostructured Cu with ultrafine grain size, Li et al. [6] performed multiple dynamic impact tests of Cu at strain rates within ~102–103 s−1. TEM results showed increasing strain rate can induce a significant change in microstructures including dislocations, twins, and shear bands, which successfully resulted in a reduction in grain size from initially hundreds of micrometers to tens of nanometers. The dislocation structure in Cu after shock compression was also studied using TEM [4,7,8]. Compared to deformation at lower strain rates, the distribution of dislocations was found to be more homogeneous in the shocked samples. In addition, the sizes of dislocation cells decreased with increasing shock pressure, and many small dislocation loops in the range of ~10–250 nm were observed.
Complementary to TEM, X-ray line profile analysis (XLPA) is another microstructure characterizing technique, which focuses on analyzing statistical properties of the dislocation system [9,10]. If there are a huge number of dislocations in material, all dislocations will interact with each other and form a specific inter-stress or strain distribution in the whole system. The inter-strain distribution can directly influence the shape of the diffraction line profile. At present, with the development of the procedure of XLPA [11,12,13], the statistical parameters of dislocations such as the density, the character, and the arrangement parameter of dislocations can be achieved inversely from the measured diffraction line profiles. Previous experimental results of materials deformed at lower strain rates indicated that XLPA is a reliable procedure to provide quantitative values of microstructure consistent with TEM results [5,14]. However, for irradiated materials, dislocation densities determined by XLPA were recently found to be obviously larger than those obtained using TEM [15]. The discrepancy was accounted for by referring to the dislocation structure produced by irradiation, which usually comprises dislocation loops with diameters covering a wide range. In principle, XLPA can detect dislocation loops for any diameter, while TEM just counts loops larger than a specific value. This is a limitation for TEM to quantitate the dislocation densities in irradiated materials. For the materials deformed at different strain rates, although various microstructures have been investigated using TEM, fewer studies were carried out systematically to compare the effect of strain rate on the dislocation structure in the materials. Particularly for shock-loaded materials, the dislocation densities obtained by TEM are far lower than the analytical calculations [4,16,17] or the numerical simulations [18,19,20]. After comparing the electrical resistances in the copper during and after shock compression, Gilev [21] considered that the information on defects obtained for the recovered sample was not reflective of the real state of the material right behind the shock front. This encouraged us to initiate X-ray diffraction measurements of the dislocation structure in materials deformed at different strain rates.
In this work, we investigated the dislocation structures in polycrystalline copper specimens mechanically loaded in three different deformation modes: quasi-static, Hopkinson bar, and electric gun tests. The strain rates of these tests spread in the range of ~10−3–107 s−1. The recovered samples were obtained after the deformation and then measured using high-resolution X-ray diffraction. The diffraction patterns were evaluated using the convolutional multiple whole profile (CMWP) procedure [22,23,24] to determine the microstructure parameters related to crystallite size and dislocations. Finally, the correlation between the strength and the microstructure of the samples deformed at different strain rates was discussed in terms of the Taylor equation.

2. Materials and Methods

2.1. Mechanical Tests

The copper specimens were machined from a commercial oxygen-free high-conductivity (OFHC) copper (99.99% in wt%) bar. All the specimens were annealed at 600 °C for 1 h prior to the deformation tests. The average grain size of the samples was ~100 μm with an equiaxed grain structure. The three different loading manners applied on the specimens were quasi-static compression, split Hopkinson pressure bar experiment, and planar plate impact by electric gun. All the experiments were implemented at ambient temperature. For the quasi-static compression, the specimens with 10 mm diameter and 6 mm thickness were compressed under a uniaxial stress condition at a strain rate of ~10−3 s−1 in a universal material testing machine. At an intermediate strain rate of ~103 s−1, the uniaxial stress compression of the specimens with 6 mm diameter and 5 mm thickness was carried out using a split Hopkinson pressure bar. The incident and transmission bars with 16 mm diameter were made of maraging steel. Attached on the incident and transmission bars were the strain gauges for the measurement of stress pulses. The averaged stress and strain could thus be calculated from the reflected and transmitted pulses. The true strains of 0.1 and 0.4 were obtained for the samples under quasi-static and Hopkinson bar tests, assuming the deformation along the loading direction was uniform and the sample volume kept constant during plastic deformation. Figure 1 shows the measured stress–strain curves for the Cu samples in the quasi-static and Hopkinson bar tests. For shock wave loading in the one-dimensional plane strain condition, we applied a dedicated 98 kJ electric gun [25]. The diameter and thickness of the electric gun specimens were 20 and 2 mm, respectively. After a Mylar flyer plate with 0.5 mm thickness was launched to impact on the sample surface, a single-pulse rectangular shock wave was produced inside the specimen. During the compression and release of the shock wave, the specimen of the electric gun experienced a complete stress–strain cycle. The equivalent strain can be calculated from the change in the initial and compressed specific volume, i.e., ε = (4/3)ln(V/V0) [1], which are 0.14, 0.18, 0.22, and 0.28, respectively. The pulse width of ~200 ns and the strain rate of ~107 s−1 were estimated using a laser Doppler interferometer to measure the flyer/window interfacial velocity profile. With increasing flyer plate velocity, the amplitudes of shock pressure were 19, 25, 35, and 49 GPa, respectively. Since in the electric gun tests, the flyer plate is driven directly by high-pressure plasmas instead of using a sabot in gas gun, it benefits the recovery of the specimen undergoing an ideal single shock pulse. The experimental setup of the electric gun is shown schematically in Figure 2. For ease of comparison in the article, the quasi-static, Hopkinson bar and electric gun tests are classified as low, intermediate, and high strain rate deformations, respectively.

2.2. X-ray Diffraction Measurements

X-ray diffraction measurements were carried out in a high-resolution double crystal diffractometer, which was customized for line profile analysis [9]. The diffractometer equipped with a fine-focus rotating copper anode (RA-MultiMax9, Rigaku, Tokyo, Japan) was operated at 40 kV and 100 mA. In order to subtract Kα2 component from the Cu Kα beam, a design of a plane Ge (220) primary monochromator combined with a 160 mm wide slit was applied. In the diffraction geometry of a parallel beam, the beam size on the sample surface was about 0.2 mm × 1.5 mm. The diffraction intensities scattered from the specimen were collected by curve imaging plates (IPs). The linear spatial resolution of the IPs was 50 μm. The IPs were located at an arc of 300 mm far from the specimen, so that scattering angular range 2θ = 30° to 150° could be covered at one time. The X-ray diffraction measurements were performed in the center region of the deformed samples. All the specimens were mechanically polished and then chemically etched to remove surface damages before the X-ray diffraction measurements. The intensity distributions along the Debye–Scherrer arcs on the IPs were integrated to obtain the one-dimensional diffraction pattern as a function of 2θ. The typical diffraction patterns of the quasi-static, Hopkinson bar and electric gun compressed Cu specimens are shown in Figure 3a–c, respectively.

2.3. Evaluation of the X-ray Diffraction Patterns

The measured diffraction patterns were matched to the calculated patterns using the CMWP procedure. In the evaluation of CMWP, the theoretical model was established based on the convolution of physical effects of various lattice defects, which include dislocations, crystallite size, twins, and stacking faults. With the nonlinear fitting process, the best solution of the microstructure parameters for the samples could be provided. Although the models of intrinsic or extrinsic stacking faults or twin boundaries were implemented in CMWP, planar defects in the current Cu samples were hardly confirmed in the following evaluation. Therefore, for the fcc Cu, we just needed to consider five microstructural parameters for the whole pattern calculation. The parameters can be categorized into two types: one is dislocation parameters, which are the dislocation density, ρ, the effective outer cut-off radius, Re, and the q parameter; the other is crystallite size parameters. For the latter, if the crystallite size distribution is assumed to be a log-normal size distribution, they are the median, m, and the logarithmic variance, σ L N . Here, we briefly introduce these microstructural parameters. For the log-normal size distribution, the area’s average crystallite size can be given by [26,27]
d x = m   e x p 2.5 σ L N 2
In dislocated crystals, the mean square strain ε g , L 2 can be given as [28,29]:
ε g , L 2 ρ C ¯ b 2 4 π f η
where g is the absolute value of the diffraction vector, L is the Fourier variable, ρ is the dislocation density, b is the Burgers vector, C ¯ is the average contrast factor and f(η) is the Wilkens function [29]. For a texture-free polycrystalline, or if all possible Burgers vectors are equally populated, the average contrast factor C ¯ for cubic crystals is written as [30]:
C ¯ = C ¯ h 00 1 q H 2
where C ¯ h 00 is the average contrast factor of the h00 reflections, q is a parameter depending on the dislocation type, and H2 = (h2k2 + h2l2 + k2l2)/(h2 + k2 + l2)2. In the function f(η), η = L/Re, where Re is the effective outer cut-off radius of dislocations. The dislocation arrangement parameter M is defined as R e ρ [31], which indicates the dipole character of dislocations.

3. Results

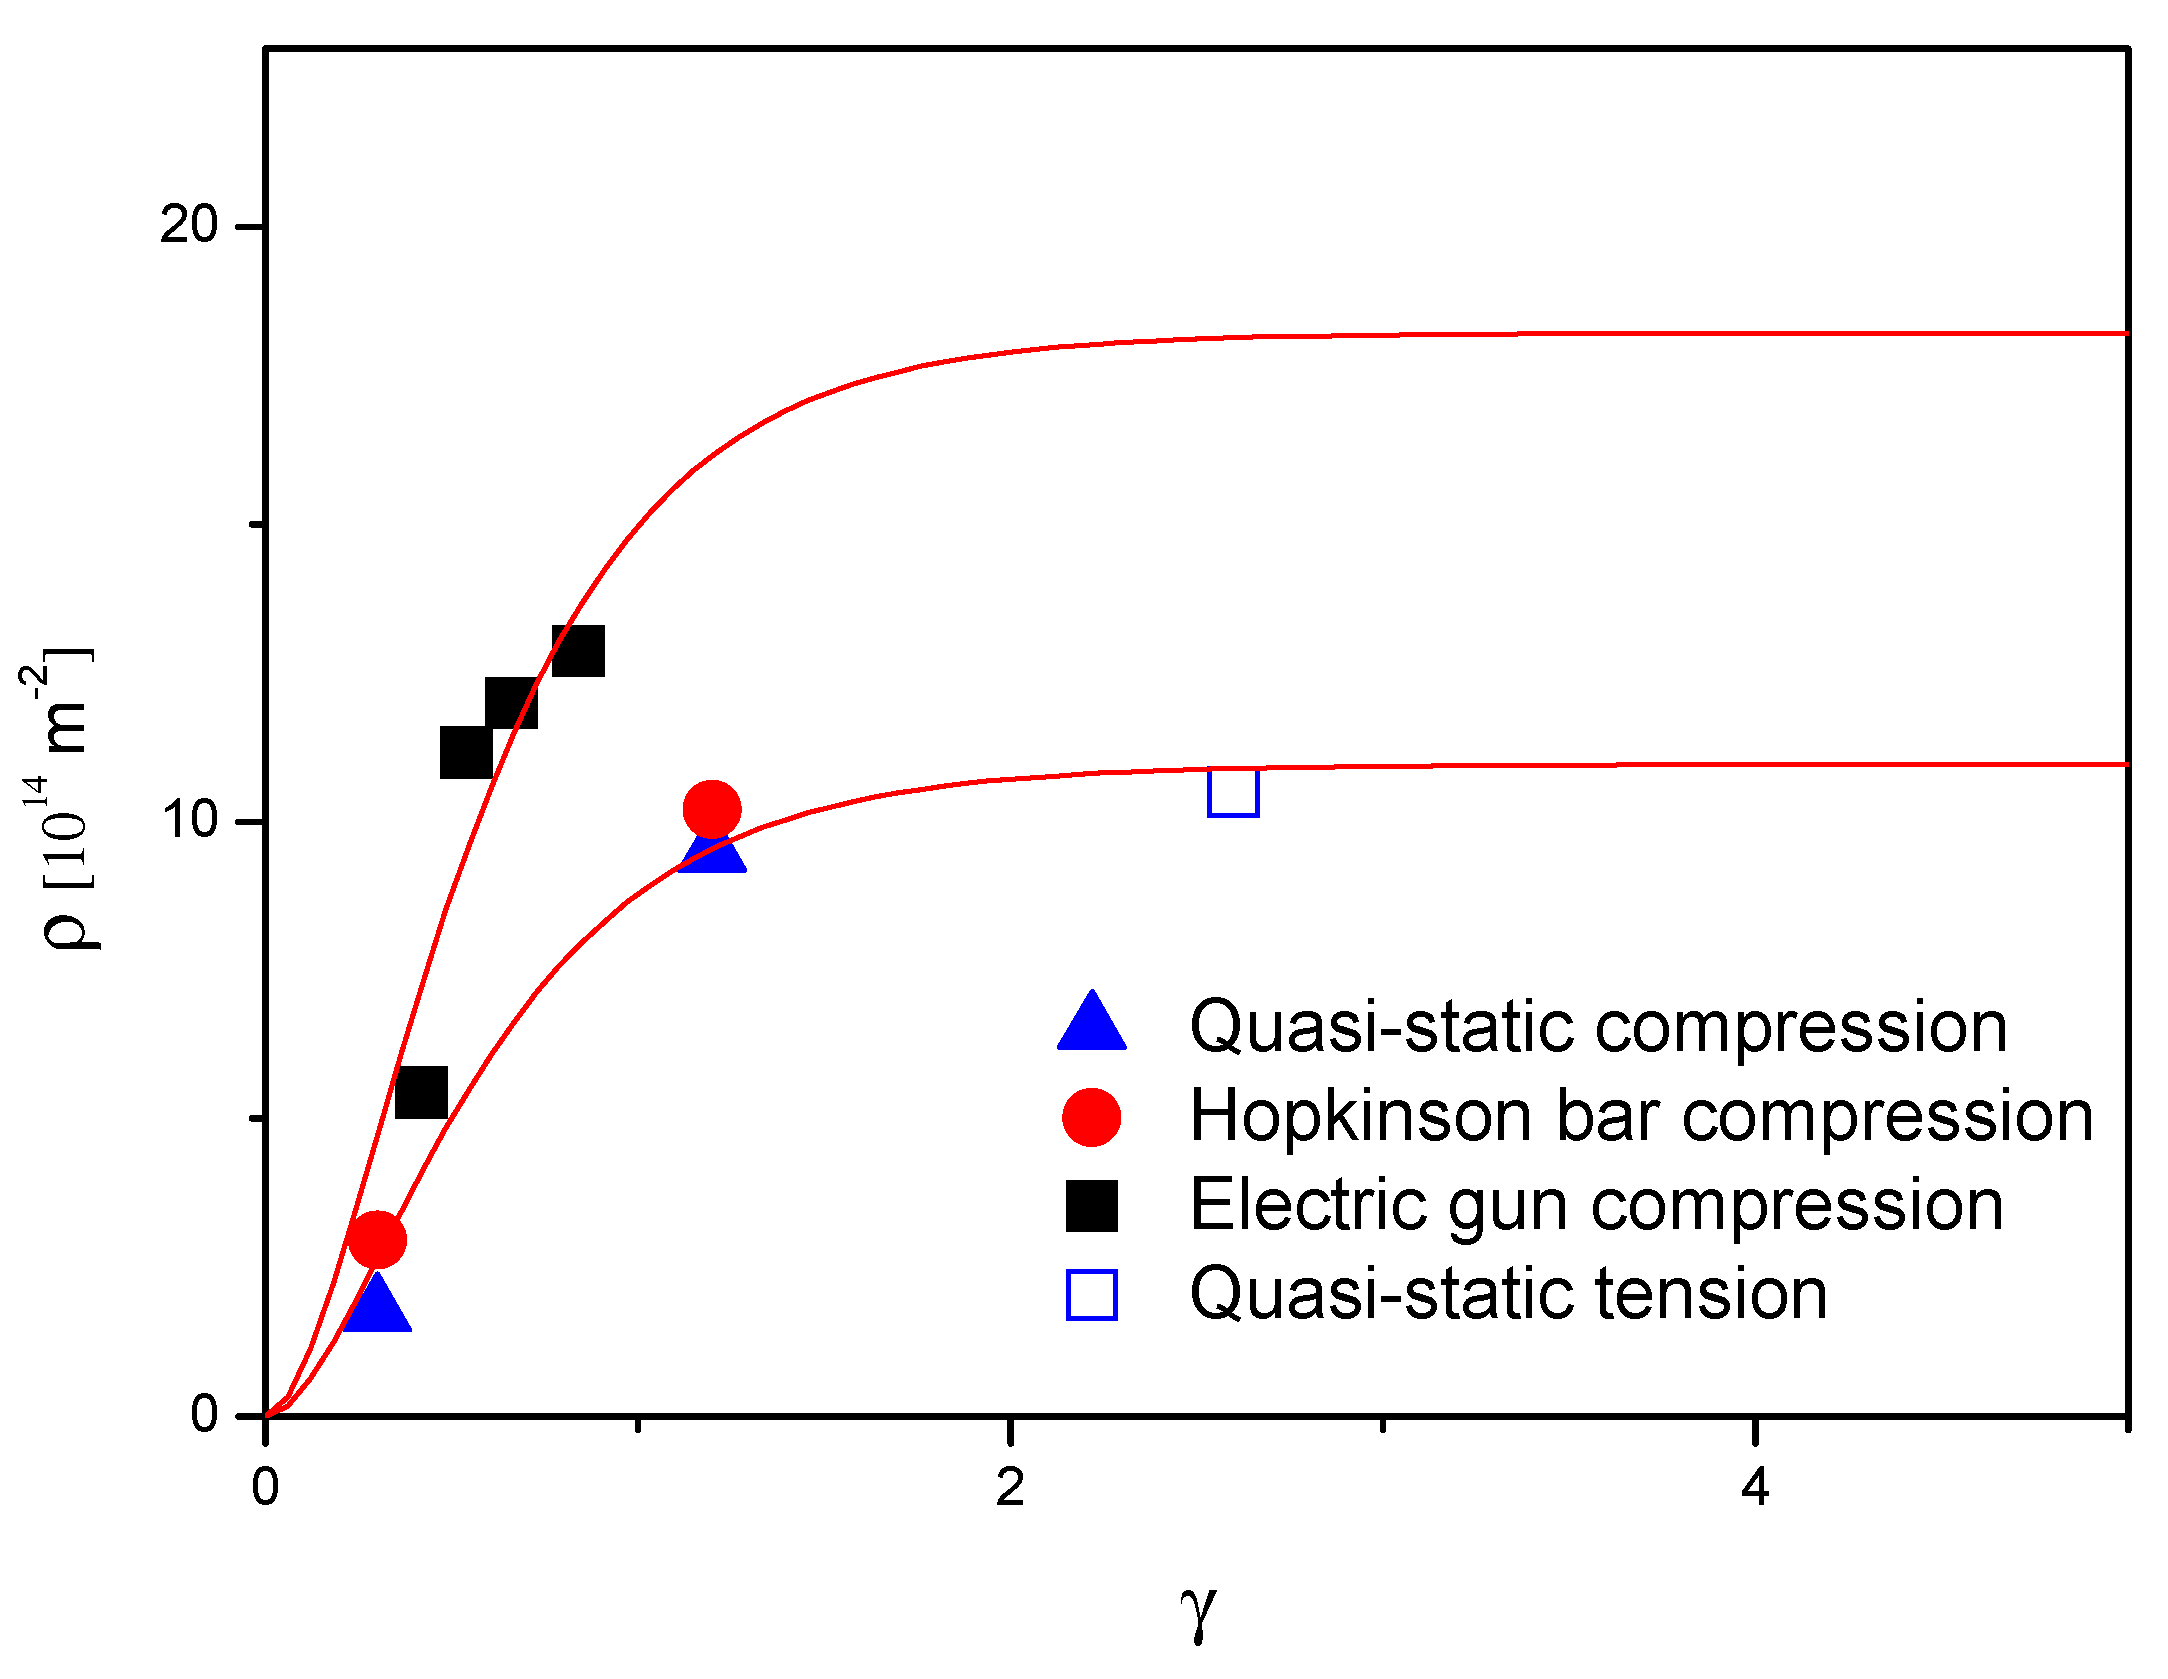
3.1. Dislocation Densities and Character

The dislocation densities in the Cu specimens deformed at the different strain rates are shown in Figure 4. As mentioned in Section 2.1, two equal plastic strain values, 0.1 and 0.4, were applied for the quasi-static and Hopkinson bar compressive experiments. For the quasi-static deformation, with increasing strain, the dislocation density increases from 1.8 × 10¹⁴ to 9.5 × 10¹⁴ m−2. A similar trend holds for the increase in dislocation densities in the samples compressed by Hopkinson bar. The dislocation densities at the strains of 0.1 and 0.4 are 3.0 × 10¹⁴ and 10.2 × 10¹⁴ m−2, respectively. They are slightly larger than the values of the quasi-static compression, although the strain rate of Hopkinson bar deformation is six orders of magnitude higher than that of the latter. In contrast to the deformation at the low and intermediate strain rates, the change in dislocation density is significantly different in the shock-loaded samples with the electric gun. At the lowest pressure, i.e., 19 GPa, the dislocation density in the specimen is 5.4 × 10¹⁴ m−2, which is moderately larger than those in the 0.1 strained specimens at the low and intermediate strain rates. Afterwards, the dislocation density increases substantially, and then it changes gradually from 11.2 × 10¹⁴ to 12.9 × 10¹⁴ m−2 in the strain range between 0.18 and 0.28. In Figure 4, we can see the dislocation density at the strain of 0.18 is even larger than the values in the quasi-static and Hopkinson bar compression at the strain of 0.4.
As for fcc Cu, the slip system of dislocations is a/2<111>{110}. The Zener constant, A z = 2 c 44 / ( c 11 c 12 ) , of Cu is 3.2 [22], which is larger than unity. Strong strain anisotropy will be presented in peak broadening of the deformed Cu with huge amounts of dislocation. For the average contrast factor C ¯ , the q parameter in Equation (3) can be provided directly from the evaluation of CMWP. To obtain slip activity of dislocations, the theoretical q values were calculated using numerical calculations [22,32,33] as 1.64 and 2.38 for the edge and screw dislocations, respectively. By comparing the theoretical and experimental values of q, the dislocation character, i.e., the fraction of edge or screw type, can be determined. Figure 5 shows the experimental q values of the deformed samples, which are spreading in the range of 2.0 ± 0.2. The q value equal to ~2.0 means the edge and screw types of dislocations have nearly half each. The q values in the quasi-static deformation are smaller than that in the Hopkinson bar deformation, while the most of q values in the electric gun shock loading are intermediate, i.e., between the other two modes. The evolution trend of dislocation character for all the samples is not conclusive due to a lack of adequate experimental data. However, the obtained q values indicate unambiguously that the dislocations in the recovered samples are comprised of both the edge and screw types. In principle, the cross-slip of screw dislocations promotes the formation of dislocation cells, as observed in all the deformed samples. The results are in good correlation with the dislocation morphology observed in the Cu specimens [4,5,14].

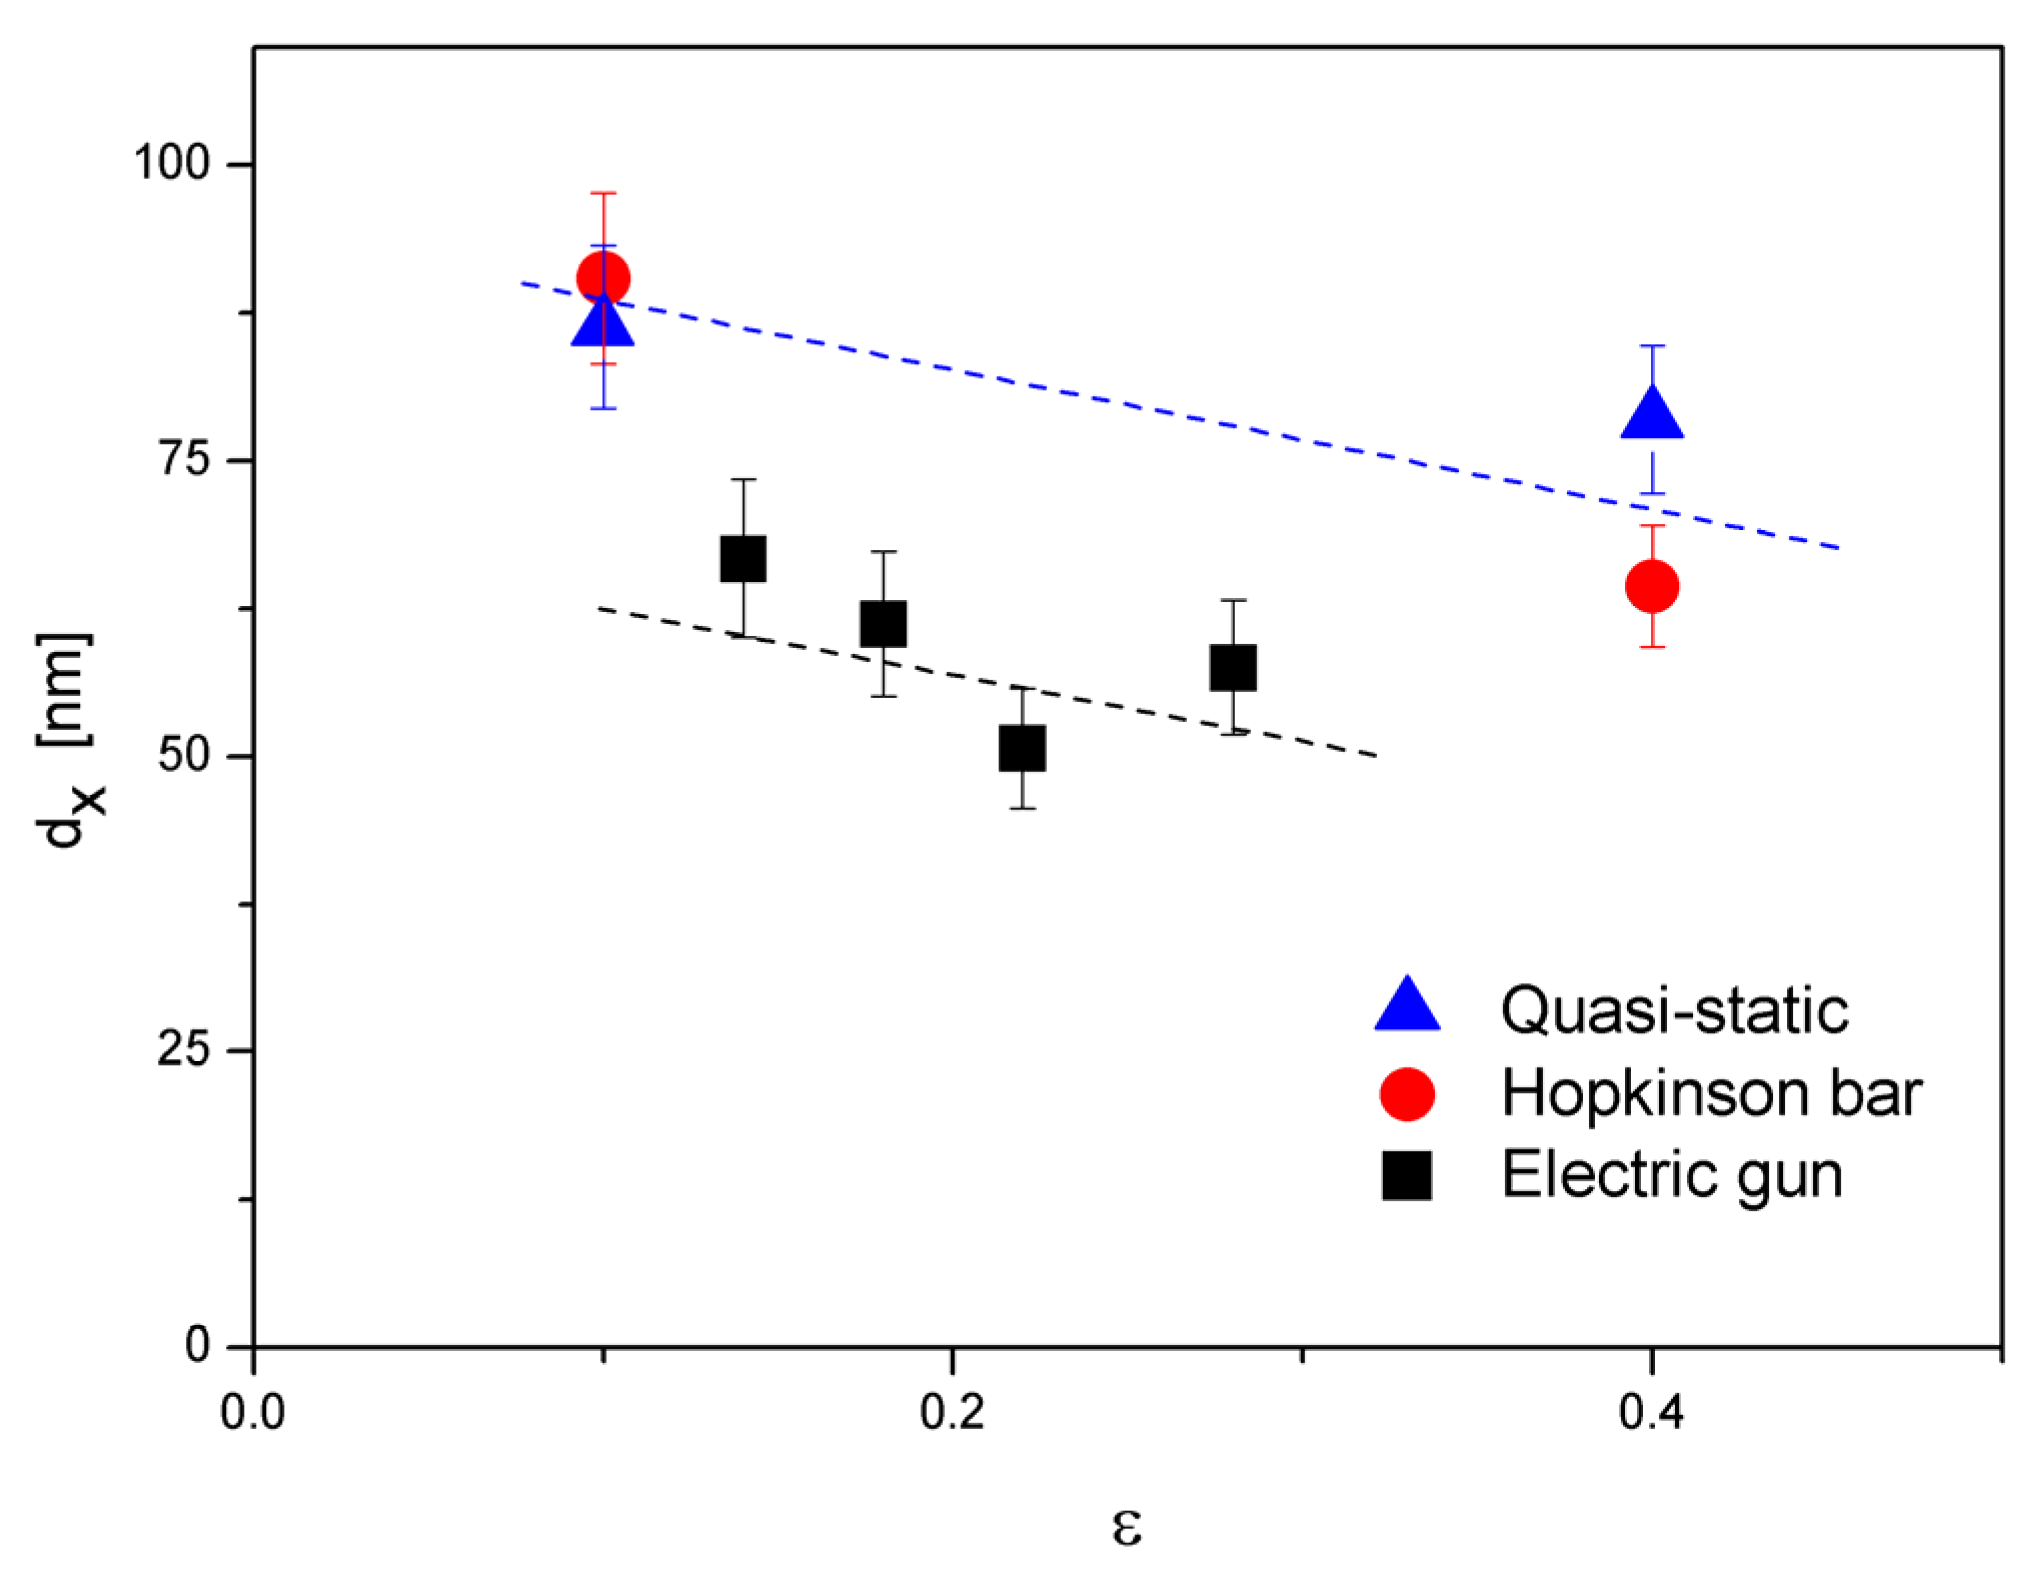
3.2. Dislocation Arrangement and Subgrain Size

Figure 6 shows the arrangement parameter of dislocations, M, of the samples. In the case of quasi-static and Hopkinson bar compression, the M values are around a level of 1.6. Such a value is closely correlated with the dislocation structure, with a stronger dipole character. As the plastic strain increases from 0.1 to 0.4, the values of M are almost unchanged within the error range for both kinds of deformation at the low and intermediate strain rates. In contrast, the electric-gun-loaded specimens all have larger M values, which are about 2.6. During the process of shock wave propagation, the high hydrostatic pressure and short equilibrium time suppressed the recovery of dislocations. This resulted in a dislocation configuration with weaker dipole character and a stronger long-range strain field.
In deformed bulk polycrystalline metals, the single grain is composed of coherently scattering domains, which can be revealed using X-ray diffraction. Here, we use the term of subgrain size dx, denoting the coherently scattering domain size. The results of dx determined by line profile analysis are shown in Figure 7 for the samples compressed in the different deformation modes. For the samples at the strain of 0.1 after the quasi-static and Hopkinson bar deformation, the subgrain size dx is about 88 nm; when the deformation continues up to the strain of 0.4, the size dx decreases to about 70 nm. The change in dx in the electric-gun-deformed samples has a similar trend for the shock pressures from 19 to 49 GPa. When comparing the values of dx for these three deformation modes, the dx of electric gun compression, which decreases from about 60 nm to about 52 nm, is obviously smaller than that of the other two. Since the formation of subgrains is due to the clustering of dislocations, it can be inferred that the lower values of dx for the electric gun samples are related to both the density and arrangement of dislocations. More homogenous distribution of dislocations leads to smaller subgrain size.

4. Discussion

4.1. Evolution of Dislocation Structure at Different Strain Rates

When a metal is plastically deformed, the process of multiplication and annihilation of dislocations occurs, and the dislocation density becomes closer to a saturation value up to larger deformation [34]. For the quasi-static- and Hopkinson-bar-deformed Cu samples, as shown in Figure 4, the dislocation densities increase slightly with increasing strain rate. In the case of the electric gun samples shock loaded at the high strain rates, the dislocation densities increase dramatically in a low and narrow range between the strains of ~0.1 and 0.2. At 0.18 strain, the dislocation density already reaches a value of 11.2 × 10¹⁴ m−2, which is almost the same as the saturation level of the deformation at the low and intermediate strain rates. The evolution of the dislocation density as a function of shear deformation γ can be depicted concisely by the equation [34]:
ρ γ = ρ s 1 / 2 β e x p δ γ 2 ,
where β = 1 / f y ρ 0 1 / 2 , δ = y / 2 b and ρ s = 1 / f y 2 , y is a parameter accounting for the effective annihilation distance of dislocations, b = 0.256 nm, and ρ 0 and ρ s are the initial and saturation dislocation density, respectively. Since the dislocation densities are nearly the same within experimental uncertainty for both the quasi-static and Hopkinson bar compression, we treated these data as the same group. In addition, to achieve more reliable values of two parameters y and ρ s , the dislocation density of a tensile-deformed OFHC Cu at the shear strain of 2.6 [35] was also included in the fitting process. The fitted curves are shown in Figure 8, which match well with the experimental data. The parameters ρ s and y were calculated as 11.0 × 10¹⁴ m−2 and 1.16 nm for the samples after the quasi-static and Hopkinson bar compression, and 18.2 × 10¹⁴ m−2 and 1.21 nm for the samples after the electric gun shock loading. As we know dislocation cells are prevailing in the deformed samples, ρ s and y are the volume-averaged values for dislocation cell walls and interiors. The lower annihilation distance is possibly attributed to multiple slip systems, which hamper the annihilation of dislocations of opposite Burgers vectors [34].
In the quasi-static and Hopkinson bar compressions, the dislocations are activated and multiplied via Frank–Read or other mechanisms at the low and intermediate strain rates [2]. In contrast, the dislocation loops’ nucleation in the shock loading of the electric gun is carried out by thermal energy [3,4]. The different equilibrium times of dislocations between the low, intermediate, and high strain rate deformations could lead to different dislocation structures. As observed in the TEM measurements, the samples deformed at low and intermediate strain rates have dislocation cells with distinct boundaries while the loose dislocation cells occur in the shock recovered samples [4,8]. The M parameters obtained from X-ray line profile analysis are in good correlation with the TEM observations. The M values of the low and intermediate strain rate samples are smaller than those of the high strain rate samples. The results clearly clarified that the dislocation arrangement with higher energy is formed due to a shorter equilibrium time in the electric gun samples. Here, it is interesting to draw an analogy between the samples after shock loading and irradiation. Balogh et al. [36] have characterized the dislocation structure of Zr-2.5Nb using neutron diffraction. The zircaloy samples were processed by quasi-static tensile deformation and neutron irradiation, respectively. Although the dislocation densities in both kinds of samples were nearly the same, ~2 × 10¹⁵ m−2, the dislocation arrangement parameter M was found to be different. The M value of the deformed sample is ~1, corresponding to the strong dipole character of dislocations. In contrast, neutron irradiation increased the M value to 3 as the neutron and matrix atom interacted stochastically in the sample. The dislocation structure in the shock-loaded or neutron-irradiated samples exhibited a higher energy configuration compared to that formed in the quasi-static deformation. Both the scenarios confirmed the dislocation structure is closely related to the generation mechanism of dislocations. The distribution and stability of dislocations impose a great influence on the mechanical response of materials [37,38].

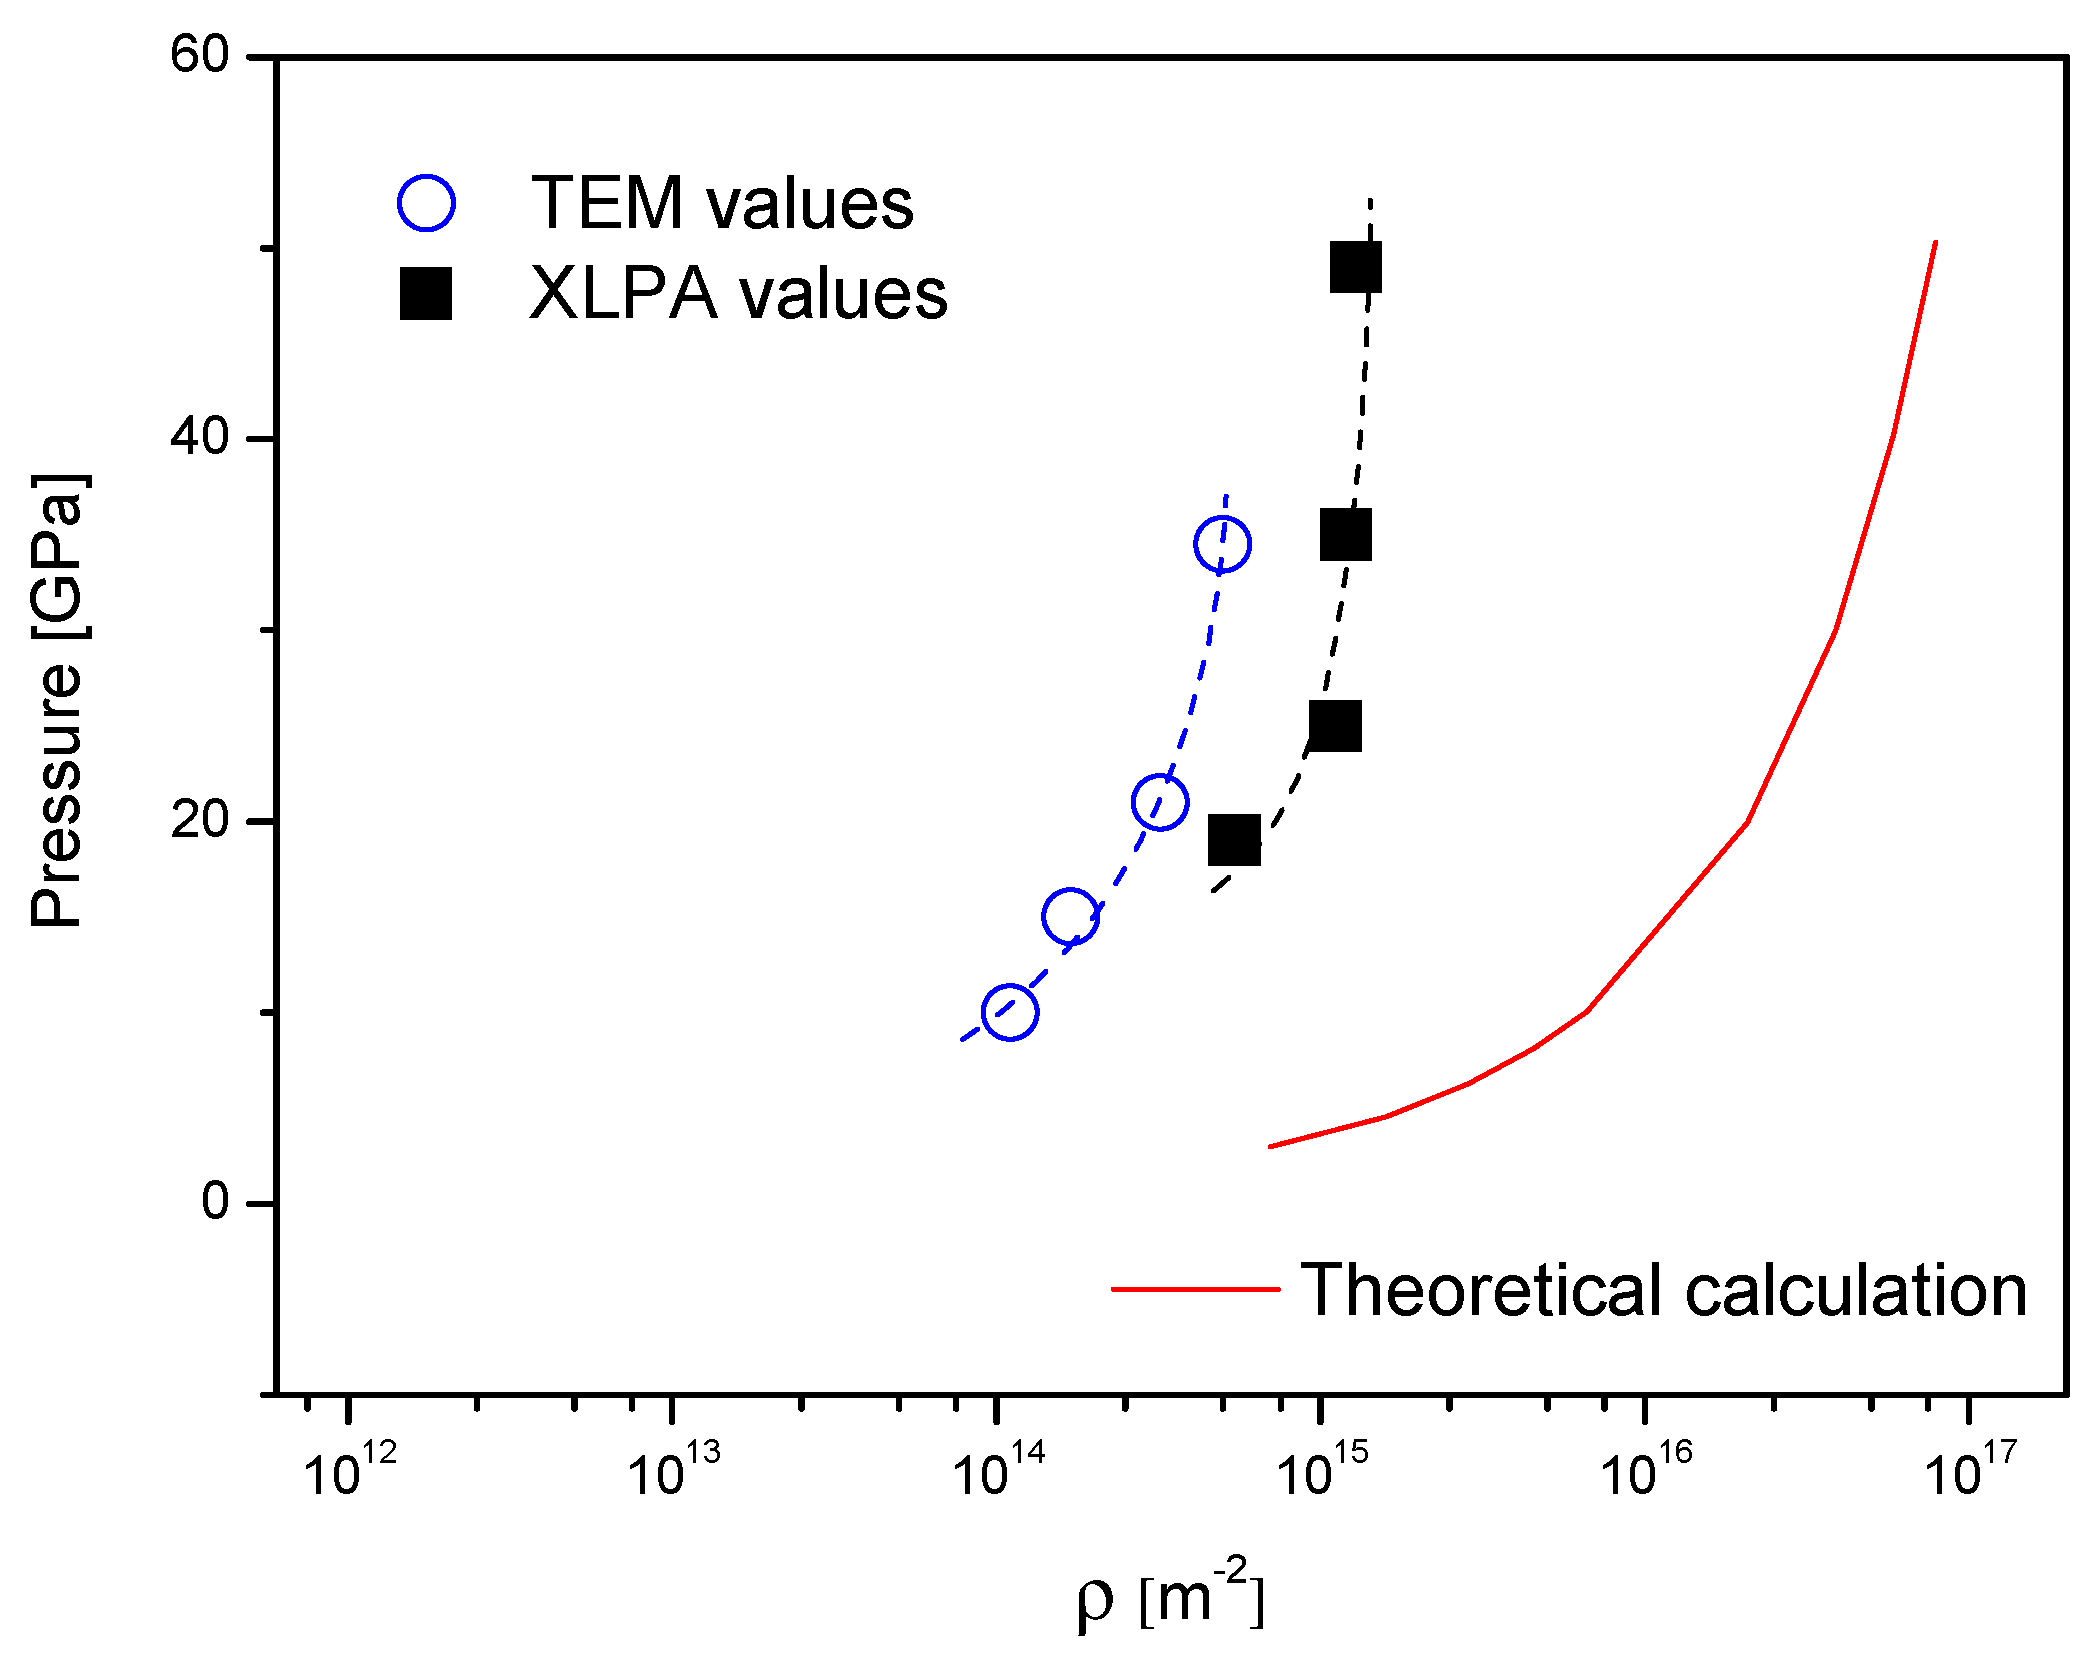
4.2. Crosscheck of Dislocation Densities in Shocked Samples

In the planar plate impacts of the electric gun, high strain rate deformation can be accommodated by high-speed dislocation movement and dislocation generation. The response of dislocations is usually illustrated by the time derivative of the Orowan equation,
γ ˙ = ρ m b v + ρ ˙ m b l ,
where γ ˙ , ρ m , ρ ˙ m , v , and l are the shear strain rate, the density, the nucleation rate, the average velocity, and the average travelling distance of mobile dislocations. With increasing shock pressure, the dislocation structure in the specimens is therefore affected largely by the dislocation nucleation [16,39]. To explain the generation process of dislocations, Meyers developed a homogeneous dislocation nucleation model [40]. In the model, during the propagation of the shock wave, dislocation interfaces are formed periodically in the region of the shock front, while the dislocations in the interfaces travel for a short distance with subsonic speeds. Assuming that the stress field radius of the dislocation is equal to the interval between the dislocations in the interface, the dislocation density can be calculated using a simple equation [40]:
ρ = 2 d 2 ,
where d = a 0 a s a 0 a s , a 0 and a s are the initial and shocked lattice parameters, respectively. According to the Rankine–Hugoniot equation and the equation of state, the shocked lattice parameter a s and also the dislocation densities were obtained as a function of shock pressure [4,16]. Figure 9 shows the calculated and the TEM [41] measured values of dislocation density at different pressures for polycrystalline copper. There is a significant difference between the results obtained from the homogeneous dislocation nucleation model and the TEM observation, where the former is at least one or two orders of magnitude larger than the latter. The copper data are not a unique case; similar phenomena were also found for other metals such as Ni [16] and Ta [17].
To clarify the discrepancy between the analytical calculation and the TEM measurement, we carried out complementary X-ray diffraction analysis for the copper specimens. The dislocation densities from XLPA are compared in Figure 9. It was found the X-ray values are about twice as large as the TEM ones, which are qualitatively consistent with each other, considering the sample compositions and the shock loading instruments are not the same for the X-ray and TEM [41] studies. Obviously, XLPA results re-emphasized the huge gap of dislocation density between the experimental measurement and the theoretical estimation. A hypothesis could be proposed to resolve the dilemma: when a sample is shock compressed with high pressure beyond the Hugoniot elastic limit, many dislocation loops are homogeneously nucleated along the shock wave propagating direction; however, the dislocation density will be annihilated greatly upon the subsequent release process. Recently, time-resolved X-ray diffraction techniques were applied to observe the real-time microstructure during and after shock compression [42,43]. Sliwa et al. [42] found the lattice rotation and the twins generated in the polycrystalline Ta under shock loading were nearly eliminated by the reverse plastic deformation upon the rarefaction wave. But the partial reversal of lattice rotation in the unloading process cannot confirm undoubtedly the extensive annihilation of dislocations. Further molecular dynamics simulations showed the dislocation density nucleated at the shock front was reduced by 2.5 times upon release [42], which cannot yet account for the orders-of-magnitude inconsistency between the measured and calculated dislocation densities. During shock compression, a great number of point defects are created as the climbing of dislocation jogs occurs more easily with increasing dislocation velocity (cf. Refs. [1,21] and the literature therein). Once the pressure drops in shock unloading, the vacancies will be diffused more quickly, resulting in a large fraction of dislocations that are annihilated. In high-pressure torsion-deformed Cu, the phenomenon was observed by Schafler and coworkers [44,45] using high-resolution synchrotron X-ray diffraction. They found the remnant dislocation density in the recovered sample was ~60% of the latter in the loaded state at 4 GPa and shear deformation γ = 50. Therefore, the factors promoting the recovery of dislocations should be considered sufficiently in the theoretical evaluation, and a quantitative explanation is expected in future to connect the measured and calculated dislocation densities.

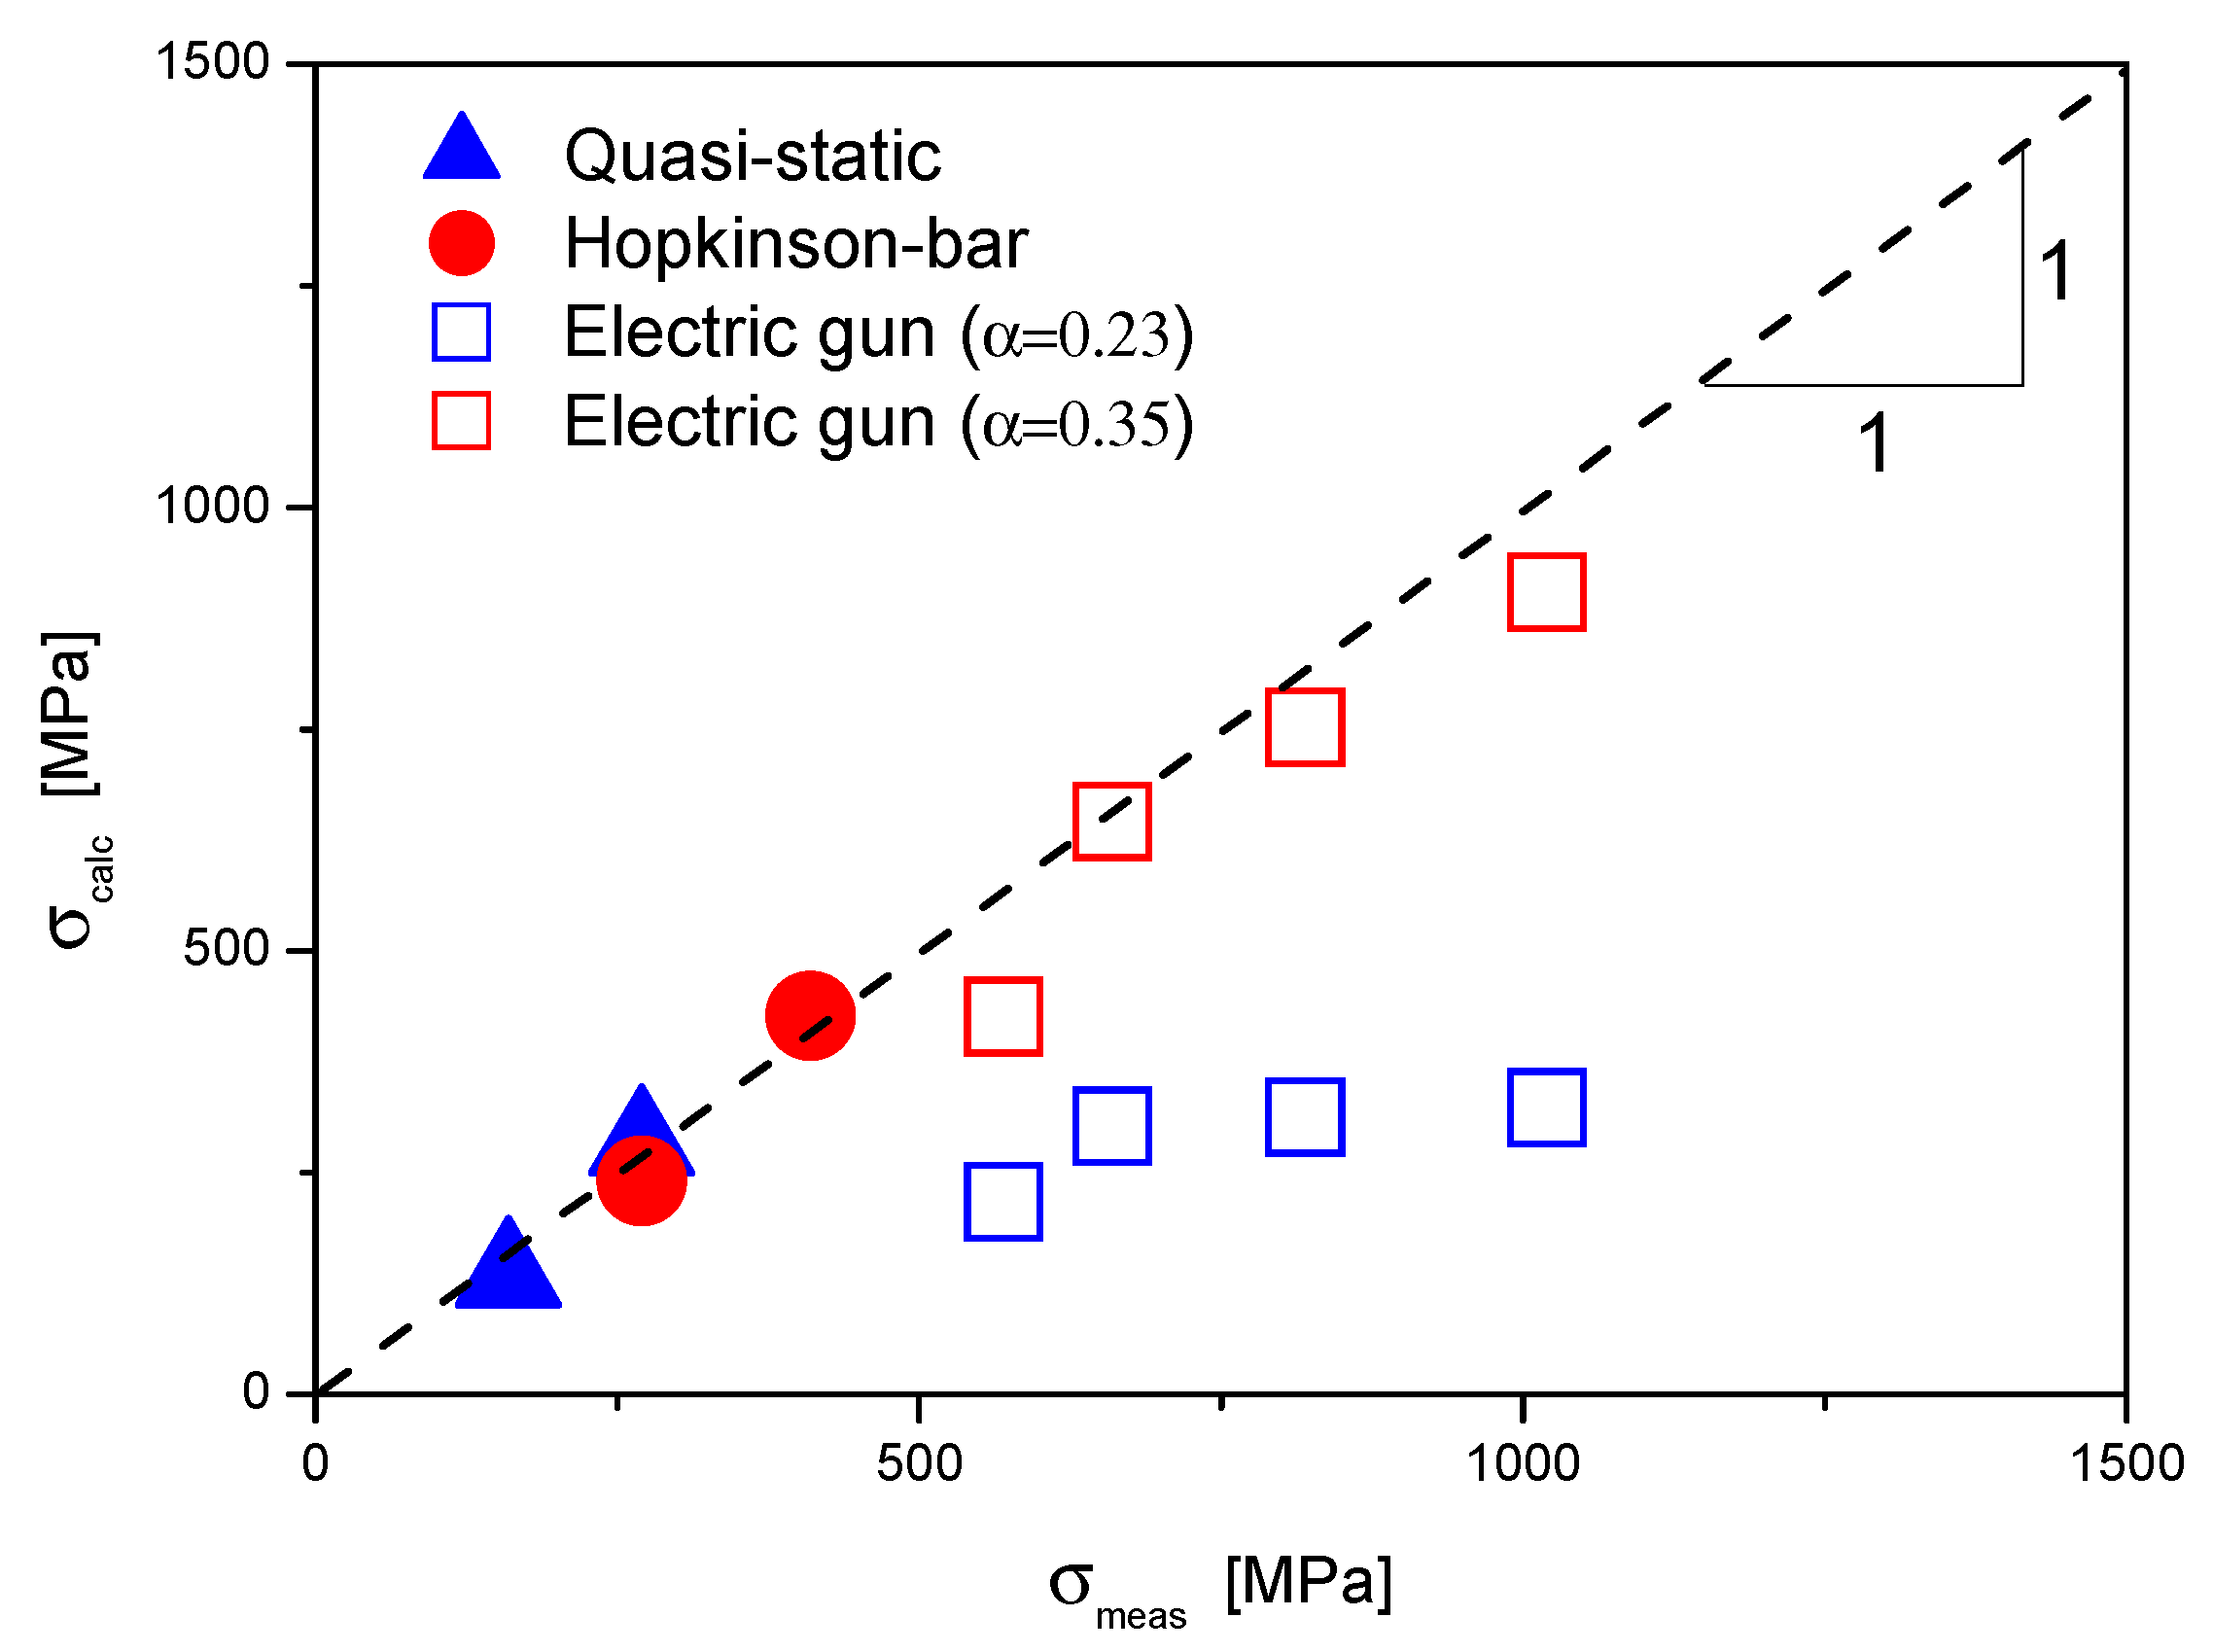
4.3. Correlation between the Strength and Dislocation Density

The Cu samples compressed at the strain rates varying from 10−3 to 107 s−1 exhibit distinct mechanical behaviors. Influenced by the deformation modes, the plastic response of the samples can be controlled by different deformation mechanisms. In order to explore the dominant mechanism during the deformation of Cu, the flow stresses, σ, can be correlated with the dislocation densities, ρ, using the Taylor equation [46]:
σ = σ 0 + α G b M T ρ
where σ 0 , α , G and M T are the friction-stress of the dislocation-free material, a constant indicating the interaction between dislocations, the shear modulus, and the Taylor factor, respectively. We take σ 0 = 20 MPa [47], b = 0.256 nm and M T = 3 for the polycrystalline Cu samples. Since the shear modulus is highly dependent on the shock pressure, different G values are used in the tests. For the quasi-static and Hopkinson bar deformation, G is 48 GPa; for the planar plate impacts, G are 65, 70, 79, and 92 GPa at the pressure of 19, 25, 35, and 49 GPa [48], respectively.
From the stress–strain curves of the quasi-static and Hopkinson bar compression in Figure 1, it can be seen the flow stress and the hardening rate of Cu increase with the strain rate. At the strain rate of ~10−3 s−1, the flow stresses are 160 and 270 MPa at the strains of 0.1 and 0.4, respectively. As the strain rate increases to ~103 s−1, the corresponding flow stresses at the same strains increase to 270 and 410 MPa, respectively. Figure 10 shows the measured flow stresses σmeas and the calculated flow stresses σcalc. The α values obtained by matching the σmeas values are 0.23 and 0.35 for the samples under the quasi-static and Hopkinson bar compression, respectively. It should be noted that the empirical parameter α used here is not only limited in the quasi-static deformation but also extended to the deformation at higher strain rates. The α value can be taken as an indication of the leading mechanism involved in the plastic deformation of the samples. For the quasi-static compression, the flow stress and hardening behavior are mostly determined by the elastic interaction between dislocations in the Cu samples. In the Hopkinson bar samples, although the strain rate increased largely, the dislocation structure was like that of quasi-static samples. This was confirmed by the near-equal values of dislocation density, ρ, and dislocation arrangement parameter, M, for the quasi-static and Hopkinson bar deformation. Compared to the quasi-static deformation, the higher flow stress and therefore the higher α constant in the Hopkinson bar deformation are due to the increasing thermal component of stress, viz., the activated free energy across forest dislocations decreases as the strain rate increases. It is the so-called thermal activation mechanism [1], which plays an important role in accounting for strain rate hardening behavior.
For the shock compression in the electric gun tests, the samples are subjected to a uniaxial strain deformation, and extremely high deviatoric stress is formed at the shock front to produce huge small dislocation loops. During the rapid relaxation process of shear stress, the material at the shock front transited from a uniaxial strain state to a nearly three-dimensional hydrostatic state. The strengths of OFHC Cu in a shocked state were measured by Chhabildas and Asay [49] using a bilayered plate impact combined with the in situ acoustic speed measurement technique. We fitted the experimental data with the Steinberg–Guinan model [50] to obtain the yield strengths of the Cu samples, which are 0.57, 0.66, 0.82, and 1.02 GPa at the shock pressures of 19, 25, 35, and 49 GPa, respectively. The molecular dynamics simulation of shocked Cu at the shock pressure of ~35 GPa [18] showed the average velocity of dislocations dropped dramatically to less than ~200 m/s in 80 ps. Many dislocation lines will eventually begin to be immobile due to the interaction and entanglement between dislocations. As we know, the dislocation structure measured in the recovered sample could not be the “true” state during the shock compression. Two attempts at the selection of α and G values were made to calculate the strengths of the samples: (i) α = 0.23 and G = 48 GPa at ambient pressure were used; and (ii) α = 0.35 and G values at different shock pressures were used. The calculated strengths (open squares) are shown in Figure 10. The calculated strengths for method (i) are ~40% of the experimental values, which represent the strengths of the recovered samples in quasi-static deformation. In contrast, it is found surprisedly that the calculated strengths for method (ii) are very close to the experimental ones. This demonstrates that even if many dislocations are annihilated during the release process, the thermal activation mechanism in combination with the remnant dislocation densities seem to be a reasonable approximation for estimating the yield strength of the Cu samples shocked at the pressures of 19–49 GPa.

5. Conclusions

The polycrystalline OFHC Cu samples were compressed using the quasi-static, Hopkinson bar and electric gun tests. The microstructure in the recovered samples was determined using X-ray line profile analysis. For the quasi-static and Hopkinson bar compression, the evolution of substructure had a similar trend. With the strain increasing from 0.1 to 0.4, the dislocation densities increased gradually from ~2.0 × 10¹⁴ to 10.0 × 10¹⁴ m−2, while the subgrain size decreased from ~88 to 70 nm. For the planar plate impacts of the electric gun, at the comparably lower strain of 0.28, the dislocation densities approached an even higher value of ~13.0 × 10¹⁴ m−2, and the subgrain size decreased from ~60 to 52 nm. When comparing the M values of the samples, the electric gun samples had the highest values, which indicated the dislocation structure in the shocked samples was less stable than in the other two types of samples. The flow stresses of the Cu samples were correlated with the dislocation densities using the Taylor equation. The obtained values of the α parameter varied from 0.23 to 0.35, indicating that for the current quasi-static-, Hopkinson-bar-, and electric-gun-compressed Cu samples, the yield strengths were accounted for well by the thermal activation mechanism.

Author Contributions

Conceptualization, Z.F., Z.S. and T.U.; methodology, Z.F.; software, G.R.; formal analysis, Z.F., Z.S. and T.U.; investigation, Z.F., Z.S., B.J., G.R. and T.U.; resources, Z.S. and T.U.; data curation, Z.F.; writing—original draft preparation, Z.F.; writing—review and editing, Z.S. and T.U.; supervision, T.U. All authors have read and agreed to the published version of the manuscript.

Funding

This research was funded by the Director Foundation of China Academy of Engineering Physics (Grant No. YZ2019004), the National Key Research and Development Program of China (No. 2021YFA1600604), NSAF (Grant No. U2230113), the National Natural Science Foundation of China (Grant No. 11932018), and OTKA (Grant No. K124926) funded by the Hungarian National Research, Development and Innovation Office (NKFIH).

Data Availability Statement

The data that support the findings of this study are available from the corresponding author upon reasonable request.

Acknowledgments

Z.F. is grateful to the Director Foundation of China Academy of Engineering Physics (Grant No. YZ2019004), the National Key Research and Development Program of China (No. 2021YFA1600604) and NSAF (Grant No. U2230113); Z.S. acknowledges the National Natural Science Foundation of China (Grant No. 11932018); and G.R. and T.U. are grateful for the support of OTKA grant K124926.

Conflicts of Interest

The authors declare no conflict of interest.

References

  1. Meyers, M.A. Dynamic Behavior of Materials; John Wiley & Sons: New York, NY, USA, 1994. [Google Scholar]
  2. Gurrutxaga-Lerma, B.; Balint, D.S.; Dini, D.; Sutton, A.P. The mechanisms governing the activation of dislocation sources in aluminum at different strain rates. J. Mech. Phys. Solids 2015, 84, 273–292. [Google Scholar] [CrossRef] [Green Version]
  3. Xu, G.; Argon, A.S. Homogeneous nucleation of dislocation loops under stress in perfect crystals. Philos. Mag. Lett. 2000, 80, 605–611. [Google Scholar] [CrossRef]
  4. Meyers, M.A.; Gregori, F.; Kad, B.K.; Schneider, M.S.; Kalantar, D.H.; Remington, B.A.; Ravichandran, G.; Boehly, T.; Wark, J.S. Laser-induced shock compression of monocrystalline copper: Characterization and analysis. Acta Mater. 2003, 51, 1211–1228. [Google Scholar] [CrossRef]
  5. Göttler, E. Versetzungsstruktur und verfestigung von [100]-kupfereinkristallen. Philos. Mag. 1973, 28, 1057–1076. [Google Scholar] [CrossRef]
  6. Li, Y.S.; Tao, N.R.; Lu, K. Microstructural evolution and nanostructure formation in copper during dynamic plastic deformation at cryogenic temperatures. Acta Mater. 2008, 56, 230–241. [Google Scholar] [CrossRef]
  7. Cao, B.; Lassila, D.H.; Huang, C.; Xu, Y.; Meyers, M.A. Shock compression of monocrystalline copper: Experiments, characterization and analysis. Mater. Sci. Eng. A 2010, 527, 424–434. [Google Scholar] [CrossRef]
  8. Lassila, D.H.; Shen, T.; Cao, B.; Meyers, M.A. Effect of low-temperature shock compression on the microstructure and strength of copper. Metall. Mater. Trans. A 2004, 35, 2729–2739. [Google Scholar] [CrossRef]
  9. Ungár, T.; Ott, S.; Sanders, P.G.; Borbély, A.; Weertman, J.R. Dislocations grain size and planar faults in nanostructured copper determined by high-resolution X-ray diffraction and a new procedure of peak profile analysis. Acta Mater. 1998, 46, 3693–3699. [Google Scholar] [CrossRef]
  10. Groma, I. X-ray line broadening due to an inhomogeneous dislocation distribution. Phys. Rev. B 1998, 57, 7535–7542. [Google Scholar] [CrossRef]
  11. Ungár, T.; Gubicza, J.; Ribárik, G.; Borbély, A. Crystallite size distribution and dislocation structure determined by diffraction profile analysis: Principles and practical application to cubic and hexagonal crystals. J. Appl. Crystallogr. 2001, 34, 298–310. [Google Scholar] [CrossRef] [Green Version]
  12. Ribárik, G.; Gubicza, J.; Ungár, T. Correlation between strength and microstructure of ball-milled Al-Mg alloys determined by X-ray diffraction. Mater. Sci. Eng. A 2004, 387–389, 343–347. [Google Scholar] [CrossRef]
  13. Ribárik, G.; Jóni, B.; Ungár, T. Global optimum of microstructure parameters in the CMWP line-profile analysis method by combining Marquardt-Levenberg and Monte-Carlo procedures. J. Mater. Sci. Technol. 2019, 35, 1508–1514. [Google Scholar] [CrossRef] [Green Version]
  14. Ungár, T.; Mughrabi, H.; Rönnpagel, D.; Wilkens, M. X-ray line-broadening study of the cell structure in deformed [001]-oriented copper single crystals. Acta Metall 1984, 32, 333–342. [Google Scholar] [CrossRef]
  15. Ungár, T.; Frankel, P.; Ribárik, G.; Race, C.P.; Preuss, M. Size-distribution of irradiation-induced dislocation-loops in materials used in the nuclear industry. J. Nucl. Mater. 2021, 550, 152945. [Google Scholar] [CrossRef]
  16. Meyers, M.A.; Jarmakani, H.; Bringa, E.M.; Remington, B.A. Dislocations in Shock Compression and Release. In Dislocations in Solids; Hirth, J.P., Kubin., L., Eds.; North-Holland: Amsterdam, The Netherlands, 2009; Volume 15, pp. 91–197. [Google Scholar]
  17. Lu, C.; Remington, B.A.; Maddox, B.R.; Kad, B.; Park, H.S.; Prisbrey, S.T.; Meyers, M.A. Laser compression of monocrystalline tantalum. Acta Mater. 2012, 60, 6601–6620. [Google Scholar] [CrossRef]
  18. Bringa, E.M.; Rosolankova, K.; Rudd, R.E.; Remington, B.A.; Wark, J.S.; Duchaineau, M.; Kalantar, D.H.; Hawreliak, J.; Belak, J. Shock deformation of face-centred-cubic metals on subnanosecond timescales. Nat. Mater. 2006, 5, 805–809. [Google Scholar] [CrossRef]
  19. Tramontina, D.; Erhart, P.; Germann, T.; Hawreliak, J.; Hawreliak, J.; Higginbotham, A.; Park, N.; Ravelo, R.; Stukowski, A.; Suggit, M.; et al. Molecular dynamics simulations of shock-induced plasticity in tantalum. High Energy Dens. Phys. 2014, 10, 9–15. [Google Scholar] [CrossRef]
  20. Jarmakani, H.N.; Bringa, E.M.; Erhart, P.; Remington, B.A.; Wang, Y.M.; Vo, N.Q.; Meyers, M.A. Molecular dynamics simulations of shock compression of nickel: From monocrystals to nanocrystals. Acta Mater. 2008, 56, 5584–5604. [Google Scholar] [CrossRef]
  21. Gilev, S.D. Nonequilibrium Physical State of Copper under Shock Compression. Combust. Explos. Shock. Waves 2021, 57, 378–384. [Google Scholar] [CrossRef]
  22. Ungár, T.; Dragomir, I.; Révész, Á.; Borbély, A. The contrast factors of dislocations in cubic crystals: The dislocation model of strain anisotropy in practice. J. Appl. Cryst. 1999, 32, 992–1002. [Google Scholar] [CrossRef] [Green Version]
  23. Ungár, T.; Ribárik, G.; Balogh, L. Defect-related physical-profile-based X-ray and neutron line profile analysis. Met. Mater. Transact. A 2010, 41, 1202–1209. [Google Scholar] [CrossRef]
  24. Ribárik, G.; Jóni, B.; Ungár, T. The Convolutional Multiple Whole Profile (CMWP) fitting method, a global optimization procedure for microstructure determination. Crystals 2020, 10, 623. [Google Scholar] [CrossRef]
  25. Song, Z.; Mo, J.; Zhao, J.; Tan, F.; Yuan, H. Study on launching technique of a 98 kJ electric gun for hypervelocity impact experiments, Int. J. Impact. Eng. 2018, 122, 419–430. [Google Scholar] [CrossRef]
  26. Hinds, W.C. Aerosol Technology: Properties, Behavior and Measurement of Airborne Particles; Wiley: New York, NY, USA, 1982. [Google Scholar]
  27. Ungár, T.; Tichy, G.; Gubicza, J.; Hellmig, R.J. Correlation between subgrains and coherently scattering domains. Powder Diffr. 2005, 20, 366–375. [Google Scholar] [CrossRef] [Green Version]
  28. Krivoglaz, M.A. X-ray and Neutron Diffraction in Non-Ideal Crystals; Springer: Berlin, Germany; New York, NY, USA, 1996. [Google Scholar]
  29. Wilkens, M. Theoretical aspects of kinematical X-ray diffraction profiles from crystals containing dislocation distributions. In Fundamental Aspects of Dislocation Theory; Simmons, J.A., de Wit, R., Bullough, R., Eds.; National Bureau of Standards: Washington, DC, USA, 1970; pp. 1195–1221. [Google Scholar]
  30. Ungár, T.; Tichy, G. The effect of dislocation contrast on X-ray line profiles in untextured polycrystals. Phys. Stat. Sol. A 1999, 147, 425–434. [Google Scholar] [CrossRef]
  31. Wilkens, M. The Determination of Density and Distribution of Dislocations in Deformed Single Crystals from Broadened X-ray Diffraction Profiles. Phys. Stat. Sol. A 1970, 2, 359–370. [Google Scholar] [CrossRef]
  32. Borbély, A.; Dragomir-Cernatescu, J.; Ribárik, G.; Ungár, T. Computer program ANIZC for the calculation of diffraction contrast factors of dislocations in elastically anisotropic cubic, hexagonal and trigonal crystals. J. Appl. Cryst. 2003, 36, 160–162. [Google Scholar] [CrossRef]
  33. Dragomir, I.C.; Ungár, T. The dislocations contrast factors of cubic crystals in the Zener constant range between zero and unity. J. Powder Diffr. 2002, 17, 104–111. [Google Scholar] [CrossRef]
  34. Ungár, T.; Li, L.; Tichy, G.; Pantleon, W.; Choo, H.; Liaw, P.K. Work softening in nanocrystalline materials induced by dislocation annihilation. Scr. Mater. 2011, 64, 876–879. [Google Scholar] [CrossRef]
  35. Ungár, T.; Tóth, L.S.; Illy, J.; Kovács, I. Dislocation structure and work hardening in polycrystalline OFHC copper rods deformed by torsion and tension. Acta Metall. 1986, 34, 1257–1267. [Google Scholar] [CrossRef]
  36. Balogh, L.; Brown, D.W.; Mosbrucker, P.; Long, F.; Daymond, M.R. Dislocation structure evolution induced by irradiation and plastic deformation in the Zr-2.5Nb nuclear structural material determined by neutron diffraction line profile analysis. Acta Mater. 2012, 60, 5567–5577. [Google Scholar] [CrossRef]
  37. Ungár, T.; Stoica, A.D.; Tichy, G.; Wang, X.L. Orientation-dependent evolution of the dislocation density in grain populations with different crystallographic orientations relative to the tensile axis in a polycrystalline aggregate of stainless steel. Acta Mater. 2014, 66, 251–261. [Google Scholar] [CrossRef]
  38. Mughrabi, H. The α-factor in the Taylor flow-stress law in monotonic, cyclic and quasi-stationary deformations: Dependence on slip mode, dislocation arrangement and density. Curr. Opin. Solid State Mater. Sci. 2016, 20, 411–420. [Google Scholar] [CrossRef]
  39. Armstrong, R.W.; Arnold, W.; Zerilli, F.J. Dislocation mechanics of copper and iron in high rate deformation tests. J. Appl. Phys. 2009, 105, 023511. [Google Scholar] [CrossRef] [Green Version]
  40. Meyers, M.A. A mechanism for dislocation generation in shock-wave deformation. Scr. Metall. 1978, 12, 21–26. [Google Scholar] [CrossRef]
  41. Murr, L.E. Residual microstructure–mechanical property relationships in shock-loaded metals and alloys. In Shock Waves and High-Strain-Rate Phenomena in Metals; Meyers, M.A., Murr, L.E., Eds.; Plenum: New York, NY, USA, 1981; pp. 607–673. [Google Scholar]
  42. Sliwa, M.; McGonegle, D.; Wehrenberg, C.; Bolme, C.A.; Heighway, P.G.; Higginbotham, A.; Lazicki, A.; Lee, H.J.; Nagler, B.; Park, H.S.; et al. Femtosecond X-ray diffraction studies of the reversal of the microstructural effects of plastic deformation during shock release of tantalum. Phys. Rev. Lett. 2018, 120, 265502. [Google Scholar] [CrossRef] [Green Version]
  43. Turneaure, S.J.; Renganathan, P.; Winey, J.M.; Gupta, Y.M. Twinning and dislocation evolution during shock compression and release of single crystals: Real-time X-ray diffraction. Phys. Rev. Lett. 2018, 120, 265503. [Google Scholar] [CrossRef] [Green Version]
  44. Schafler, E. Effects of releasing the hydrostatic pressure on the nanostructure after severe plastic deformation of Cu. Scr. Mater. 2010, 62, 423–426. [Google Scholar] [CrossRef]
  45. Kerber, M.; Spieckermann, F.; Schuster, R.; Jóni, B.; Schell, N.; Schafler, E. In-situ synchrotron profile analysis after high-pressure torsion deformation. Crystals 2019, 9, 232. [Google Scholar] [CrossRef] [Green Version]
  46. Taylor, G.I. The mechanism of plastic deformation of crystals. Part I. Theoretical. Proc. R. Soc. A 1934, 145, 362–404. [Google Scholar]
  47. Gubicza, J.; Chinh, N.Q.; Krállics, G.; Schiller, I.; Ungár, T. Microstructure of ultrafine-grained fcc metals produced by severe plastic deformation. Curr. Appl. Phys. 2006, 6, 194–199. [Google Scholar] [CrossRef]
  48. Shehadeh, M.A.; Zbib, H.M.; Rubia, T.D.D.L. Multiscale dislocation dynamics simulations of shock compression in copper single crystal. Int. J. Plast. 2005, 21, 2369–2390. [Google Scholar] [CrossRef]
  49. Chhabildas, L.D.; Asay, J.R. Time-resolved wave profile measurements in copper to megabar pressures. In Proceedings of the Eighth AIRAPT and 19th EHPRG, Uppsala, Sweden, 17 August 1981. [Google Scholar]
  50. Kraus, R.G.; Davis, J.P.; Seagle, C.T.; Fratanduono, D.E.; Swift, D.C.; Brown, J.L.; Eggert, J.H. Dynamic compression of copper to over 450 GPa: A high–pressure standard. Phys. Rev. B 2016, 93, 134105. [Google Scholar] [CrossRef] [Green Version]
Figure 1. True-stress–true-strain curves of the OFHC Cu samples under quasi-static and Hopkinson bar compression.
Crystals 13 01252 g001
Figure 2. Schematic view of the experimental setup of the electric gun for the shock loading of the Cu sample and a recovered sample after the shock pressure of 49 GPa [25]. The base plate, the specimen and the momentum-absorption bar are all made of OFHC Cu.
Crystals 13 01252 g002
Figure 3. The diffraction patterns of the quasi-static (a), Hopkinson bar (b) and electric gun (c) compressed Cu specimens. The strains for the quasi-static, Hopkinson bar and electric gun compression are 0.4, 0.4 and 0.28, respectively. The black open circles and the red solid lines are the measured data and the calculated patterns from the CMWP procedure.
Crystals 13 01252 g003
Figure 4. Dislocation densities in the Cu specimens after the quasi-static (blue triangles), Hopkinson bar (red circles) and electric gun (black squares) tests. The dashed lines only guide the eyes.
Crystals 13 01252 g004
Figure 5. The q parameters of the quasi-static (blue triangles), Hopkinson bar (red circles) and electric gun (black squares) deformed samples.
Crystals 13 01252 g005
Figure 6. The arrangement parameter of dislocations, M, of the Cu specimens after the quasi-static (blue triangles), Hopkinson bar (red circles) and electric gun (black squares) tests. The dashed lines only guide the eyes.
Crystals 13 01252 g006
Figure 7. The subgrain size dx in the Cu specimens after the quasi-static (blue triangles), Hopkinson bar (red circles) and electric gun (black squares) tests. The dashed lines only guide the eyes.
Crystals 13 01252 g007
Figure 8. The measured and calculated dislocation densities in the Cu samples for the quasi-static (blue triangles), Hopkinson bar (red circles) and electric gun (black squares) tests. The dislocation density at the shear strain of 2.6 (blue square) is taken from ref. [35]. The red solid lines are the calculated dislocation densities as a function of shear strain γ .
Crystals 13 01252 g008
Figure 9. The measured dislocation densities from TEM (blue circles) and XLPA (black squares) and the calculated (red line) dislocation densities as a function of shock pressure for copper. The TEM values are taken from ref. [41]. The dashed lines only guide the eyes.
Crystals 13 01252 g009
Figure 10. The calculated, σcalc, vs. the measured, σmeas, flow-stress values for the quasi-static (blue triangles), Hopkinson bar (red circles) and electric gun (blue open squares for α = 0.23, red open squares for α = 0.35) deformed samples.
Crystals 13 01252 g010
Disclaimer/Publisher’s Note: The statements, opinions and data contained in all publications are solely those of the individual author(s) and contributor(s) and not of MDPI and/or the editor(s). MDPI and/or the editor(s) disclaim responsibility for any injury to people or property resulting from any ideas, methods, instructions or products referred to in the content.

