Article

Identification of Proteins Adsorbed on Hydroxyapatite Ceramics with a Preferred Orientation to a-Plane

1
Department of Applied Chemistry, School of Science and Technology, Meiji University, 1-1-1 Higashimita, Tama-ku, Kawasaki 214-8571, Kanagawa, Japan
2
Meiji University International Institute for Materials with Life Functions, 1-1-1 Higashimita, Tama-ku, Kawasaki 214-8571, Kanagawa, Japan
3
Japan Synchrotron Radiation Research Institute, 1-1-1 Kouto, Sayo-gun 679-5198, Hyogo, Japan
4
Meiji University Renewable Energy Laboratory, 1-1-1 Higashimita, Tama-ku, Kawasaki 214-8571, Kanagawa, Japan
5
Department of Electronics and Bioinformatics, School of Science and Technology, Meiji University, 1-1-1 Higashimita, Tama-ku, Kawasaki 214-8571, Kanagawa, Japan
6
Department of Materials and Life Sciences, Faculty of Science and Technology, Sophia University, 7-1 Kioi-cho, Chiyoda-ku, Tokyo 102-8554, Japan
*
Author to whom correspondence should be addressed.
Crystals 2023, 13(9), 1318; https://doi.org/10.3390/cryst13091318
Submission received: 4 August 2023 / Revised: 24 August 2023 / Accepted: 25 August 2023 / Published: 29 August 2023
(This article belongs to the Special Issue Biomaterials for Medical and Dental Applications)

Abstract

:
Protein adsorption is essential for determining material biocompatibility and promoting adherent cell growth. In this study, we focused on the a-plane structure of hydroxyapatite (HAp). This a-plane structure closely resembles the crystal plane where apatite is exposed in long bones. We conducted protein adsorption experiments using HAp ceramics with a preferred orientation to a-planes (aHAp), employing bovine serum albumin (BSA), lysozyme, and fetal bovine serum (FBS) as protein models to mimic the in vivo environment. Higher zeta potential and contact angle values were found in aHAp than in HAp ceramics fabricated from commercial HAp powder (iHAp). Bradford-quantified protein adsorption revealed BSA adsorption of 212 ng·mm−2 in aHAp and 28.4 ng mm−2 in iHAp. Furthermore, the Bradford-quantified protein adsorption values for FBS were 2.07 μg mm−2 in aHAp and 1.28 µg mm−2 in iHAp. Two-dimensional electrophoresis (2D-PAGE) showed a higher number of protein-derived major spots in aHAp (37 spots) than in iHAp (12 spots). Mass spectrometry analysis of the resulting 2D-PAGE gels revealed proteins adsorbed on aHAp, including secreted frizzled-related protein 3 and vitamin K epoxide reductase complex 1, which are involved in cellular bone differentiation. Overall, these proteins are expected to promote bone differentiation, representing a characteristic property of aHAp.

1. Introduction

Hydroxyapatite (Ca10(PO4)6(OH)2; HAp), a compound with a chemical composition closely resembling the inorganic components of biological hard tissue [1,2], possesses excellent biocompatibility and osteoconductivity [3], thereby positioning it as a promising candidate for reconstructing skeletal defects.
Crystallographically, HAp belongs to the hexagonal crystal family and possesses two distinct crystal planes: the a-plane (positively charged due to Ca2+ ion abundance) and the c-plane (negatively charged due to PO43− and OH ion abundance) [4]. Interestingly, the a-plane structure in HAp closely resembles the crystal plane exposed in long bones where apatite is present [5,6,7,8], suggesting that this a-plane promotes osteoblast growth and differentiation. Chen et al. cultured cells on HAp-coated bioglass by hydrothermal method using simulated body fluids and showed that the oriented structure of HAp affects cell proliferation [9]. Aizawa et al. successfully synthesized single-crystal HAp particles with an a-plane orientation preference (hereafter referred to as apatite fiber (AF)) [10,11]. Zhuang et al. successfully developed a new fabrication process for densely packed HAp ceramics with a preferentially oriented a-plane using a composite powder of AF and apatite gel (AG) [12]. Hereafter, we refer to HAp ceramics with a-plane orientation preference as “aHAp ceramics” in the present study. Aizawa et al.’s culturing of MG-63 cells on densely packed aHAp ceramics to evaluate the cells’ calcification potential using alizarin red S staining and the ceramics’ ability to induce bone differentiation indicated that aHAp ceramics promoted osteoblast calcification [13].
The crystalline properties of HAp, including anisotropic properties such as solubility and surface potential, actively affect cell behavior. During cell adhesion, proteins are present at the biomaterial–cell interface [14]. Notably, HAp exhibits excellent protein adsorption capability, making it a widely used chromatographic adsorbent [15,16]. Kandori et al. reported that the adsorption of bovine serum albumin (BSA) on synthesized micrometer-sized HAp particles is highly dependent on the a-plane area of HAp, whereas the adsorption of lysozyme (LSZ) shows minimal dependence [17,18]. Zhuang et al. synthesized HAp particles with preferential orientations along the a- and c-planes, respectively, and found that the a-plane preferentially adsorbed BSA, while the c-plane preferentially adsorbed LSZ compared to isotropically oriented HAp particles as a control [19,20].
Protein adsorption on biomaterials and their steric structures have been investigated using atomic force microscopy (AFM) [21,22], X-ray photoelectron spectroscopy [22], and time-of-flight secondary ion mass spectrometry [22,23]. Tunc et al. performed in situ AFM measurements of fibrinogen adsorbed on Si substrate surfaces of varying surface states [21]. They found that fibrinogen molecules adsorbed on hydrophilic surfaces were trigonal, whereas all molecules appeared spherical on hydrophobic surfaces. In addition, molecular modeling methods have also been used for the study of protein adsorption on HAp, both from an energetic and structural point of view. Shen et al. reported that the adsorption and desorption behaviors of fibronectin on the HAp (001) surface were systematically studied by molecular dynamics simulation. They clarified that the electrostatic energy plays a dominant role in the interaction between the fibronectin and HAp surface [24].
Studying the competitive adsorption of proteins on surfaces is important because biomaterials are often exposed to mixtures of proteins with different affinities for surfaces, such as plasma. Identifying the complex serum proteins adsorbed in vitro may provide better insights into how the a-plane of HAp affects cells. Two-dimensional electrophoresis (2D-PAGE) is a promising protein analysis method due to its rapidity, simplicity, and cost-effectiveness, enabling the analysis of various proteins based on their isoelectric points and molecular weights. Tsai et al. used 2D-PAGE to analyze the proteins adsorbed on silicon and polyurethane substrates [25], revealing the differential adsorption selectivity of proteins to these two substrates.
To elucidate the relationship between HAp anisotropy and protein adsorption specificity, we investigated the protein adsorption properties of dense aHAp ceramics. We first characterized the surface properties of the fabricated aHAp ceramics, including surface roughness, zeta potential, and wettability. Next, we examined protein adsorption on aHAp ceramics using two model proteins, BSA and LSZ, which have different isoelectric points. The individually adsorbed proteins were quantified using the Bradford method, and differences in protein adsorption were evaluated using various analytical methods such as surface zeta potential measurement and AFM observation. Finally, serum proteins adsorbed on the ceramics were also determined by the Bradford method. To visualize the adsorbed proteins, 2D-PAGE was used. Adsorbed proteins separated by 2D-PAGE were analyzed by matrix-assisted laser desorption/ionization time-of-flight mass spectrometry (MALDI-TOF/MS).

2. Materials and Methods

2.1. Fabrication of HAp Ceramics

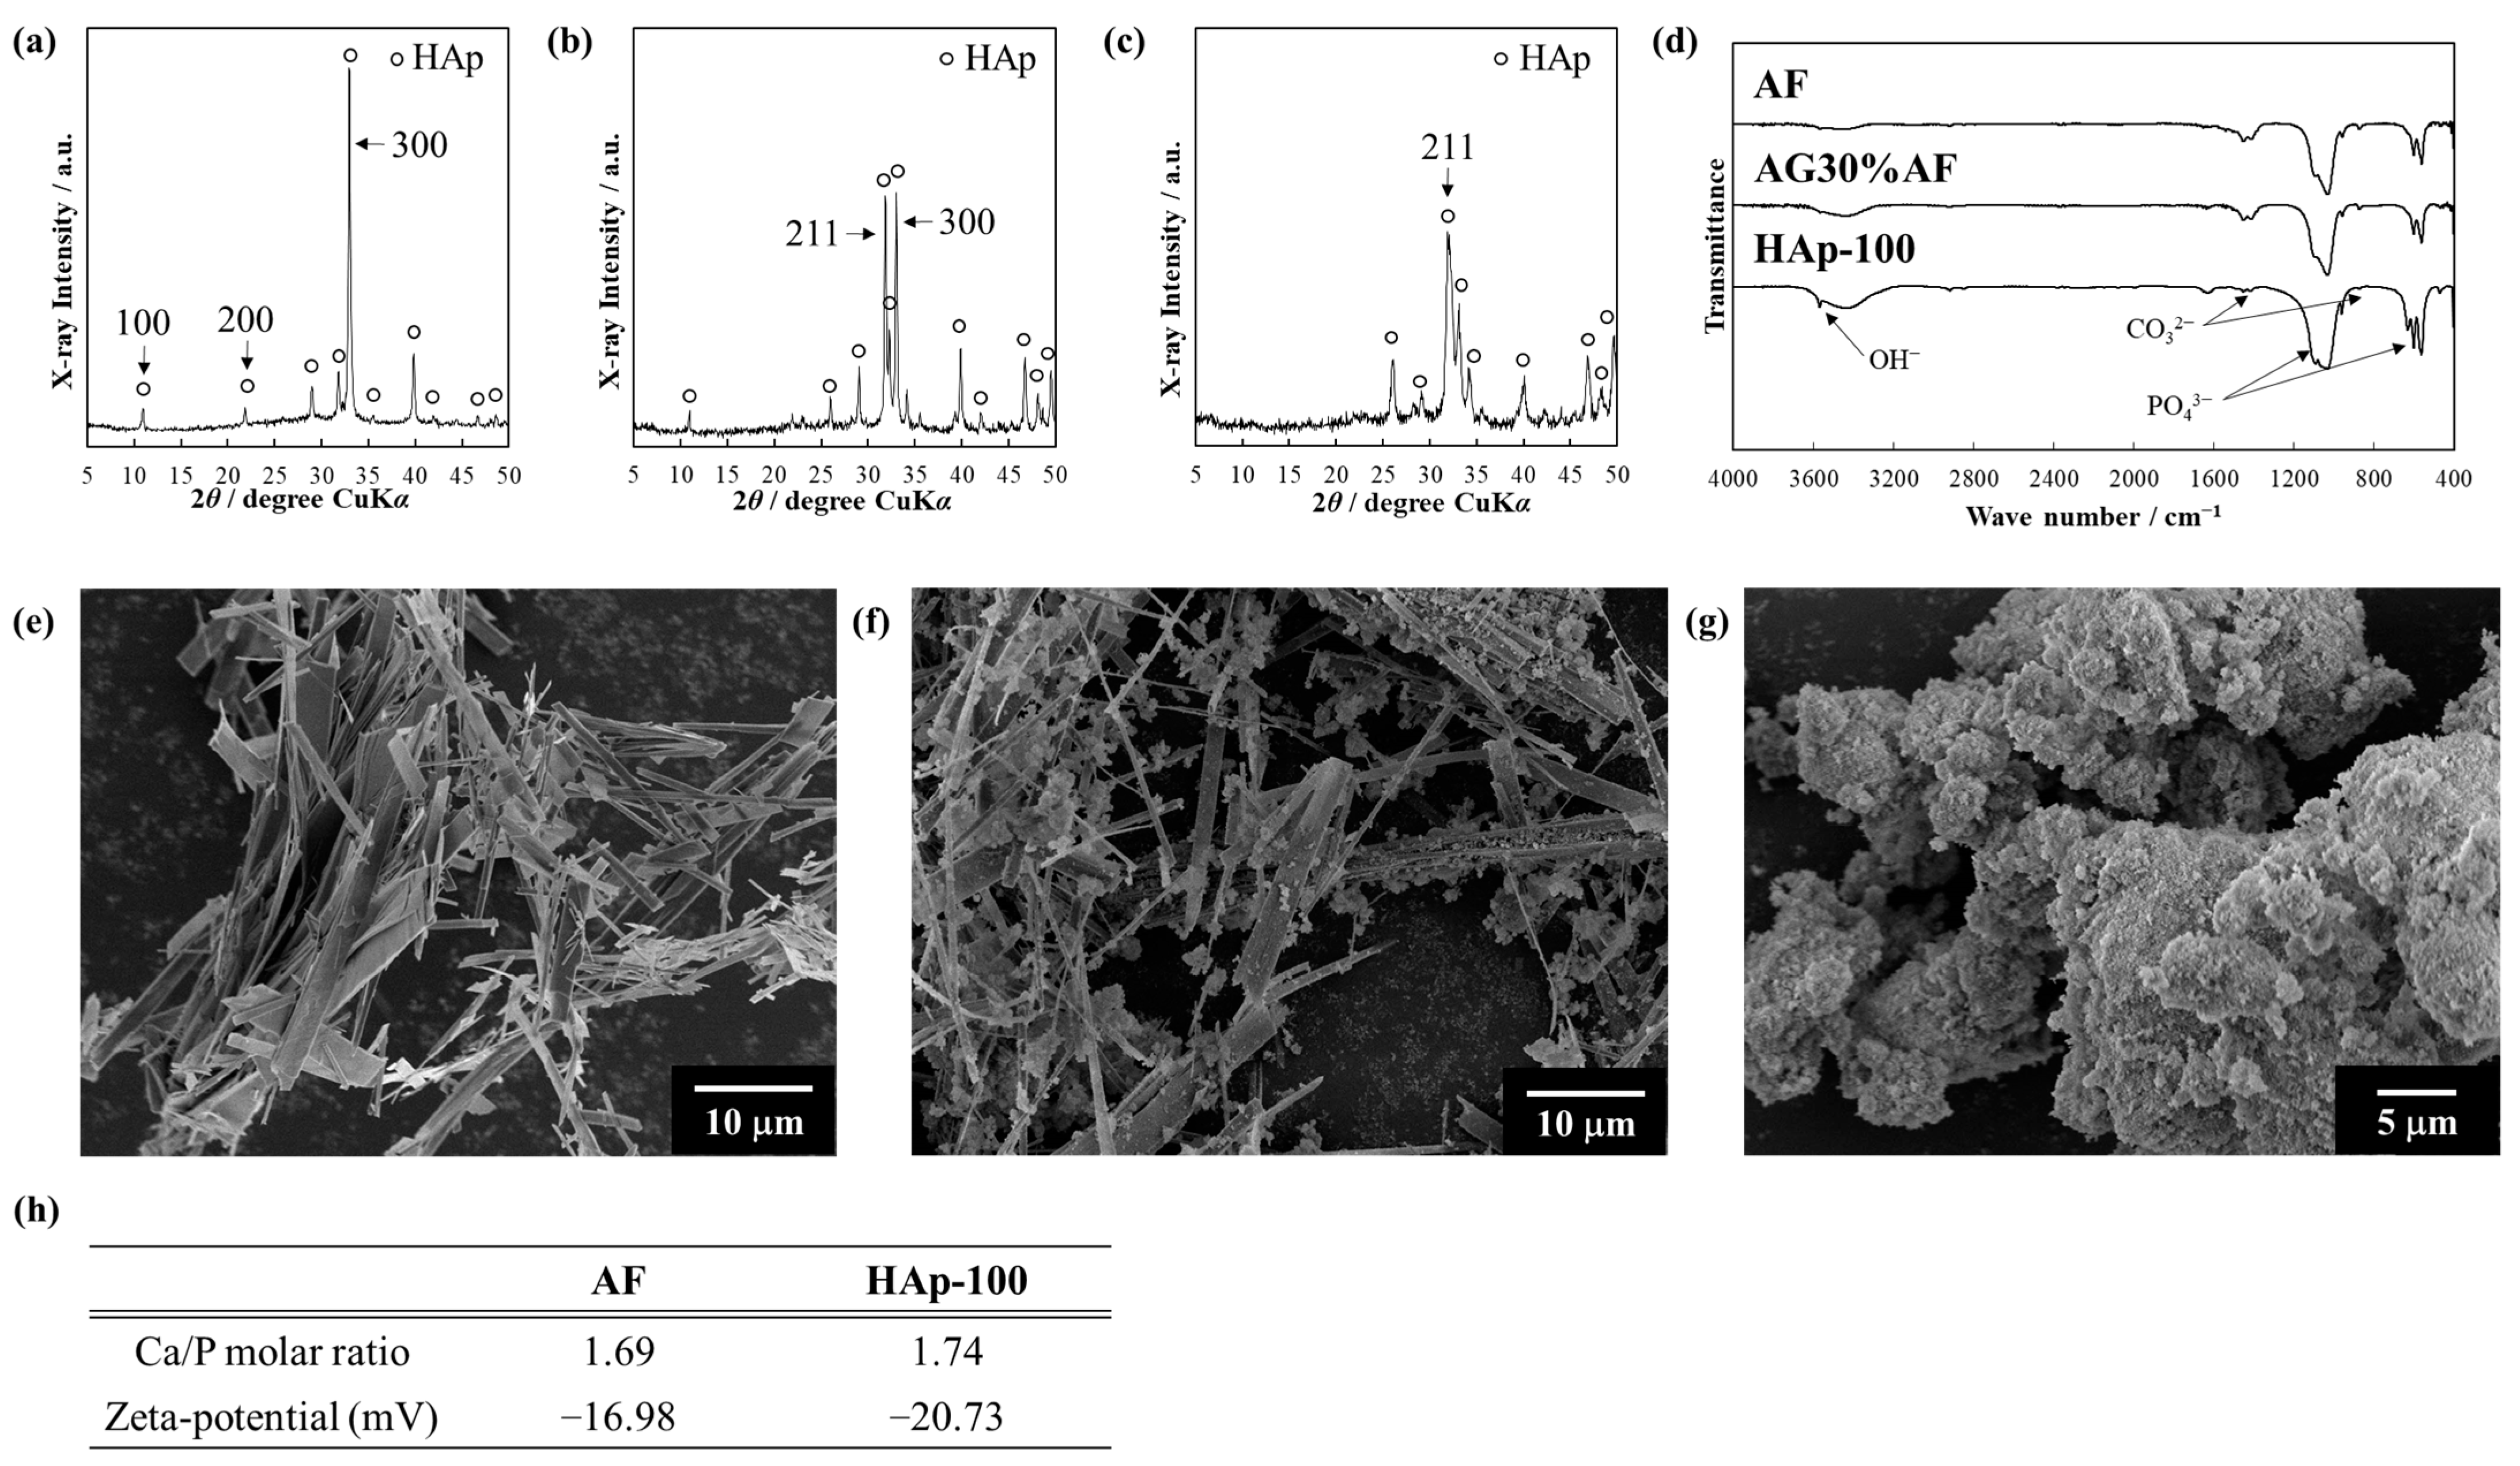
2.1.1. Synthesis of Starting HAp Powders and Their Characterization

AF, a starting powder for aHAp ceramics, was synthesized using a homogeneous precipitation method as previously reported [10,11]. FUJIFILM Wako Pure Chemical Co., Osaka, Japan supplied the reagents required for HAp synthesis. To prepare the starting solution, a mixture of 0.167 mol·dm−3 calcium nitrate tetrahydrate (Ca(NO3)2·4H2O), 0.100 mol dm−3 ammonium hydrogen phosphate ((NH4)2HPO4), 0.50 mol dm−3 urea ((NH2)2CO), and 0.1 mol dm−3 nitric acid (HNO3) was refluxed at 80 °C for 24 h and then at 90 °C for an additional 72 h. After filtration and washing with pure water, the AF slurry (approximately 1 mass%) was prepared by adding pure water. AFs were mixed with apatite microcrystals (apatite gels: AG) for the templated grain growth method [12]. To the AF slurry (500 cm3), a 0.12 mol·dm−3 solution of (NH4)2HPO4 was added, and the pH was adjusted to 10.0 by adding a 25 mass% aqueous ammonia (NH4OH: FUJIFILM Wako Pure Chemical Co.) solution. Then, a 0.20 mol·dm−3 solution of Ca(NO3)2 4H2O at pH 10.0 was added dropwise (6 cm3 min−1) to initiate the precipitation of AG particles on the AF surface through the reaction of calcium and phosphate salts. The mixture was subsequently stirred (100 rpm) at room temperature for 24 h. Finally, the composite powders were filtered and dried in an oven (FC-410, ADVANTEC Co., Ltd., Tokyo, Japan) at 110 °C for 1 day, and named “AG30%AF”. A commercial HAp powder (HAp-100: Taihei Chemical Industrial Co., Ltd., Osaka, Japan) was used as a control.
The crystalline phase of the HAp powders was identified using X-ray diffractometry (XRD: MiniFlex, Rigaku Co., Tokyo, Japan) with CuKa radiation (λ = 0.15405 nm) operating at 30 kV and 15 mA. The XRD data were collected using the following conditions: a 2θ range of 5–50°, scan rate of 2° min−1, and sampling width of 0.02°.
The functional groups present in the resulting HAp powders were analyzed using Fourier transform infrared spectrometry (FT-IR: IR prestige-21, Shimadzu, Kyoto, Japan) and the KBr tablet method in the range of 400–4000 cm−1 with a spectral resolution of 4 cm−1.
The particle morphology of the HAp powders was observed with a scanning electron microscope (SEM: JSM6390LA, JEOL Ltd., Tokyo, Japan) operating at 5 kV. The SEM specimens were prepared by mounting the powders on double-sided carbon tapes and coating them with platinum particles.
The calcium and phosphorus contents of the HAp powders were determined by inductively coupled plasma atomic emission spectrometry (ICP-AES: SPS7800, Hitachi High-Tech Co., Tokyo, Japan), and the Ca/P molar ratios were calculated. Prior to measurement, the ICP-AES samples were thoroughly dissolved in 69.0% nitric acid (HNO3: Kanto Chemical Co., Inc., Tokyo, Japan). The zeta potential of HAp particles was determined using a zeta potential analyzer (ELSZ-2, Otsuka Electronics Co., Ltd., Osaka, Japan) in a 10 mmol dm−3 NaCl aqueous solution at pH 7.0 and 25 °C.

2.1.2. Fabrication of HAp Ceramics and Their Properties

Two types of HAp ceramics were prepared according to previous reports [12]. Dried AG30%AF powder (~1.0 g) was filled into a mold (ϕ17.5 mm) and uniaxially pressed at 200 MPa. The resulting green compacts were fired at 1300 °C for 5 h under a water vapor atmosphere (35 °C saturated water vapor, 200 cm3·min−1) using a tube-type electric furnace (KTF433N, Koyo Thermo Systems Co., Ltd., Nara, Japan) at a heating rate of 5 °C·min−1. As a control, standard HAp ceramics with an isotropic structure were also fabricated from the HAp-100 powders. HAp-100 powder (~1.0 g) was pressed with a die (ϕ20.5 mm) at 50 MPa. The resulting green compacts were fired at 1200 °C for 5 h under a water vapor atmosphere at a heating rate of 5 °C·min−1. The resulting ceramics were named “aHAp” and “iHAp”, respectively. Moreover, the surfaces of all the resulting ceramics were polished with #2000 silicon carbide waterproof papers (cc-2000Cw: Sankyo-Rikagaku Co., Ltd., Saitama, Japan).
Crystalline phase identification, functional group determination, Ca/P molar ratio calculation, and zeta potential analysis of the resulting ceramics were performed as described in Section 2.1.1. The a-plane orientation degree of each ceramic was calculated using the Lotgering method [26], a simple method for quantifying the orientation degree. The Lotgering factor (LF) is calculated based on the intensities of XRD peaks obtained from the conventional 2θ scan mode and is defined as follows [26]:
L F = p p 0 1 p 0
where p denotes the ratio of the summation of the peak intensities corresponding to the preferred orientation axis to that of the summation of all diffraction peaks in particle-oriented materials. p0 is the p of a material with a random particle distribution. The LF lies in [0, 1]: LF = 0 corresponds to random orientation and LF = 1 corresponds to perfect orientation.
Specimens for zeta potential analysis were fabricated using a rectangular mold (sample size: 30 mm width × 10 mm length × 5 mm thick).
The microstructure of the resulting ceramics was observed by SEM at 10 kV. After the surface polishing treatment, thermal etching was performed at 1250 °C (aHAp) or 1150 °C (iHAp) for 20 min under air atmosphere using a box-type electric furnace (KBF314N1, Koyo Thermo Systems Co., Ltd.) at a heating rate of 60 °C·min−1. The SEM specimens were prepared by fixing the ceramics on double-sided carbon tapes and depositing platinum particles.
The relative density of the resulting ceramics was calculated by dividing the bulk density by the theoretical density of HAp (3.16 g cm−3) using Equation (2).
Relative   density   [ % ] = Bulk   density   [ g · cm 3 ] Theoretical   density   of   HAp   [ g · cm 3 ] × 100  
The ceramic surface roughness (average roughness: Ra) was measured using a surface roughness tester (SURFTEST SV-3100, Mitutoyo Co., Kanagawa, Japan) and calculated according to Japanese industrial standards (JIS2001 R_J01). In addition, ceramic surface wettability was evaluated using a static contact angle meter (Simage03: Excimer Inc., Kanagawa, Japan). The measurement was performed by dropping ultrapure water on the sample surface and determining surface wettability using the ATAN1/2θ method. The contact angle (θ) was calculated using Equation (3), where h and r are the height and base radius of the droplet, respectively.
θ = 2   arctan h / r

2.2. Protein Adsorption Experiments Using BSA or LSZ

2.2.1. Amount of BSA or LSZ Protein Adsorbed on Ceramic Surfaces

The model proteins were BSA (assay at least 98 mass%, pI 4.7) and LSZ from egg white (assay at least 80 mass%, pI 11.2) obtained from FUJIFILM Wako Pure Chemical Co. Both proteins were dissolved in Milli-Q water to a concentration of 250 μg·cm−3. Specimens were placed in a 24-well culture polystyrene plate (ϕ16 mm: IWAKI, Asahi Glass Co., Ltd., Shizuoka, Japan) and 1.0 cm3 of protein solutions were added. The HAp ceramic specimens were immersed in protein solutions for 24 h at 37 °C under 100% relative humidity. Afterward, the protein solutions were collected, and protein content was measured via the Bradford assay (#5000205; Bio-Rad Laboratories Inc., Hercules, CA, USA) with a microplate reader (MULTISKAN, Thermo Scientific Co., Waltham, MA, USA) using the calibration curve method. Protein solution absorbance was measured at a 595 nm band using visible light.

2.2.2. Surface Zeta Potential of Bulk Ceramics after Adsorption of a Model Protein

Bulk ceramics for zeta potential analysis were fabricated using a rectangular mold (Sample size: 30 mm width × 10 mm length × 10 mm thick). BSA and LSZ were dissolved in Milli-Q water to a concentration of 1000 μg·cm−3. HAp ceramic specimens were placed in a 6-well culture polystyrene plate (IWAKI, Asahi glass Co., Ltd.) and exposed to 3.0 cm3 of the protein solutions. The specimens were then incubated at 37 °C under 100% relative humidity for 24 h. Afterward, the protein solutions were removed, and the protein-adsorbed ceramics were freeze-dried overnight. The surface zeta potential of the ceramics used for protein adsorption was determined using a zeta potential analyzer in a 10 mmol dm−3 NaCl aqueous solution at pH 7.0 and 25 °C.

2.2.3. Microstructure Observation of Ceramics after Adsorption of a Model Protein

Specimens for AFM observation were prepared using the ceramics prepared when determining the protein amount in Section 2.2.1. The surface structure of the protein-adsorbed ceramics was observed by AFM (Dimension® IconTM for NanoScope V XP version, Bruker Co., Billerica, MA, USA). The AFM measurement mode was set to “ScanAssist in Air” mode (scan size 500 nm, scan rate 0.977 Hz). A “SCANASYST-AIR” probe (Bruker Co., Billerica, MA, USA) was used as a cantilever. As a control, the surface of ceramics without adsorbed protein was also observed. The measured AFM images were analyzed using analysis software (Nanoscope Analysis, Bruker Co., Billerica, MA, USA). Surface grain size analysis was performed by calculating the average height of 10 randomly selected grains in the AFM images.

2.3. Serum Protein Adsorption Experiment

2.3.1. Amount of Serum Proteins Adsorbed on Ceramic Surfaces

Fetal bovine serum (FBS: Thermo Fisher Scientific Co., Waltham, MA, USA) was used as the serum protein solution. Specimens were placed in a 24-well culture polystyrene plate and exposed to 1.0 cm3 of FBS. After immersion at 37 °C under 100% relative humidity for 24 h, the protein solutions were removed and the specimens were washed twice with Milli-Q water. After washing, the adsorbed proteins were extracted from the HAp ceramics via immersion in 1 cm3 of 0.5 mol·dm−3 phosphate buffer (pH 6.8) for 30 min. To quantify the amount of protein for the 2D-PAGE analysis, phosphate buffer extraction was conducted. The extracted content was measured with the Bradford assay using a microplate reader. Protein solution absorbance was measured at a 595 nm band using visible light.

2.3.2. Two-Dimensional Electrophoresis

Abundant serum proteins were removed using a commercially available ion exchange spin column (ProteoSpin Abundant Serum Protein Depletion Kit: 17300, Norgen Biotek Co., Thorold, ON, Canada) from the extracted serum protein solution in order to obtain distinct protein spots in 2D-PAGE. Protein extracts were concentrated by trichloroacetic acid (TCA; FUJIFILM Wako Pure Chemical Co.) and acetone (FUJIFILM Wako Pure Chemical Co.) precipitation. The resulting protein sediment was dissolved in a commercially available 2D-PAGE sample buffer (AE-1435, ATTO Co., Tokyo, Japan).
We conducted 2D-PAGE experiments using the O’Farrell method [27] with some modifications, where isoelectric focusing (IEF) gels (E-D520L, ATTO Co.) and acrylamide 2D gradient gels (the gradient concentration of 5–20%, A-M310, ATTO Co.) were used. The first dimension IEF (WSE-1150, ATTO Co.) was performed following the manufacturer’s protocol and run at 300 V for 4 h. The second-dimension electrophoresis (WSE-1150, ATTO Co.) was performed following the manufacturer’s protocol, with a current not exceeding 21 mA per gel and a voltage gradually increasing to 400 V. After electrophoresis, the gels were stained with a silver staining kit (AE-1360, ATTO Co.) following the manufacturer’s protocol.

2.3.3. Mass Spectrometry

Proteins extracted from the gel obtained in Section 2.3.2 were subjected to mass spectrometry by MALDI-TOF/MS (JMS-S3000, JEOL Ltd.). The extracted proteins were enzymatically digested with trypsin (Trypsin Gold: V5280, Promega Co., Madison, WI, USA) to prepare a peptide matrix. In addition, 25 mm3 of 0.1% (v/v) trifluoroacetic acid (FUJIFILM Wako Pure Chemical Co.) and 50% (v/v) acetonitrile (Nacalai Tesque Inc., Kyoto, Japan) solution were added, and the proteins were extracted by shaking for 30 min at room temperature. The extract was concentrated to approximately 10 mm3 using a centrifugal evaporator under reduced pressure (VC-15sp, Taitec Co., Ltd., Aichi, Japan), followed by desalting using a ZipTip C18 pipette tip (ZTC18S096, Millipore, Merck KGaA, Darmstadt, Germany). The resulting solution served as a sample for MALDI-TOF/MS analysis. Furthermore, the sample solutions were dropped onto the MALDI target plate at 2 mm3 and then saturated a-cyano-4-hydroxycinnamic acid (CHCA; FUJIFILM Wako Pure Chemical Co.) solution (10 mg·dm−3 CHCA, 0.1% (v/v) trifluoroacetic acid, 50% (v/v) acetonitrile solution) was added dropwise while stirring with pipette.
Prior to MALDI-TOF/MS measurements, calibration was performed using a commercial peptide standard (AS-60882, AnaSpec Inc., CA, USA). Sample and peptide standard solutions were dried in a reduced-pressure desiccator.
The MALDI-TOF/MS analysis results were functionally identified using peptide mass fingerprinting and a MASCOT database search (http://www.matrixscience.com/; accessed on 11 November 2021). A score of at least 35 was considered identifiable protein mass data.

2.4. Statistical Analysis

Quantitative data were presented as means ± standard deviations. Differences between the two groups were analyzed by Student’s t-test. p < 0.05 was considered statistically significant. Microsoft Excel for Microsoft 365 (Microsoft Co., Redmond, WA, USA) was used for the computations.

3. Results

3.1. Material Property

3.1.1. Characterization of HAp Powders

Figure 1a–c shows the starting powders’ XRD patterns. The ICDD reference patterns (#09-0432) were used to identify the crystalline phases for HAp. The AF diffraction pattern was identified as a single-phase HAp, and the (300) reflection corresponding to the a-plane of the HAp crystal exhibited a higher intensity than the ICDD reference patterns (Figure 1a). AG30%AF powders also comprised a single-phase HAp (Figure 1b), with AG30%AF having a smaller (300) reflection than AF due to the addition of amorphous AG particles. The HAp-100 diffraction pattern showed well-characterized reflections based on the standard HAp with an isotropic orientation (Figure 1c).
Figure 1d displays the starting powders’ FT-IR spectra. The spectra of AF, AG30%AF, and HAp-100 particles exhibited characteristic bands at 3570, 1500–1350, 1200–900, 880–870, 600, and 570 cm−1. These three particles had peaks caused by the OH group at 3570 cm−1 and PO43− groups at 1100–960 cm−1, 600, and 570 cm−1 [28]. In addition, absorptions attributed to the CO32− group were detected at 1550–1400 and 880 cm−1 [28]. Therefore, the three particles can be classified as carbonate-containing HAps.
Figure 1e–g shows the starting powders’ morphologies. The AF and AG30%AF particle morphologies were fiber-shaped (Figure 1e,f). In particular, the AG30%AF particles had amorphous particles deposited on the fibrous AF. In contrast, HAp-100 particles appeared as aggregates measuring approximately 50–100 mm in size (Figure 1g). In addition, the Ca/P molar ratios of AF and HAp-100 were 1.69 and 1.74, respectively (Figure 1h), with each powder having negative zeta potentials in the order of AF (−16.98 mV) > HAp-100 (−20.73 mV).

3.1.2. Material Property of HAp Ceramics

Figure 2a displays the resulting ceramics’ XRD patterns. aHAp exhibited a single-phase HAp, and the (300) reflection corresponding to the a-plane of the HAp crystal exhibited a higher intensity than the ICDD pattern (JCPDS cards #09-0432). However, the iHAp diffraction pattern showed well-characterized reflections based on the standard HAp with an isotropic structure. The Lotgering-calculated a-plane orientation degrees were in the order of aHAp (0.450) > iHAp (0.228).
Figure 2b illustrates the resulting ceramics’ FT-IR spectra. The aHAp and iHAp spectra exhibited characteristic bands at 3570, 1100–960, 600, and 570 cm−1, with both having peaks caused by the OH group at 3570 cm−1 and PO43− groups at 1100−960 cm−1, 600, and 570 cm−1 [28]. However, the absorption of the CO32− group shown in the starting powders was not confirmed, which was due to the CO32− released during firing.
Figure 2c,d shows the resulting ceramic microstructures. The observation results indicated that the ceramics comprised closely packed crystal grains with only a few pores. Figure 2e depicts the two ceramics’ material properties. The calculated relative densities of the resulting ceramics were 90% (aHAp) and 94% (iHAp), respectively. Therefore, the present specimens can be considered dense ceramics. In addition, the Ca/P molar ratio of each ceramic was 1.67 (aHAp) and 1.66 (iHAp), with surface roughness below 0.1 mm (aHAp (0.068 mm) and iHAp (0.081 mm)). The zeta potential and contact angle of aHAp and iHAp were −7.95 and −16.98 mV and 73.4° and 53.9°, respectively.

3.2. Adsorption Experiment Using Model Proteins

3.2.1. Amount of Model Proteins Adsorbed on Ceramic Surfaces

Figure 3 shows the amount of BSA (a) and LSZ (b) adsorbed on aHAp and iHAp, respectively. The amounts of BSA adsorbed on aHAp and iHAp were normalized for the specific surface area of specimens and were aHAp (212 ng·mm−2) and iHAp (28.4 ng mm−2). However, regarding LSZ, no significant difference in the adsorption amount was observed between aHAp (86.8 ng mm−2) and iHAp (74.7 ng mm−2). After adsorption of BSA and LSZ, the crystalline phase remained in the apatite phase.

3.2.2. Surface Zeta Potential of Ceramics Adsorbing a Model Protein

Figure 3c shows the surface zeta potential of ceramic specimens before and after protein adsorption. The surface zeta potentials followed the order of LSZ-adsorbed ceramics (aHAp: −26.56 mV, iHAp: −24.84 mV) < nontreated ceramics (aHAp: −7.95 mV, iHAp: −16.98 mV) < BSA-adsorbed ceramics (aHAp: −3.54 mV, iHAp: 8.92 mV). The isoelectric points of LSZ and BSA (11 and 4.8) indicate basicity and acidity under neutral conditions, respectively. This finding suggests that the degree of change in ceramic potential correlates with the adsorbed protein’s isoelectric point.

3.2.3. Microstructure Observation of Ceramics Adsorbing a Model Protein

Figure 4 shows AFM micrographs of the aHAp and iHAp ceramics. Nontreated HAp ceramics had a uniformly smooth surface topology of approximately 20 nm in height (Figure 4a,b). However, protein adsorption-treated ceramics exhibited nanoscale irregularities on the surface (Figure 4c–f) in addition to the ceramic crystal grains. These irregularities, observed exclusively on protein-adsorbed ceramics, likely correspond to adsorbed protein particles. The variations in protein nanoparticle shapes were specific to the types of adsorbed proteins and ceramics. BSA-adsorbed aHAp exhibited uniformly sized “straight cylindrical grains”, whereas BSA-adsorbed iHAp showed elongated grains. Adsorbed LSZs exhibited distinct shapes, with larger grains in aHAp and smaller grains in iHAp.
Figure 4g shows the average grain height. While the grain height was 10.3 ± 2.67 nm for aHAp and 6.56 ± 2.22 nm for iHAp regarding BSA, it was 25.0 ± 10.7 nm for aHAp and 8.79 ± 3.55 nm for iHAp regarding LSZ. Notably, the molecular sizes of BSA and LSZ proteins (14 × 4 × 4 nm and 3.0 × 4.5 × 4.5 nm [29], respectively) suggest potential deformation upon adsorption.

3.3. Serum Protein Adsorption Experiment

3.3.1. Amount of Serum Proteins Adsorbed on Ceramic Surfaces

Figure 5a shows the adsorption amounts of serum proteins on aHAp and iHAp ceramics after normalization to each ceramic-specific surface area. aHAp showed significantly higher protein adsorption (2.07 µg mm−2) than iHAp (1.28 µg mm−2).

3.3.2. Two-Dimensional Electrophoresis

Figure 5b displays the 2D-PAGE gel images of the FBS solution and serum protein adsorbed on the two ceramics. The gel spots of the two ceramics resembled those of FBS, indicating serum protein adsorption on both ceramic surfaces. Several protein spots were observed on the gel’s acidic side. A comparison between the aHAp gel (Figure 5c) and iHAp gel (Figure 5d) showed stronger protein spots in the former (37 and 12, respectively).

3.3.3. Mass Spectrometry

Figure 6a,b shows representative MALDI-TOF/MS spectra from strong protein spots at pI 5 and a molecular weight of approximately 60,000, which were taken from the electrophoresis gels in Figure 5c①,d②, respectively. Using the MASCOT data search, these spectra were identified as the peptide sequence of P02769 called bovine albumin. Therefore, the protein spots at pI 5 and molecular weighing approximately 60,000 observed in Figure 5c①,d① could be albumin.
MALDI-TOF/MS analysis of the 2D-PAGE gels of aHAp (Figure 5c) and iHAp (Figure 5d) showed that aHAp and iHAp adsorbed 37 and 12 proteins, respectively. Lists of all serum proteins adsorbed on aHAp and iHAp are given in Tables S1 and S2 of the Supplementary Materials, respectively. aHAp and iHAp absorbed 37 and 12 proteins, respectively. Most of the estimated proteins in aHAp were consistent with those in iHAp. However, protein spots such as Q95117, which is SFRP-3, were strongly observed for aHAp-adsorbed proteins.

4. Discussion

The results obtained in this study provide evidence that aHAp ceramics exhibit a higher affinity for acidic protein and serum protein adsorption. First, the adsorption of model proteins (BSA or LSZ) on HAp ceramics with a controlled anisotropic structure was clarified. While aHAp adsorbed more BSA than iHAp (Figure 3a), their LSZ adsorptions were the same (Figure 3b). This variation in adsorption was attributed to the higher surface potential and contact angle of aHAp ceramics. Protein adsorption typically involves electrostatic and hydrophobic interactions. aHAp ceramics had a higher zeta potential (−7.95 mV) than iHAp ceramics (−16.98 mV) (Figure 2e). The difference in atomic arrangement on the HAp crystal plane causes this zeta potential variation. The XRD diffraction pattern in Figure 2 shows that aHAp is preferentially oriented in the a-plane of HAp. This indicates that the aHAp surface is rich in positively charged calcium ions [4]. BSA is rich in acidic amino acids (e.g., aspartic acid), making it negatively charged under neutral conditions (the total charge of BSA at pH 7.4 calculated using the software (Prot pi; https://www.protpi.ch/Calculator/ProteinTool/; accessed on 18 August 2023) is z = −17.254). aHAp adsorbed more BSA than iHAp because the Ca2+ ions exposed on the aHAp surface and the carboxy groups (COO) of the amino acids comprising BSA were electrostatically attracted. However, LSZ is rich in basic amino acids (e.g., arginine), making it positively charged under neutral conditions (the total charge of LSZ at pH 7.4 calculated using Prot pi software is z = +6.243). This suggests the nonoccurrence of electrostatic preferential adsorption on the HAp crystal surface and the absence of adsorption variation. The contact angle was 73.4° for aHAp and 53.9° for iHAp. Because higher hydrophobic surfaces readily adsorb proteins [29], aHAp is clearly suitable for protein adsorption.
The surface zeta potentials of both HAp ceramics followed the order of LSZ-adsorbed > nontreated > BSA-adsorbed ceramics (Figure 3c), probably due to the protein’s isoelectric point, which was 11 for LSZ (indicating its basicity under neutral conditions) and 4.8 for BSA (indicating its acidity under neutral conditions), suggesting that the amount of potential change in the ceramics correlates with the adsorbed protein’s isoelectric point. While the zeta potential for BSA was aHAp (−26.56 mV) < iHAp (−24.84 mV), that for LSZ was (−3.54 mV) < iHAp (7.856 mV). The difference in BSA adsorption explains the variation in surface potential decrease between aHAp and iHAp, while no significant difference was observed in LSZ adsorption between the two ceramics.
The AFM images in Figure 4 show differences in surface roughness between ceramics with and without protein adsorption, indicating that the observed unevenness in protein adsorption-treated ceramics is caused by protein grains. The frequency and shape of these protein grains varied depending on the combination of the types of ceramics and adsorbed protein. For instance, while the particles of aHAp-adsorbed BSA exhibited a vertical structure of approximately 10.3 ± 2.67 nm over the entire observation area (Figure 4c), those of aHAp-adsorbed LSZ exhibited a flat structure of approximately 25.0 ± 10.7 nm in height (Figure 4e). However, while the particles of iHAp-adsorbed BSA had an elliptical shape of approximately 6.56 ± 2.22 nm in height on the whole observation area (Figure 4d), those of iHAp-adsorbed LSZ had the smallest diameter and height of approximately 8.79 ± 3.55 nm (Figure 4f). These results suggest that the observed variations in protein adsorption behavior on surfaces with different wettability may be attributed to differences in the softness of proteins resulting from their three-dimensional structure.
Protein adsorption behavior on hydrophobic and hydrophilic surfaces usually differs significantly, mainly because hydrophobic interactions between proteins and surfaces are likelier to cause a significant breakdown in the secondary structure. BSA, with its globular structure measuring 14.0 × 4 × 4 nm, is typically considered a “soft protein” due to its abundant a-helical structures in the secondary structure. Positive correlations exist between the softness of the protein and its surface hydrophobicity [30]. Because the fragments of a-helical structures are strongly hydrophobic, proteins with abundant a-helical structures can stabilize their tertiary structures through hydrophobic interactions between a-helices. External factors can easily deform this a-helix structure. Soft proteins such as BSA lose their a-helixes and denature significantly when adsorbed on hydrophobic surfaces [31,32]. Adsorbed proteins can undergo significant structural rearrangement if the protein–surface interaction can break the disulfide and hydrogen bonds that maintain the proteins’ internal structure. The electrostatic and hydrophobic interactions observed between HAp and BSA trigger a change in the three-dimensional structure of HAp upon BSA adsorption, with a more compact and densely aligned shape observed on aHAp than on iHAp, resulting in higher adsorption.
In contrast, neutron reflectivity and calorimetry studies have independently shown that LSZ loses a considerable amount of secondary structure on hydrophobic surfaces, despite its structural stability on hydrophilic surfaces. LSZ, with its cubic structure measuring 3.0 × 4.5 × 4.5 nm, is often considered a “hard protein” [30]. It has smaller cavities in its conformation than proteins of similar molecular weights. Hydrophilic residues are located on the globular protein surface, while hydrophobic residues occupy the interior. LSZ does not expose hydrophobic residues on its surface, and its low bulk makes it less susceptible to deformation within the protein structure. Therefore, LSZ is expected to adsorb on hydrophilic surfaces without significant changes in shape [33].
Evaluation of serum proteins adsorbed on HAp ceramics with controlled anisotropy indicated that aHAp demonstrated significantly greater adsorption than iHAp (Figure 5a). This disparity can be attributed to the abundant acidic proteins present in serum, as shown in the 2D-PAGE gel images (Figure 5b–d). The comparison between aHAp and iHAp revealed a greater number of protein spots on the acidic side for aHAp, suggesting its affinity toward acidic proteins abundant in serum. These findings indicate that the results from single-protein adsorption experiments corroborate competitive protein adsorption studies.
Tables S1 and S2 list the MALDI-TOF/MS-identified proteins for aHAp and iHAp, respectively. The protein species adsorbed on aHAp ceramics significantly exceeded those on iHAp ceramics despite the majority of estimated proteins being consistent between the two. Most proteins identified in this experiment were not derived from the extracellular matrix, indicating that the ceramics likely adsorbed intracellularly expressed proteins present as impurities in FBS.
SFRP-3, an extracellular protein, modulates Wnt signaling by directly interacting with Wnts. Wnt proteins play a role in bone and chondrogenic differentiation [34]. The Wnt pathway consists of b-catenin-dependent and b-catenin-independent pathways [35,36]. SFRP family proteins possess a cysteine-rich domain similar to frizzled Wnt receptors and bind to Wnt proteins, acting as antagonists by sequestering them from their receptors [37].
SFRP-3 stimulates bone differentiation through a beta-catenin-independent pathway. Chung et al. demonstrated a significant, dose-dependent inhibition of MC3T3-E1 cell number by SFRP-3 and revealed increased secretion of osteodifferentiation-related proteins [38]. Notably, these proteins specifically adsorb to aHAp. This finding may explain our previously reported high osteodifferentiation potential of aHAp [13]. Another notable protein is the vitamin K epoxide reductase complex subunit 1 (VKORC1) identified in aHAp-adsorbed proteins. The VKORC1 protein is involved in vitamin K metabolism. Normal blood coagulation and bone growth depend on vitamin K, which is needed for the g-carboxylation of various proteins, including clotting factors.
In summary, aHAp exhibited higher adsorption to serum proteins than iHAp, suggesting its potential for effective protein adsorption related to bone growth. This also indicates that aHAp ceramics can promote cell differentiation due to their high protein adsorption capability. The present findings corroborate our prior findings that aHAp has a high osteoblast differentiation-inducing ability [13].

5. Conclusions

Protein adsorption is vital for determining material biocompatibility, and promoting adherent cell growth and differentiation, particularly at the material interface. This study focused on aHAp ceramics, which have an a-plane preferred orientation resembling bone structures, and their protein adsorption properties use BSA, LSZ, and FBS to mimic in vivo environments. The zeta potential and contact angle of aHAp were higher than those of iHAp due to the abundance of Ca2+ ions on its surface. Protein adsorption determination, zeta potential analysis, and AFM confirmed that aHAp readily adsorbed BSA compared to LSZ. FBS adsorption experiments demonstrated the favorable adsorption of serum proteins on aHAp, which was enriched with acidic proteins. In addition, 2D-PAGE analysis revealed a higher number of protein spots in aHAp gel than in iHAp, and mass spectrometry uncovered SFRP-3 and VKORC1 as proteins involved in cellular bone differentiation. These proteins are expected to promote bone differentiation, a characteristic property of aHAp.

Supplementary Materials

The following supporting information can be downloaded at: https://www.mdpi.com/article/10.3390/cryst13091318/s1, Table S1: Identification of the corresponding proteins to spots of 2D-PAGE gels in Figure 5c; Table S2: Identification of the corresponding proteins to spots of 2D-PAGE gels in Figure 5d.

Author Contributions

Conceptualization, M.A.; methodology, E.O.; software, E.O.; validation, E.O.; formal analysis, E.O.; investigation, E.O.; resources, T.H., H.Y. and M.A.; data curation, E.O.; writing—original draft preparation, E.O.; writing—review and editing, N.K., T.H., H.Y., T.N., A.O. and M.A.; visualization, E.O.; supervision, N.K. and M.A.; project administration, M.A.; funding acquisition, M.A. All authors have read and agreed to the published version of the manuscript.

Funding

This research was supported by the Meiji University International Institute for Materials with Life Functions.

Data Availability Statement

The data that support the findings of this study are available from the corresponding author upon reasonable request.

Acknowledgments

I am grateful to Kitaru Suzuki for assistance with the statistical analysis of the quantitative data and the drawing of the graphical abstract.

Conflicts of Interest

The funders had no role in the design of the study; in the collection, analyses, or interpretation of data; in the writing of the manuscript; or in the decision to publish the results.

References

  1. Akao, M.; Aoki, H.; Kato, K. Mechanical properties of sintered hydroxyapatite for prosthetic applications. J. Mater. Sci. 1981, 16, 809–812. [Google Scholar] [CrossRef]
  2. Langelier, B.; Wang, X.; Grandfield, K. Atomic scale chemical tomography of human bone. Sci. Rep. 2017, 7, 39958. [Google Scholar] [CrossRef]
  3. Søballe, K.; Hansen, E.S.; Brockstedt-Rasmussen, H.; Pedersen, C.M.; Bünger, C. Hydroxyapatite coating enhances fixation of porous coated implants. A comparison in dogs between press fit and noninterference fit. Acta Orthop. Scand. 1990, 61, 299–306. [Google Scholar] [CrossRef]
  4. Kay, M.I.; Young, R.A.; Posner, A.S. Crystal structure of hydroxyapatite. Nature 1964, 204, 1050–1052. [Google Scholar] [CrossRef]
  5. Wenk, H.R.; Heidelbach, F. Crystal alignment of carbonated apatite in bone and calcified tendon: Results from quantitative texture analysis. Bone 1999, 24, 361–369. [Google Scholar] [CrossRef]
  6. Carlstrom, D.; Finean, J.B. X-ray diffraction studies on the ultrastructure of bone. Biochim. Biophys. Acta 1954, 13, 183–191. [Google Scholar] [CrossRef] [PubMed]
  7. Zylberberg, L.; Traub, W.; Buffrenil, D.V.; Allizard, F.; Arad, T.; Weiner, S. Rostrum of a toothed whale: Ultrastructural study of a very dense bone. Bone 1998, 23, 241–247. [Google Scholar] [CrossRef]
  8. Fujisaki, K.; Todoh, M.; Niida, A.; Shibuya, R.; Kitami, S.; Tadano, S. Orientation and deformation of mineral crystals in tooth surfaces. J. Mech. Behav. Biomed. Mater. 2012, 10, 176–182. [Google Scholar] [CrossRef] [PubMed]
  9. Chen, W.; Tian, B.; Lei, Y.; Ke, Q.F.; Zhu, Z.A.; Guo, Y.P. Hydroxyapatite coatings with oriented nanoplate and nanorod arrays: Fabrication, morphology, cytocompatibility and osteogenic differentiation. Mater. Sci. Eng. C Mater. Biol. Appl. 2016, 67, 395–408. [Google Scholar] [CrossRef]
  10. Aizawa, M.; Porter, A.E.; Best, S.M.; Bonfield, W. Ultrastructural observation of single-crystal apatite fibers. Biomaterials 2005, 26, 3427–3433. [Google Scholar] [CrossRef] [PubMed]
  11. Aizawa, M.; Ueno, H.; Itatani, K.; Okada, I. Syntheses of calcium-deficient apatite fibers by a homogeneous precipitation method and their characterizations. J. Eur. Ceram. Soc. 2006, 26, 501–507. [Google Scholar] [CrossRef]
  12. Zhuang, Z.; Fujimi, T.J.; Nakamura, M.; Konishi, T.; Yoshimura, H.; Aizawa, M. Development of a,b-plane-oriented hydroxyapatite ceramics as models for living bones and their cell adhesion behavior. Acta Biomater. 2013, 9, 6732–6740. [Google Scholar] [CrossRef] [PubMed]
  13. Aizawa, M. Development of bioceramics with life functions by harnessing crystallographic anisotropy and their biological evaluations. J. Ceram. Soc. Jpn. 2020, 128, 997–1004. [Google Scholar] [CrossRef]
  14. Kim, J. Systematic approach to characterize the dynamics of protein adsorption on the surface of biomaterials using proteomics. Colloids Surf. B Biointerfaces 2020, 188, 110756. [Google Scholar] [CrossRef]
  15. Kawasaki, T.; Nikura, M.; Kobayashi, Y. Fundamental study of hydroxyapatite high-performance liquid chromatograph. J. Chromatogr. A 1990, 515, 91–123. [Google Scholar] [CrossRef]
  16. Kawasaki, T. Hydroxyapatite as a liquid chromatographic packing. J. Chromatogr. A 1991, 544, 147–184. [Google Scholar] [CrossRef]
  17. Kandori, K.; Oda, S.; Fukusumi, M.; Morisada, Y. Synthesis of positively charged calcium hydroxyapatite nano-crystals and their adsorption behavior of proteins. Colloids Surf. B Biointerfaces 2009, 73, 140–145. [Google Scholar] [CrossRef]
  18. Kandori, K.; Hamazaki, H.; Matsuzawa, M.; Togashi, S. Selective adsorption of acidic protein of bovine serum albumin onto sheet-like calcium hydroxyapatite particles produced by microreactor. Adv. Powder Technol. 2014, 25, 354–359. [Google Scholar] [CrossRef]
  19. Zhuang, Z.; Yoshimura, H.; Aizawa, M. Synthesis and ultrastructure of plate-like apatite single crystals as a model for tooth enamel. Mater. Sci. Eng. C Mater. Biol. Appl. 2013, 33, 2534–2540. [Google Scholar] [CrossRef] [PubMed]
  20. Zhuang, Z.; Aizawa, M. Protein adsorption on single-crystal hydroxyapatite particles with preferred orientation to a(b)- and c-axes. J. Mater. Sci. Mater. Med. 2013, 24, 1211–1216. [Google Scholar] [CrossRef]
  21. Tunc, S.; Maitz, M.F.; Steiner, G.; Vazquez, L.; Pham, M.T.; Salzer, R. In situ conformational analysis of fibrinogen adsorbed on Si surfaces. Colloids Surf. B Biointerfaces 2005, 42, 219–225. [Google Scholar] [CrossRef] [PubMed]
  22. Awsiuk, K.; Budkowski, A.; Marzec, M.M.; Petrou, P.; Rysz, J.; Bernasik, A. Effects of polythiophene surface structure on adsorption and conformation of bovine serum albumin: A multivariate and multitechnique study. Langmuir 2014, 30, 13925–13933. [Google Scholar] [CrossRef] [PubMed]
  23. Awsiuk, K.; Stetsyshyn, Y.; Raczkowska, J.; Lishchynskyi, O.; Dąbczyński, P.; Kostruba, A.; Ohar, H.; Shymborska, H.; Nastyshyn, S.; Budkowski, A. Temperature-Controlled Orientation of Proteins on Temperature-Responsive Grafted Polymer Brushes: Poly(butyl methacrylate) vs Poly(butyl acrylate): Morphology, Wetting, and Protein Adsorption. Biomacromolecules 2019, 20, 2185–2197. [Google Scholar] [CrossRef]
  24. Shen, J.W.; Wu, T.; Wang, Q.; Pan, H.H. Molecular simulation of protein adsorption and desorption on hydroxyapatite surfaces. Biomaterials 2008, 29, 513–532. [Google Scholar] [CrossRef] [PubMed]
  25. Tsai, I.Y.; Tomczyk, N.; Eckmann, J.I.; Composto, R.J.; Eckmann, D.M. Human plasma protein adsorption onto dextranized surfaces: A two-dimensional electrophoresis and mass spectrometry study. Colloids Surf. B Biointerfaces 2011, 84, 241–252. [Google Scholar] [CrossRef] [PubMed]
  26. Lotgering, F.K. Topotactical reactions with ferrimagnetic oxides having hexagonal crystal structures—I. J. Inorg. Nucl. Chem. 1959, 9, 113–123. [Google Scholar] [CrossRef]
  27. O’Farrell, P.H. High resolution two-dimensional electrophoresis of proteins. J. Biol. Chem. 1975, 250, 4007–4021. [Google Scholar] [CrossRef]
  28. Kumar, G.S.; Girija, E.K.; Thamizhavel, A.; Yokogawa, Y.; Kalkura, S.N. Synthesis and characterization of bioactive hydroxyapatite-calcite nanocomposite for biomedical applications. J. Colloid Interface Sci. 2010, 349, 56–62. [Google Scholar] [CrossRef] [PubMed]
  29. Arai, T.; Norde, W. The behavior of some model proteins at solid-liquid interfaces 1. Adsorption from single protein solutions. Colloids Surf. 1990, 51, 1–15. [Google Scholar] [CrossRef]
  30. Jeyachandran, Y.L.; Mielczarski, E.; Rai, B.; Mielczarski, J.A. Quantitative and qualitative evaluation of adsorption/desorption of bovine serum albumin on hydrophilic and hydrophobic surfaces. Langmuir 2009, 25, 11614–11620. [Google Scholar] [CrossRef] [PubMed]
  31. Norde, W.; Giacomelli, C.E. Conformational changes in proteins at interfaces: From solution to the interface, and back. Macromol. Symp. 1999, 145, 125–136. [Google Scholar] [CrossRef]
  32. Norde, W.; Lyklema, J. Interfacial behaviour of proteins, with special reference to immunoglobulins. A physicochemical study. Adv. Colloid Interface Sci. 2012, 179–182, 5–13. [Google Scholar] [CrossRef] [PubMed]
  33. Kim, J.; Somorjai, G.A. Molecular packing of lysozyme, fibrinogen, and bovine serum albumin on hydrophilic and hydrophobic surfaces studied by infrared-visible sum frequency generation and fluorescence microscopy. J. Am. Chem. Soc. 2013, 125, 3150–3158. [Google Scholar] [CrossRef]
  34. Gong, Y.; Slee, R.B.; Fukai, N.; Rawadi, G.; Roman-Roman, S.; Reginato, A.M.; Wang, H.; Cundy, T.; Glorieux, F.H.; Lev, D. LDL Receptor-related protein 5 (LRP5) affects bone accrual and eye development. Cell 2001, 107, 513–523. [Google Scholar] [CrossRef]
  35. Hay, E.; Faucheu, C.; Suc-Royer, I.; Touitou, R.; Stiot, V.; Vayssiere, B.; Baron, R.; Roman-Roman, S.; Rawadi, G. Interaction between LRP5 and Frat1 mediates the activation of the Wnt canonical pathway. J. Biol. Chem. 2005, 280, 13616–13623. [Google Scholar] [CrossRef] [PubMed]
  36. Cadigan, K.M.; Nusse, R. Wnt signaling: A common theme in animal development. Genes Dev. 1997, 11, 3286–3305. [Google Scholar] [CrossRef] [PubMed]
  37. Wodarz, A.; Nusse, R. Mechanisms of WNT signaling in development. Annu. Rev. Cell Dev. Biol. 1998, 14, 59–88. [Google Scholar] [CrossRef]
  38. Chung, Y.S.; Baylink, D.J.; Srivastava, A.K.; Amaar, Y.; Tapia, B.; Kasukawa, Y.; Mohan, S. Effects of secreted frizzled-related protein 3 on osteoblasts in vitro. J. Bone Miner. Res. 2004, 19, 1395–1402. [Google Scholar] [CrossRef]
Figure 1. Characterization of AF, AG30%AF, and HAp-100. (ac) XRD pattern of AFs, AG30%AFs, and HAp-100s; (d) FT-IR spectra; (eg) morphology of AFs, AG30%AFs, and HAp-100s; (h) Ca/P molar ratio and zeta potential. The vertical axes in (ac) are shown as arbitrary units (a.u.).
Crystals 13 01318 g001
Figure 2. Characterization of aHAp and iHAp. (a) XRD patterns; (b) FT-IR spectra; (c,d) microstructure of aHAp and iHAp surfaces; (e) typical material properties. The vertical axis in (a) is shown as an arbitrary unit (a.u.).
Crystals 13 01318 g002
Figure 3. Amounts of saturated adsorption on aHAp and iHAp ceramics for the model proteins: (a) BSA and (b) LSZ. (c) Surface zeta potential of the aHAp and iHAp ceramics following BSA and LSZ adsorption.
Crystals 13 01318 g003
Figure 4. AFM images of freeze-dry ceramic surfaces: (a,b) nontreated HAp ceramic surfaces; (c,d) surfaces with BSA adsorbed on HAp ceramics (➙: BSA molecular aggregates); (e,f) surfaces with LSZ adsorbed on HAp ceramics (➙: LSZ molecular aggregates). The scanning sizes are 500 × 500 nm. (g) Quantitative analysis of the gain (➙) height.
Crystals 13 01318 g004
Figure 5. (a) Amounts of saturated adsorption of serum proteins on aHAp and iHAp ceramics. (b) Representative 2D-PAGE gels of serum proteins adsorbed for 24 h on (c) aHAp and (d) iHAp. The left lane shows the standard proteins with their corresponding molecular weights. The serial numbers represent the protein spots for which the mass analysis was performed.
Crystals 13 01318 g005
Figure 6. Representative MALDI-TOF/MS spectra of corresponding protein spots identified on typical 2D-PAGE gels in Figure 5. (a) P02769 from Figure 5c①, (b) P02769 from Figure 5d①.
Crystals 13 01318 g006
Disclaimer/Publisher’s Note: The statements, opinions and data contained in all publications are solely those of the individual author(s) and contributor(s) and not of MDPI and/or the editor(s). MDPI and/or the editor(s) disclaim responsibility for any injury to people or property resulting from any ideas, methods, instructions or products referred to in the content.

