Article

Controlling Crystal Growth of a Rare Earth Element Scandium Salt in Antisolvent Crystallization

Fluid Process Engineering (AVT.FVT), RWTH Aachen University, Forckenbeckstraße 51, 52074 Aachen, Germany
*
Author to whom correspondence should be addressed.
Crystals 2024, 14(1), 94; https://doi.org/10.3390/cryst14010094
Submission received: 25 November 2023 / Revised: 2 January 2024 / Accepted: 11 January 2024 / Published: 19 January 2024
(This article belongs to the Special Issue Crystallization Process and Simulation Calculation, Second Edition)

Abstract

:
Recovering scandium from hydrometallurgical residue bears the potential of a better supply of an industry depending on imports from countries with more mineral resources than Europe. To recover scandium from unused metal production residue, strip liquors from a solvent extraction process are treated with an antisolvent to crystallize the ammonium scandium fluoride salt (NH4)3ScF6 with high product yields. However, high local supersaturation leads to strong nucleation, resulting in small crystals, which are difficult to handle in the subsequent solid-liquid separation. Reducing local supersaturation makes it possible to reduce nucleation and control crystal growth. Key operation parameters are the concentration of ethanol in the feed and its addition rate. The concentration of the antisolvent in the feed causes a shorter mixing time in the proximity of the antisolvent inlet, which leads to a smaller local supersaturation and therefore less nucleation and more crystal growth. Lowering the antisolvent addition rate enhances this effect. The crystal size distribution during and at the end of the fed-batch process is analyzed by SEM imagery of sampled and dried crystals. To produce reproducible crystal size distribution from SEM images the neural network Mask R-CNN has been trained for the automated crystal detection and size analysis.

1. Introduction

Antisolvent crystallization or precipitation is a commonly utilized process step in the production of metals. Recently, there has been a heightened research emphasis on rare earth elements (REE) and lithium-ion battery materials due to the increasing scarcity of the materials [1,2]. Scandium is a REE utilized as an additive in aluminum alloys to reduce the density and simultaneously increase the strength [3]. Another application of scandium is as an additive in zirconium solid electrolytes to increase its ionic conductivity, which allows solid oxide fuel cells (SOFC) to run at a lower temperature and increase their lifespan than with yttrium-stabilized zirconia [4]. Both the US and the EU declared scandium as a critical material in 2018 and 2020, respectively [5,6]. The low availability of scandium in Europe pushes the search to find alternative production routes from available sources. Those are, for example, hydrometallurgical waste residues from aluminum or titanium production. After leaching with sulfuric acid [7] and solvent extraction, an enriched scandium solution with ammonium fluoride is produced [8,9,10,11,12]. The scandium salt (NH4)3ScF6 is crystallized via antisolvent crystallization under ambient conditions and sufficient amounts of ammonium fluoride [13]. Several antisolvents like ethanol, methanol, isopropanol, or acetone have been tested [13,14]. Concerning performance, miscibility, recyclability, and toxicity, the authors suggest ethanol as the most suitable antisolvent for the crystallization of scandium [13]. Although the crystallization process using antisolvent instead of cooling offers more crystal yield, it presents a challenge in controlling the crystal growth. The previously described scandium salt tends to rapidly nucleate at the inlet of the antisolvent into a scandium-enriched solution. This nucleation-dominant process produces small but narrowly distributed crystals [15]. Reducing nucleation and controlling crystal growth would improve filtration and solid handling, which would be a step towards an industrially feasible process.

1.1. Controlling Crystal Size Distribution in Antisolvent Crystallization

Characterization of crystallization kinetics and reducing nucleation are common goals in antisolvent crystallization. Many authors attempted controlling the crystal growth in antisolvent crystallization processes [16,17,18,19,20]. The primary challenge is often to distribute the generation of supersaturation over time and space. Nowee et al. [17] optimized the antisolvent addition rate in a model system of ethanol-water-NaCl using a mechanistic population balance-based model. Distributing the generation of supersaturation by slowing down the antisolvent addition rate when there is a small crystal surface can lead to more crystal growth and less nucleation.
Nucleation can be avoided or reduced by adding seed crystals, which has been shown as an effective strategy for paracetamol in isopropyl alcohol and water as the antisolvent [16].
The nucleation kinetics not only vary with the choice of solute, solvent, and antisolvent but also with mixing [19]. Therefore, distributing the antisolvent addition spacially can be a useful strategy, which has been utilized in continuous antisolvent crystallization with multi-segment plug-flow apparatus [21,22]. The intention is to use a tubular plug-flow crystallizer that is known to produce a narrow and defined crystal size distribution (CSD). However, for better control of the supersaturation, the antisolvent is not added at the beginning together with the solvent and solute but sequentially in multiple segments. For some antisolvent crystallization systems, the improvement of mixing on the microscale is of importance.
The focus of the process enhancement is either a narrower CSD or more crystal growth and larger crystals overall. To generate a narrow CSD from improved micromixing Lee et al. [23] tested different ultrasound frequencies during antisolvent crystallization of NaCl from water with ethanol. The segregation index quantifying micromixing can be improved by the ultrasound, however, the overall influence on the CSD is minimal. This indicates that micro-mixing can be enhanced by certain methods but the kinetics of the crystallization system need to be sufficiently fast to take advantage of enhanced mixing. This is not the case with NaCl.
To improve the control over the CSD by enhanced micromixing several authors experimented with membrane-assisted antisolvent crystallization (MAAC) [24,25,26]. Instead of injecting antisolvent droplets with a limited interfacial surface, the intention is to enlarge this surface by pushing the antisolvent through a membrane and using it as a contactor. Zarkadas et al. tested porous hollow fiber membranes with varying flow rates. Crystallization inside the tube led to pore blocking by the crystals but on the shell side crystallization was possible for a prolonged time [26]. The overall crystal size can be reduced compared to an equivalent fed-batch process with isopropanol-water-L-asparagine [26] or increased with ethanol-water-erythritol [25].
The influence of meso-mixing usually refers to a fed-batch setup and the mixing time in the proximity of the antisolvent inlet. It describes the mixing time at a scale between micro- and macro-mixing and has been investigated first in the context of chemical reactions in fed-batch reactors [27]. Later it was studied in the context of antisolvent crystallization [20]. Meso-mixing times are effectively reduced when the antisolvent inlet is positioned close to the stirrer with much dispersion and the addition rate is reduced, which further reduces nucleation and enhances crystal growth.
An approach to improve micro- and meso-mixing in antisolvent crystallization is to dilute the antisolvent before injection. In this case, the antisolvent is already pre-mixed when it is introduced to the solvent-solute solution, reducing local supersaturation and therefore nucleation. Nowee et al. [17] reported, that the dilution of the antisolvent in the feed can have a similar effect as the reduction of the solute concentration in the solvent on the CSD. Demirel et al. [28] state that in an aqueous nickel sulfate solution with acetone and isopropanol as an antisolvent, the influence of the dilution of the antisolvent on the CSD is comparable to the reduction of the addition rate of an undiluted antisolvent. In the ethanol-water-scandium ammonium fluoride system, Peters et al. [29] discovered a much stronger influence from a diluted antisolvent on the CSD. In a previous publication, we measured the metastable zone width (MSZW) of the same system and discovered the widening of the MSZW when the antisolvent is injected diluted [15].
The influence that the dilution of the antisolvent has on nucleation, crystal growth, and CSD for a fast-nucleating metal salt has rarely been quantified in the literature. This work aims to quantify the influence of the dilution and addition rate of the antisolvent on the crystal growth to control crystal growth for improved filtration.

1.2. Crystal Size Measurement

CSDs can be obtained by various means. Sieving, FBRM, laser diffraction, or measuring crystal sizes from microscopic or endoscopic images are the most common methods. Optical methods allow differentiation between agglomerates and primary particles or dimensional ratios, which is essential when making assumptions on crystal growth. In-situ endoscopic measurement techniques are limited in detecting small suspended crystals in the single-digit micrometer scale or smaller. Sampled crystals that are dried and analyzed by ex-situ microscopic methods undergo a change between sampling and analyzing but offer more resolution and therefore more precise size measurement.
For small-sized particles, scanning electron microscopy (SEM) is a commonly used method. Measuring each crystal manually is tedious and may be inconsistent across the whole dataset of images. To automate the evaluation of the SEM images, a neural network can be utilized. Recently there has been a lot of progress in object detection via neural networks. They have been used for object classification and simultaneously creating pixel masks that align with the detected object [30]. Although they are designed to detect and classify all sorts of common objects they can be utilized to detect the same class of objects and quantify their sizes as it has been done with droplets in liquid-liquid-extraction [31]. Sibirtsev et al. used Mask R-CNN (MRCNN), a region-based convolutional neural network. They modified the standard MRCNN implementation and developed a methodology to train the neural network to reliably detect droplets in images of varying quality.

2. Materials and Methods

2.1. Preparation of the Solution

For the preparation of 1 L of solution with 3 mol L−1 ammonium fluoride and saturated scandium, 111 g of crystalline ammonium fluoride (EMSURE, purity ≥ 98%, Merck KGaA, Darmstadt, Germany) and at least 12.5 g of (NH4)3ScF6 crystals are dissolved in distilled water. The solution is stirred for at least 12 h at 25 °C. After saturation of the scandium salt, the solution is centrifuged with 2700 rpm for 8 min (Rotona 460R, Andreas Hettich GmbH & Co. KG, Tuttlingen, Germany) and filtrated to create a particle-free solution.
The antisolvent used in all experiments is ethanol (EMSURE, purity ≥ 99.9%, Merck KGaA, Darmstadt, Germany). In experiments, where a diluted antisolvent is used, ethanol is mixed with a 3 mol L−1 NH4F aqueous solution.

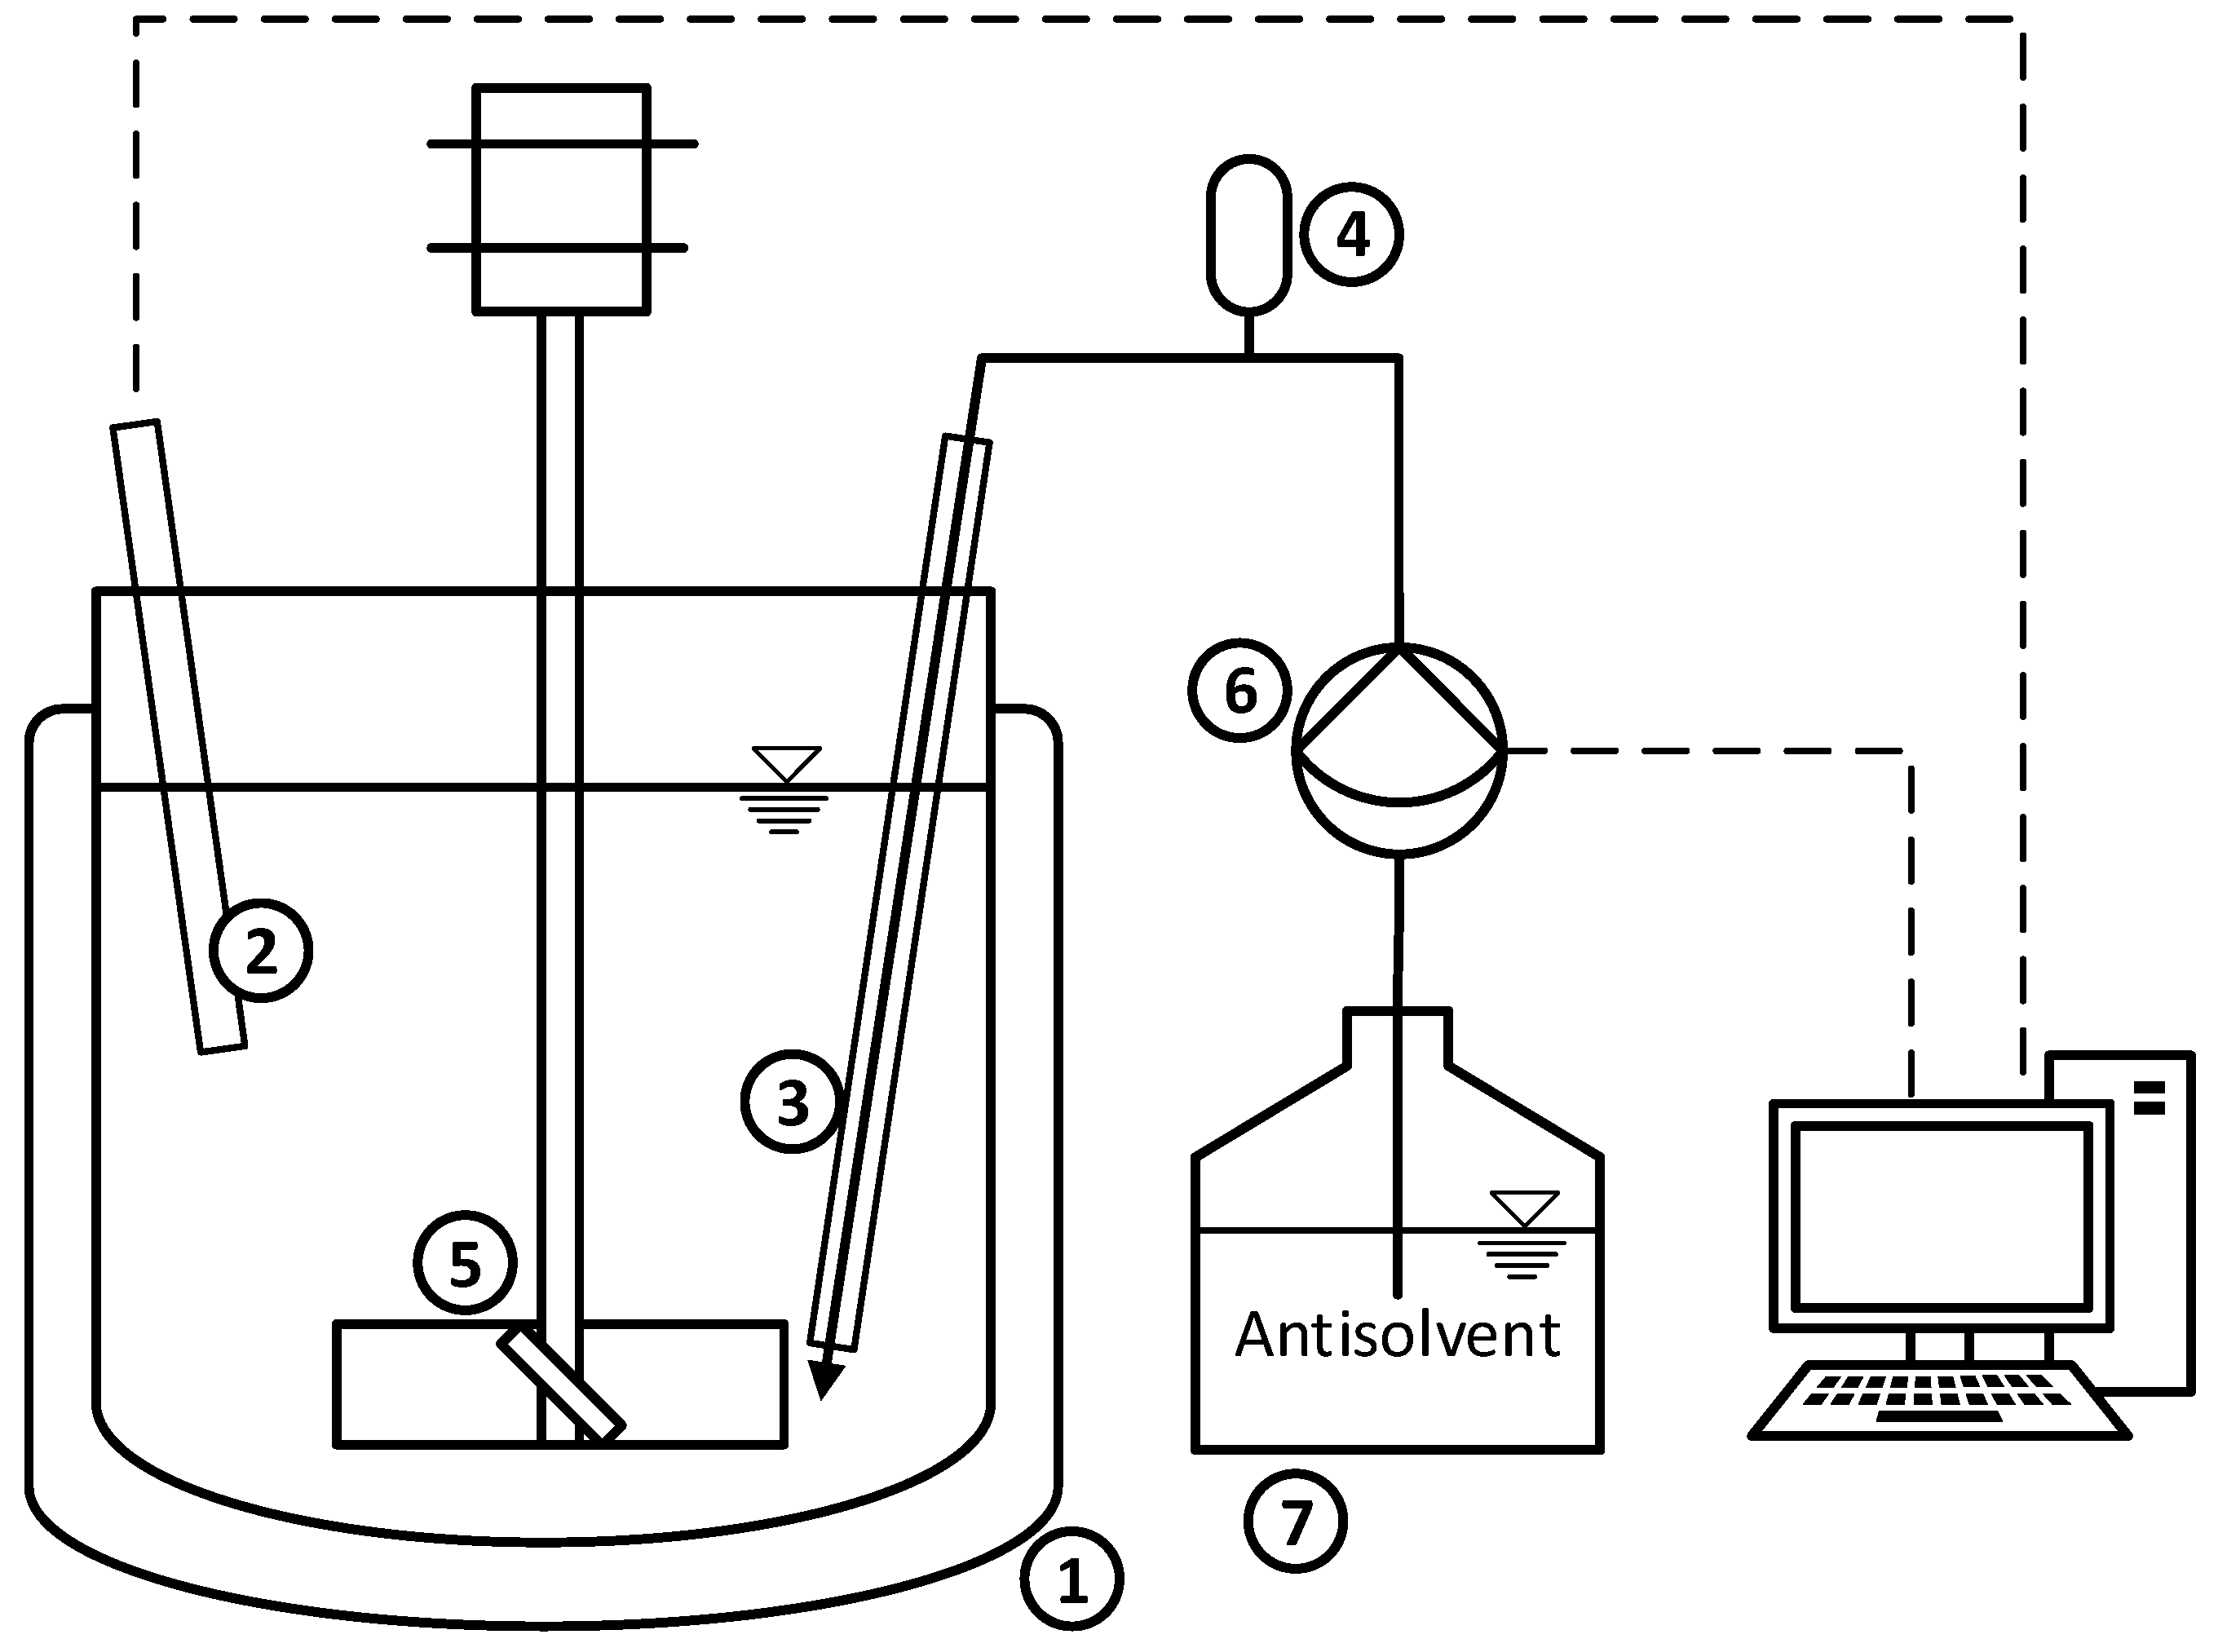
2.2. Setup and Sampling

The setup in this work is displayed in Figure 1. For the determination of crystal growth, it is important to analyze the crystal size from primary particles and not from agglomerates, which can be accomplished by an optical analyzing method. Instead of using an endoscope probe for crystal size measurement, the solution is sampled for the analysis of the solid and the liquid phases during experiments. This procedure has been chosen because the crystals are too small to detect reliably with in-situ methods. Samples are taken from the crystallizer with a syringe equipped with a syringe filter (CHROMAFIL Xtra, PES, 0.2 μm, Macherey-Nagel GmbH & Co. KG, Düren, Germany) and a rubber tube. For each sample, a new set of syringes, filters, and tubes is used. The syringe is pre-filled with 1 mL of distilled water. When the supersaturated mother solution (1 mL) is pulled through the filter into the syringe without any solid particles, it is instantly diluted so no further crystallization can take place inside the syringe. To achieve an accurate dilution, the syringe is weighed empty, with distilled water, and with the sample, so the dilution can be calculated gravimetrically. The diluted sample is then analyzed via the ICP-OES method for the concentration of scandium (Perkin Elmer Optima 8000).
To determine the crystal size distribution during the experiment, solid samples are taken. To not significantly alter the bulk solids MacTaggart et al. [32] used a sample volume consisting of 1.5 vol% to 2 vol% of the bulk volume which translates to a sample volume of 5 mL in the 300 mL liquid starting volume. The suspension sample is taken by a syringe, filtered by vacuum filtration (Cytiva Whatman Nl 16, pore size: 0.2 μm), and dried at ambient temperature. The dried crystals are glued to a sample holder and analyzed by SEM imagery (Hitachi Tabletop TM3030Plus, Krefeld, Germany).
At the beginning of each experiment, it is ensured that the antisolvent addition nozzle is filled with the prepared antisolvent. 300 mL of the prepared scandium solution is filled into the crystallizer and stirred until the temperature of 25 °C is reached. The experiment starts with the addition of the antisolvent and is terminated when a concentration of 6 mol L−1 of ethanol is reached.
In a previous publication [15], it has been established that the antisolvent dilution and addition rate are the most influential operation parameters on the MSZW. It was shown that the influence of a diluted antisolvent on crystal growth and size distribution is large. The stirring speed and resulting Reynolds number did not have a significant influence on the MSZW above a Reynolds number of 4500, which corresponds to a stirring speed of 200 rpm in this setup. Experiments in this current work with 100 vol% of ethanol have therefore been performed with this stirring speed. For experiments with diluted antisolvents and therefore larger crystals, the stirring speed has been adjusted to a Reynolds number of 9000, which corresponds to a stirring speed of 400 rpm to ensure that no sedimentation occurs.

2.3. Seeding Method

Injecting the solution with seed crystals of the desired product crystal when the solution is saturated or slightly supersaturated is a common tool to increase growth and minimize primary nucleation. In the crystallization system at hand, the addition of a defined number of seeds with a specified CSD presents itself as challenging. Dried crystals, produced from fast antisolvent addition agglomerate strongly during the drying process. Therefore, a suspension is created from a saturated scandium solution by the addition of ethanol at a fast rate of 15 mL min−1 with crystal sizes ranging from 0.5 μm to 2.5 μm. The CSD and a representative SEM image of the seed crystals can be found in Appendix A Figure A1. The suspension is added to the saturated scandium solution at the beginning of the experiment in the crystallizer. The mass of crystals in the seed suspension matches 10% of the expected final amount of crystal mass after the experiment. This results in a suspension of 45 mL containing 0.35 g of crystal mass.

2.4. Theory

The overall crystal growth rate can be described as
G = d L d t .
Whereas G is the crystal growth rate in m s−1, L is the characteristic length of the crystal, which is usually the diameter and t is the time [33]. For the approximation of the crystal growth rate, the mean diameter of the crystal size distribution is used as the characteristic length. For the estimation of the crystal growth rate in dependence on the supersaturation, many authors use the power law approach
G = k g Δ C g .
k g is the growth coefficient and g the growth rate order [16,18,33,34]. The crystal growth rate is dependent on the supersaturation Δ C . The term for the supersaturation can be chosen to be absolute or relative [34]. In this work, the growth rate is approximated to the form
G = k g S g .
The relative supersaturation is calculated as
S = c S a l t c S a l t * .
To evaluate the crystallization process the specific production rate is calculated as the space-time yield (STY) in kg m−3 min−1 as
S T Y = m s o l i d , S a l t , E n d V S L , E n d · t E n d .
The mass of crystallized scandium salt at the end of the experiment is calculated by the mass balance of the measured concentrations with
m s o l i d , S a l t , E n d = c a q , S a l t , S t a r t · V S L , S t a r t c a q , S a l t , E n d · V S L , E n d .

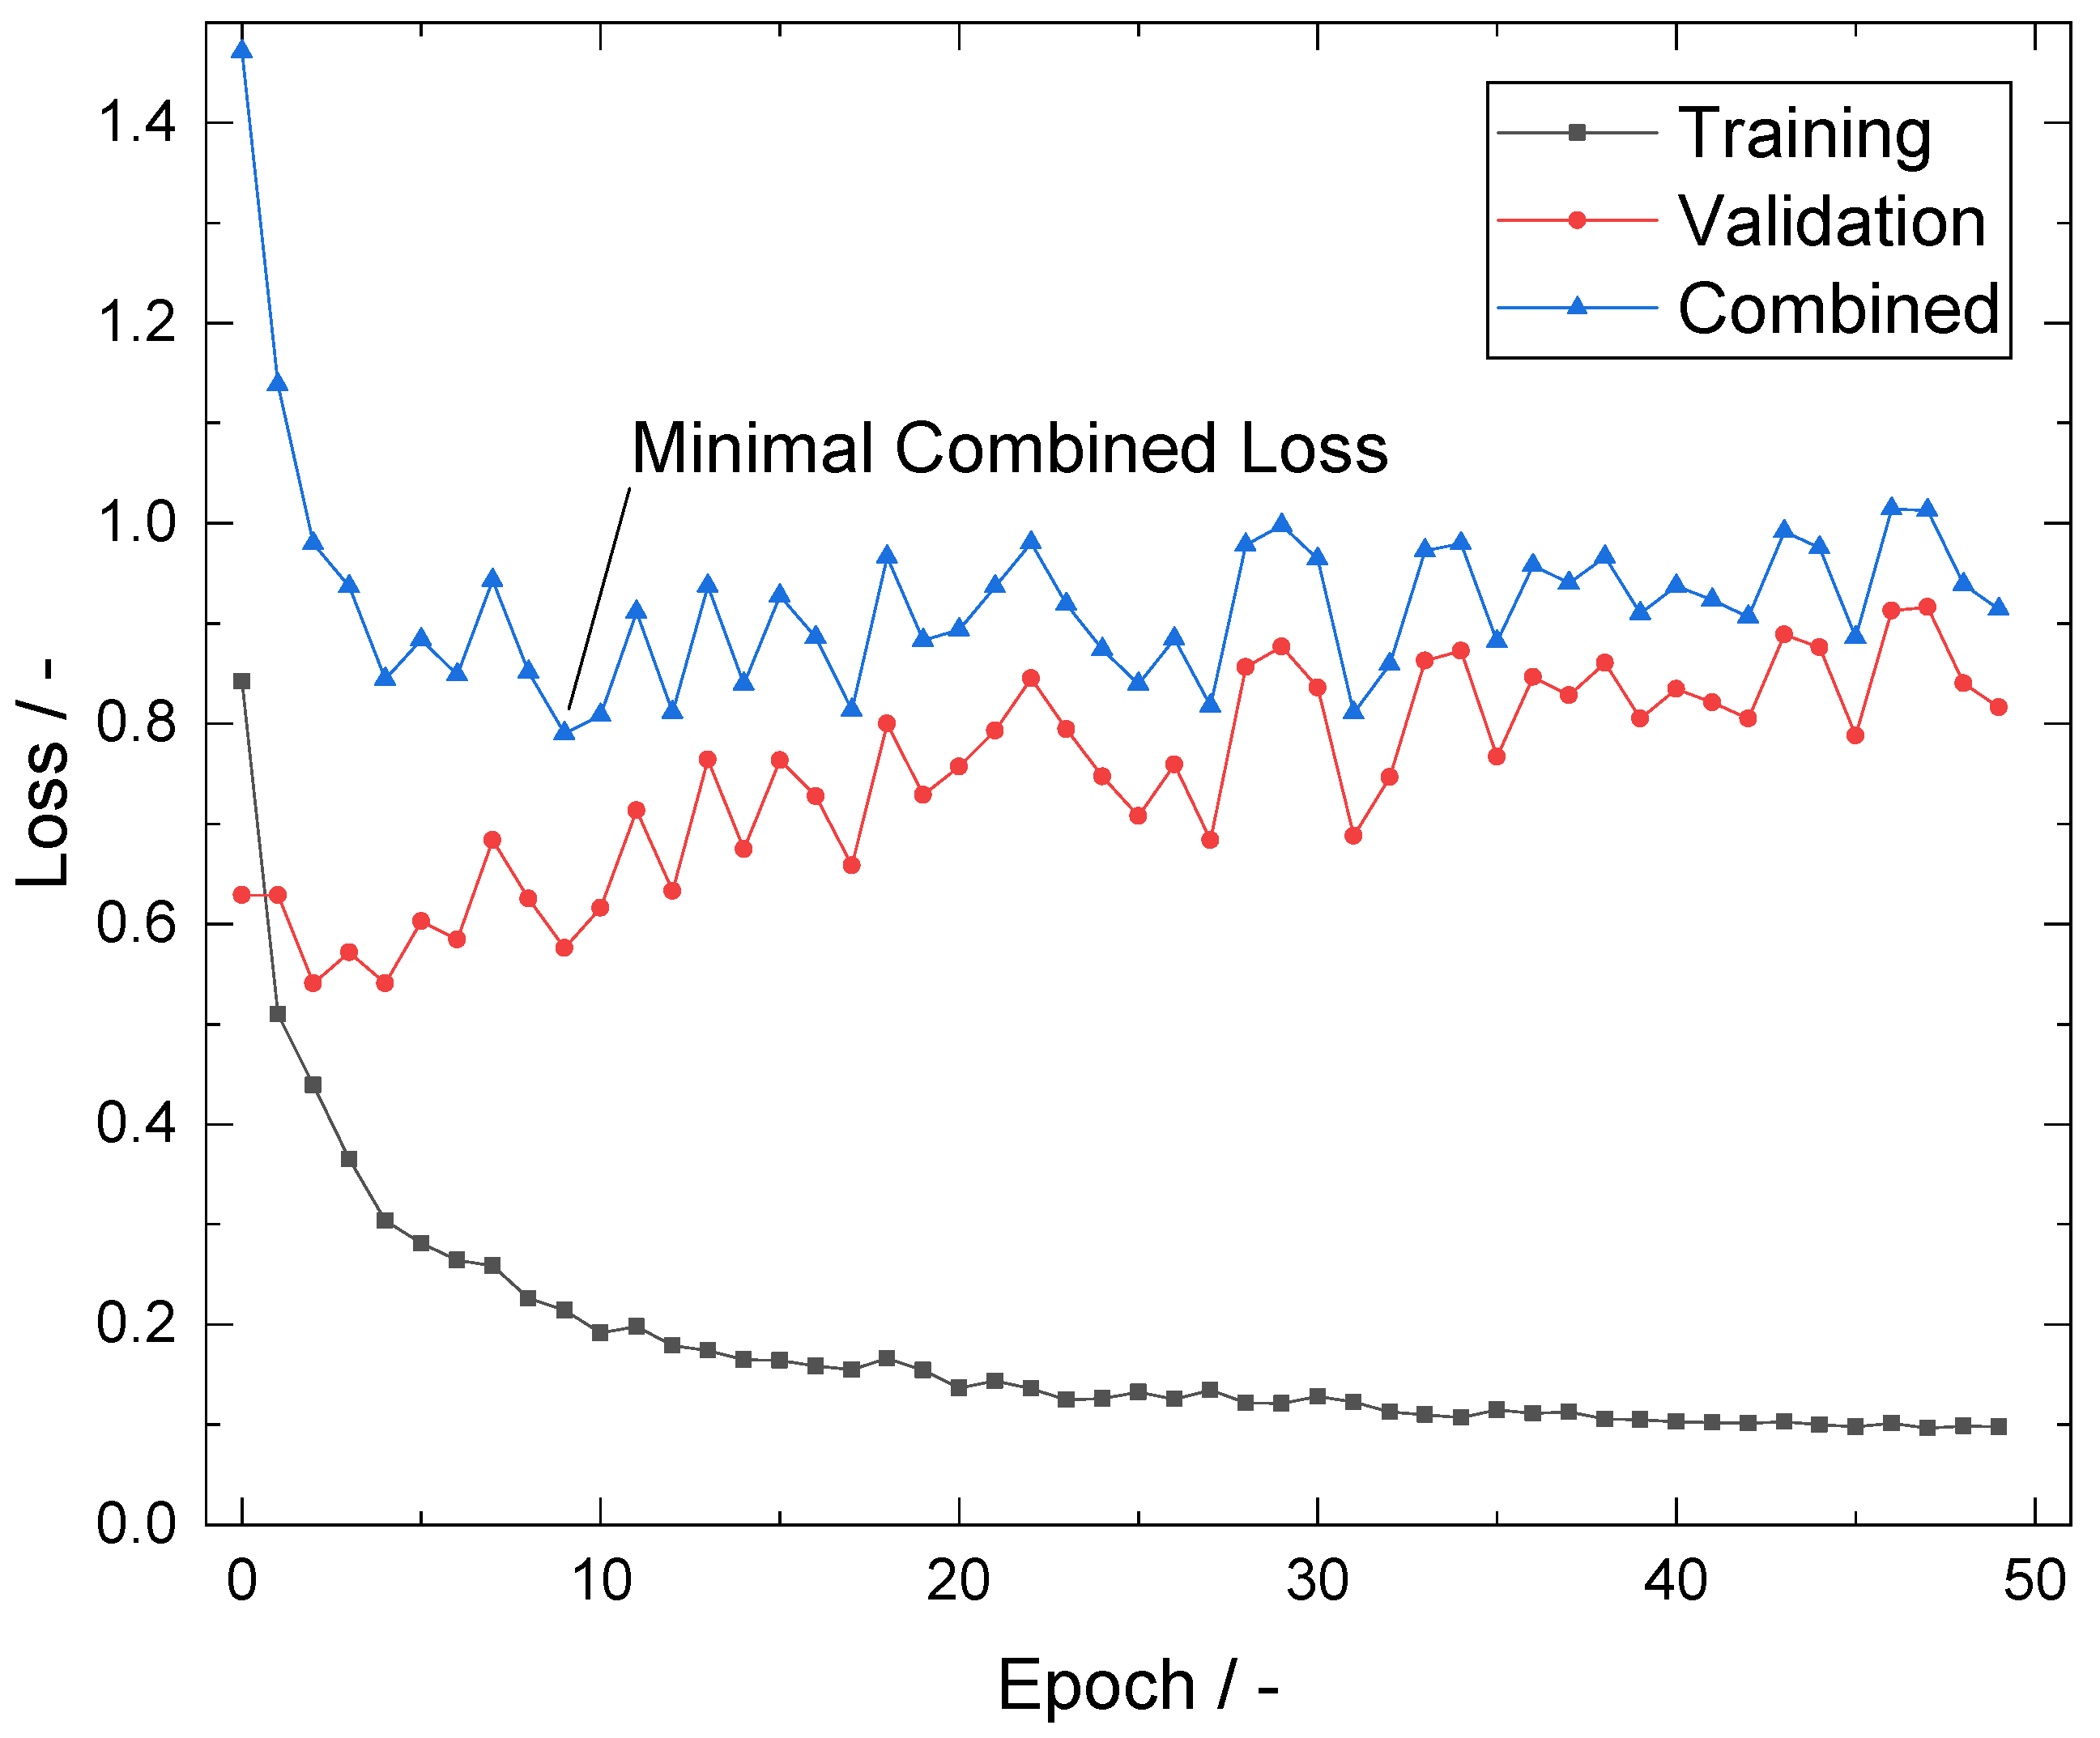
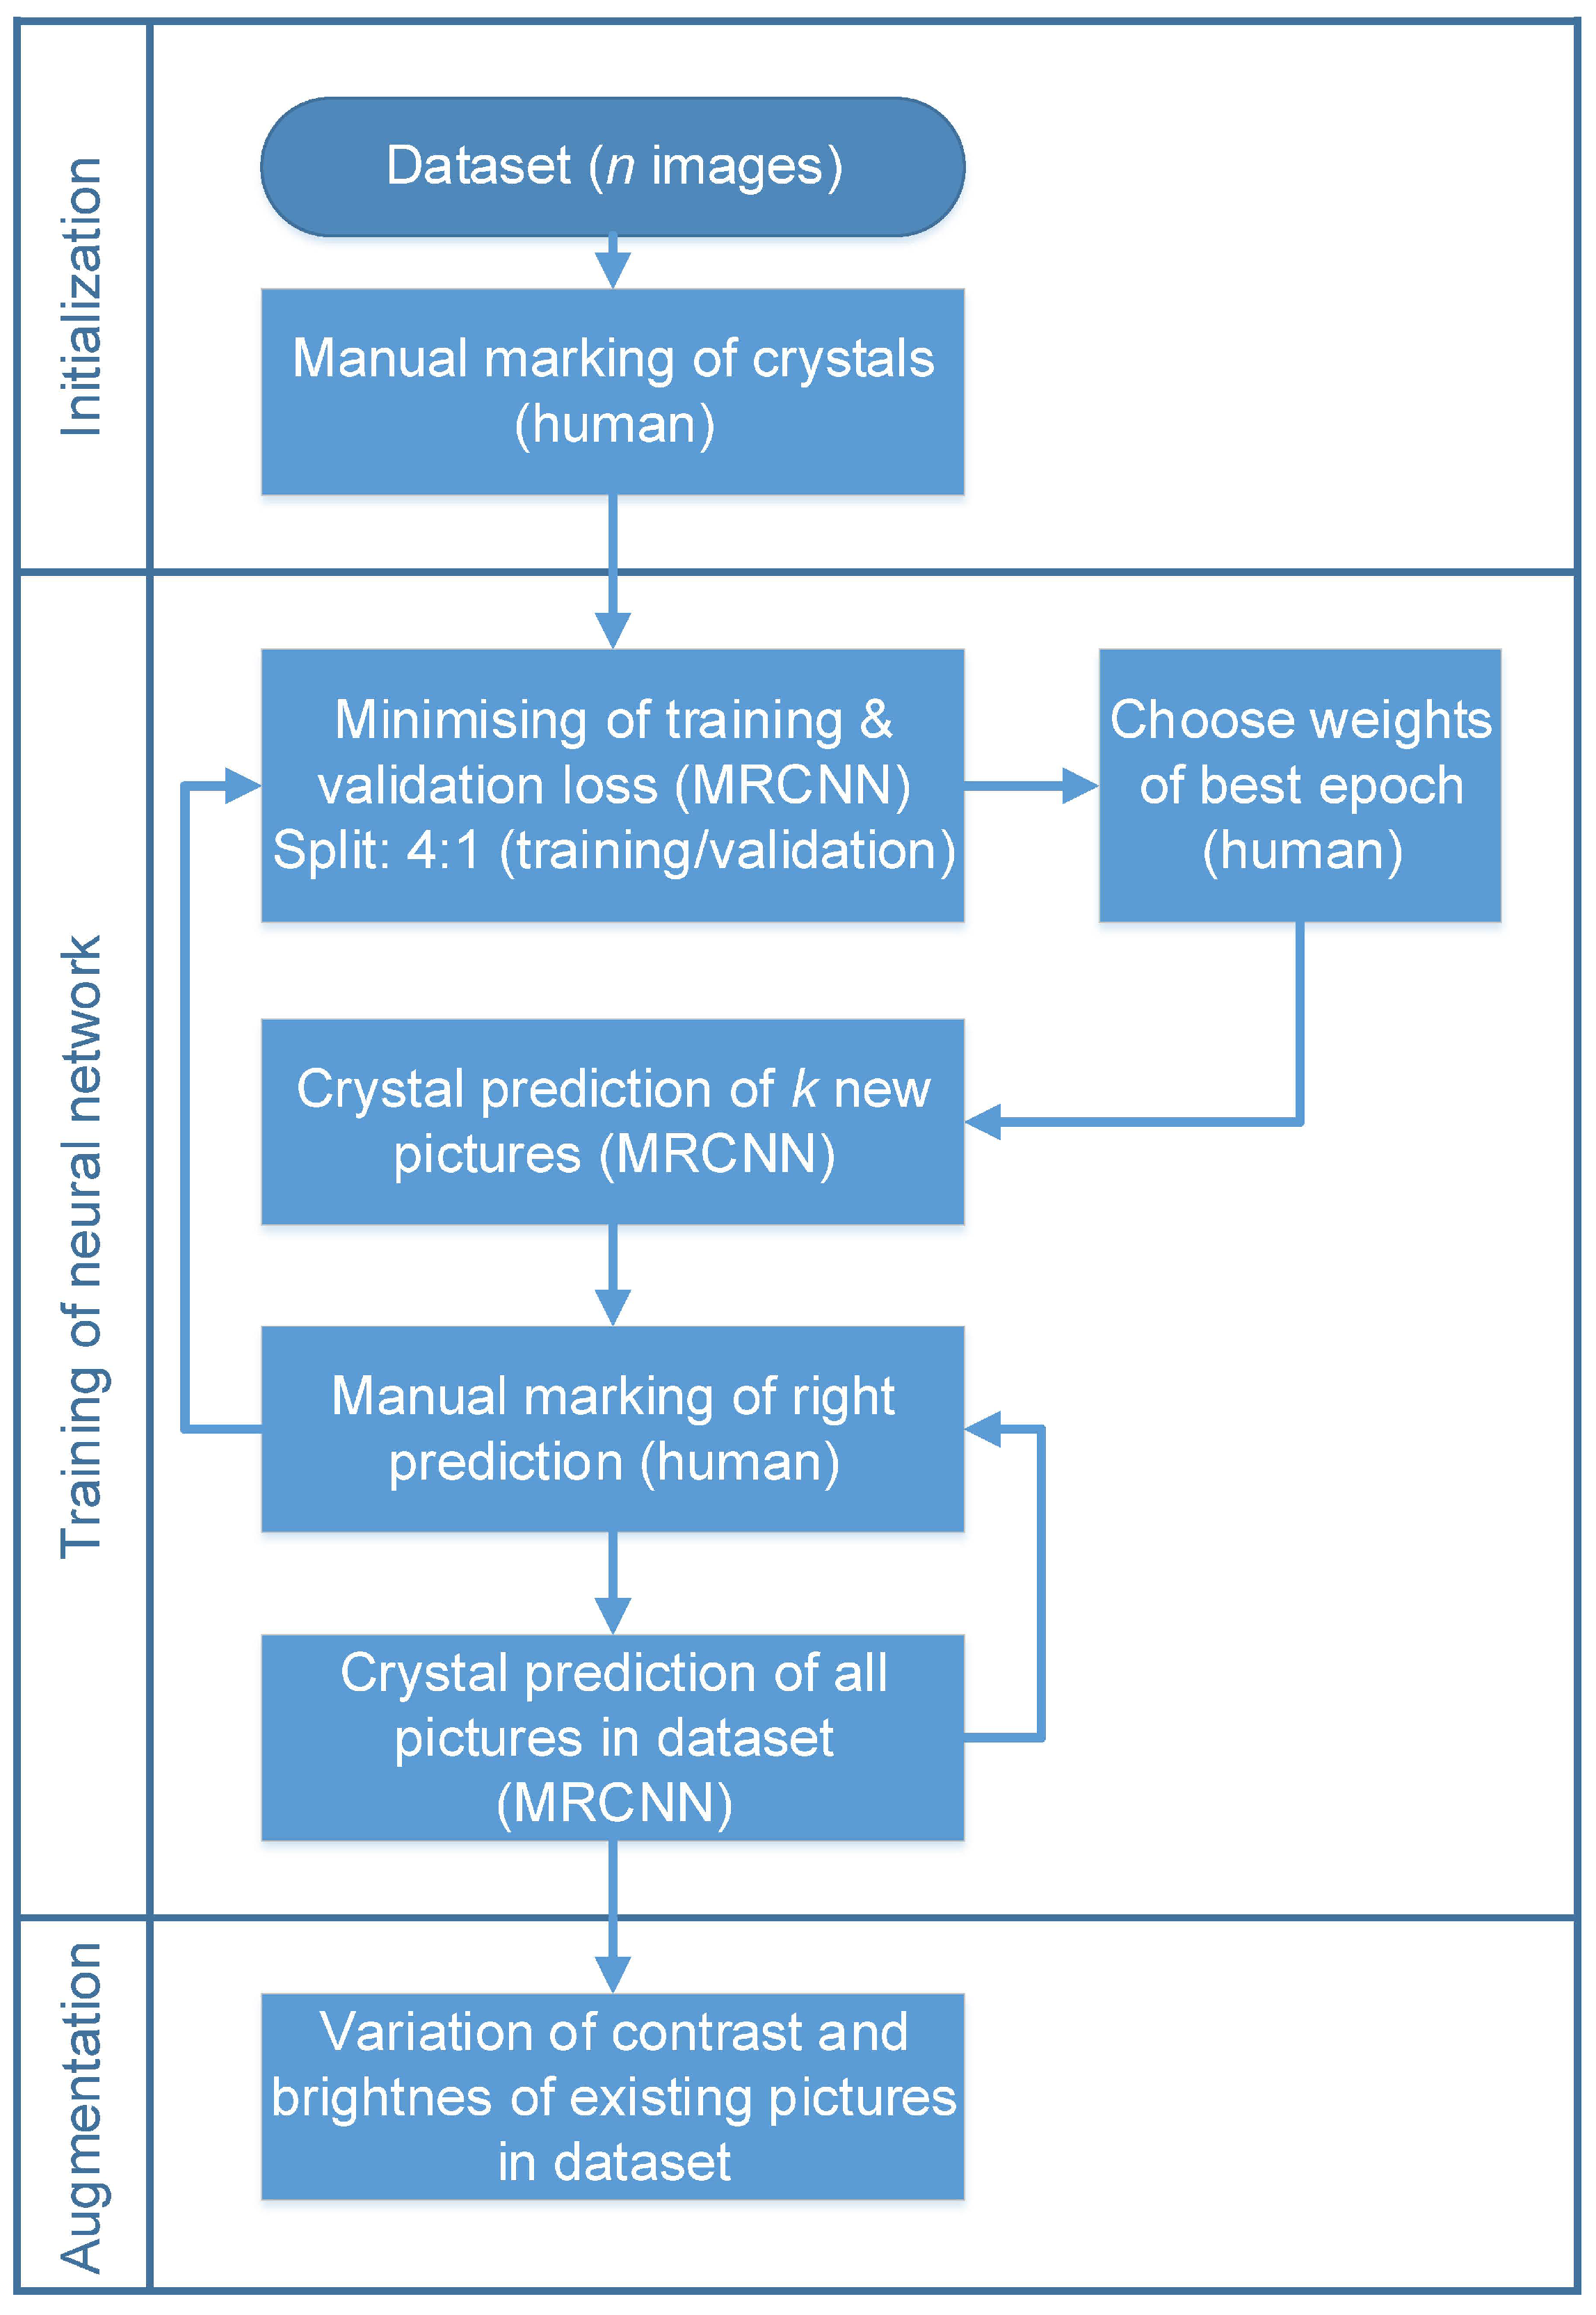
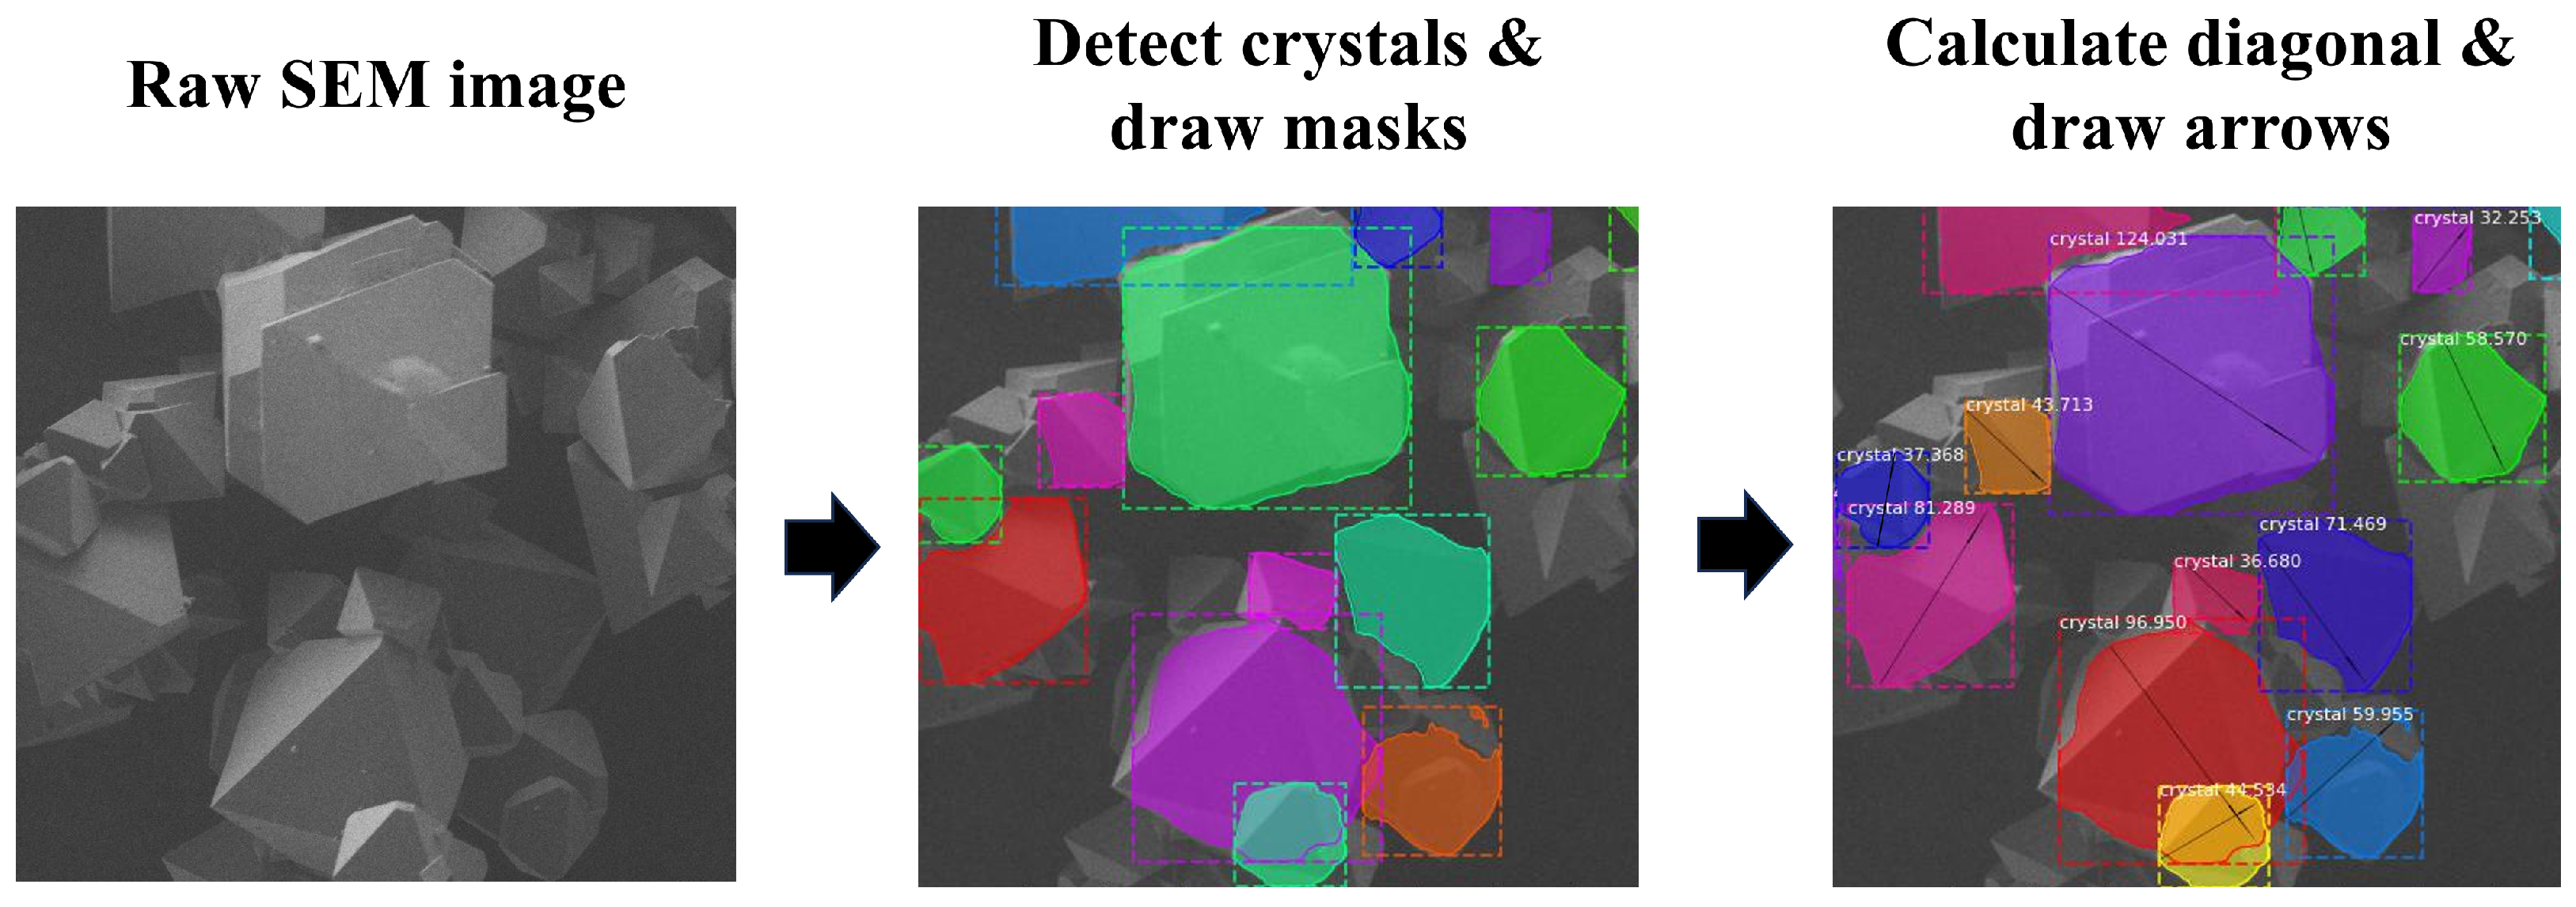
2.5. Automated Crystal Detection

For the CSD of the dried crystal samples, an automated object detection method using a neural network is utilized. The base for the neural network is the Mask R-CNN (MRCNN) network that has been pre-trained with the coco-dataset [30]. To train the neural network for the detection of crystals on SEM images the object class “crystal” is implemented. Since there are many crystals on each SEM image, much data per image is available for training. For this reason, the batch size is set to one, meaning that the training is done with one image at a time. Next, the workflow has been established to train the neural network with the help of transfer learning as shown in Figure 2. The first set of pictures is used to mark the crystals with polygons with the help of VGG Image Annotator (Visual Geometry Group, Oxford University, Oxford, UK). The dataset is then split 4:1 into a training and a validation dataset. The training algorithm of MRCNN minimizes the training loss. After several iterations called epochs, the training is terminated. At the end of each epoch, the trained weights of the neural network are tested on the validation dataset. By evaluating the loss function over the epochs, the weights with minimal loss on the training and validation dataset get selected. The selection aims to achieve a good compromise between reliable and accurate crystal detection and overfitting, where the neural network memorizes the training pictures but fails to transfer the knowledge to other pictures. The more epochs are used, the more the training loss decreases. However, the validation loss increases at a certain point because of the overfitting. Further details of the loss during the training can be found in Appendix B Figure A2. After one training iteration, the dataset is extended with several new pictures but before marking the pictures by hand, the neural network makes its predictions first. Then, the predicted masks are confirmed, corrected, or denied by hand. In addition, crystals that are not detected but should be, are added. This way, the learning process is closely monitored and can be adjusted after each iteration. After that, the training algorithm is started again with the extended dataset. After the dataset is expanded several times, the prediction accuracy is increased again by revising the entire dataset. For this, the dataset is again predicted by the best weights and corrected manually. All steps of the workflow are repeated until there is no significant improvement in predictive accuracy. In the end, an augmentation step is done where pictures in the existing dataset are changed in contrast and brightness. For this step, no additional markings of crystals need to be done. However, the trained neural network becomes more flexible at detecting crystals in pictures with various qualities. For the neural network to achieve the best prediction accuracy, it is important to use images with the same quality for the evaluation of experiments as the quality of the images used for the learning process. If new images have a large deviation in contrast and brightness to the training images, there may be more incorrect predictions.
The detected masks are further evaluated by calculating the longest diagonal of the mask. Since no dimension of the crystal is noticeably longer than the others, the length ratio is neglected. To calculate the longest diagonal, the edge coordinates of a crystal are extracted first. The longest connection distance within these edge coordinates is then calculated. An example of the evaluation process is displayed in Figure 3. If there is an obvious false prediction of a crystal by the neural network, this false detection is removed from the evaluation of an experiment manually. The influence of an individual slightly incorrectly detected crystal is negligible when evaluating a sufficient number of SEM images. A comparison of a manually and automatically evaluated SEM image can be found in Appendix B Figure A3. In addition, progressive mean diameter and coefficient of variation (CV) values over the measured samples can be found in Appendix B Figure A4, Figure A5 and Figure A6 indicating a converged value after evaluating sufficient samples.

3. Results

The influence of the variation of the antisolvent addition rate and dilution on the CSD of scandium salt crystals is studied after and during antisolvent crystallization.

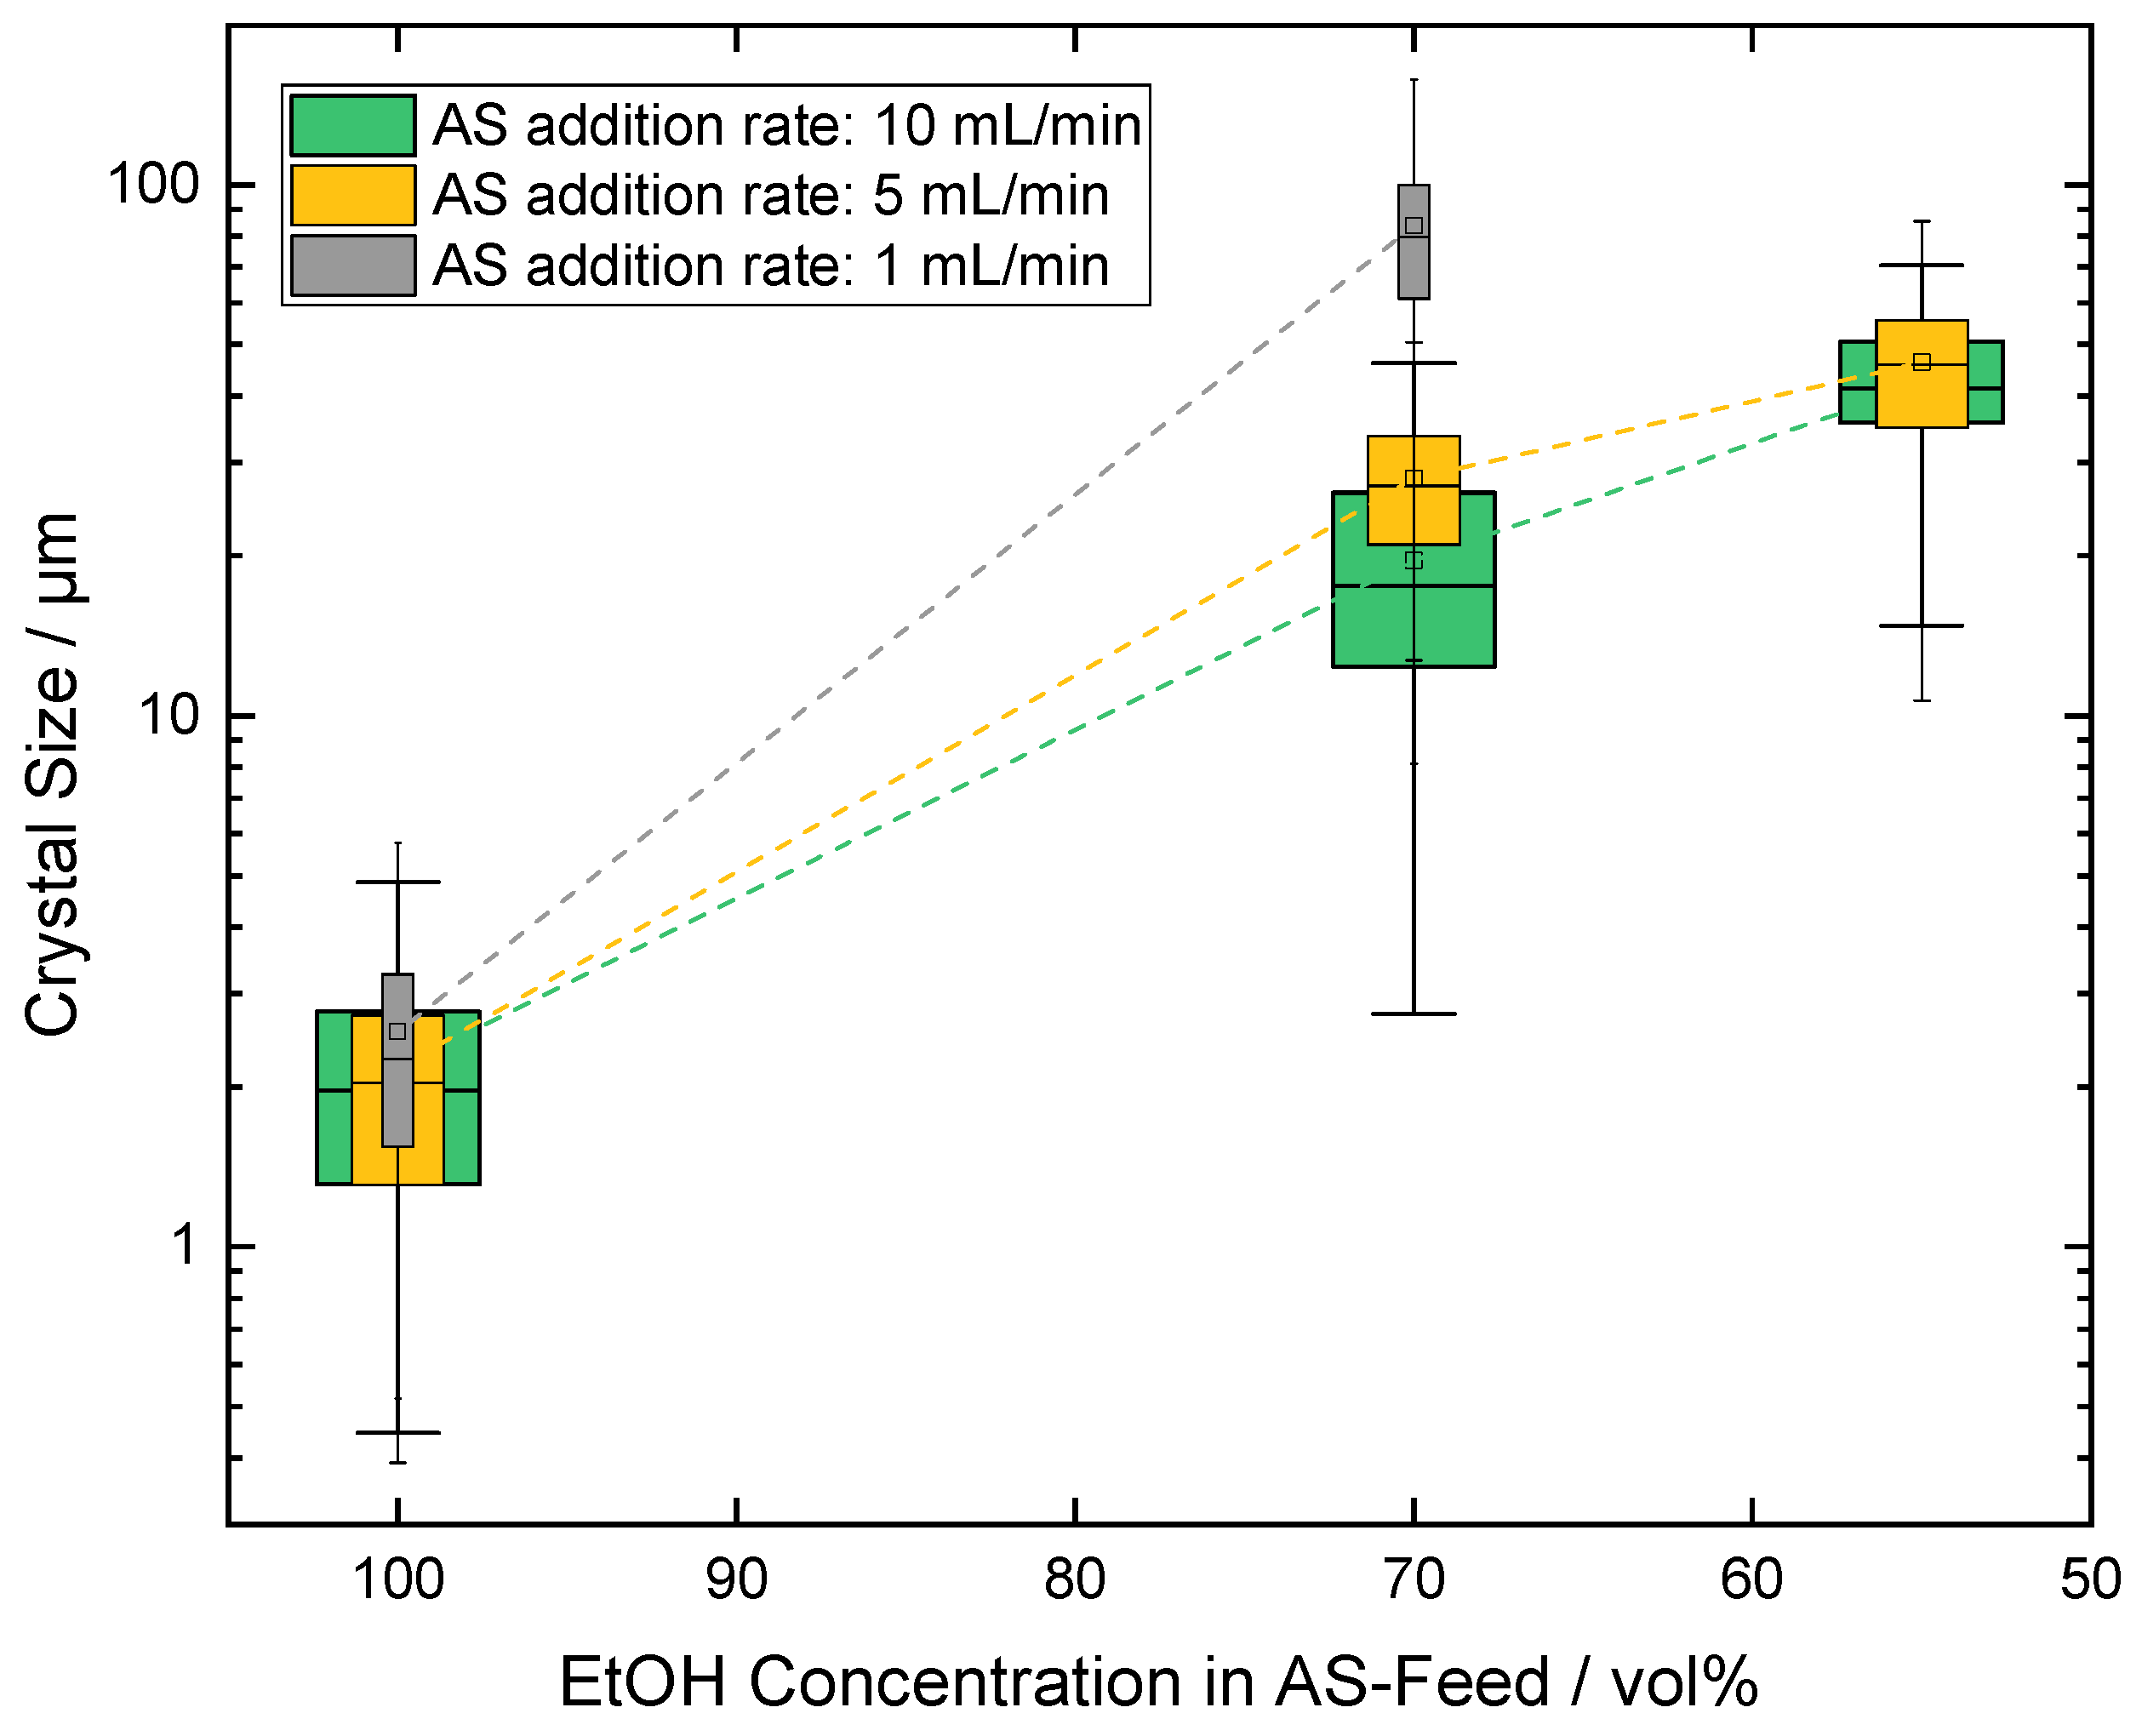
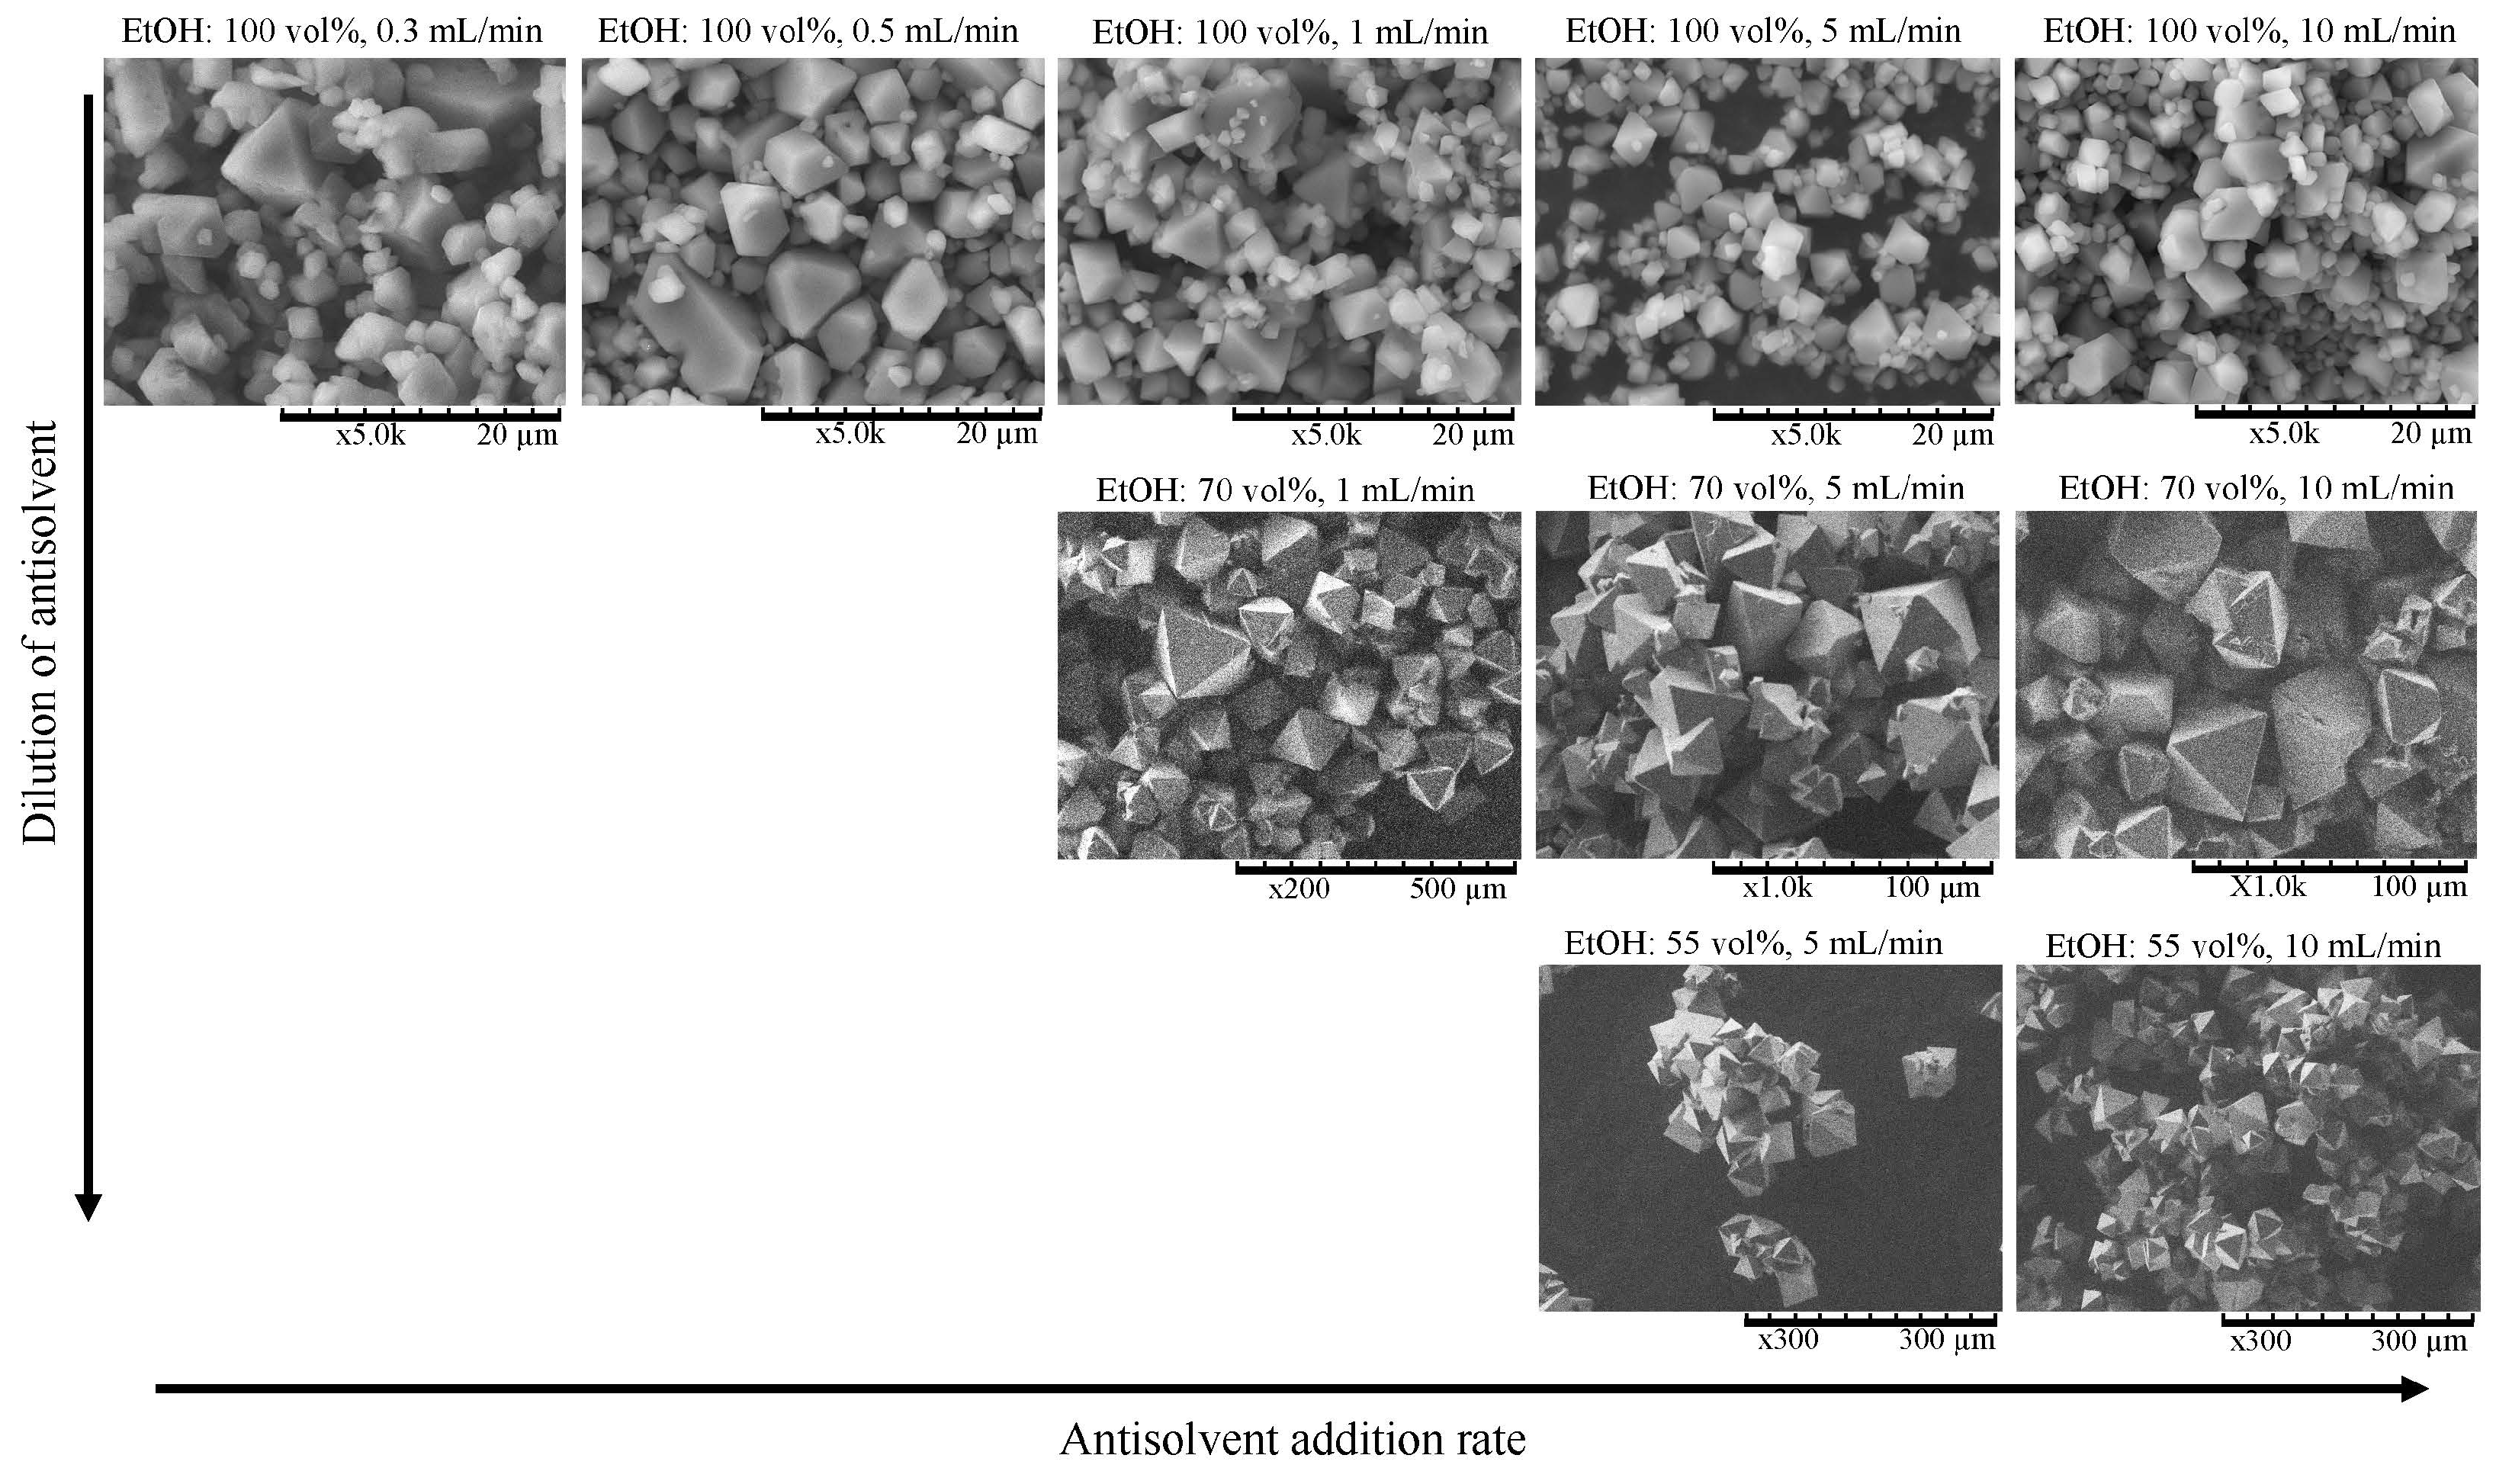
3.1. Influence of the Addition Rate and the Dilution of the Antisolvent

The antisolvent addition rate is varied to study its influence on the CSD at the end of each experiment when the ethanol concentration of 6 mol L−1 is reached. The overview of CSDs for experiments with variations in antisolvent dilution and addition rate is given in the box-plot diagram in Figure 4. The box-plot markers are plotted over the corresponding pure ethanol addition rate for better comparison, although the real addition rate is higher for diluted antisolvent feed solutions due to the simultaneous introduction of water into the system.
Using an antisolvent feed of 100 vol% of ethanol, the CSD varies slightly from a mean diameter of 2 μm at an addition rate of 5 mL min−1 and 10 mL min−1 to 3.5 μm at an addition rate of 0.3 mL min−1. The CSDs inside the range of tested addition rates show a slight but consistent trend, indicating more crystal growth at lower addition rates. The lower end of the whisker of the box-plot diagram represents the smallest detected crystal not considered an outlier. This lower boundary slightly rises from 0.4 μm at 5 mL min−1 to 0.8 μm at 0.3 mL min−1. For comparison, the CSD of an unseeded experiment with 100 vol% of ethanol is plotted with 2 mL min−1. The mean diameter is in line with the seeded experiments. Only the smallest crystals indicated by the lower whisker are slightly larger compared to the seeded experiments. This indicates that the applied seeding strategy cannot reduce nucleation or improve growth when the antisolvent is added with 100 vol%, which has been shown in literature by Peters et al. [29] in a smaller sized crystallizer.
The seeding strategy used for the 100 vol% is not beneficial for crystal growth and is not suitable for the addition of 70 vol%. The antisolvent in the seed suspension leads to further nucleation when the suspension is initially added to the crystallizer. The mass of initially nucleated crystals leads to a lower mean size diameter than when no seeding strategy is applied.
When the antisolvent is added as a dilution with 70 vol% of ethanol, the crystals grow larger for all tested antisolvent addition rates. While the variation of the ethanol addition rate has a negligible influence on the mean diameter when added at 100 vol%, a clear trend is visible when added at 70 vol% between 5 mL min−1 to 1 mL min−1. In this range, the mean diameter continuously increases until it quadruples from 20 μm to 84 μm. Comparing the mean diameter at 1 mL min−1 between 100 vol% and 70 vol%, an increase by more than thirty times from 2.5 μm to 84 μm is measured. The smallest measured crystal continuously increases from 2.7 μm at 5 mL min−1 to 8.1 μm at 1 mL min−1 indicating less nucleation for diluted antisolvent and slower addition rates. The change in CSD at larger higher addition rates between 10 mL min−1 and 5 mL min−1 is small compared to the change in CSD at lower addition rates. Diluting the ethanol even more to 55 vol% leads to a larger mean diameter at ethanol addition rates of 5 mL min−1 and 10 mL min−1.
Plotting several selected CSDs from Figure 4 over the ethanol concentration in the feed as shown in Figure 5 shows that the mean diameter increases with an increased dilution for the addition rates of 10 mL min−1 and 5 mL min−1. Crystal growth slightly increases the more the antisolvent is diluted. The mean diameter trend for the lower antisolvent addition rate of 1 mL min−1 shows a larger increase when the antisolvent is diluted compared to the higher addition rates.
The addition rate of 5 mL min−1 with 70 vol% was conducted once with and once without baffles showing reproducibility. Each respective CSD is presented in Appendix C Figure A8 displaying a negligible difference.
To give an impression of the crystals not only in numbers but in form and appearance one SEM image of each experiment’s final sample is presented in Figure 6. Notice that the magnification changes from 5000-fold for the smallest crystals with 100 vol% ethanol addition to ranges from 1000 to 200-fold magnification for the larger crystals. Slight changes in size and appearance are noticeable in the 100 vol% row. The crystals from slower antisolvent addition rates have larger surfaces and the triangular shape of the faces becomes more visible although the corners are often not grown out. That influences the appearance and number of faces of the crystals. It appears, however, that the crystal habit, meaning the ratio of spacial dimensions of the crystal stays similar. The larger crystals from 70 vol% and 55 vol% ethanol addition show mostly grown-out corners. They also sometimes grow into or out of each other with a different orientation.
Other forms of the hexafluoride salt of scandium have been reported in literature [13,35] and appear at initial NH4F concentrations lower than 1 mol L−1 and temperatures higher than 80 °C. Both parameters have been controlled to be in range so the hexafluoride form is crystallized. To confirm that the crystal form is the monoclinic hexafluoride salt of scandium ((NH4)3ScF6) an X-ray diffraction analysis (XRD) of random samples for crystals from 100 vol% and 70 vol% ethanol addition are included in Appendix E Figure A12.
Dried and unwashed crystals from diluted ethanol addition result in a free-flowing powder while crystals from pure ethanol agglomerate strongly and stick together. The experience and appearance of the larger grown crystals show that crystals created from diluted antisolvent improve their handling during and after filtration.

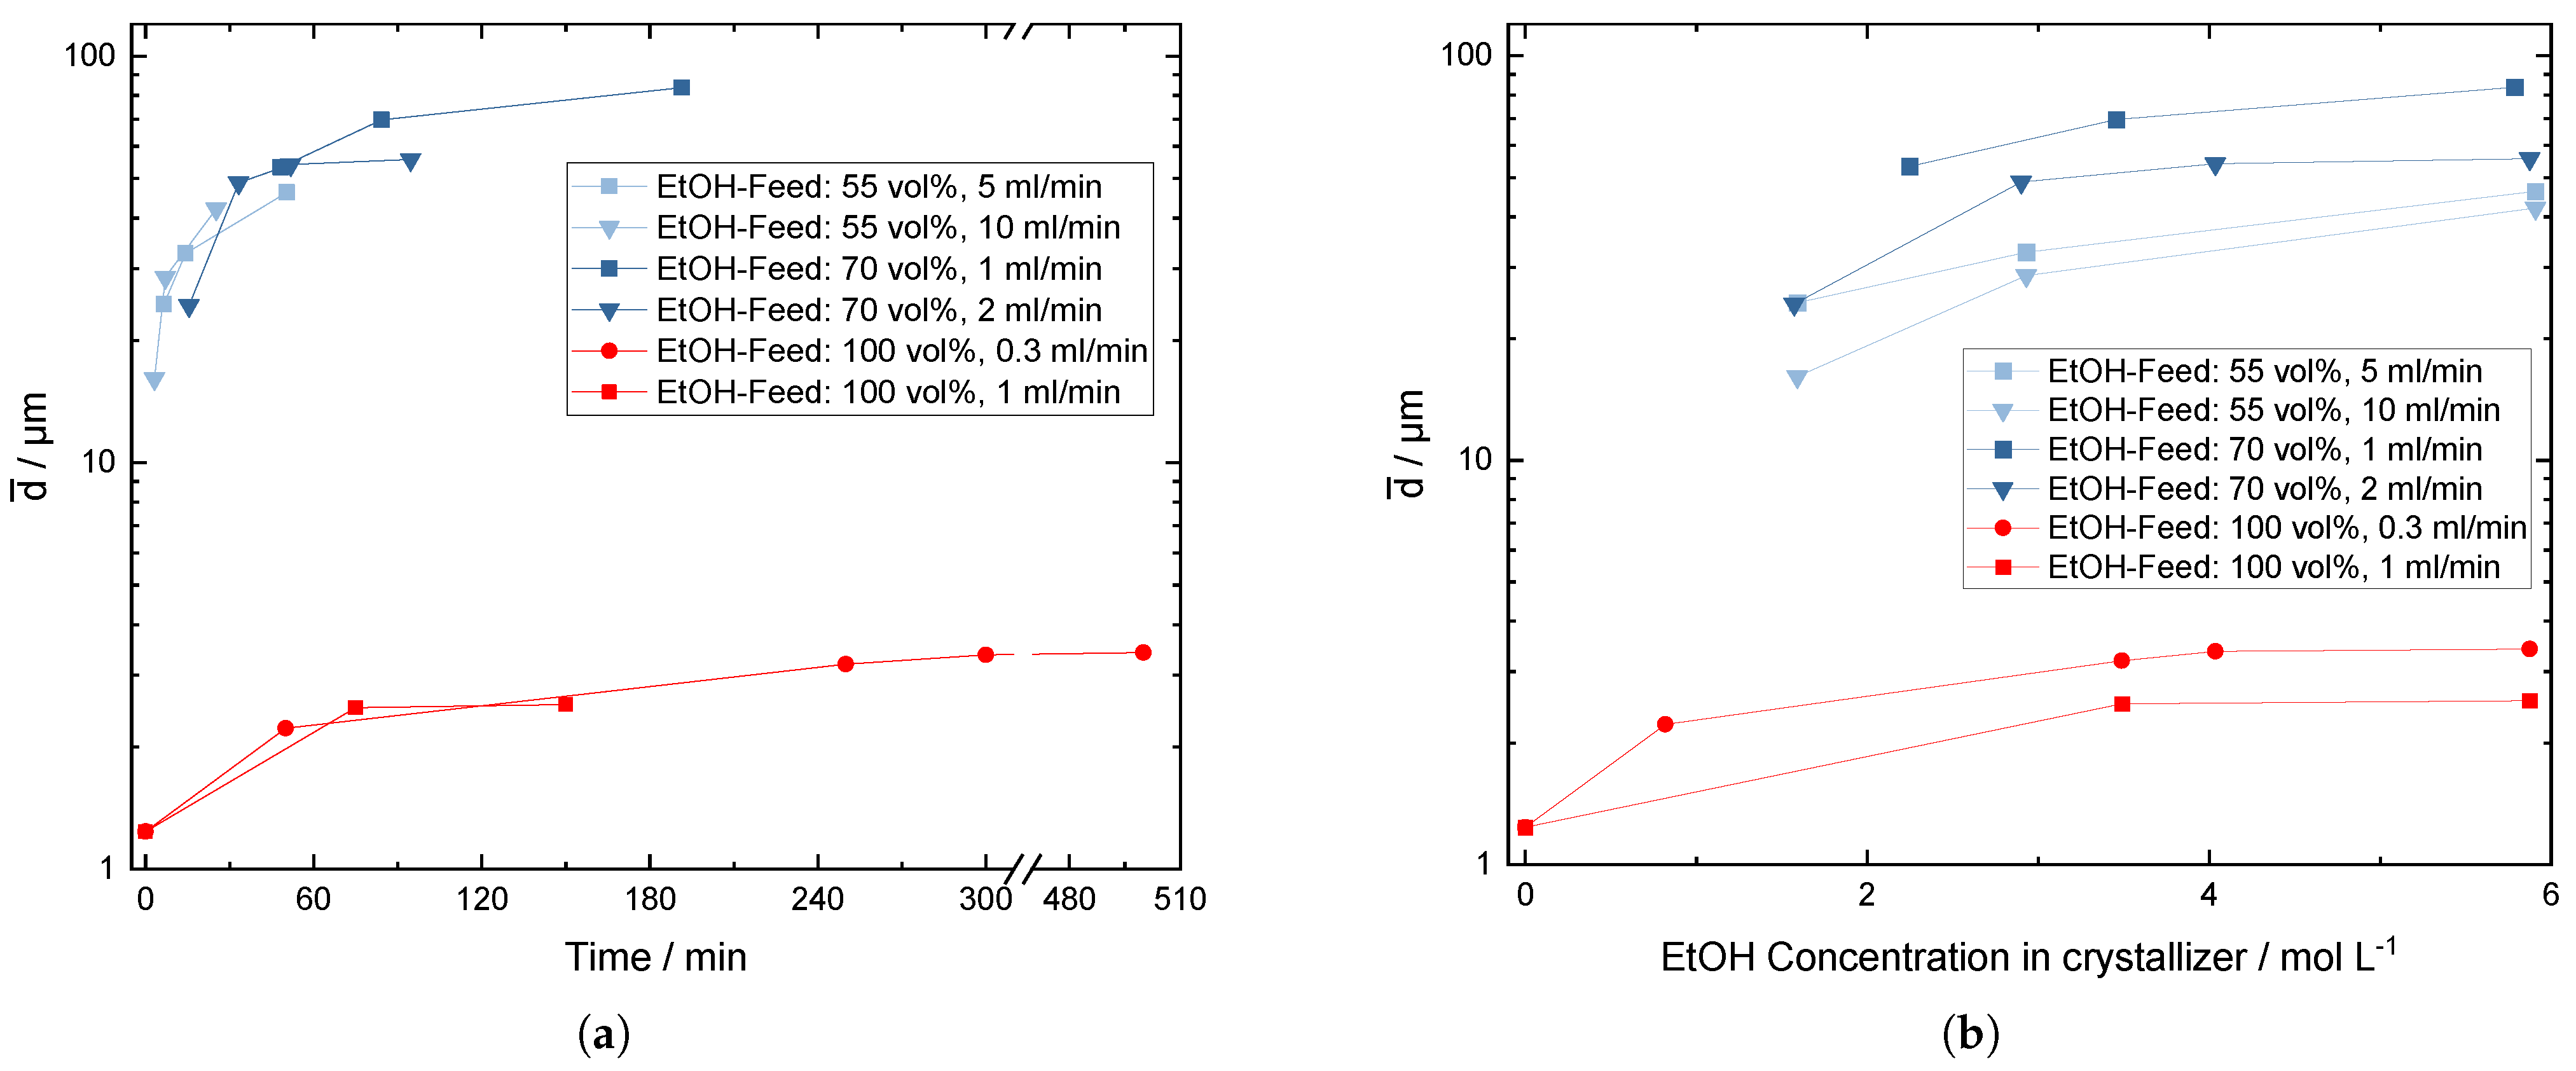
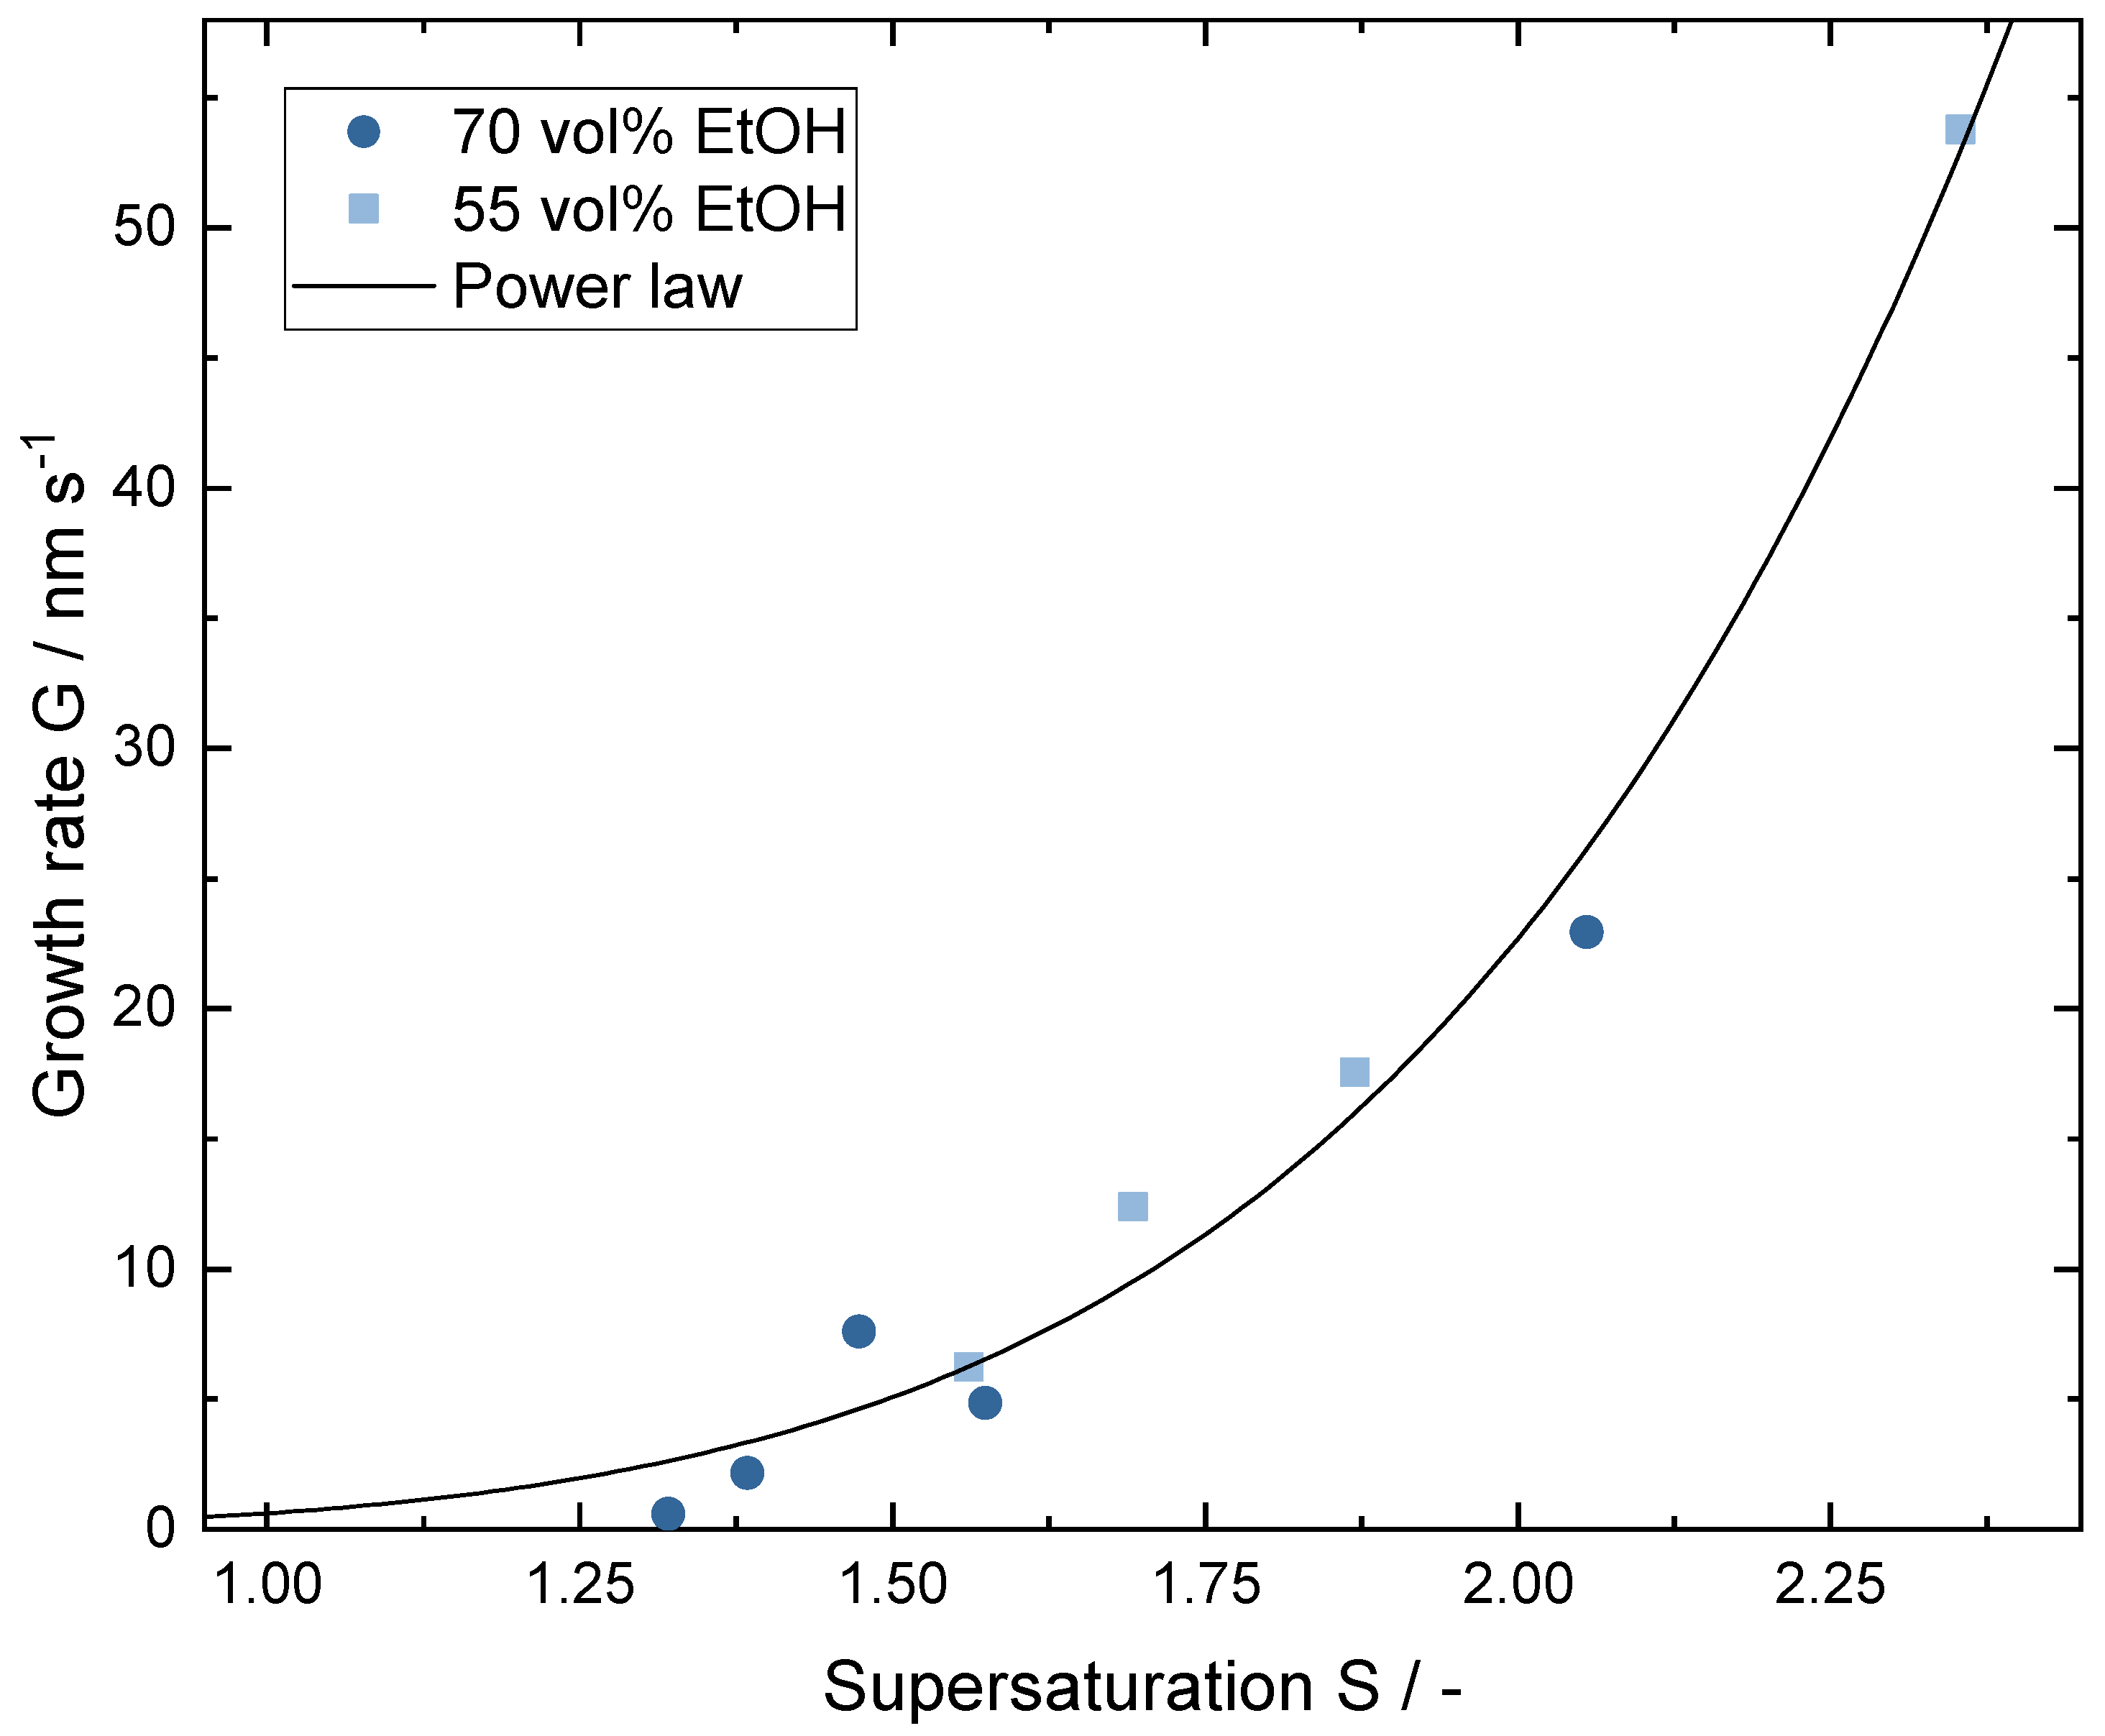
3.2. Crystal Growth during the Crystallization Process

During the addition of the antisolvent, crystal samples are taken and evaluated to study the progressing crystal growth. For better clarity, only the mean diameter is presented without additional information on the CSD. For more detail on the CSD during crystallization the cumulative number frequency ( Q 0 ) of each measurement is presented in Appendix D Figure A9, Figure A10 and Figure A11. Figure 7 plots the mean diameter over time (a) and over the ethanol concentration in the mother solution (b) for different combinations of addition rates and dilutions of the antisolvent. Although the mean diameter with 100 vol% antisolvent addition is overall below 3.5 μm a slight increase can be observed compared to the seed crystals at the beginning, averaging at 1 μm. More increase in the mean diameter over time in Figure 7a is observed for the 70 vol% antisolvent. At an addition rate of 2 mL min−1, the measured crystals grow from an early mean diameter of 25 μm to 55 μm and at a lower addition rate of 1 mL min−1 from 54 μm to 84 μm. The observed increase in crystal size in Figure 7b for all plotted runs happens mostly between ethanol concentrations of 0 mol L−1 to 4 mol L−1. Above 4 mol L−1 of ethanol, the increase in size becomes very small. In Figure 7b it becomes evident that the slower antisolvent addition rates consistently produce larger crystals for each respective antisolvent dilution over the increase of the ethanol concentration.
The calculated growth rates based on the mean diameter after Equation (1) are presented in Figure 8. The growth rates are an estimation neglecting any nucleation after the first measured CSD for each experiment, which is reasonable for diluted ethanol addition as shown in the CSDs in the Appendix D Figure A10 and Figure A11. Although secondary nucleation cannot be fully ruled out the CSDs indicate negligible nucleation at ethanol concentrations of 2 mol L−1 and higher. Nucleation can not be neglected in experiments with pure ethanol addition, which are therefore excluded from the analysis of growth rates. The supersaturation is calculated after Equation (4) with measured scandium salt concentrations and SLE data published previously [15]. The highest growth rate can be obtained from 55 vol% with 10 mL min−1 with 53.38 nm s−1. This high growth rate can be explained by a good balance of fast mixing and fast antisolvent addition which generates a high and well-distributed supersaturation. Growth rates from 55 vol% and 70 vol% ethanol addition aline when plotted over the supersaturation. The growth coefficient k g and the growth rate order g based on the power law after Equation (3) are defined in nm s−1. This approximation fits well with all measured growth rates as shown in Figure 8. The parameters are estimated as k g = 0.6159 nm s−1 and g = 5.204 with R 2 = 0.9823.
Regarding the concentration of the scandium salt (NH4)3ScF6 Figure 9 shows the progress over the addition of ethanol for varying antisolvent addition rates with 70 vol% ethanol (a) and 55 vol% ethanol (b). The SLE in dependence on the ethanol concentration and the initial MSZW for each corresponding run is plotted for reference [15]. The MSZWs are measured from an initially antisolvent- and particle-free state until the first nucleation happens via optical particle detection and calculation of the resulting supersaturation.
With the ethanol addition of 70 vol% in Figure 9a, the concentration of scandium salt decreases only by a small amount until the ethanol concentrations of 1.6 mol L−1 is reached, which can be associated with the dilution of the whole solution by the antisolvent addition. At higher ethanol concentrations the scandium salt concentration decreases more with all ethanol addition rates, indicating the formation of the crystals. For increasing ethanol addition rates an increased MSZW is measured. The sudden decrease in scandium concentration is measured at the same ethanol concentration for each ethanol addition rate, which is contrary to the measured MSZW. The MSZW indicates the formation of crystals measured by the first detectable increase in turbidity. However, the measurements may not be congruent to the concentration measurement which is less frequent than the turbidity measurement. The same is true with a more diluted antisolvent addition of 55 vol% in Figure 9b. After the formation of crystals a lower ethanol addition rate leads to a steeper concentration curve closer to the SLE resulting in a lower supersaturation.
The addition of 100 vol% ethanol for several ethanol addition rates is presented in Figure 9c. The pure ethanol addition leads to the fastest decrease in the scandium salt concentration. Although the starting concentration of the scandium salt is slightly undersaturated the fast decay of scandium salt concentration is visible once it crosses the SLE. The scandium salt concentration is always close to the SLE and does not reach a high supersaturation.
Above a concentration of 4 mol L−1, of ethanol all concentration curves approach the solid-liquid equilibrium (SLE) and reach approximately a tenth of the starting scandium salt concentration. This correlates with the decreasing crystal growth above an ethanol concentration of 4 mol L−1 shown in Figure 7.
A higher supersaturation often means more nucleation and less crystal growth. The presented experiments seemingly contradict this when comparing the different antisolvent dilutions and the resulting crystal sizes. A probable explanation is the local, and therefore difficult-to-measure supersaturation, at the antisolvent inlet, especially with 100% antisolvent addition. A high local supersaturation causes fast nucleation even if the measured supersaturation in the bulk is low. As a result, the overall crystal size is low. The addition of diluted antisolvent improves micro- and meso-mixing at the inlet and leads to a more homogeneous solution. This lowers local nucleation at the inlet, and the resulting higher bulk supersaturation can be converted to the growth of established crystals. With a higher dilution of the antisolvent feed, this effect increases, and the solution is more homogeneous and measured bulk concentrations more representative.

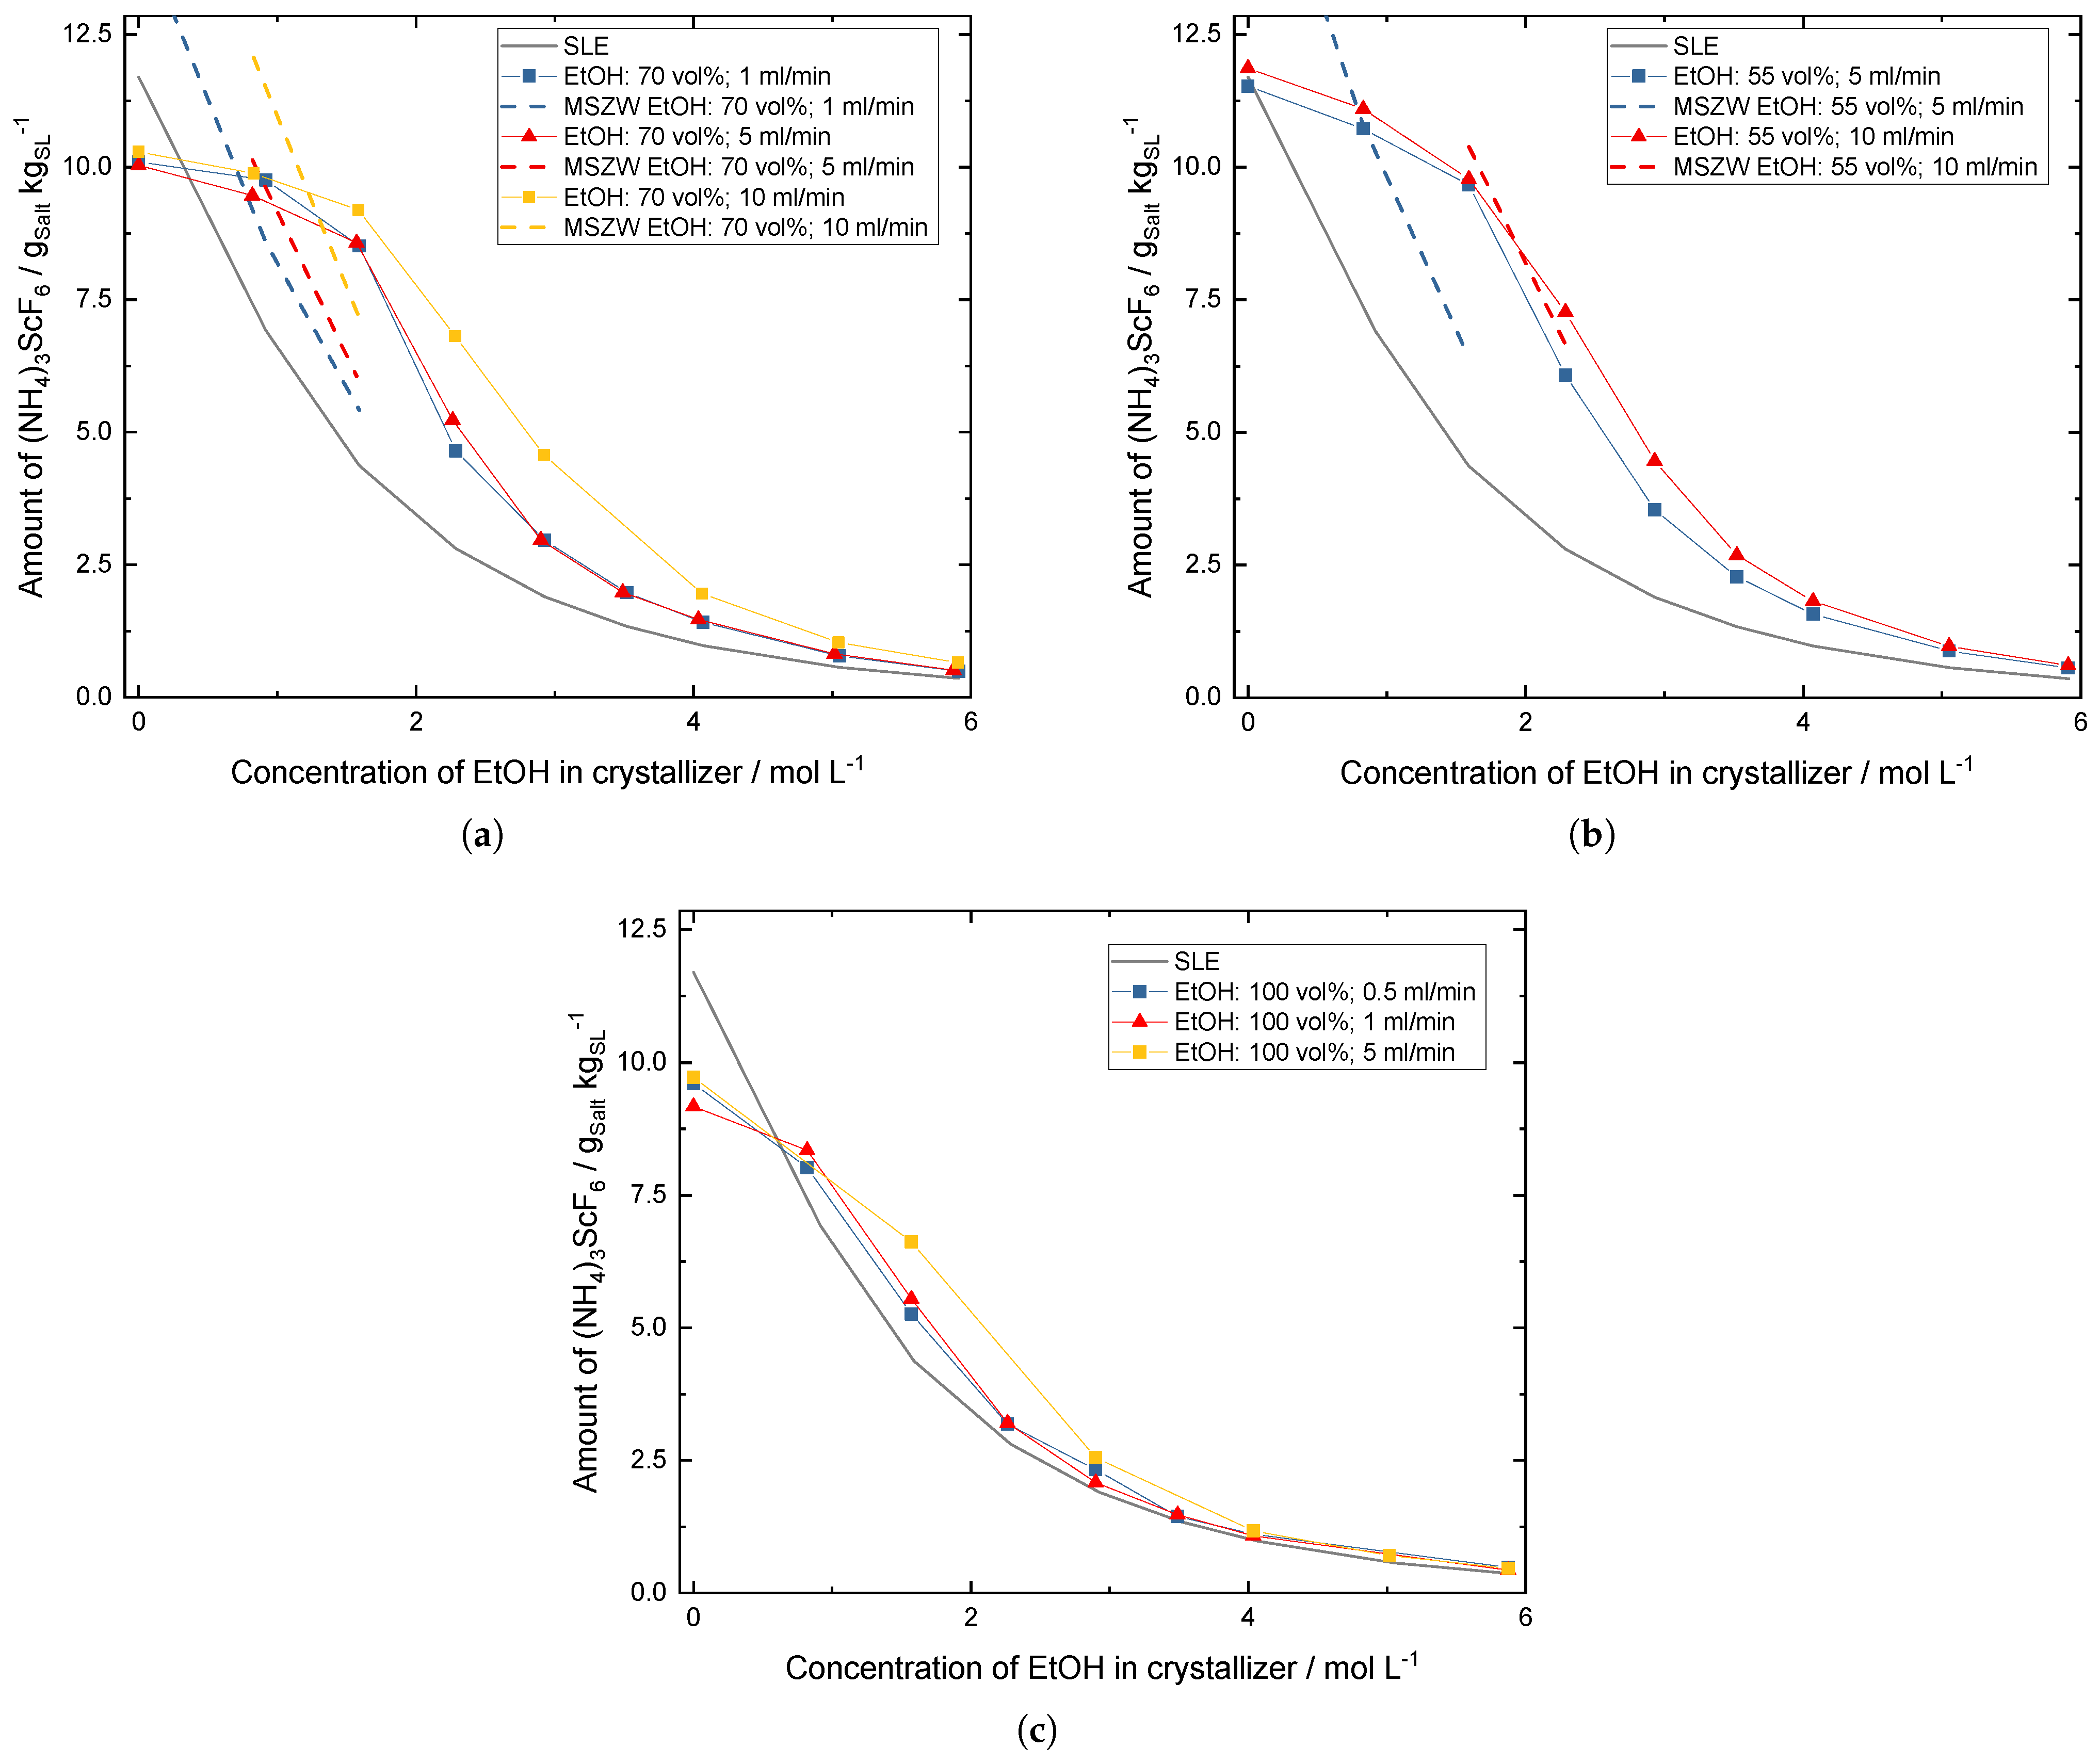
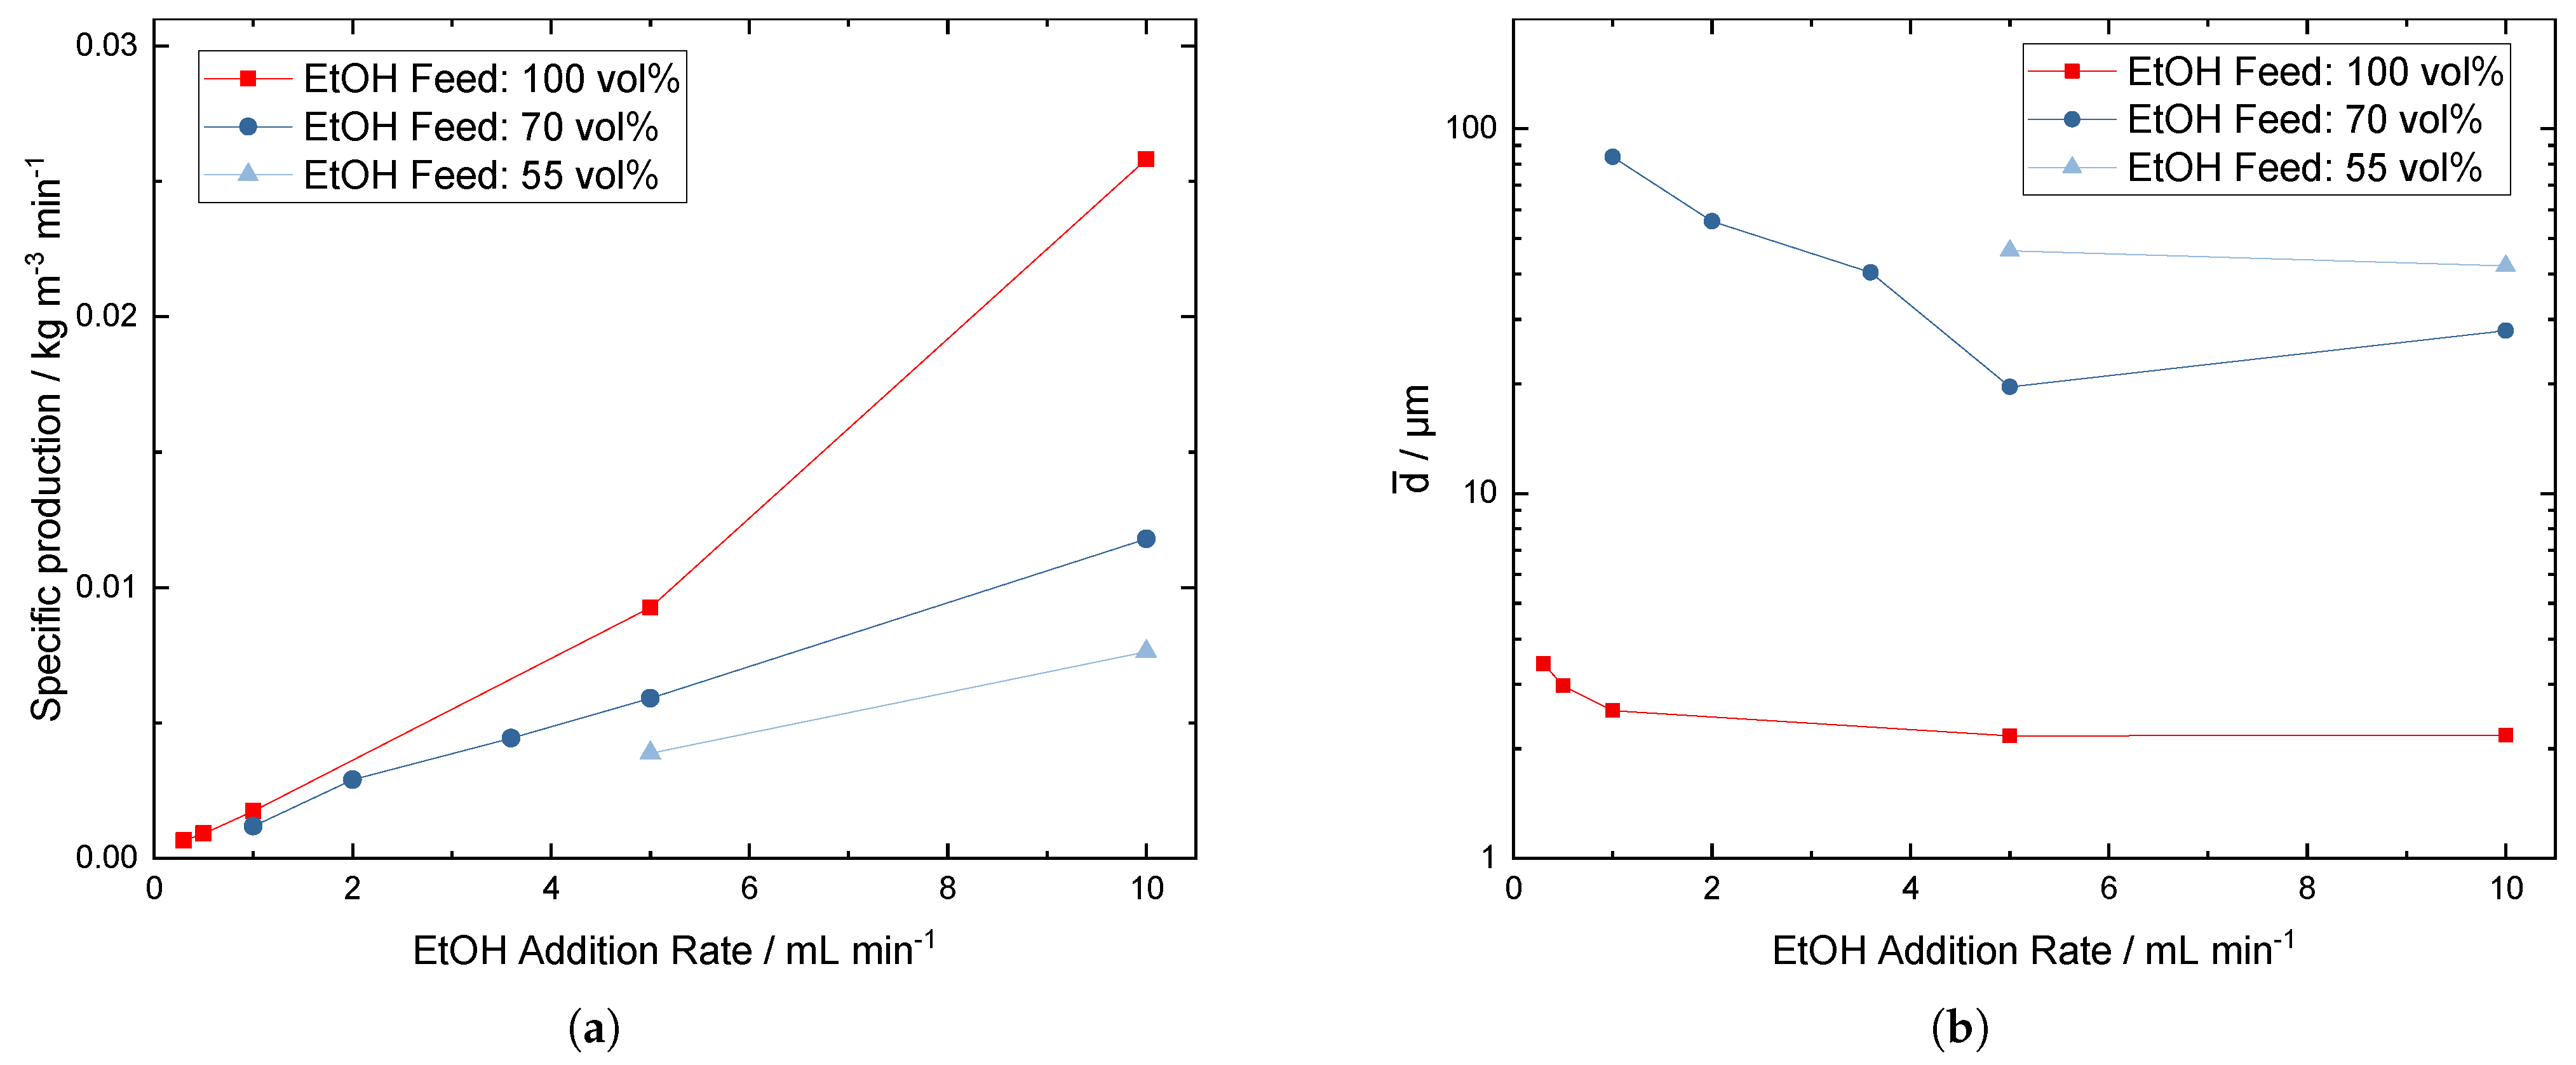
3.3. Specific Production

The specific production considers the mass of produced scandium salt as well as the liquid volume and the time at the end of the process after Equation (5). The highest space-time yield, presented in Figure 10a, can be achieved when the antisolvent is added fast and undiluted. Slower antisolvent addition rates and higher dilutions result in a low space-time yield, which is expected. This trend is directly contrary to the crystal growth which is represented in Figure 10b by the mean diameter. As stated above, the largest crystals are observable at low antisolvent addition rates and high antisolvent dilutions. To make the crystallization process efficient, the operation parameters should be adjusted to create the minimal necessary crystal growth so filtration is feasible. Further increase of crystal growth would result in unnecessary loss of efficiency.

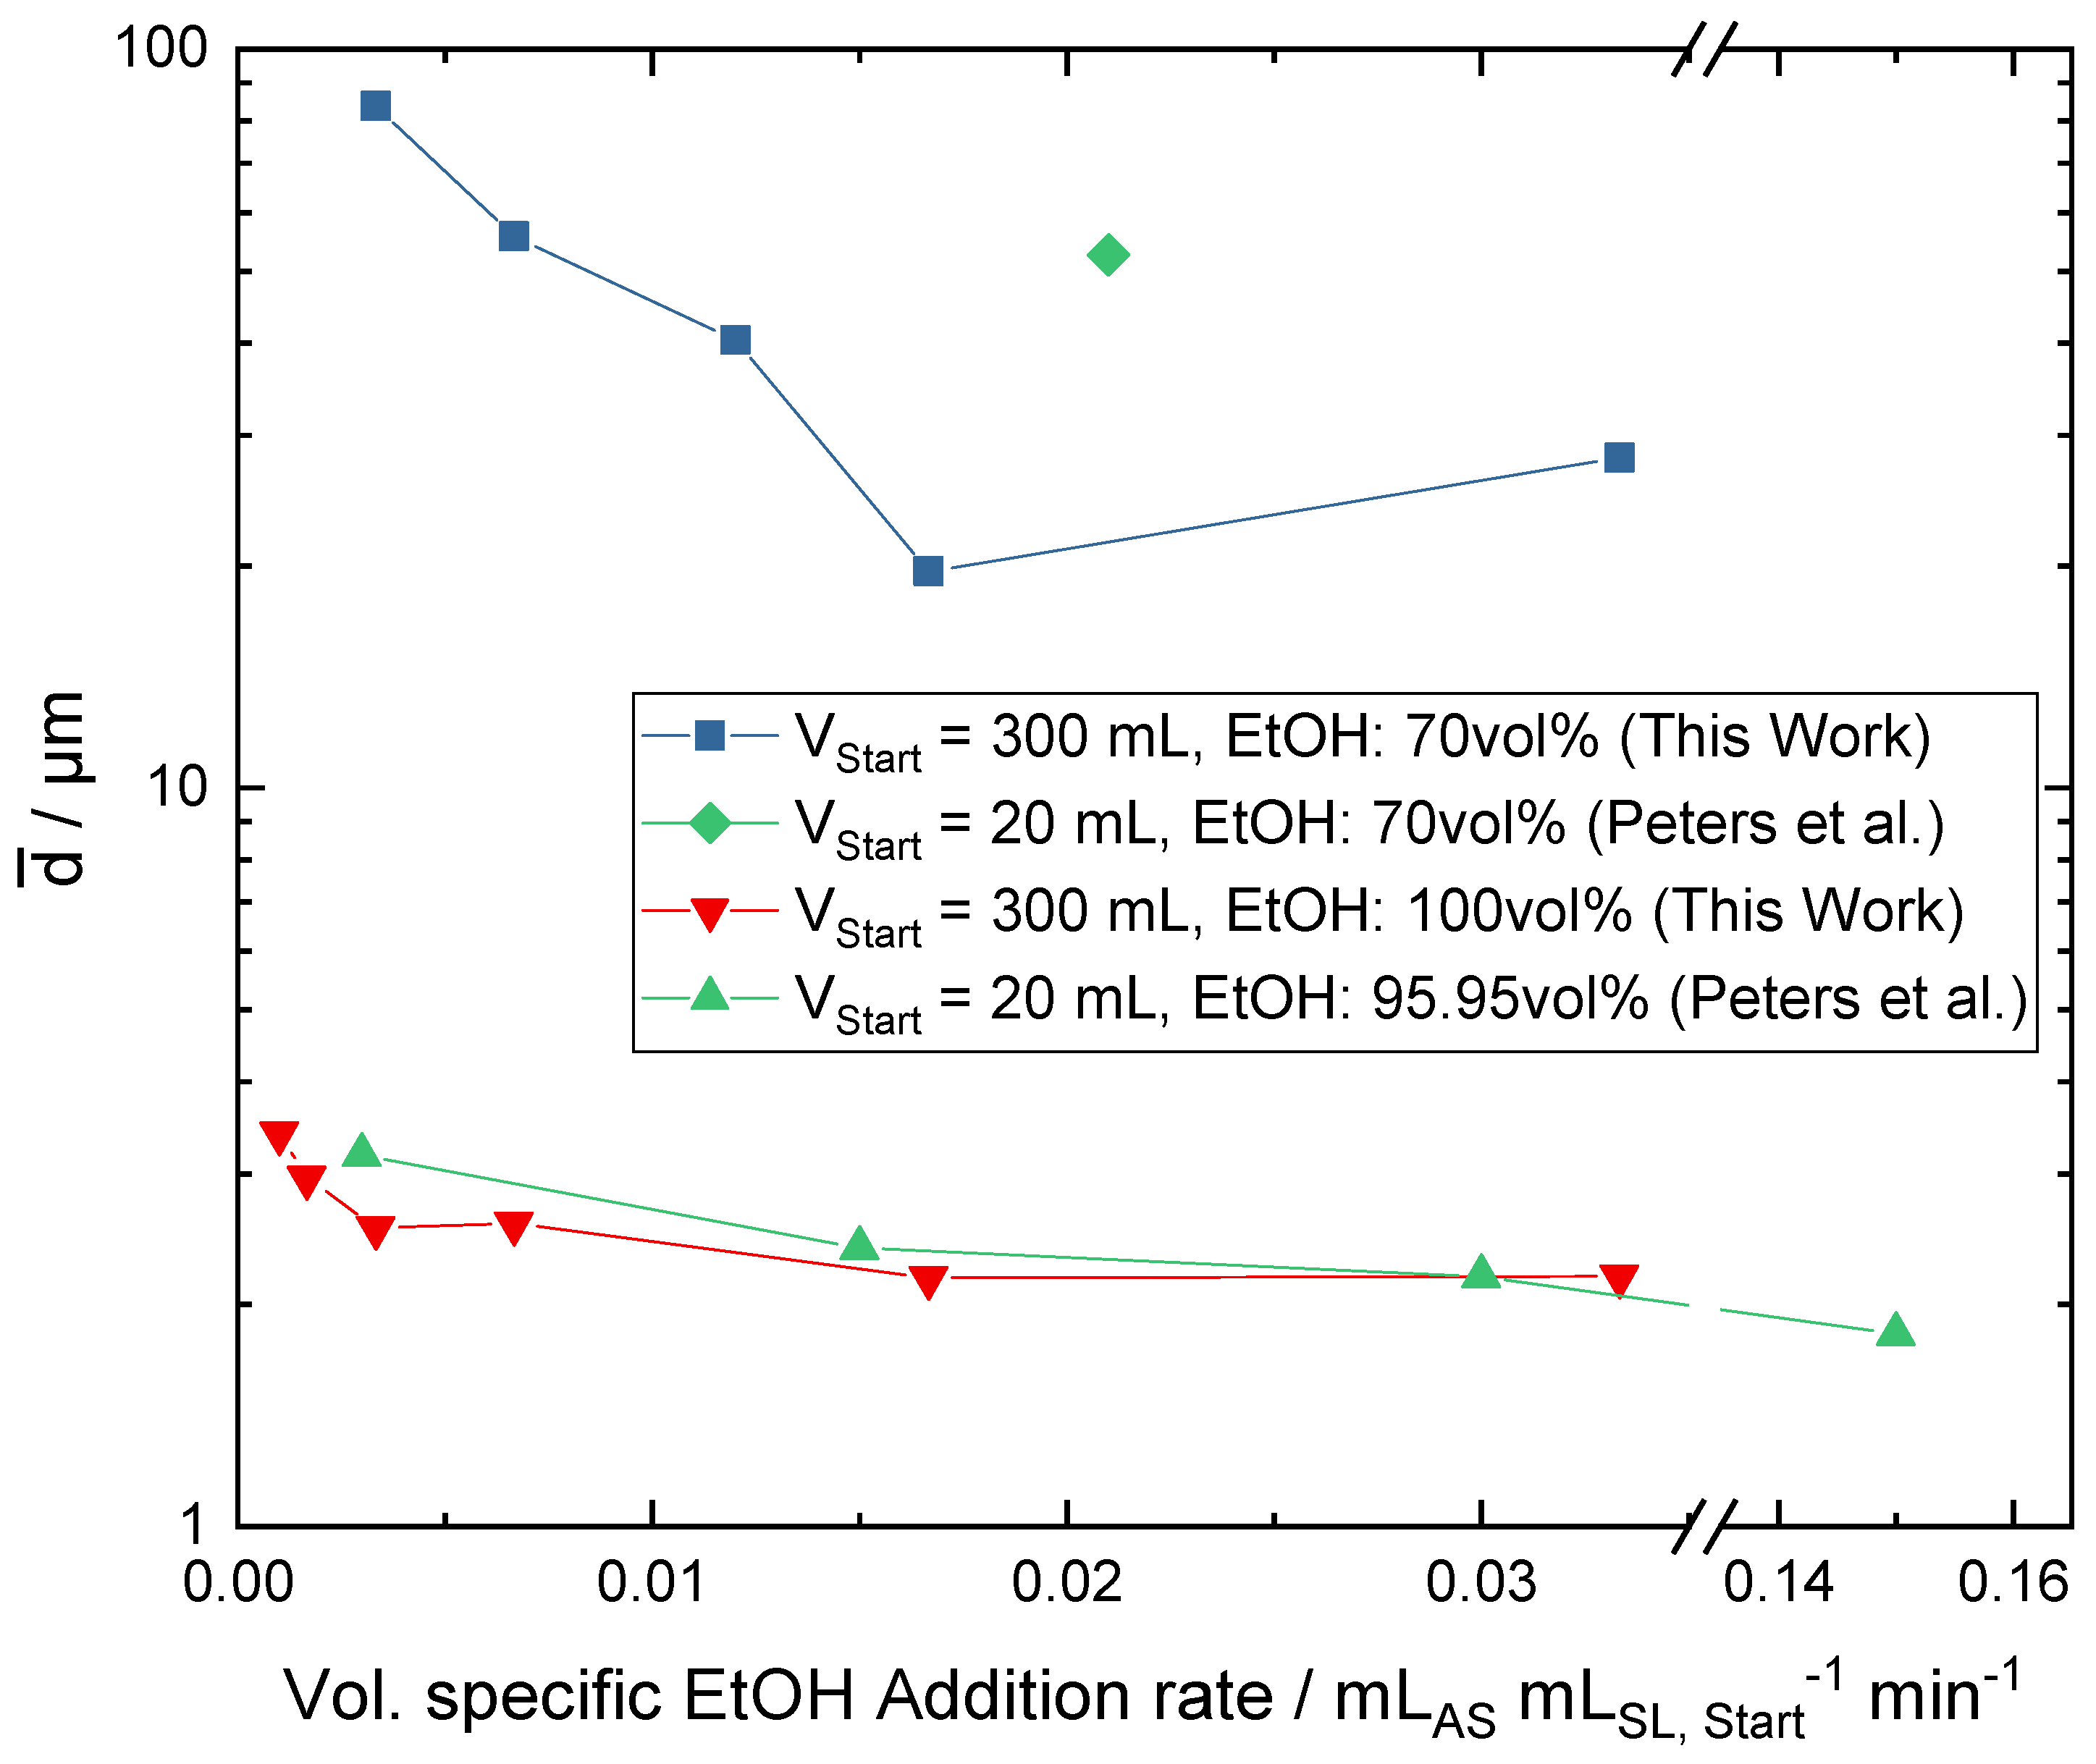
3.4. Comparison of Scale

Similar experiments have been published for a smaller setup with approximately 20 mL of starting volume [29], which makes the starting volume of this work with 300 mL 15 times larger. The starting conditions of their solution are comparable to the solution used in this paper. In Figure 11 some of their data are extracted to be compared to data from this work. Peters et al. examined the influence of antisolvent addition from the top or bottom of the vessel. Data from antisolvent addition from the top have been excluded in this comparison since in this work the antisolvent is added exclusively near the stirrer inside the solution. Also, magnetic stirring has been excluded where overhead stirring experiments are available. For pure ethanol addition, Peters et al. only used magnetic stirring and no seeding. Since seeding with experiments of 100 vol% ethanol addition does not influence the CSD as shown in this work, the difference does not harm the comparison. Peters et al. pulled their solid sample at an ethanol concentration of 8 mol L−1. The geometric similarity is not given and the volume-specific power input is not comparable. However, the overall fed-batch setup between both scales is comparable by the volume-specific ethanol addition rate, which is the ethanol addition rate divided by the starting volume. The mean diameters of crystals from experiments with pure ethanol addition in Figure 11 are very similar when compared to the volume-specific ethanol addition rate. This indicates that the mean diameter is scaleable with the starting volume of the crystallizer in the regarded range of volume. For the 70 vol% ethanol addition there is only one experiment of the smaller setup which is comparable to the larger setup. This data point presents a larger mean diameter compared to the larger setup. Larger crystals in this system usually derive from better mixing, so it can be argued that the mixing conditions in the smaller volume are better when the antisolvent is added in a dilution compared to the larger volume crystallizer.

4. Conclusions

To consistently detect crystal sizes on SEM images from dried samples, an automated detection tool has been utilized by training a neural network based on Mask R-CNN. With this tool, the influence of antisolvent dilution and addition rate on crystal growth has been studied with the production of the scandium salt (NH4)3ScF6.
The addition of a suspension containing seed crystals before the addition of undiluted antisolvent does not improve crystal growth during 100 vol% ethanol addition. The antisolvent addition rate with a pure ethanol addition has very little influence on the CSD because the local supersaturation generated by the pure ethanol addition always produces nucleation in this setup independent of the addition rate or utilized seeding strategy. When ethanol is diluted and added with a concentration of 70 vol% or 55 vol% not only do the crystals grow larger with all addition rates compared to the 100 vol% addition but the influence of the addition rates becomes more profound as well.
Evaluating the mean diameter during the crystallization process showed that the crystals grow mostly at the beginning of the process where the supersaturation is highest. The fastest growth rates could be calculated for the diluted antisolvent addition with faster addition rates. Slower addition rates produce larger crystals at the end of the experiment but the crystals grow slower. The growth rates in dependence of the supersaturation are in good agreement with the power law approach.
Comparing the scandium salt concentration plotted over the addition of ethanol for the three tested antisolvent addition concentrations displays the supersaturation reached in the bulk of the crystallizer and when the MSZW is crossed. The more the antisolvent is diluted the higher the measurable supersaturation becomes. This does not mean that the addition of purer ethanol produces less supersaturation but the supersaturation is not distributed equally and therefore converted to nuclei very fast at the antisolvent inlet before it can be measured in the bulk concentration.
Comparing the results of this work with results in the literature for a comparable system but smaller scale experiments shows that crystal sizes scale with the volume of the crystallizer when pure ethanol is added. When ethanol is added with 70 vol% the crystal sizes compared over the volume-specific ethanol addition rate are larger in the smaller volume setup. Most likely this effect is due to better mixing in the smaller setup.
Once the micro- and meso-mixing is improved by a diluted antisolvent the supersaturation can be distributed in the bulk of the solution and only then the kinetic limitations of the crystal growth can be evaluated with varying antisolvent addition rates. Even higher antisolvent dilutions could create larger crystals. The trade-off, however, would be a larger volume needed for the crystallizer or a smaller space-time yield. Calculated specific production rates show that the highest efficiency is reached at operation parameters where the crystal growth is minimal. The larger crystals produced from diluted antisolvent addition improve the filtration and the handling after drying compared to the small crystals produced from undiluted ethanol addition. Antisolvent addition rates and dilutions should influence the crystal growth enough to secure the feasibility of filtration but not more to prevent unnecessary loss of efficiency.

Author Contributions

Conceptualization, J.T.; methodology, J.T., A.R.F. and L.L.; software, L.L.; validation, L.L.; formal analysis, J.T. and A.R.F.; investigation, A.R.F. and L.L.; resources, J.T.; data curation, J.T.; writing—original draft preparation, J.T.; writing—review and editing, A.R.F., L.L. and A.J.; visualization, J.T.; supervision, A.J.; project administration, J.T.; funding acquisition, A.J. All authors have read and agreed to the published version of the manuscript.

Funding

This research was funded by Federal Ministry for Economic Affairs and Climate Action: ZF4277102VS9.

Data Availability Statement

Dataset available on request from the authors.

Acknowledgments

Analytisches Labor Fölsing (ALF) for providing ICP-OES analysis to measure scandium concentrations, MEAB Chemie Technik GmbH for providing a scandium-enriched ammonium fluoride solution.

Conflicts of Interest

The authors declare no conflict of interest.

Abbreviations

The following abbreviations are used in this manuscript:
REErare earth element
MRCNNmask region-based convolutional neural network
CSDcrystal size distribution
SEMscanning electron microscopy
MSZWmetastable zone width
ASantisolvent
SLcrystallization solution
STYspace-time yield
SLEsolid-liquid equilibrium

Appendix A. CSD of Seed Crystals

The seed crystals have been produced by the addition of 100 vol% ethanol with 15 mL min−1 into a saturated scandium solution containing 3 mol L−1 of NH4F and added to the starting solution into the crystalizer at the start of the experiment.
Figure A1. (a): CSD of the seed crystals and (b): representative SEM image of the seed crystals.
Crystals 14 00094 g0a1

Appendix B. CSD of MRCNN vs. Human Measurement

The training and validation loss of the dataset is plotted over the progressing epochs. The training loss decreases continually which means, that the algorithm learns to detect the crystals in the training dataset. The validation loss increases significantly after epoch 10 which indicates overfitting. The combined minimal loss is found at epoch 9 where the final weights for the neural network are taken from.
Figure A2. The different losses during the training of the neural network (MRCNN). The combined minimal loss is a suitable indicator for a good performance.
Crystals 14 00094 g0a2
In Figure A3 the cumulative number frequency of an SEM image is presented, which is measured by hand and by the presented neural network MRCNN. The differences are minimal.
Figure A3. CSD as relative cumulative number frequency comparing an SEM image evaluation by a human and by MRCNN.
Crystals 14 00094 g0a3
For further validation of the CSD measurement method some of the progressions for the mean diameter and the coefficient of variation (CV) are presented in Figure A4, Figure A5, Figure A6 and Figure A7. Each data point represents the cumulative value change after evaluating an image, which is plotted over the number of detected crystals. Each plot shows a fluctuation in value which levels out after a certain number of samples measured, which indicates a sufficient number of samples.
Figure A4. The change in mean diameter and CV over the number of measured samples. Each data point represents the mean value after an analyzed SEM image for the 100 vol% ethanol addition at 0.5 mL min−1. (a) displays the mean diameter and (b) the coefficient of variation.
Crystals 14 00094 g0a4
Figure A5. The change in mean diameter and CV over the number of measured samples. Each data point represents the mean value after an analyzed SEM image for the 100 vol% ethanol addition at 5 mL min−1. (a) displays the mean diameter and (b) the coefficient of variation.
Crystals 14 00094 g0a5
Figure A6. The change in mean diameter and CV over the number of measured samples. Each data point represents the mean value after an analyzed SEM image for the 70 vol% ethanol addition at 1 mL min−1. (a) displays the mean diameter and (b) the coefficient of variation.
Crystals 14 00094 g0a6
Figure A7. The change in mean diameter and CV over the number of measured samples. Each data point represents the mean value after an analyzed SEM image for the 70 vol% ethanol addition at 2 mL min−1. (a) displays the mean diameter and (b) the coefficient of variation.
Crystals 14 00094 g0a7

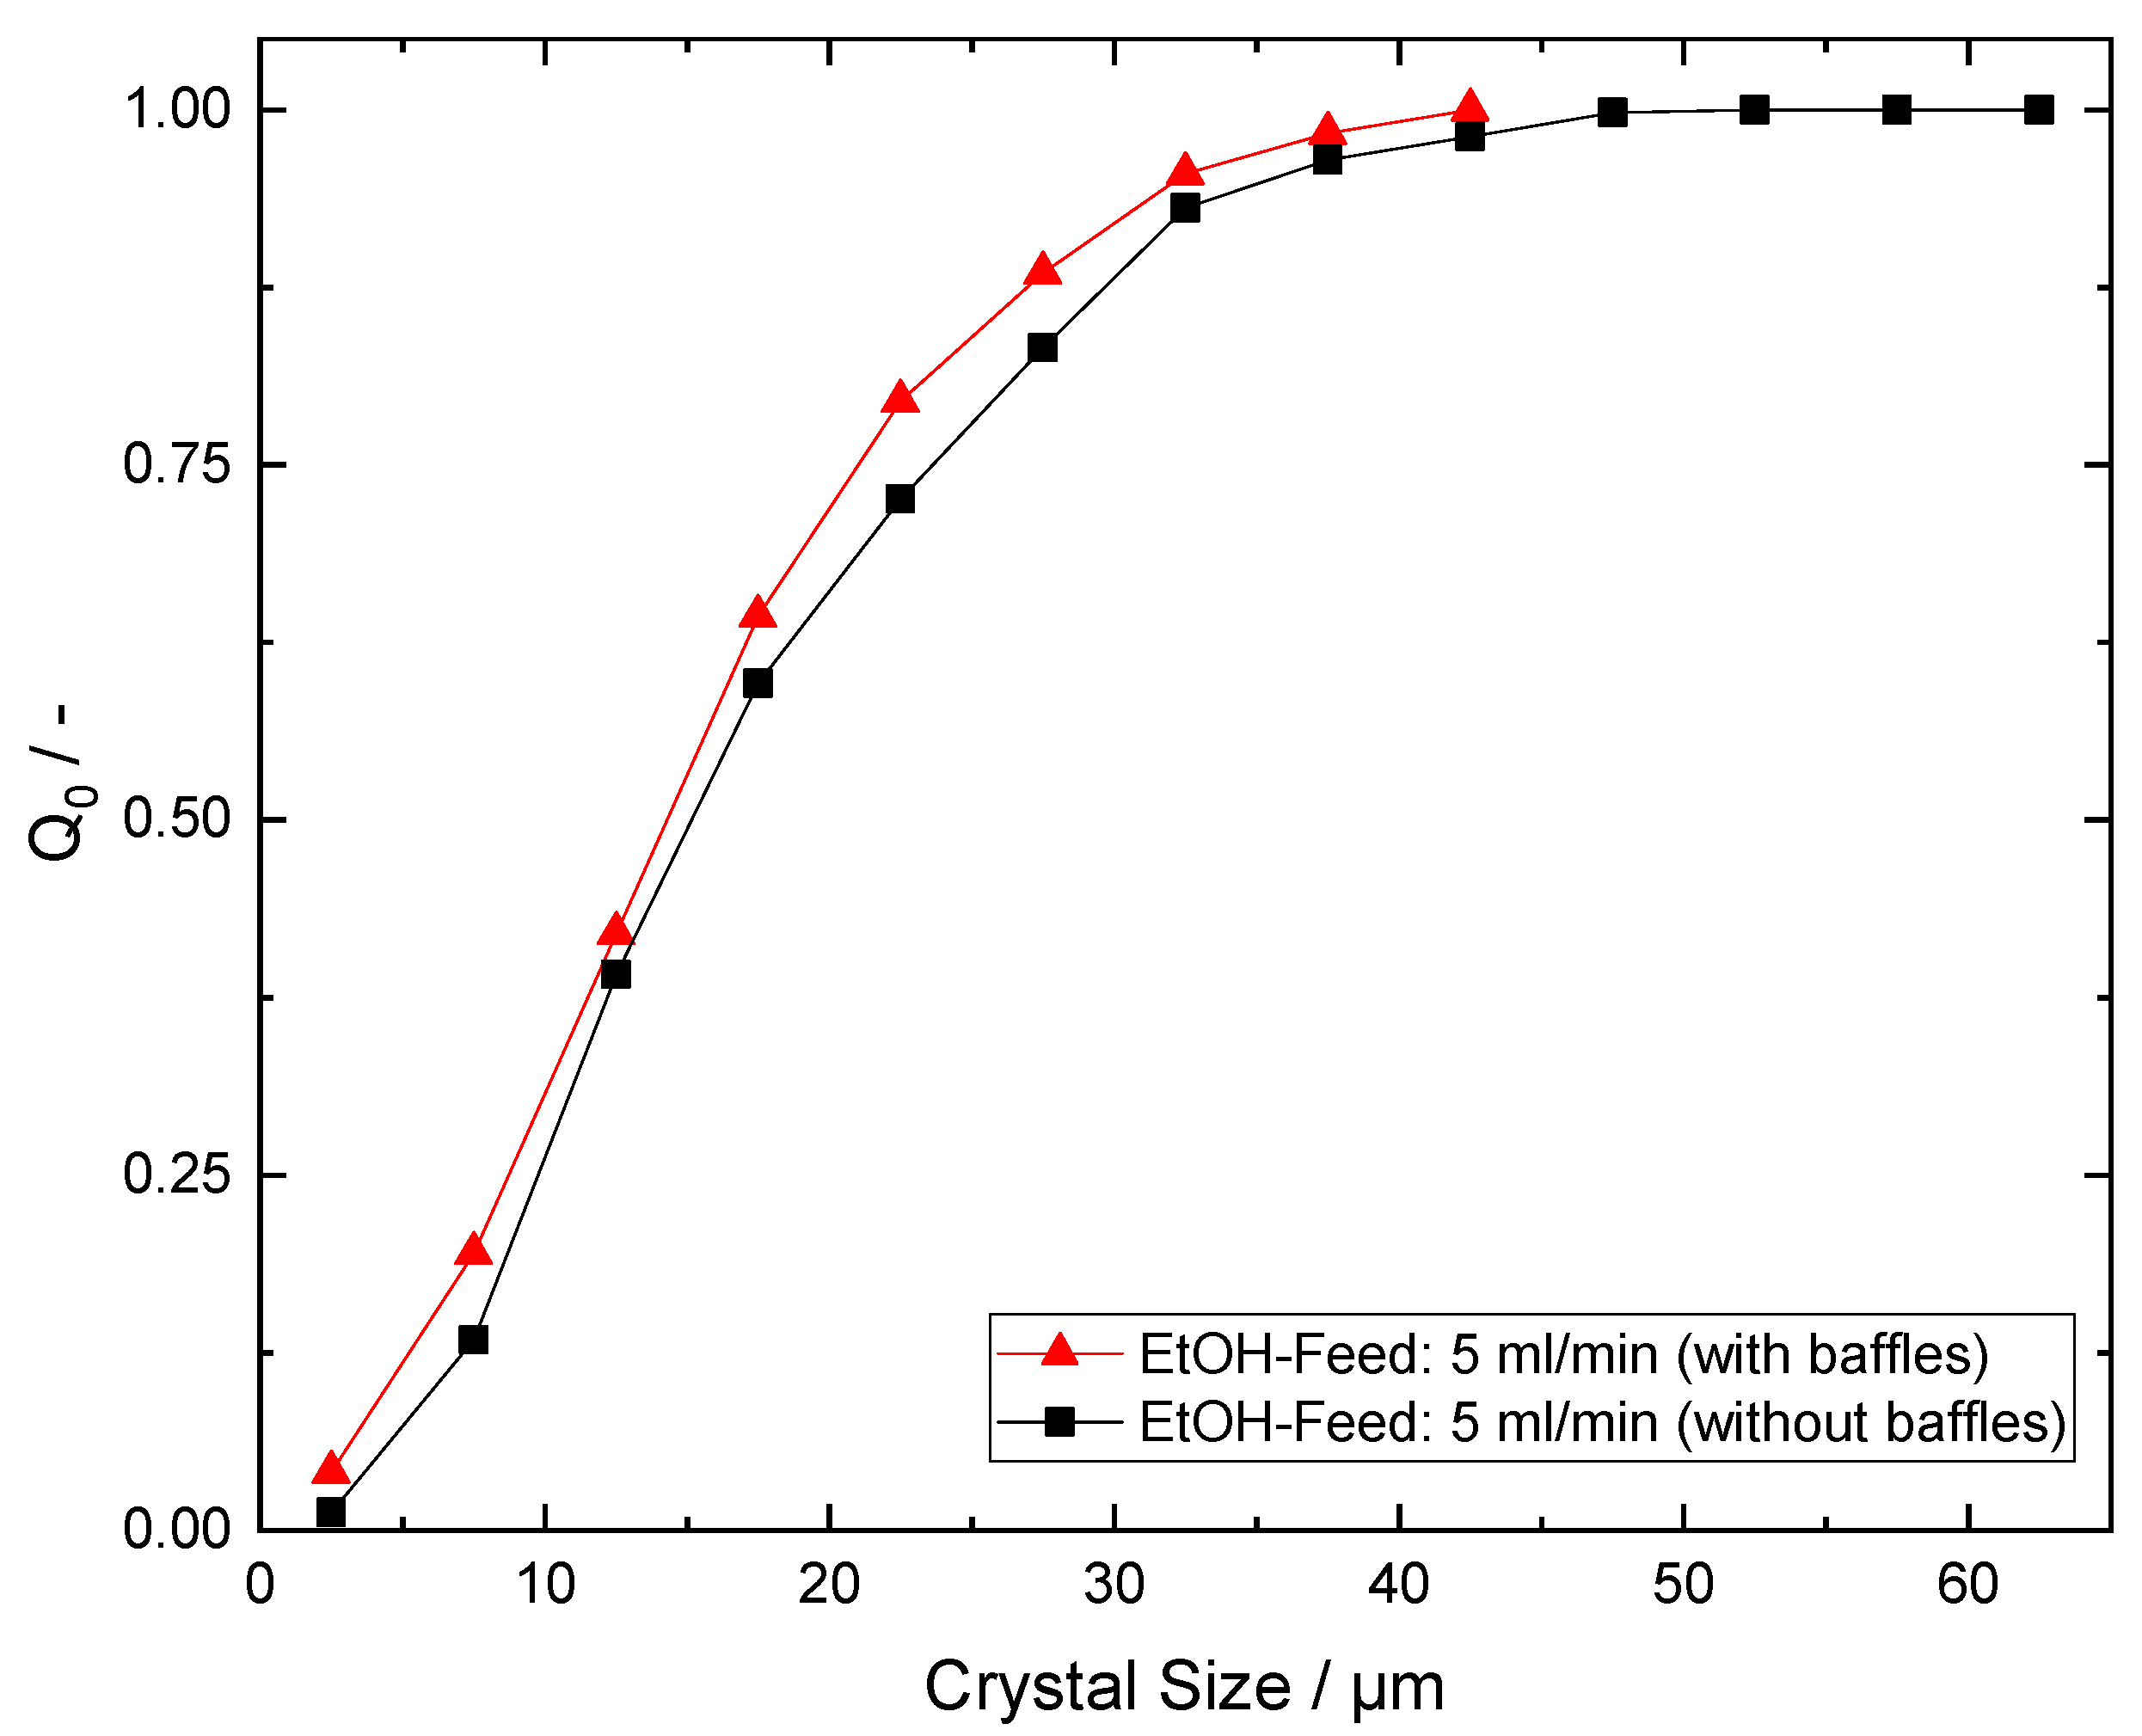
Appendix C. Baffles vs. No Baffles

Figure A8. CSD as relative cumulative number frequency of experiments with 5 mL min−1 and 70 vol% of ethanol in the AS feed with and without baffles.
Crystals 14 00094 g0a8

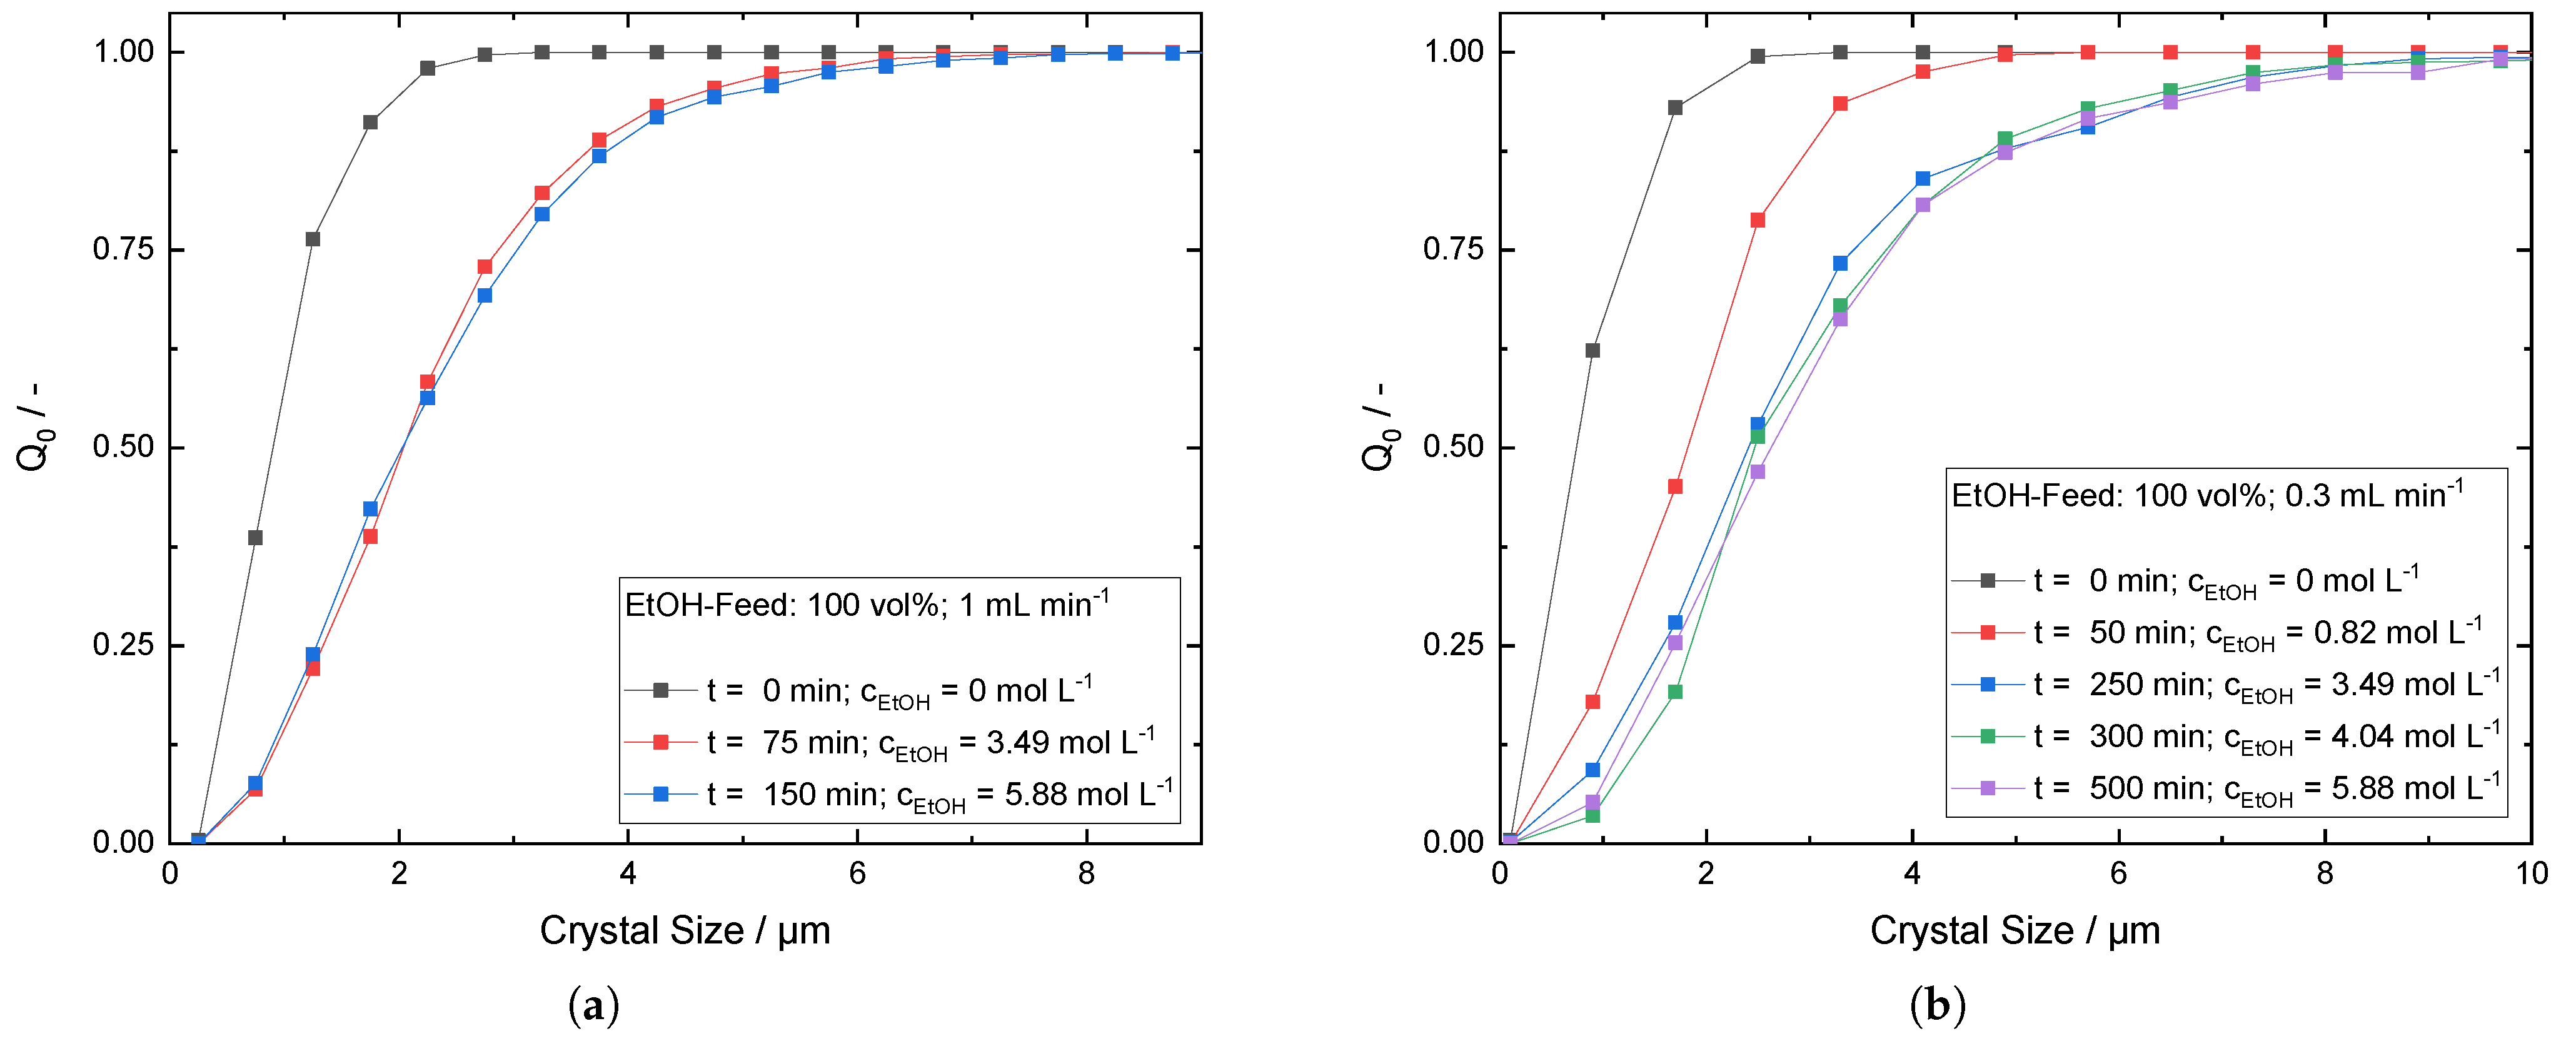
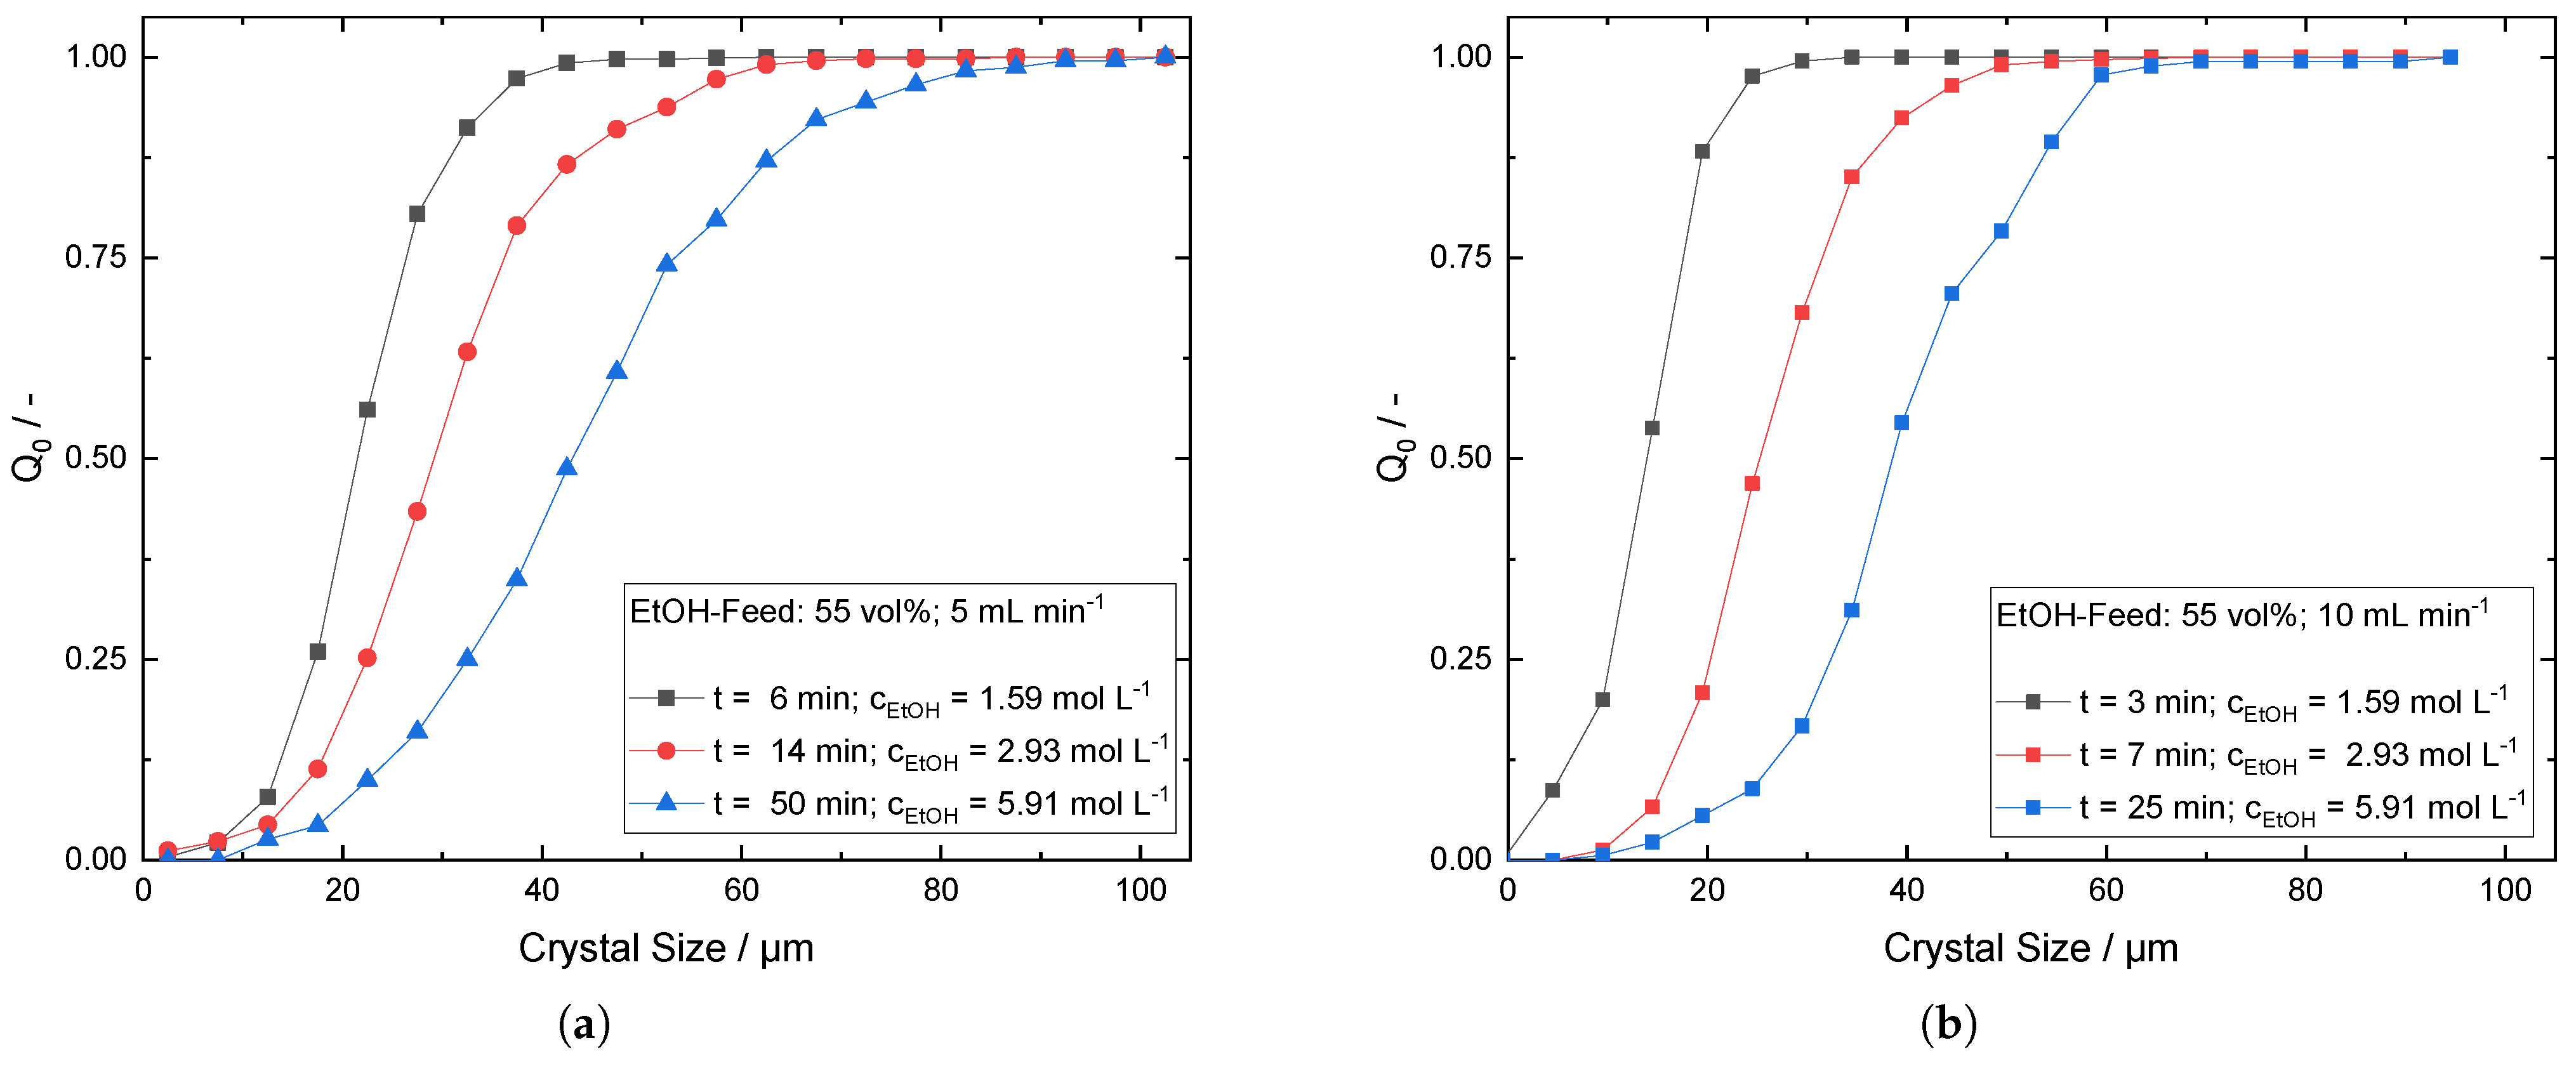
Appendix D. Cumulative Number Frequency Plots for Progressive CSD during Antisolvent Addition

Figure A9. CSD as relative cumulative number frequency from 100 vol% ethanol addition at (a) 1 mL min−1 and (b) 0.3 mL min−1.
Crystals 14 00094 g0a9
Figure A10. CSD as relative cumulative number frequency from 70 vol% ethanol addition at (a) 1 mL min−1 and (b) 2 mL min−1.
Crystals 14 00094 g0a10
Figure A11. CSD as relative cumulative number frequency from 55 vol% ethanol addition at (a) 5 mL min−1 and (b) 10 mL min−1.
Crystals 14 00094 g0a11

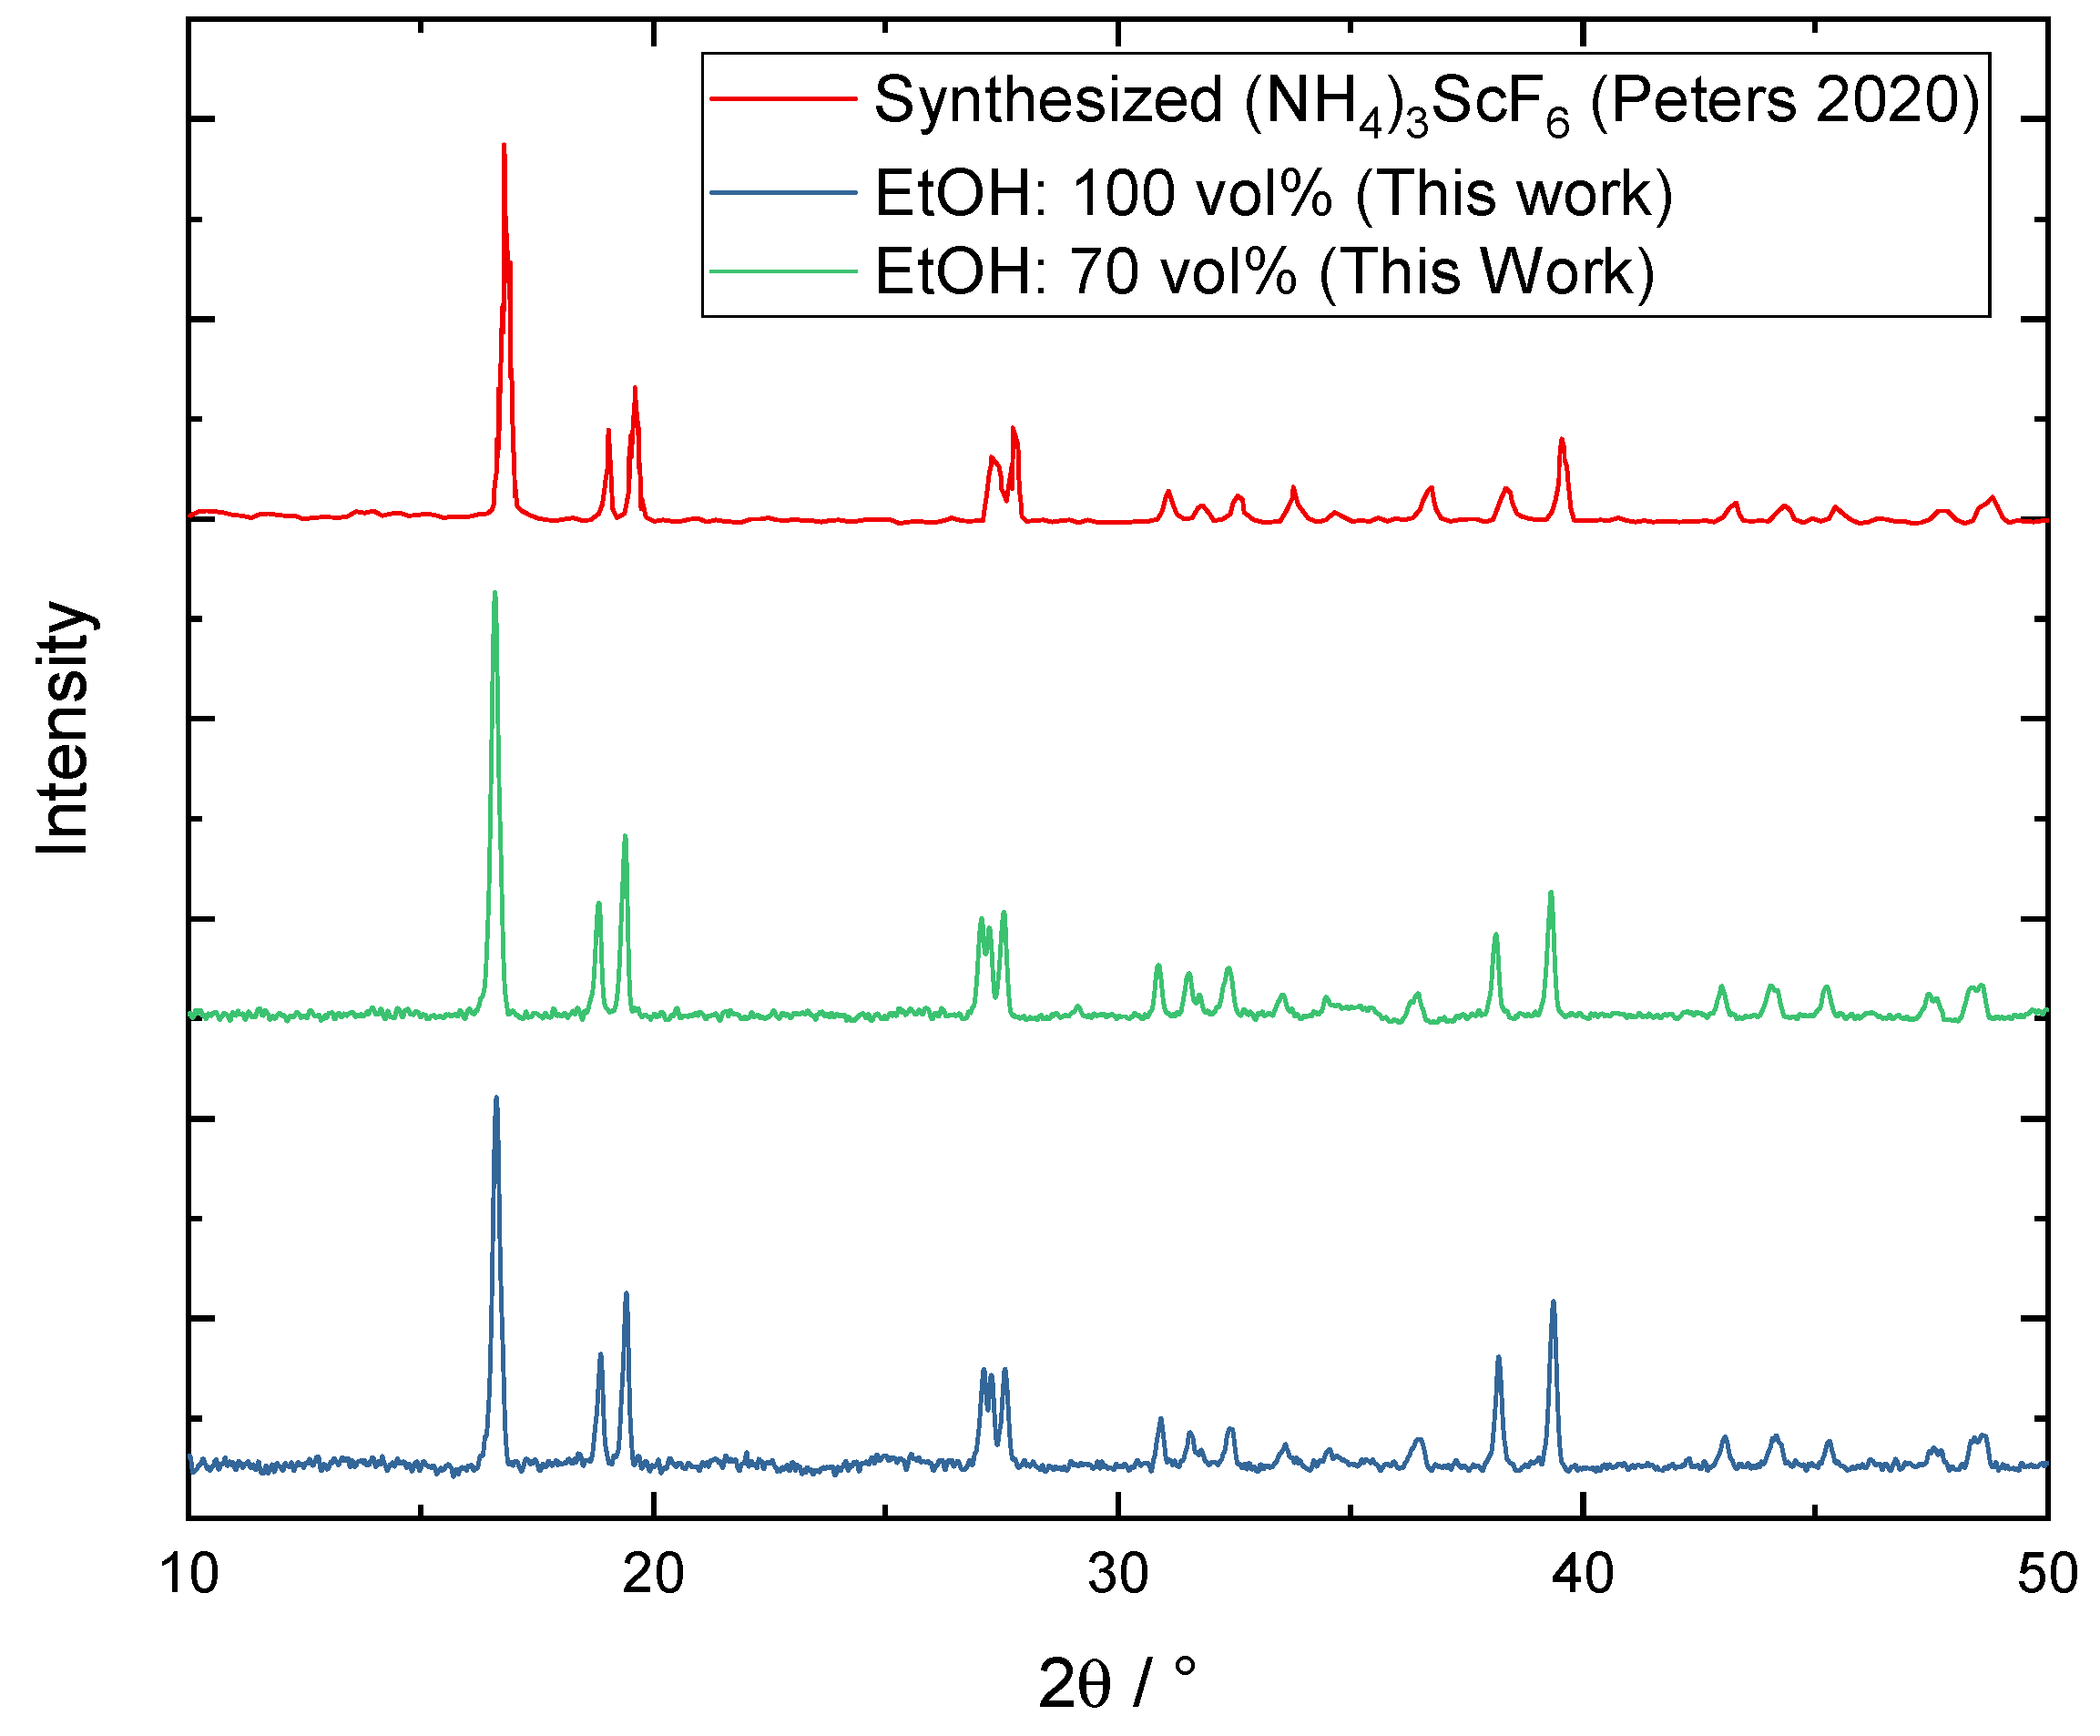
Appendix E. XRD Measurement

An X-ray diffraction analysis (XRD) of dried crystals each from 100 vol% and 70 vol% has been conducted on diffractometer (STOE & Cie STADI-P) in Guinier geometry with Cu-K α 1-rays ( λ = 1.54059 Å) with steps of 0.005°. For the measurement of the intensity, an image plate detector (STOE IP-PSD) was used. All three measurements show matching peaks confirming the salt form (NH4)3ScF6.
Figure A12. XRD measurements of the crystalized scandium salt from two ramdom samples of 100 vol% and 70 vol% ethanol addition experiments compared to a measurement of synthesized (NH4)3ScF6 from literature [13].
Crystals 14 00094 g0a12

References

  1. Sibanda, J.; Chivavava, J.; Lewis, A.E. Crystal Engineering in Antisolvent Crystallization of Rare Earth Elements (REEs). Minerals 2022, 12, 1554. [Google Scholar] [CrossRef]
  2. Ma, Y.; Svärd, M.; Xiao, X.; Gardner, J.M.; Olsson, R.T.; Forsberg, K. Precipitation and Crystallization Used in the Production of Metal Salts for Li-Ion Battery Materials: A Review. Metals 2020, 10, 1609. [Google Scholar] [CrossRef]
  3. Riva, S.; Yusenko, K.V.; Lavery, N.P.; Jarvis, D.J.; Brown, S.G.R. The scandium effect in multicomponent alloys. Int. Mater. Rev. 2016, 61, 203–228. [Google Scholar] [CrossRef]
  4. Binnemans, K.; Jones, P.T.; Müller, T.; Yurramendi, L. Rare Earths and the Balance Problem: How to Deal with Changing Markets? J. Sustain. Metall. 2018, 4, 126–146. [Google Scholar] [CrossRef]
  5. European Commission. Critical Raw Materials Resilience: Charting a Path towards Greater Security and Sustainability; European Commission: Brussels, Belgium, 2020. [Google Scholar]
  6. Department of the Interior. Draft List of Critical Minerals; Federal Register the Daily Journal of the United States Government: Washington, DC, USA, 2018. [Google Scholar]
  7. Alkan, G.; Yagmurlu, B.; Cakmakoglu, S.; Hertel, T.; Kaya, Ş.; Gronen, L.; Stopic, S.; Friedrich, B. Novel Approach for Enhanced Scandium and Titanium Leaching Efficiency from Bauxite Residue with Suppressed Silica Gel Formation. Sci. Rep. 2018, 8, 5676. [Google Scholar] [CrossRef] [PubMed]
  8. Wang, W.; Cheng, C.Y. Separation and purification of scandium by solvent extraction and related technologies: A review. J. Chem. Technol. Biotechnol. 2011, 86, 1237–1246. [Google Scholar] [CrossRef]
  9. Wang, W.; Pranolo, Y.; Cheng, C.Y. Recovery of scandium from synthetic red mud leach solutions by solvent extraction with D2EHPA. Sep. Purif. Technol. 2013, 108, 96–102. [Google Scholar] [CrossRef]
  10. Yagmurlu, B.; Dittrich, C.; Friedrich, B. Effect of Aqueous Media on the Recovery of Scandium by Selective Precipitation. Metals 2018, 8, 314. [Google Scholar] [CrossRef]
  11. Peters, E.; Dittrich, C.; Kaya, S.; Forsberg, K. Crystallization of a Pure Scandium Phase from Solvent Extraction Strip Liquors. In Extraction 2018; Davis, B.R., Moats, M.S., Wang, S., Gregurek, D., Kapusta, J., Battle, T.P., Schlesinger, M.E., Alvear Flores, G.R., Jak, E., Goodall, G., et al., Eds.; The Minerals, Metals & Materials Series; Springer International Publishing: Cham, Switzerland, 2018; Volume 7, pp. 2707–2713. [Google Scholar] [CrossRef]
  12. Peters, E.M.; Kaya, Ş.; Dittrich, C.; Forsberg, K. Recovery of Scandium by Crystallization Techniques. J. Sustain. Metall. 2019, 5, 48–56. [Google Scholar] [CrossRef]
  13. Peters, E.M.; Svärd, M.; Forsberg, K. Phase equilibria of ammonium scandium fluoride phases in aqueous alcohol mixtures for metal recovery by anti-solvent crystallization. Sep. Purif. Technol. 2020, 252, 117449. [Google Scholar] [CrossRef]
  14. Kaya, Ş.; Peters, E.; Forsberg, K.; Dittrich, C.; Stopic, S.; Friedrich, B. Scandium Recovery from an Ammonium Fluoride Strip Liquor by Anti-Solvent Crystallization. Metals 2018, 8, 767. [Google Scholar] [CrossRef]
  15. Tonn, J.; Grotjohann, A.; Kocks, C.; Jupke, A. Nucleation Kinetics of Rare Earth Scandium Salt: An Experimental Investigation of the Metastable Zone Width. Crystals 2023, 13, 1074. [Google Scholar] [CrossRef]
  16. Kodera, T.; Kobari, M.; Hirasawa, I. Modeling and Growth Kinetics of Antisolvent Crystallization Applied to the Pharmaceutical Industry. Chem. Eng. Technol. 2019, 42, 1458–1465. [Google Scholar] [CrossRef]
  17. Nowee, S.M.; Abbas, A.; Romagnoli, J.A. Model-Based Optimal Strategies for Controlling Particle Size in Antisolvent Crystallization Operations. Cryst. Growth Des. 2008, 8, 2698–2706. [Google Scholar] [CrossRef]
  18. Lindenberg, C.; Krättli, M.; Cornel, J.; Mazzotti, M.; Brozio, J. Design and Optimization of a Combined Cooling/Antisolvent Crystallization Process. Cryst. Growth Des. 2009, 9, 1124–1136. [Google Scholar] [CrossRef]
  19. O’Grady, D.; Barrett, M.; Casey, E.; Glennon, B. The Effect of Mixing on the Metastable Zone Width and Nucleation Kinetics in the Anti-Solvent Crystallization of Benzoic Acid. Chem. Eng. Res. Des. 2007, 85, 945–952. [Google Scholar] [CrossRef]
  20. Barrett, M.; O’Grady, D.; Casey, E.; Glennon, B. The role of meso-mixing in anti-solvent crystallization processes. Chem. Eng. Sci. 2011, 66, 2523–2534. [Google Scholar] [CrossRef]
  21. Alvarez, A.J.; Myerson, A.S. Continuous Plug Flow Crystallization of Pharmaceutical Compounds. Cryst. Growth Des. 2010, 10, 2219–2228. [Google Scholar] [CrossRef]
  22. Ridder, B.J.; Majumder, A.; Nagy, Z.K. Population Balance Model-Based Multiobjective Optimization of a Multisegment Multiaddition (MSMA) Continuous Plug-Flow Antisolvent Crystallizer. Ind. Eng. Chem. Res. 2014, 53, 4387–4397. [Google Scholar] [CrossRef]
  23. Lee, J.; Ashokkumar, M.; Kentish, S.E. Influence of mixing and ultrasound frequency on antisolvent crystallisation of sodium chloride. Ultrason. Sonochem. 2014, 21, 60–68. [Google Scholar] [CrossRef]
  24. Chen, D.; Wang, B.; Sirkar, K.K. Hydrodynamic modeling of porous hollow fiber anti-solvent crystallizer for continuous production of drug crystals. J. Membr. Sci. 2018, 556, 185–195. [Google Scholar] [CrossRef]
  25. Tuo, L.; Ruan, X.; Xiao, W.; Li, X.; He, G.; Jiang, X. A novel hollow fiber membrane-assisted antisolvent crystallization for enhanced mass transfer process control. AIChE J. 2019, 65, 734–744. [Google Scholar] [CrossRef]
  26. Zarkadas, D.M.; Sirkar, K.K. Antisolvent crystallization in porous hollow fiber devices. Chem. Eng. Sci. 2006, 61, 5030–5048. [Google Scholar] [CrossRef]
  27. Baldyga, J.; Bourne, J.R. Interactions between mixing on various scales in stirred tank reactors. Chem. Eng. Sci. 1992, 47, 1839–1848. [Google Scholar] [CrossRef]
  28. Demirel, H.S.; Svärd, M.; Uysal, D.; Doğan, Ö.M.; Uysal, B.Z.; Forsberg, K. Antisolvent crystallization of battery grade nickel sulphate hydrate in the processing of lateritic ores. Sep. Purif. Technol. 2022, 286, 120473. [Google Scholar] [CrossRef]
  29. Peters, E.M.; Svärd, M.; Forsberg, K. Impact of process parameters on product size and morphology in hydrometallurgical antisolvent crystallization. CrystEngComm 2022, 24, 2851–2866. [Google Scholar] [CrossRef]
  30. He, K.; Gkioxari, G.; Dollár, P.; Girshick, R. Mask R-CNN. arXiv 2017, arXiv:1703.06870. [Google Scholar] [CrossRef]
  31. Sibirtsev, S.; Zhai, S.; Neufang, M.; Seiler, J.; Jupke, A. Mask R-CNN based droplet detection in liquid–liquid systems, Part 2: Methodology for determining training and image processing parameter values improving droplet detection accuracy. Chem. Eng. J. 2023, 473, 144826. [Google Scholar] [CrossRef]
  32. MacTaggart, R.S.; Nasr-El-Din, H.A.; Masliyah, J.H. Sample withdrawal from a slurry mixing tank. Chem. Eng. Sci. 1993, 48, 921–931. [Google Scholar] [CrossRef]
  33. Mersmann, A. Crystallization Technology Handbook, 2nd ed.; revised and expanded ed.; Dekker: New York, NY, USA, 2001. [Google Scholar]
  34. Mostafa Nowee, S.; Abbas, A.; Romagnoli, J.A. Antisolvent crystallization: Model identification, experimental validation and dynamic simulation. Chem. Eng. Sci. 2008, 63, 5457–5467. [Google Scholar] [CrossRef]
  35. Sviridova, T.A.; Sokolova, Y.V.; Pirozhenko, K.Y. Crystal structure of (NH4)5Sc3F14. Crystallogr. Rep. 2013, 58, 220–225. [Google Scholar] [CrossRef]
Figure 1. Setup of fed-batch antisolvent crystallizer with 300 mL starting volume: (1) Crystallizer with temperature jacket, (2) temperature probe, (3) antisolvent injection nozzle, (4) pulsation damper, (5) pitched blade stirrer with four blades, (6) membrane pump, (7) antisolvent storage tank.
Crystals 14 00094 g001
Figure 2. Transfer learning of the MRCNN neural network for crystal detection on SEM images.
Crystals 14 00094 g002
Figure 3. Mask R-CNN detects crystals on SEM images and draws masks. From the information on the masks, the longest diagonal is calculated for each crystal.
Crystals 14 00094 g003
Figure 4. The overview of CSD over the AS addition rate for antisolvent variations of 100 vol% ethanol in red, 70 vol% ethanol in dark blue, and 55 vol% ethanol in light blue.
Crystals 14 00094 g004
Figure 5. The CSD of experiments from 10 mL min−1 in green, 5 mL min−1 in yellow and 1 mL min−1 in grey over the AS dilution. Lines are only a guide for the eye.
Crystals 14 00094 g005
Figure 6. Representative SEM images of each experiment from the end of each run. The images are sorted from lowest to highest antisolvent addition rate (left to right) and from 100 vol% to 55 vol% ethanol addition (top to bottom). Notice the change in magnification.
Crystals 14 00094 g006
Figure 7. The mean diameter during several crystallization experiments for different addition rates and dilutions of the antisolvent. The change in the mean diameter over time (a). The same values as in (a) but plotted over the ethanol concentration in the crystallizer (b).
Crystals 14 00094 g007
Figure 8. The linear growth rate calculated from the mean diameter of the measured CSD and the approximated growth kinetic based on the power law.
Crystals 14 00094 g008
Figure 9. The amount of scandium salt in solution during the addition of antisolvent at varying addition rates and ethanol dilutions. The grey line indicates the SLE, and the dashed lines represent the corresponding MSZW measured in a previous work [15]. Lines between markers are guides for the eye only. Experiments with 70 vol% of ethanol (a), experiments with 55 vol% of ethanol (b) and experiments with 100 vol% of ethanol (c).
Crystals 14 00094 g009
Figure 10. The specific production rate for the scandium salt (NH4)3ScF6 (a) contrasting the crystal growth represented by the mean diameter (b).
Crystals 14 00094 g010
Figure 11. Comparison of the mean diameter over the volume specific ethanol addition rate between a starting volume of approximately 20 mL [29] and 300 mL (this work).
Crystals 14 00094 g011
Disclaimer/Publisher’s Note: The statements, opinions and data contained in all publications are solely those of the individual author(s) and contributor(s) and not of MDPI and/or the editor(s). MDPI and/or the editor(s) disclaim responsibility for any injury to people or property resulting from any ideas, methods, instructions or products referred to in the content.

