Article

Biaxial Very High Cycle Fatigue Testing and Failure Mechanism of Welded Joints in Structural Steel Q345

1
Science and Technology Research Center, China Yangtze Power Corp. (CYPC), Wuhan 440010, China
2
Key Laboratory of Deep Earth Science and Engineering, Ministry of Education, College of Architecture and Environment, Sichuan University, Chengdu 610065, China
*
Authors to whom correspondence should be addressed.
Crystals 2024, 14(10), 850; https://doi.org/10.3390/cryst14100850
Submission received: 19 September 2024 / Revised: 26 September 2024 / Accepted: 27 September 2024 / Published: 28 September 2024
(This article belongs to the Special Issue Advanced High-Strength Steel)

Abstract

:
The very high cycle fatigue (VHCF) strength of welded joints made of high-strength structural materials is generally poor, which poses a serious threat to the long life and reliability of the structural components. This work employs an ultrasonic vibration fatigue testing system to investigate the biaxial fatigue failure mechanism of the welded joints. The results revealed that under uniaxial loading conditions, the propensity for fatigue failure in plate specimens was predominantly observed at the specimen surface. Regardless of whether under uniaxial or biaxial loading, the initiation of fatigue cracks in cruciform joints was consistently traced back to unfused flaws, which were primarily located at the interface between the solder and the base material. Concurrently, it was noted that the fatigue strength of cruciform joints under biaxial loading was merely 44.4% of that under uniaxial loading. The geometric peculiarities of the unfused defects led to severe stress concentrations, which significantly reduced the fatigue life of the material under biaxial loading conditions.

1. Introduction

In engineering structures such as rail vehicle bodies, bridges, and offshore drilling platforms, welding is the predominant method of connection [1]. Many welded joints are subjected to cyclic loads exceeding one billion cycles during their service life, and the fracture of welded joints is a frequent occurrence, with approximately 90% attributed to fatigue failure [2,3]. However, current fatigue design guidelines and testing methods typically regard the fatigue strength at 107 cycles as the fatigue limit, assuming that components will not experience fatigue failure when the applied loads are below this limit. This assumption is clearly insufficient to meet the safety requirements for components with an ultra-long service life [4,5]. Therefore, the study of the VHCF (VHCF) behavior of welded joints is of significant engineering importance to ensure the reliability and safety of structures.
The microstructure within the welded joint region exhibits heterogeneity, and the fusion zone internally contains a multitude of defects, such as porosity, lack of fusion, and inclusions. The combined effect of this microstructural heterogeneity and internal defects significantly reduces the fatigue performance of welded joints in comparison to the parent material [6,7,8]. The research of Tsutsumi, S et al. also confirmed this view [9]. Under typical conditions, microstructural heterogeneity leads to an uneven distribution of plastic deformation during tensile and low-cycle fatigue [10]. However, its contribution to VHCF failure is limited. In VHCF, the applied loads are typically well below the lowest yield strength of the different regions within the welded joint, resulting in a very slow accumulation of macroscopic plastic strain [11]. Concurrently, internal geometric defects formed during the welding process are more prone to initiate VHCF cracks than microstructural heterogeneity [12,13], thus leading to the final fatigue failure of the welded joints. In cross-welding, the stress concentration caused by the weld toe will also have a great impact on the fatigue strength of the material [14].
Research on the VHCF of welded joints is currently very sparse. Experiments on the VHCF of arc-welded joints in structural steel have shown a significant reduction in fatigue life [15], primarily attributed to fatigue cracks propagating directly from defects, skipping the crack initiation phase. Wang QY et al. further investigated the local VHCF strength and failure behavior of the heat-affected zone and weld zone in Q345 steel welded joints [12,13], defining a damage variable based on changes in the natural frequency of the specimens to describe the damage process in welded joints. Zhu ML et al. studied the VHCF behavior of weld samples at a high temperature of 370 °C [16,17], finding that internal defects lead to cracking more readily under high temperatures and proposed a new model to explain the mechanism of fatigue crack initiation location shift caused by welding defects. The research conducted by Cremer M et al. on arc-welded joints of an AA6082 aluminum alloy reveals that the fatigue strength of the weld metal is lower than that of both the parent material and the heat-affected zone. Fatigue cracks primarily initiate from imperfections within the weld zone [18,19].
In service, welded structures typically experience multiaxial loads. However, existing research on the VHCF behavior of welded joints has primarily been conducted under uniaxial loading conditions due to the experimental challenges associated with biaxial loading. This work aims to use an ultrasonic vibration fatigue testing method to perform VHCF tests on the welded joints of the high-strength structural steel Q345 under biaxial loading, investigating the initiation modes of fatigue cracks and analyzing the failure mechanisms under biaxial stress states. The findings of this study hold significant value for assessing the strength and estimating the lifespan of welded joints.

2. Experimental Setup

2.1. Ultrasonic Fatigue Testing

Ultrasonic vibration fatigue testing is recognized as one of the most effective methods for studying the VHCF behavior of materials. The principles of ultrasonic vibration fatigue loading, which include an ultrasonic generator, transducer, and vibration displacement amplifier, have been comprehensively explicated in existing literature [20,21]. During uniaxial ultrasonic vibration loading, the specimen is required to maintain its longitudinal first-order natural frequency at 20 kHz, with maximum stress located at the midsection of the specimen. The applied stress amplitude is indirectly controlled by managing the vibration displacement. For biaxial loading, the ultrasonic fatigue testing system applies simultaneous tension-compression loading to a cruciform specimen in two perpendicular directions, as illustrated in Figure 1. To ensure loading precision, strain gauges were used to calibrate the loads in both perpendicular directions. The results demonstrate a very good linear relationship between the power output of the ultrasonic generator and the vibrational displacement, with a stress control error of less than 0.3%, meeting our predefined experimental requirements.
The KLA-iNano nanoindentation instrument is used to measure the hardness of the specimen. A small continuous load of about 0–50 mN will be loaded on the surface of the specimen, and the displacement under this load will be measured to calculate the hardness of the specimen [22].

2.2. Uniaxial and Biaxial Ultrasonic Fatigue Specimens

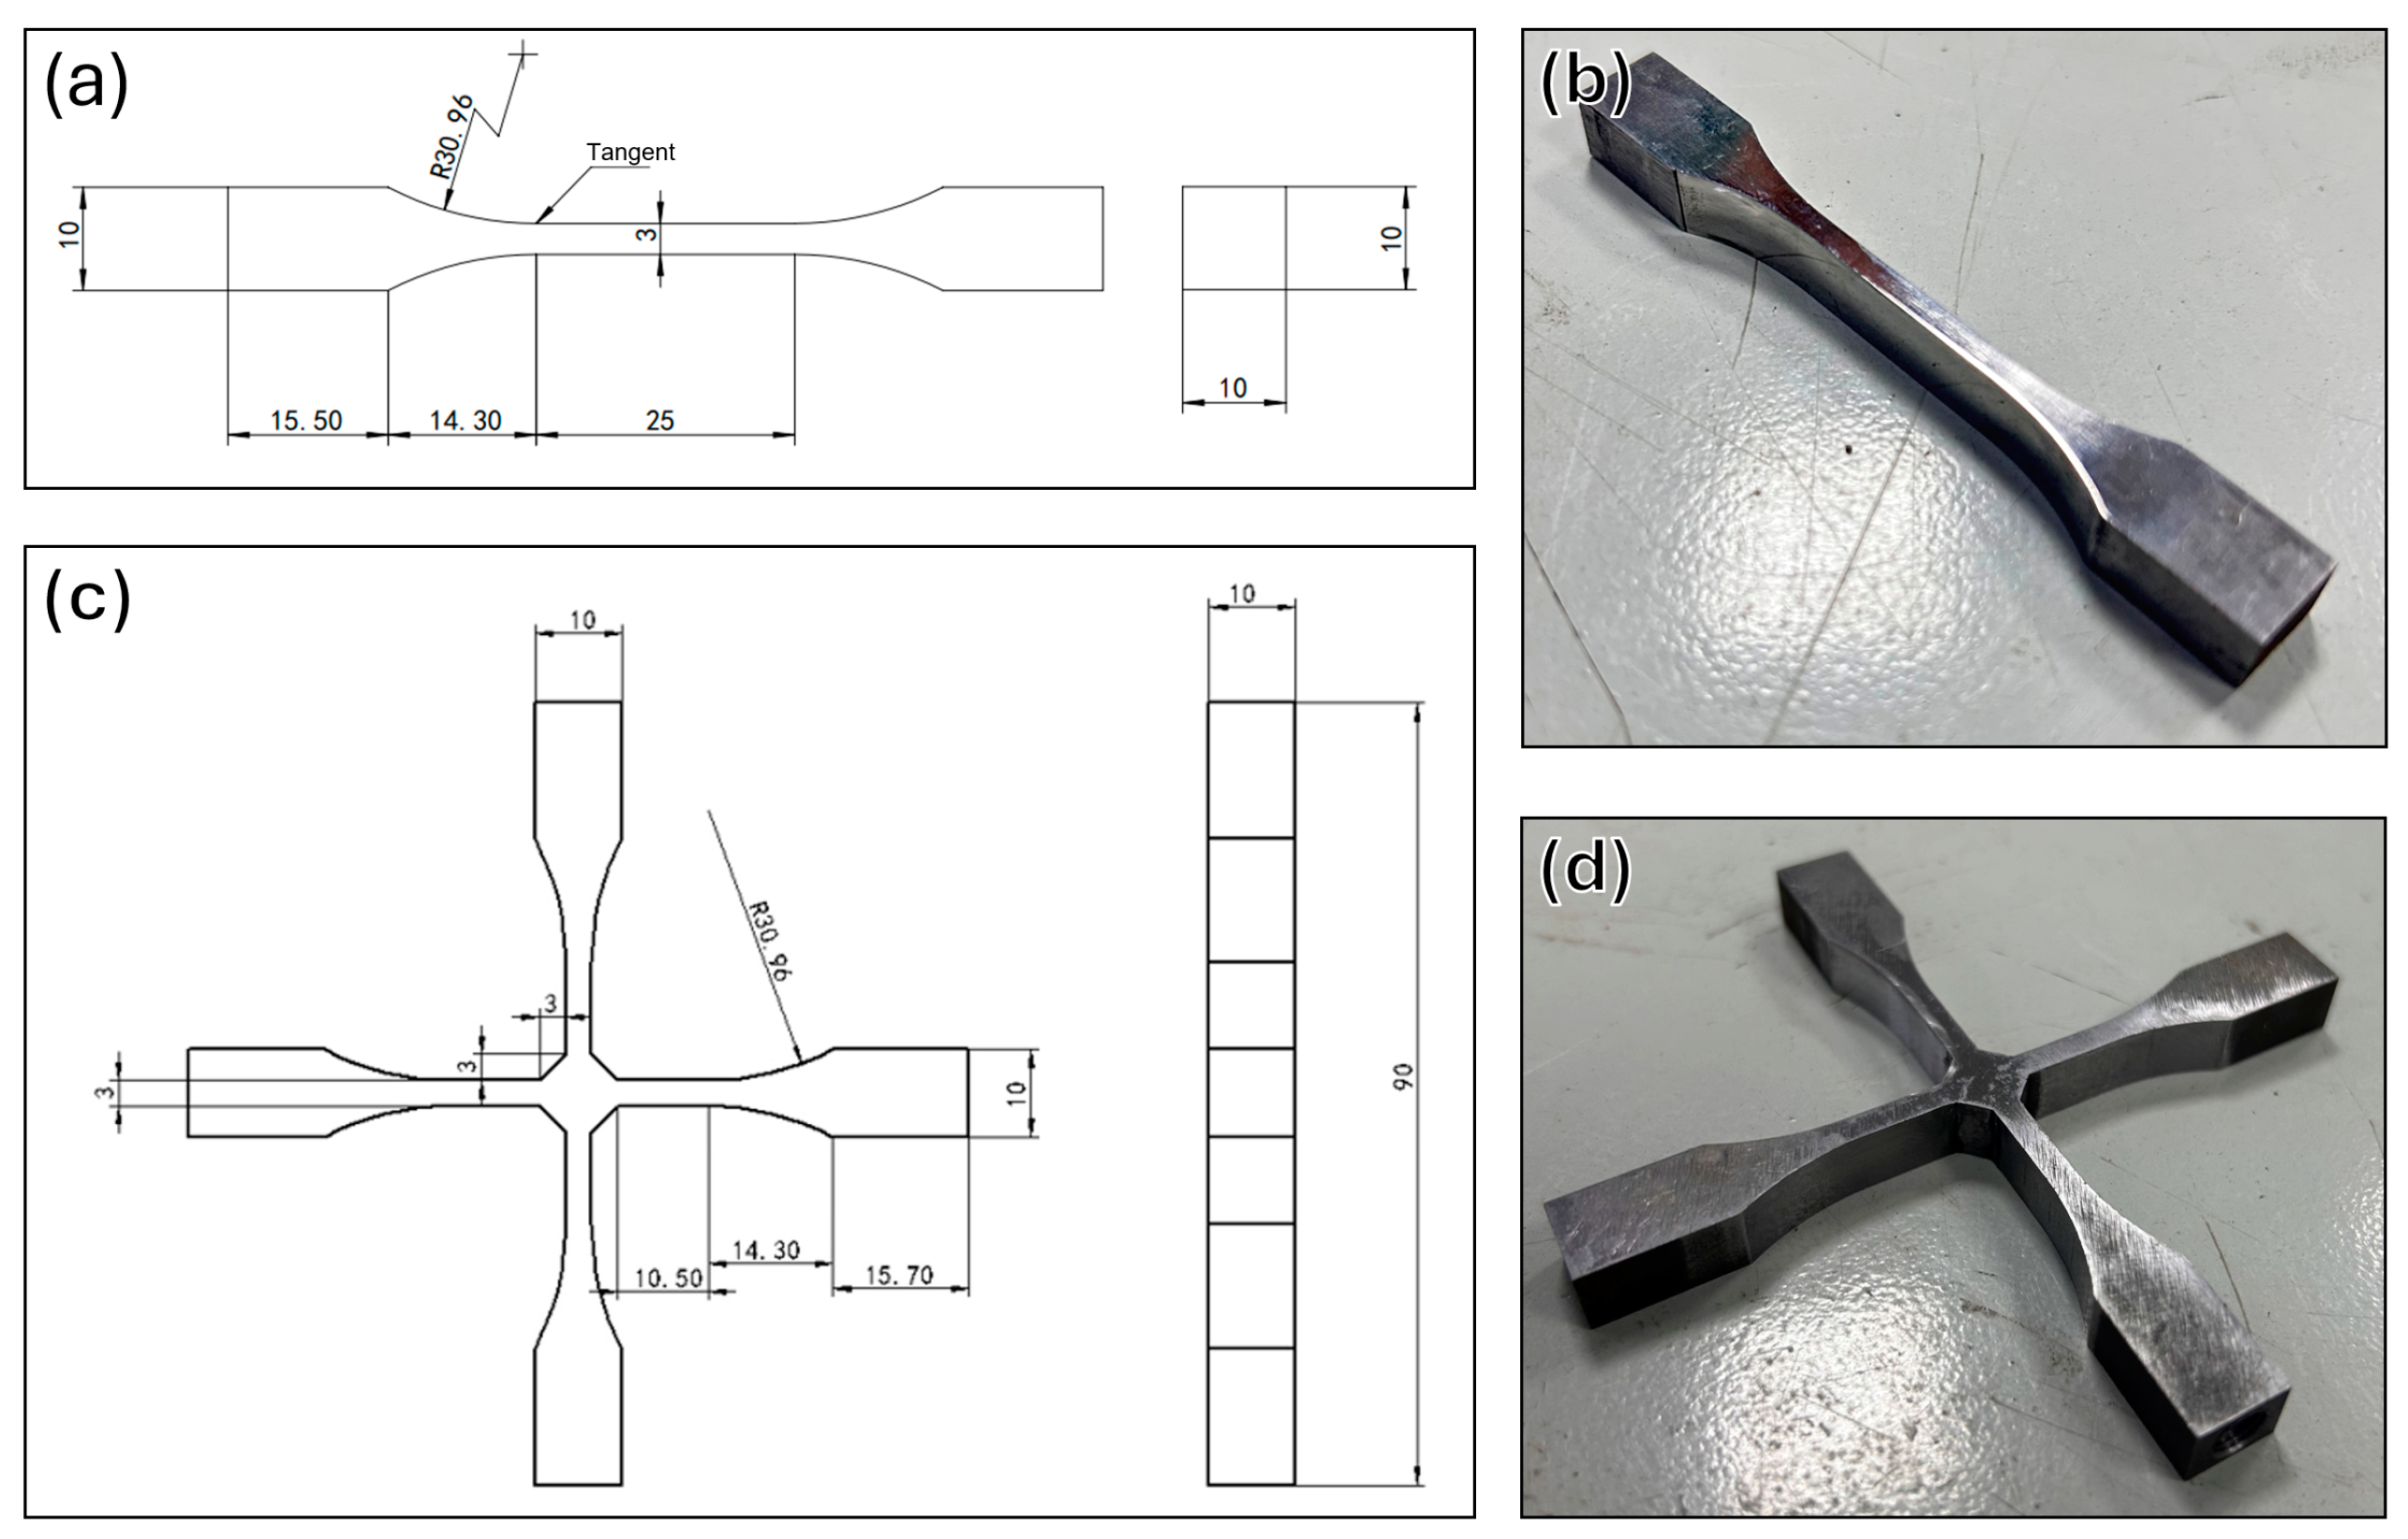
In this study, biaxial fatigue experiments on the welded joints of Q345 bridge steel were conducted to validate the effectiveness of the established experimental system. Initially, two 10 mm thick steel plates were butt welded using the Tungsten Inert Gas (TIG) welding technique with parameters set at a current of 600 A, voltage of 32 V, and a welding speed of 35~45 cm/min. After welding, the excess weld reinforcement was completely removed to eliminate the stress concentration caused by geometric discontinuities, which could affect fatigue strength test results. Fatigue specimens were extracted from the welded joint with their axial direction perpendicular to the weld seam, ensuring the weld was centered in the middle of the specimen’s cross-section. The ultrasonic fatigue test imposes strict requirements on the specimen’s natural frequency. Accordingly, this study derived theoretical constraints for the dimensions of the flat plate specimens to meet the resonance frequency criteria. The one-dimensional wave equation can be used to calculate the resonance length of the test specimen, which can satisfy the specific resonance frequency [23]. Figure 2a,b presents the finalized dimensions of the plate specimens and the actual fabricated samples, respectively. Determining the precise dimensions for the cruciform specimens required for biaxial loading is challenging, particularly due to the retention of a triangular weld reinforcement with a side length of 3 mm in the welded area. Therefore, building upon the theoretical dimensions of plate specimens, this study employed finite element analysis (FEA) to finalize the geometric dimensions of the cruciform specimens that satisfy the resonance conditions in both directions. The specific geometric dimensions and the photographs of actual machined specimens are illustrated in Figure 2c and d, respectively.
To maintain uniform stress levels across different regions of the welded joint, including the base metal, heat-affected zone, and fusion zone, during loading, the length of the middle cross-section of the specimen was set to 25 mm for plate and 30 mm for cruciform specimens. The modal analysis of the longitudinal vibration state of the specimen was carried out by using the commercial finite element software (Abaqus, 2022 HF4), in which the boundary conditions are completely free, the material is set to the linear elastic relationship, and the mesh size is 0.05 mm. As shown in Figure 3a,b, the results indicate that the stress levels across the middle cross-sectional segment of the specimen are relatively uniform, ensuring that different regions of the welded joint are subjected to the same stress state. For the cruciform welded joint specimens, the weld reinforcement in the middle part shares some of the local stresses, resulting in the highest stress concentrations near the weld reinforcement in the corresponding cross-sectional segment.
In this study, the stress applied to the specimens was defined as the nominal stress across the middle cross-sectional segment rather than the local stress. This approach facilitates the comparison of fatigue strength between two types of joint specimens under uniaxial and multiaxial loading conditions.

2.3. Fatigue Testing and Failure Analysis

The ultrasonic fatigue tests in this study were conducted at a loading frequency of 20 kHz under ambient temperature conditions. To control the temperature rise on the specimen surface, compressed cooling air was used throughout the test to ensure that the surface temperature did not exceed 30 °C. The working frequency of the ultrasonic fatigue testing system was maintained with precision within the range of 20 ± 0.5 kHz. As the test progressed, if fatigue cracks appeared and propagated to a certain extent, the working frequency of the system would decrease accordingly. The specimen was considered to have experienced fatigue failure when the system frequency dropped below 19.5 kHz. The plate specimens were subjected to uniaxial tensile-compressive cyclic loading with a stress ratio of −1. The fatigue testing for cruciform specimens was divided into two sets: one under uniaxial cyclic loading and the other under biaxial symmetric tensile-compressive cyclic loading. This approach was designed to facilitate a comparative analysis of the effects of biaxial loading on fatigue strength and failure behavior.
Fracture analysis was carried out using a JSM-6510LV Scanning Electron Microscope (SEM) manufactured by JEOL Ltd. (Akishima, Japan), with an acceleration voltage set to 20 kV. Prior to observation, specimens were ultrasonically cleaned to remove dust and grease from the fracture surfaces. The fracture analysis focused on the detailed morphological characteristics of the crack initiation and propagation zones on the fatigue fracture surfaces, which is crucial for understanding the mechanisms of fatigue failure. Additionally, a three-dimensional morphological analysis of the fracture surface was conducted to establish the relationship between local stress states and fracture morphology. The project utilized a high-precision confocal optical microscope (Alicona’s IFM-G5, Besançon, France) to observe the fatigue crack initiation zones, obtaining three-dimensional morphological features at the micrometer scale.

3. Results and Discussions

3.1. Microstructure and Hardness of the Welded Joint

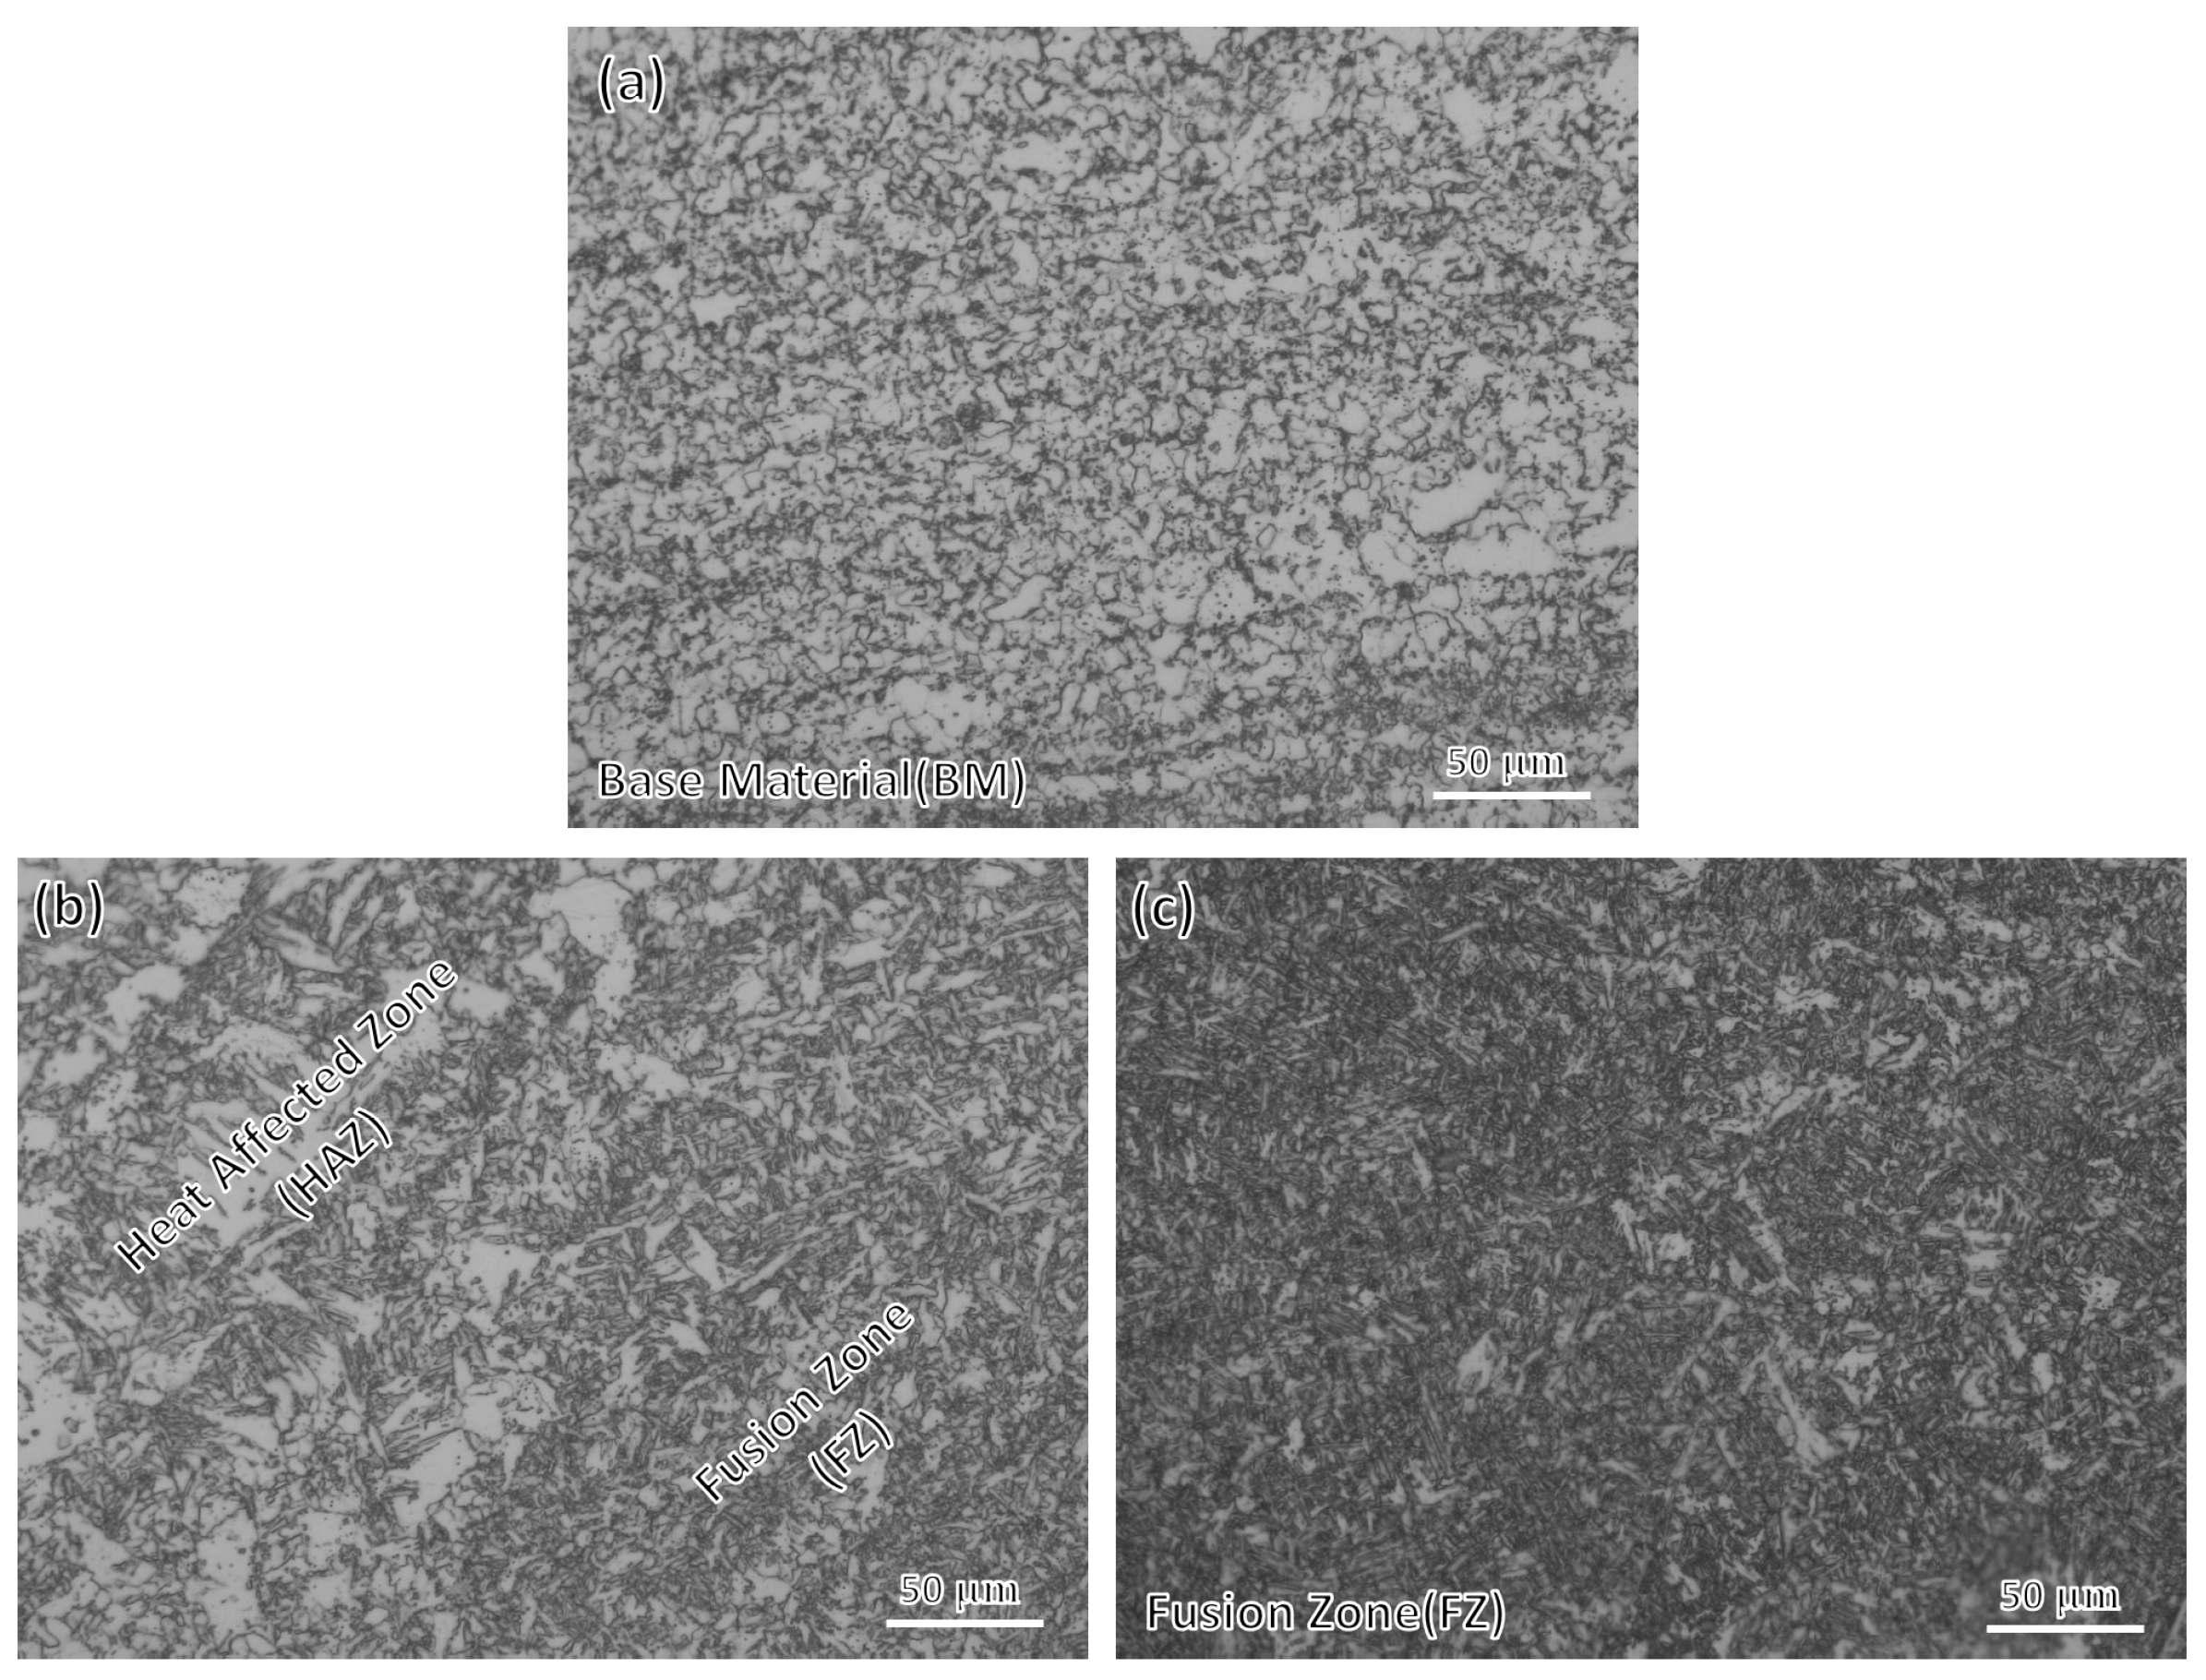
The microstructure of base material (BM) was mainly composed of equiaxed ferrite, as shown in Figure 4a. The grain morphology of the heat-affected zone did not change, which was consistent with that of the base material. Figure 4b illustrates the microstructural transition at the interface between the heat-affected zone and the fusion zone. Within this region, it was evident that the microstructure evolved from equiaxed grains to a dispersed lath-like configuration. For the fusion zone (Figure 4c), a Widmanstatten microstructure mixed with acicular ferrite and pearlite was formed by air cooling after austenitization.
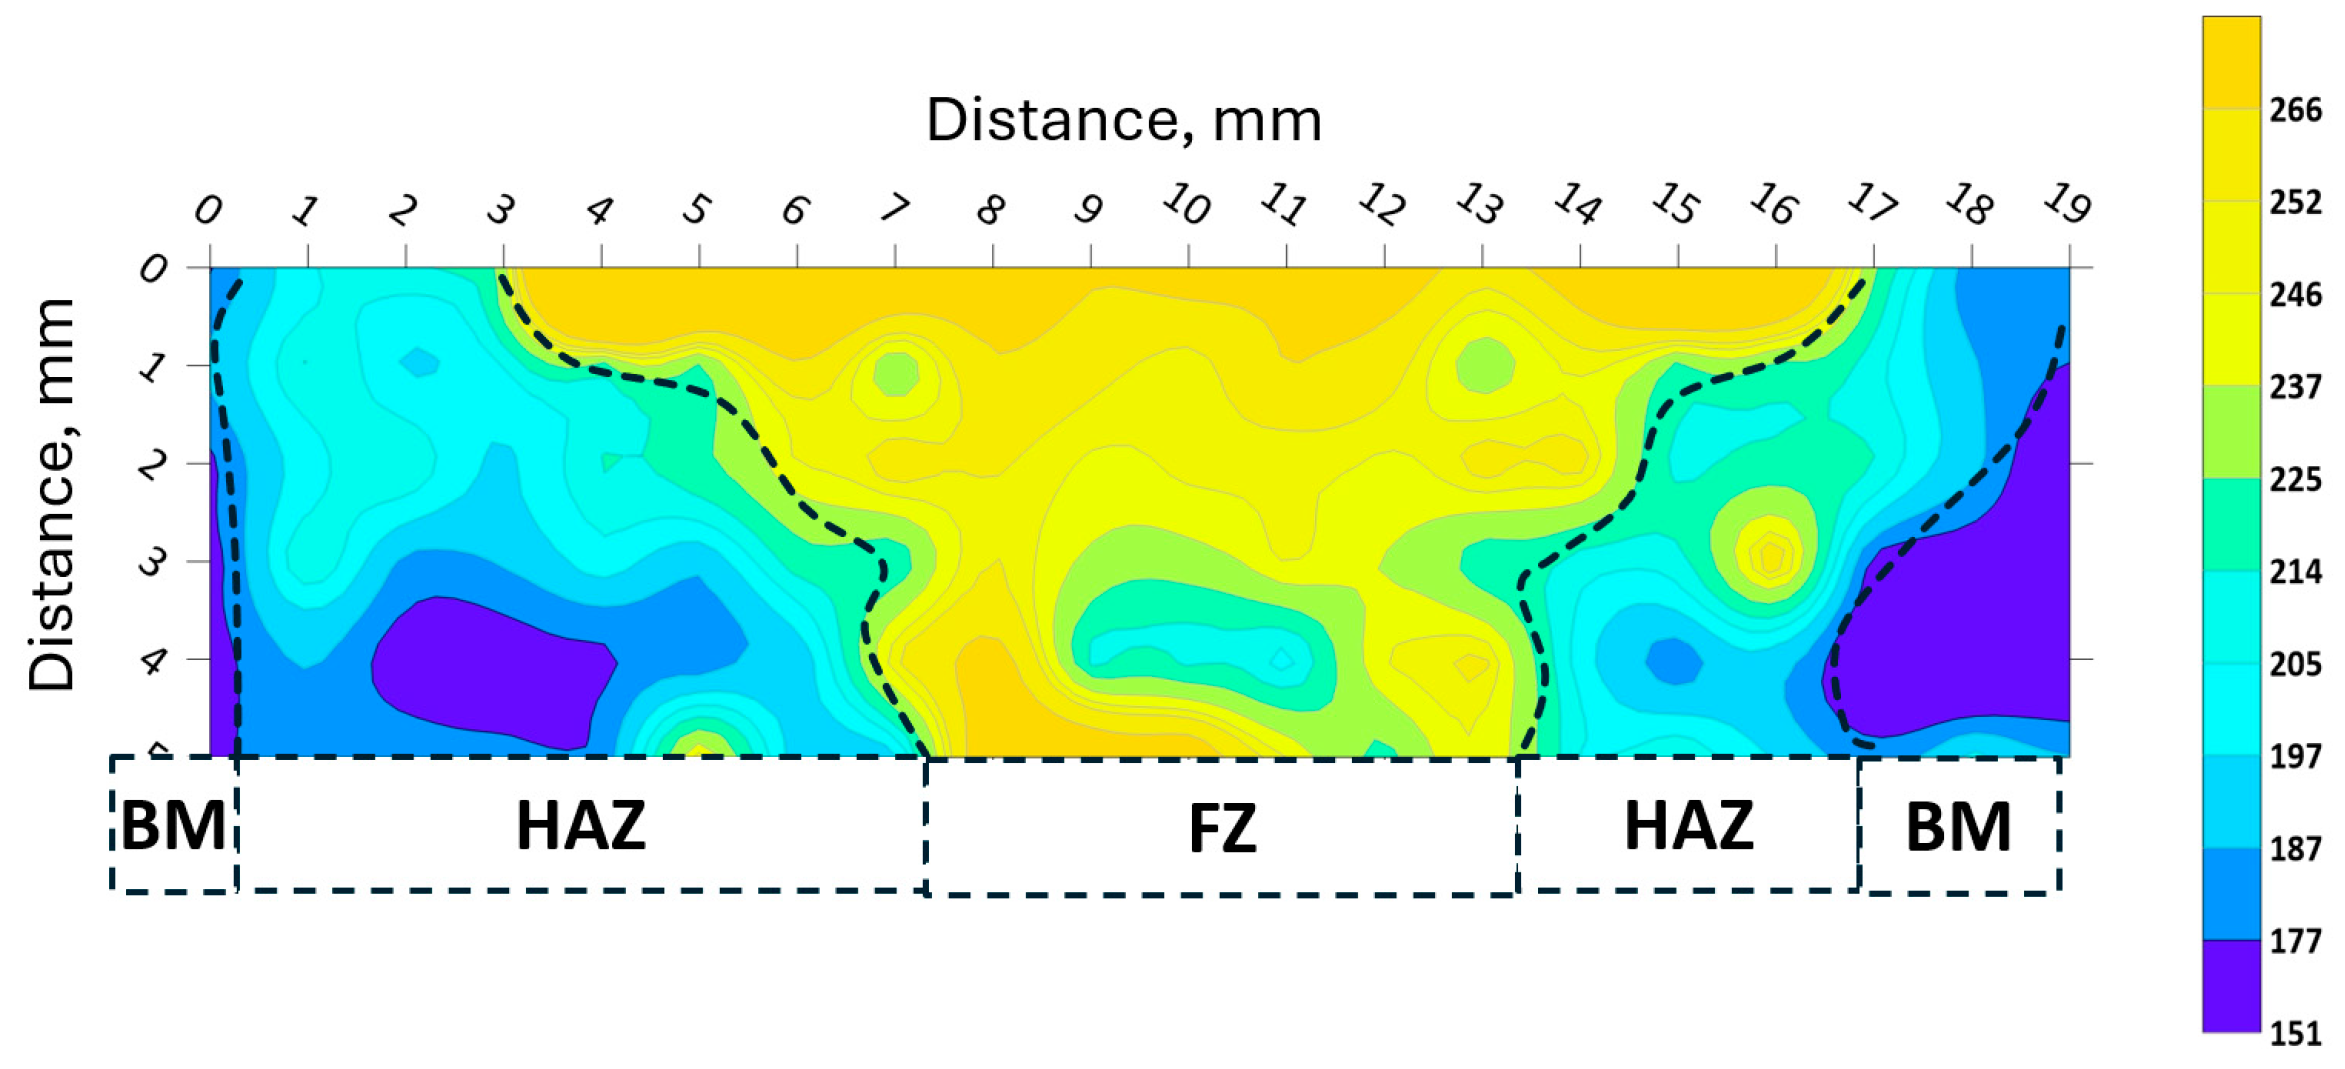
The different regions of the welded joint exhibited distinct microstructural morphologies, resulting in variations in local mechanical responses [24]. These variations can be assessed through hardness testing, which evaluates the local deformation capacity of the material. The full-field microhardness results for the entire welded joint region are presented in Figure 5. The fusion zone exhibited the highest hardness, reaching a Vickers hardness value of 272. The high-hardness region formed an inverted trapezoidal shape, clearly delineating the boundaries of the fusion zone, as indicated by the dashed lines in Figure 5. Flanking the fusion zone were the heat-affected zones, where hardness gradually decreased with proximity to the base material. The base material exhibited the lowest hardness in the weld region, with a Vickers hardness value of approximately 150.

3.2. Fatigue Testing Results

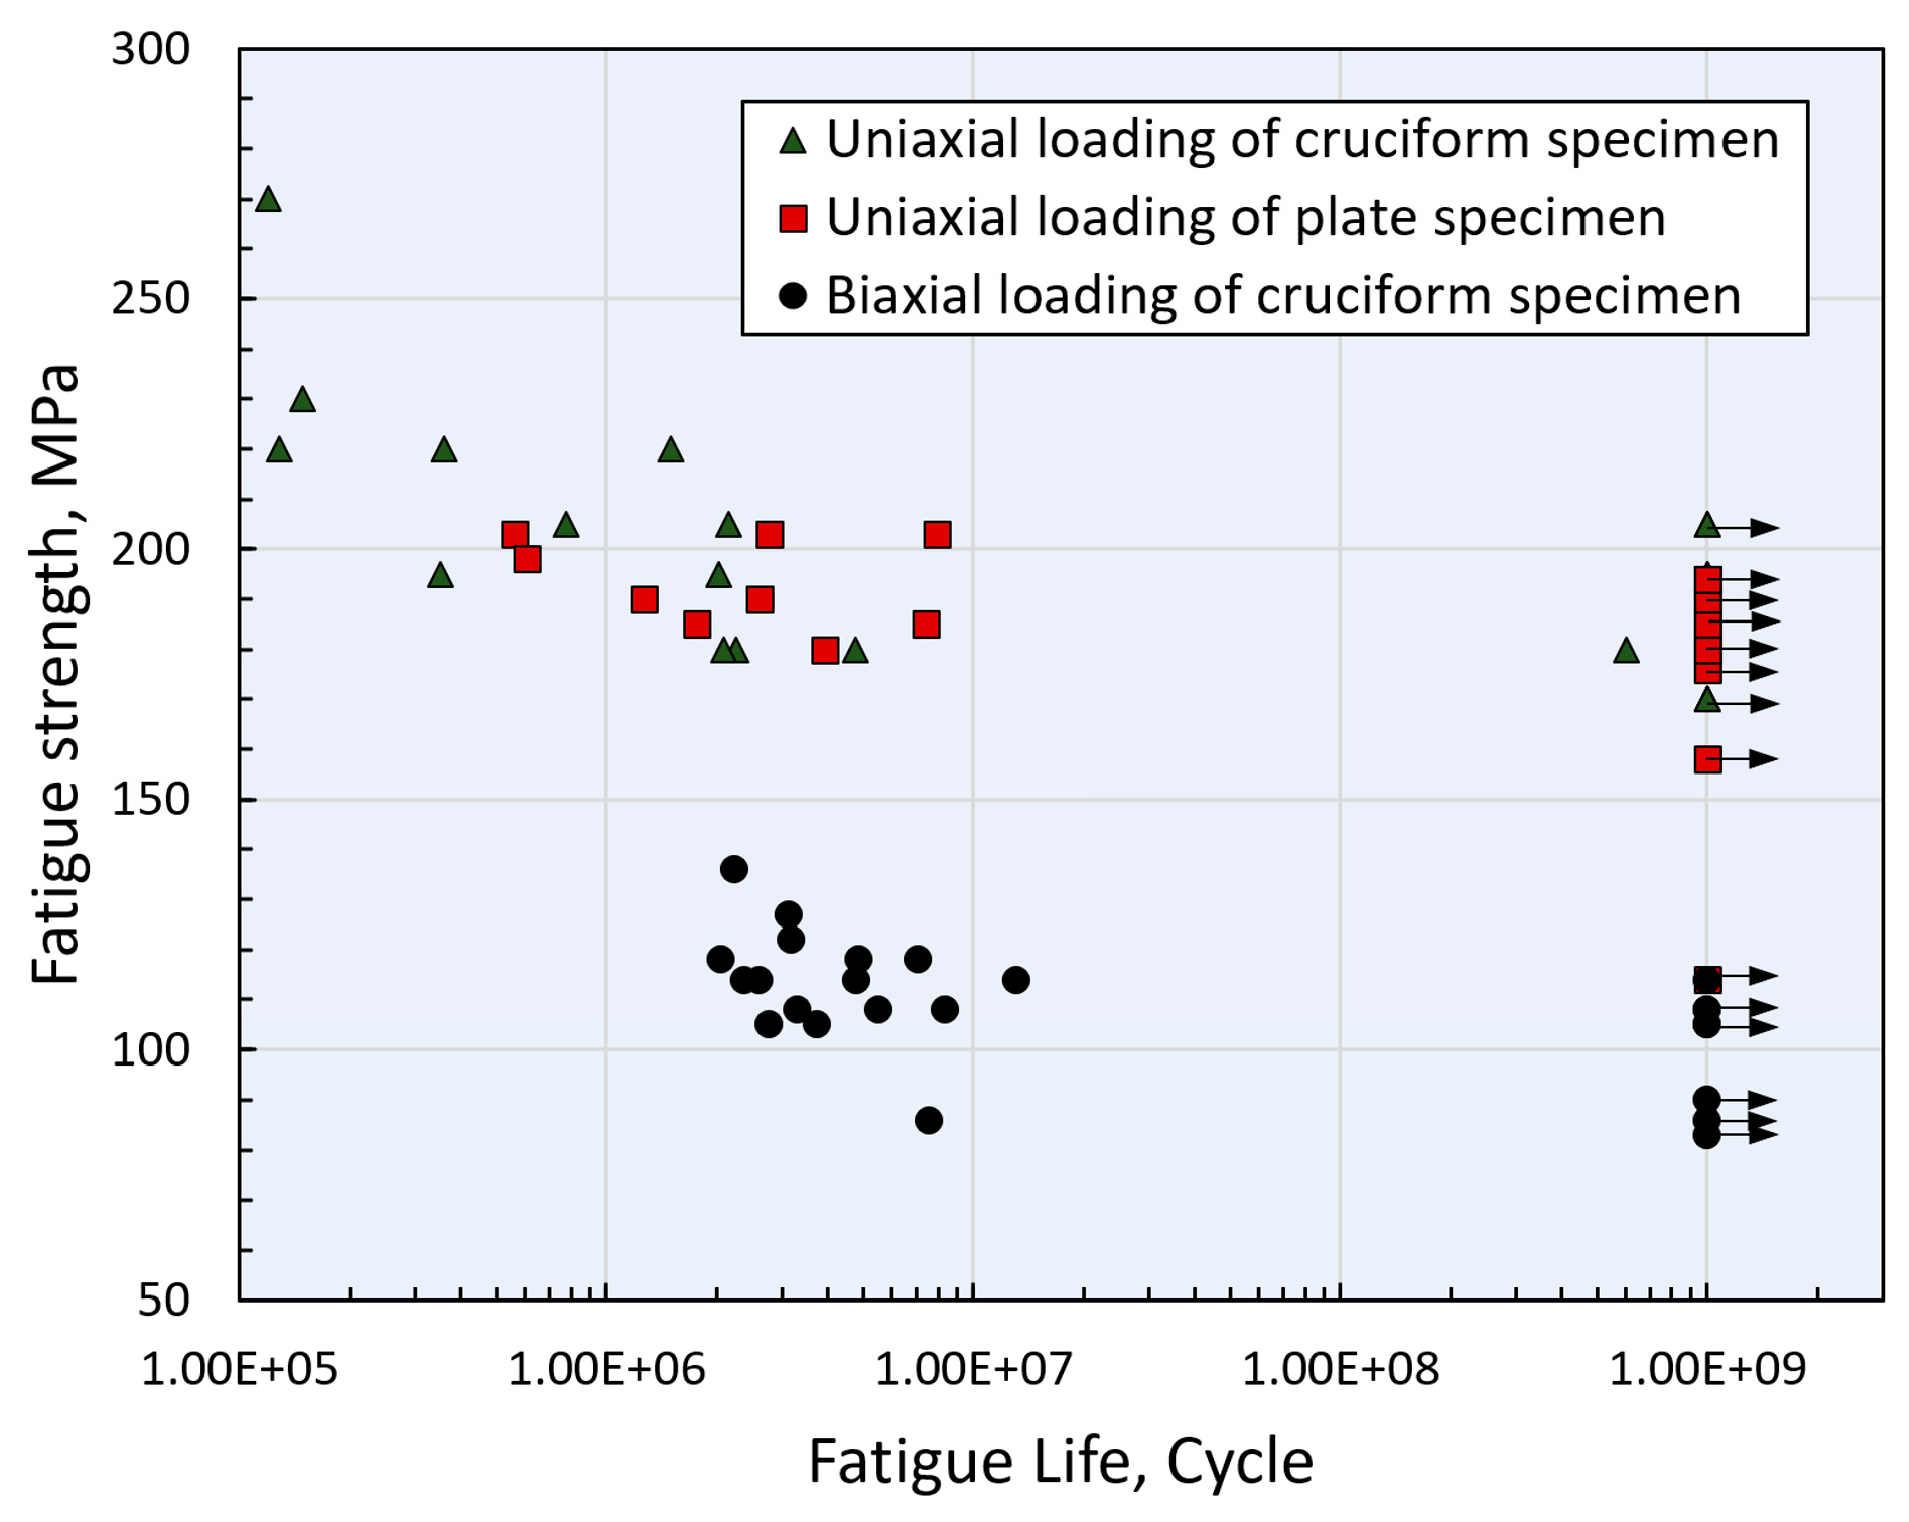
The fatigue test data obtained are presented in Figure 6. It was evident that under both uniaxial and biaxial loading conditions, a significant decrease in fatigue strength was observed within 107 cycles for the welded joints. Between 107 and 109 cycles, fatigue failures were rare among the three types of fatigue testing, indicating the presence of a plateau in the S–N curve within this range of cycles. For base materials such as aluminum [25,26] and titanium alloys [27,28], which were devoid of significant internal defects, the very high-cycle fatigue strength typically exhibited a continuous declining trend in the range of 107~109 cycles. Moreover, there was a concomitant shift of the fatigue crack initiation site from the surface toward the interior of the material. However, when significant internal defects were present within the material, or there were notches or similar detrimental features on the specimen surface, the very high-cycle fatigue strength of the material typically manifested as a horizontal plateau [29]. This phenomenon occurs because internal defects or notches on the surface significantly facilitate the initiation of fatigue cracks, leading to premature failure of the specimens. In the current testing, regardless of the loading method applied, the fatigue S–N curves all exhibited a horizontal plateau, suggesting that internal defects in the welded joints may play a crucial role in fatigue failure.
Upon comparing the S–N curve for plate specimens with that of cruciform specimens under uniaxial loading, it was observed that the trend of fatigue strength reduction was fundamentally similar. Additionally, the strength plateau between 107 and 109 cycles was also consistent. This indicates that the macroscopic fatigue data for both flat and cruciform specimens are in agreement under the same loading conditions. The variation in specimen type did not lead to differences in very high-cycle fatigue strength. However, under uniaxial loading, the cruciform specimens exhibited a fatigue strength of about 180 MPa, but this value decreased to merely 80 MPa under biaxial loading. The substantial reduction in fatigue strength under biaxial conditions underscores the critical impact of the loading stress state on fatigue performance. The rationale for this significant difference will be further explained in the failure mechanism analysis section that follows.

3.3. Fracture Analysis and Discussion

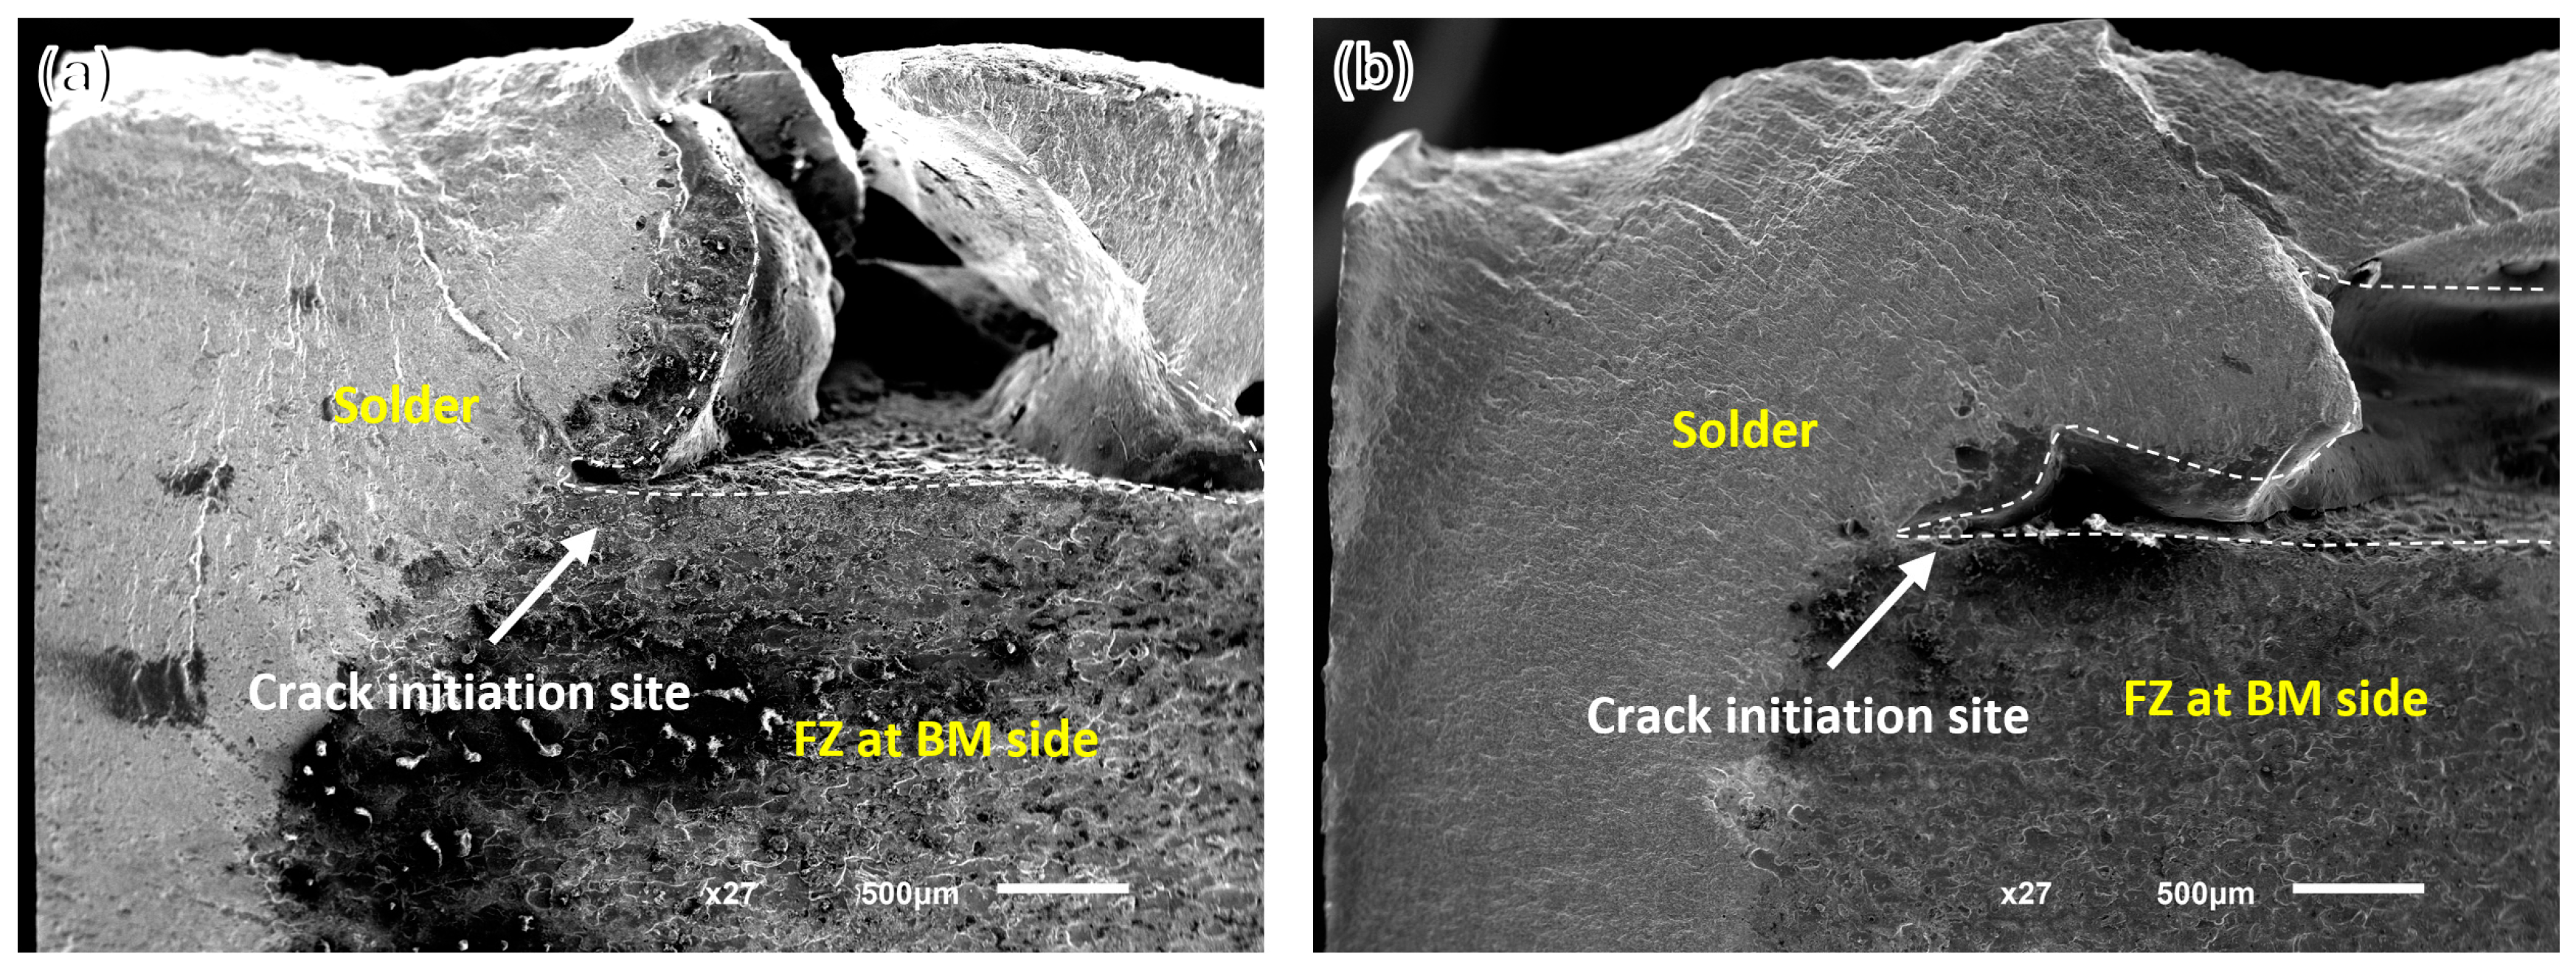
The typical fracture surface of the plate specimen under uniaxial loading is shown in Figure 7. The fracture surface in Figure 7a reveals two longitudinal boundaries. The rightmost region displays the microstructure of solder formed by the melting and solidification during the welding process. The central region corresponds to the fusion zone adjacent to the base metal, characterized by a rough surface morphology. The leftmost region is the heat-affected zone (HAZ) adjacent to the base metal, which generally has the smoothest appearance. At the interface between the solder and the fusion zone, unmerged defects and surface pores were observable. The initiation of fatigue cracks occurred at the edges of surface pores and then propagated through the fusion zone and HAZ, ultimately leading to fatigue failure of the specimen. In Figure 7b, the boundaries of two unfused defects coincided with an inclined straight line, indicating that this line demarcated the heat-affected zone from the solder area. However, fatigue cracks did not initiate from this lack of fusion defects but rather originated from surface pores. This suggests that the fatigue failure of the plate specimens is more sensitive to surface porosity. Despite the presence of an internal lack of fusion defects within the joint, they did not serve as the primary factor for the initiation of fatigue cracks.
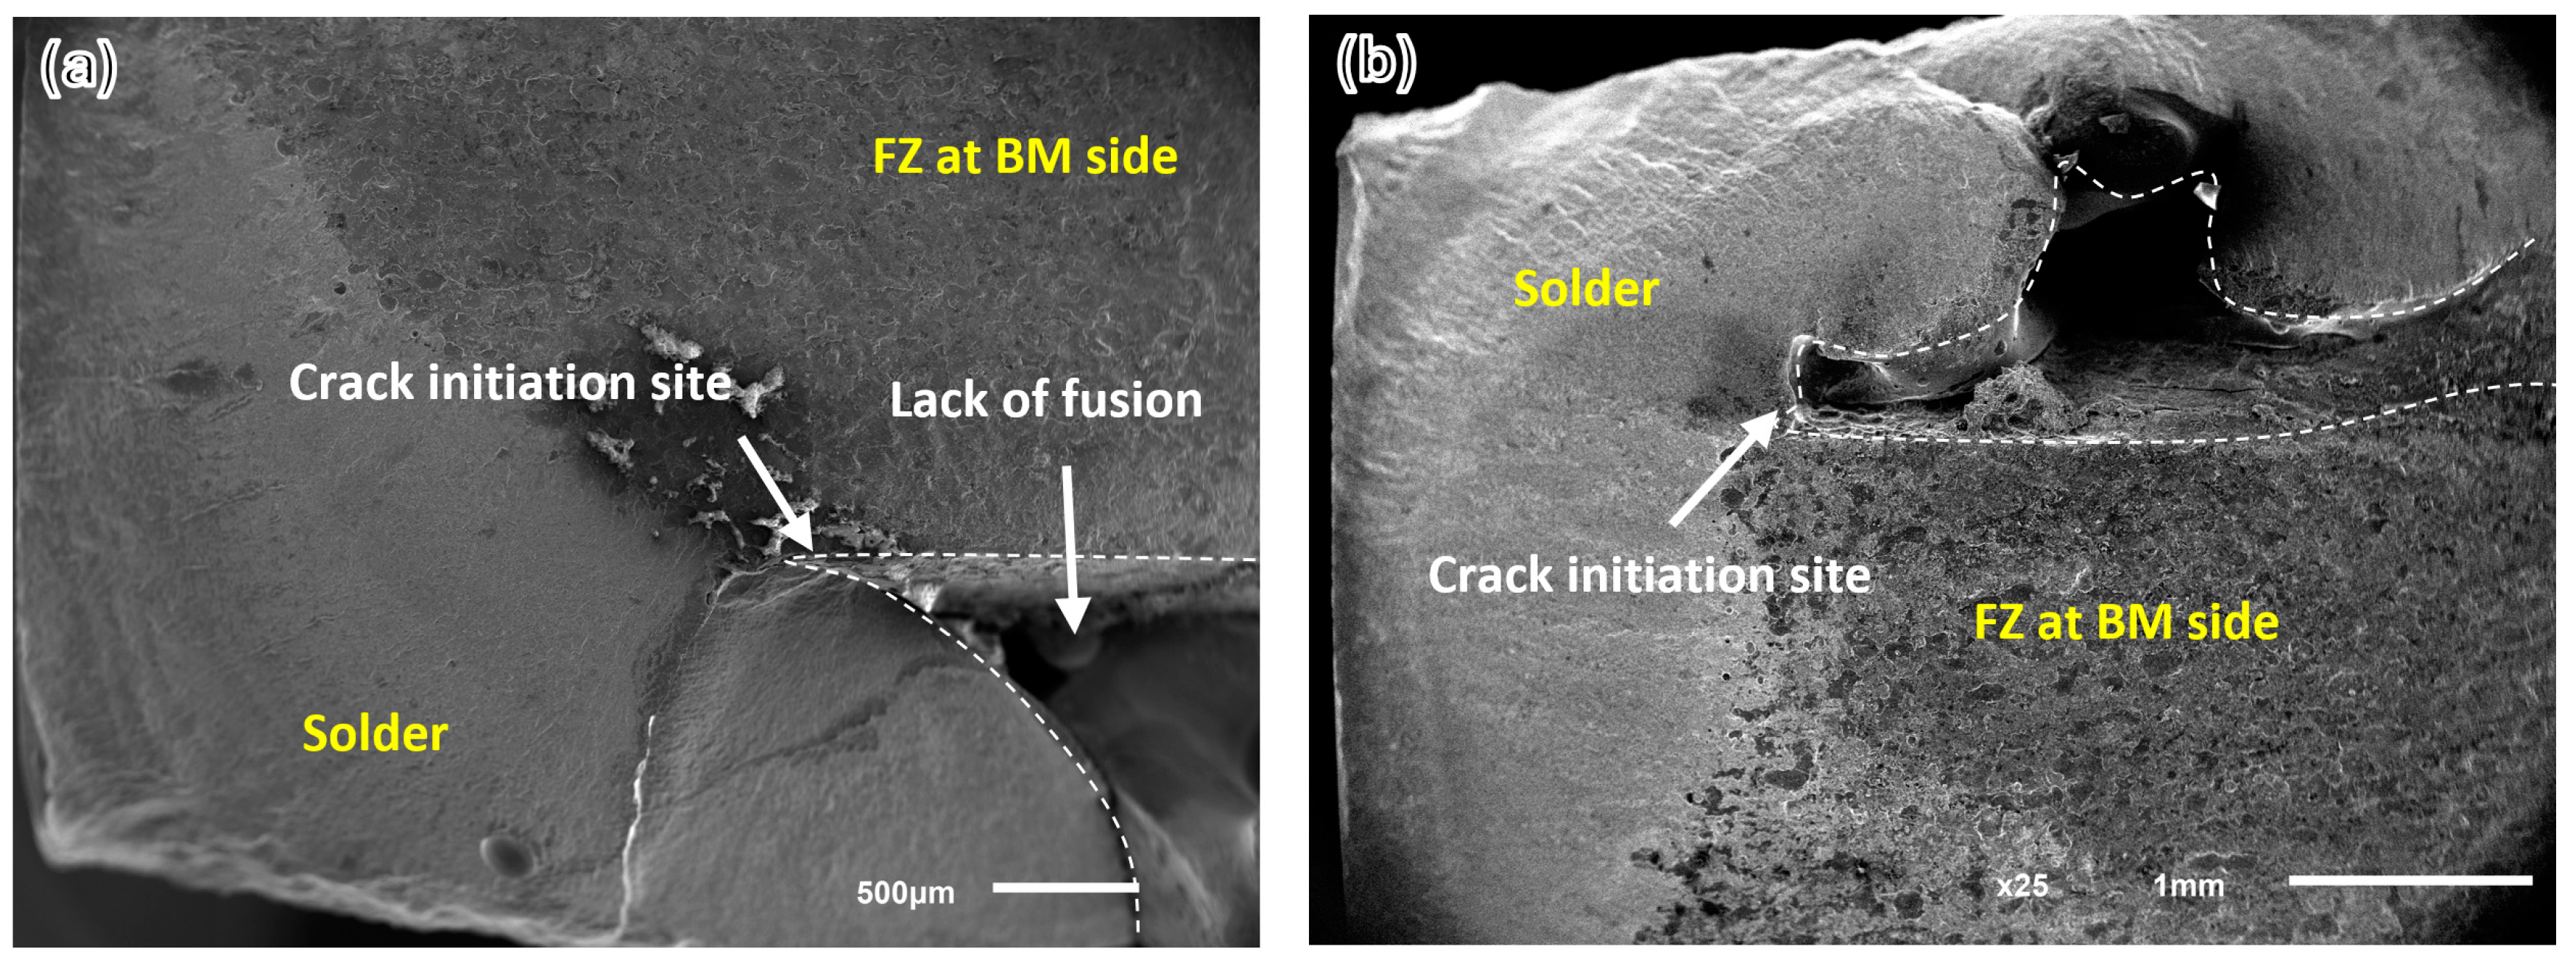
Figure 8a presents an SEM image of the fatigue failure surface of a cruciform specimen under uniaxial loading. Notably, the fracture surface exhibited distinct unfused defects, with one side of the defect boundary appearing horizontal, suggesting that the upper layer of this boundary was the solder zone and the lower layer was the fusion zone adjacent to the base material. The geometry of the unfused defect was complex, and the fatigue crack initiated at a geometrically singular location on the edge of the defect. This mode of fatigue crack initiation was not random but frequently observed under uniaxial loading conditions of cruciform welded joints, as evidenced by another representative fracture surface, as shown in Figure 7b. The geometric features of the unfused defects and the locations of fatigue crack initiation in this sample were highly similar to those observed in the fracture surface depicted in Figure 8a.
The typical fracture surface of the cruciform specimens subjected to biaxial loading is presented in Figure 9a,b. The failure mode closely resembled that observed in the cruciform specimens under uniaxial loading, where the boundary between the fusion and solder zones could be easily identified. Fatigue cracks invariably originate from the lack of fusion characterized by complex geometry.
The fatigue failure of plate specimens typically manifested at surface pores, while for cruciform specimens, regardless of the loading conditions, failure was invariably linked to internal unfused defects. Furthermore, the internal unfused defects in cruciform specimens were substantially larger than those in butt joint specimens. Larger defects within a weld joint are usually associated with reduced fatigue life under equivalent stress levels [30]. However, in this study, the fatigue strengths of the plate and cruciform specimens were found to be virtually identical despite the significant discrepancy in defect sizes. This unexpected observation can be rationalized by considering the presence of weld reinforcement in the cruciform specimens. Although they contain larger unfused defects, the reinforcement contributes to an increased load-bearing area, which helps to distribute the stresses and alleviate the stress concentration effects induced by the larger defects. Hence, the similar fatigue strengths of flat plate and cruciform specimens can be justified by the interplay between load-bearing area and defect size.
Within the S–N curve (Figure 6), a significant disparity was observed in the fatigue strength of cruciform specimens under uniaxial and biaxial loading conditions. However, the fracture morphology and crack initiation patterns of the fatigue fractures under these two loading states were almost identical upon examination of the fracture surfaces. This necessitates further analysis from a three-dimensional perspective of the fracture morphology to understand the underlying differences.

3.4. Three-Dimensional Topography of the Fracture Surface

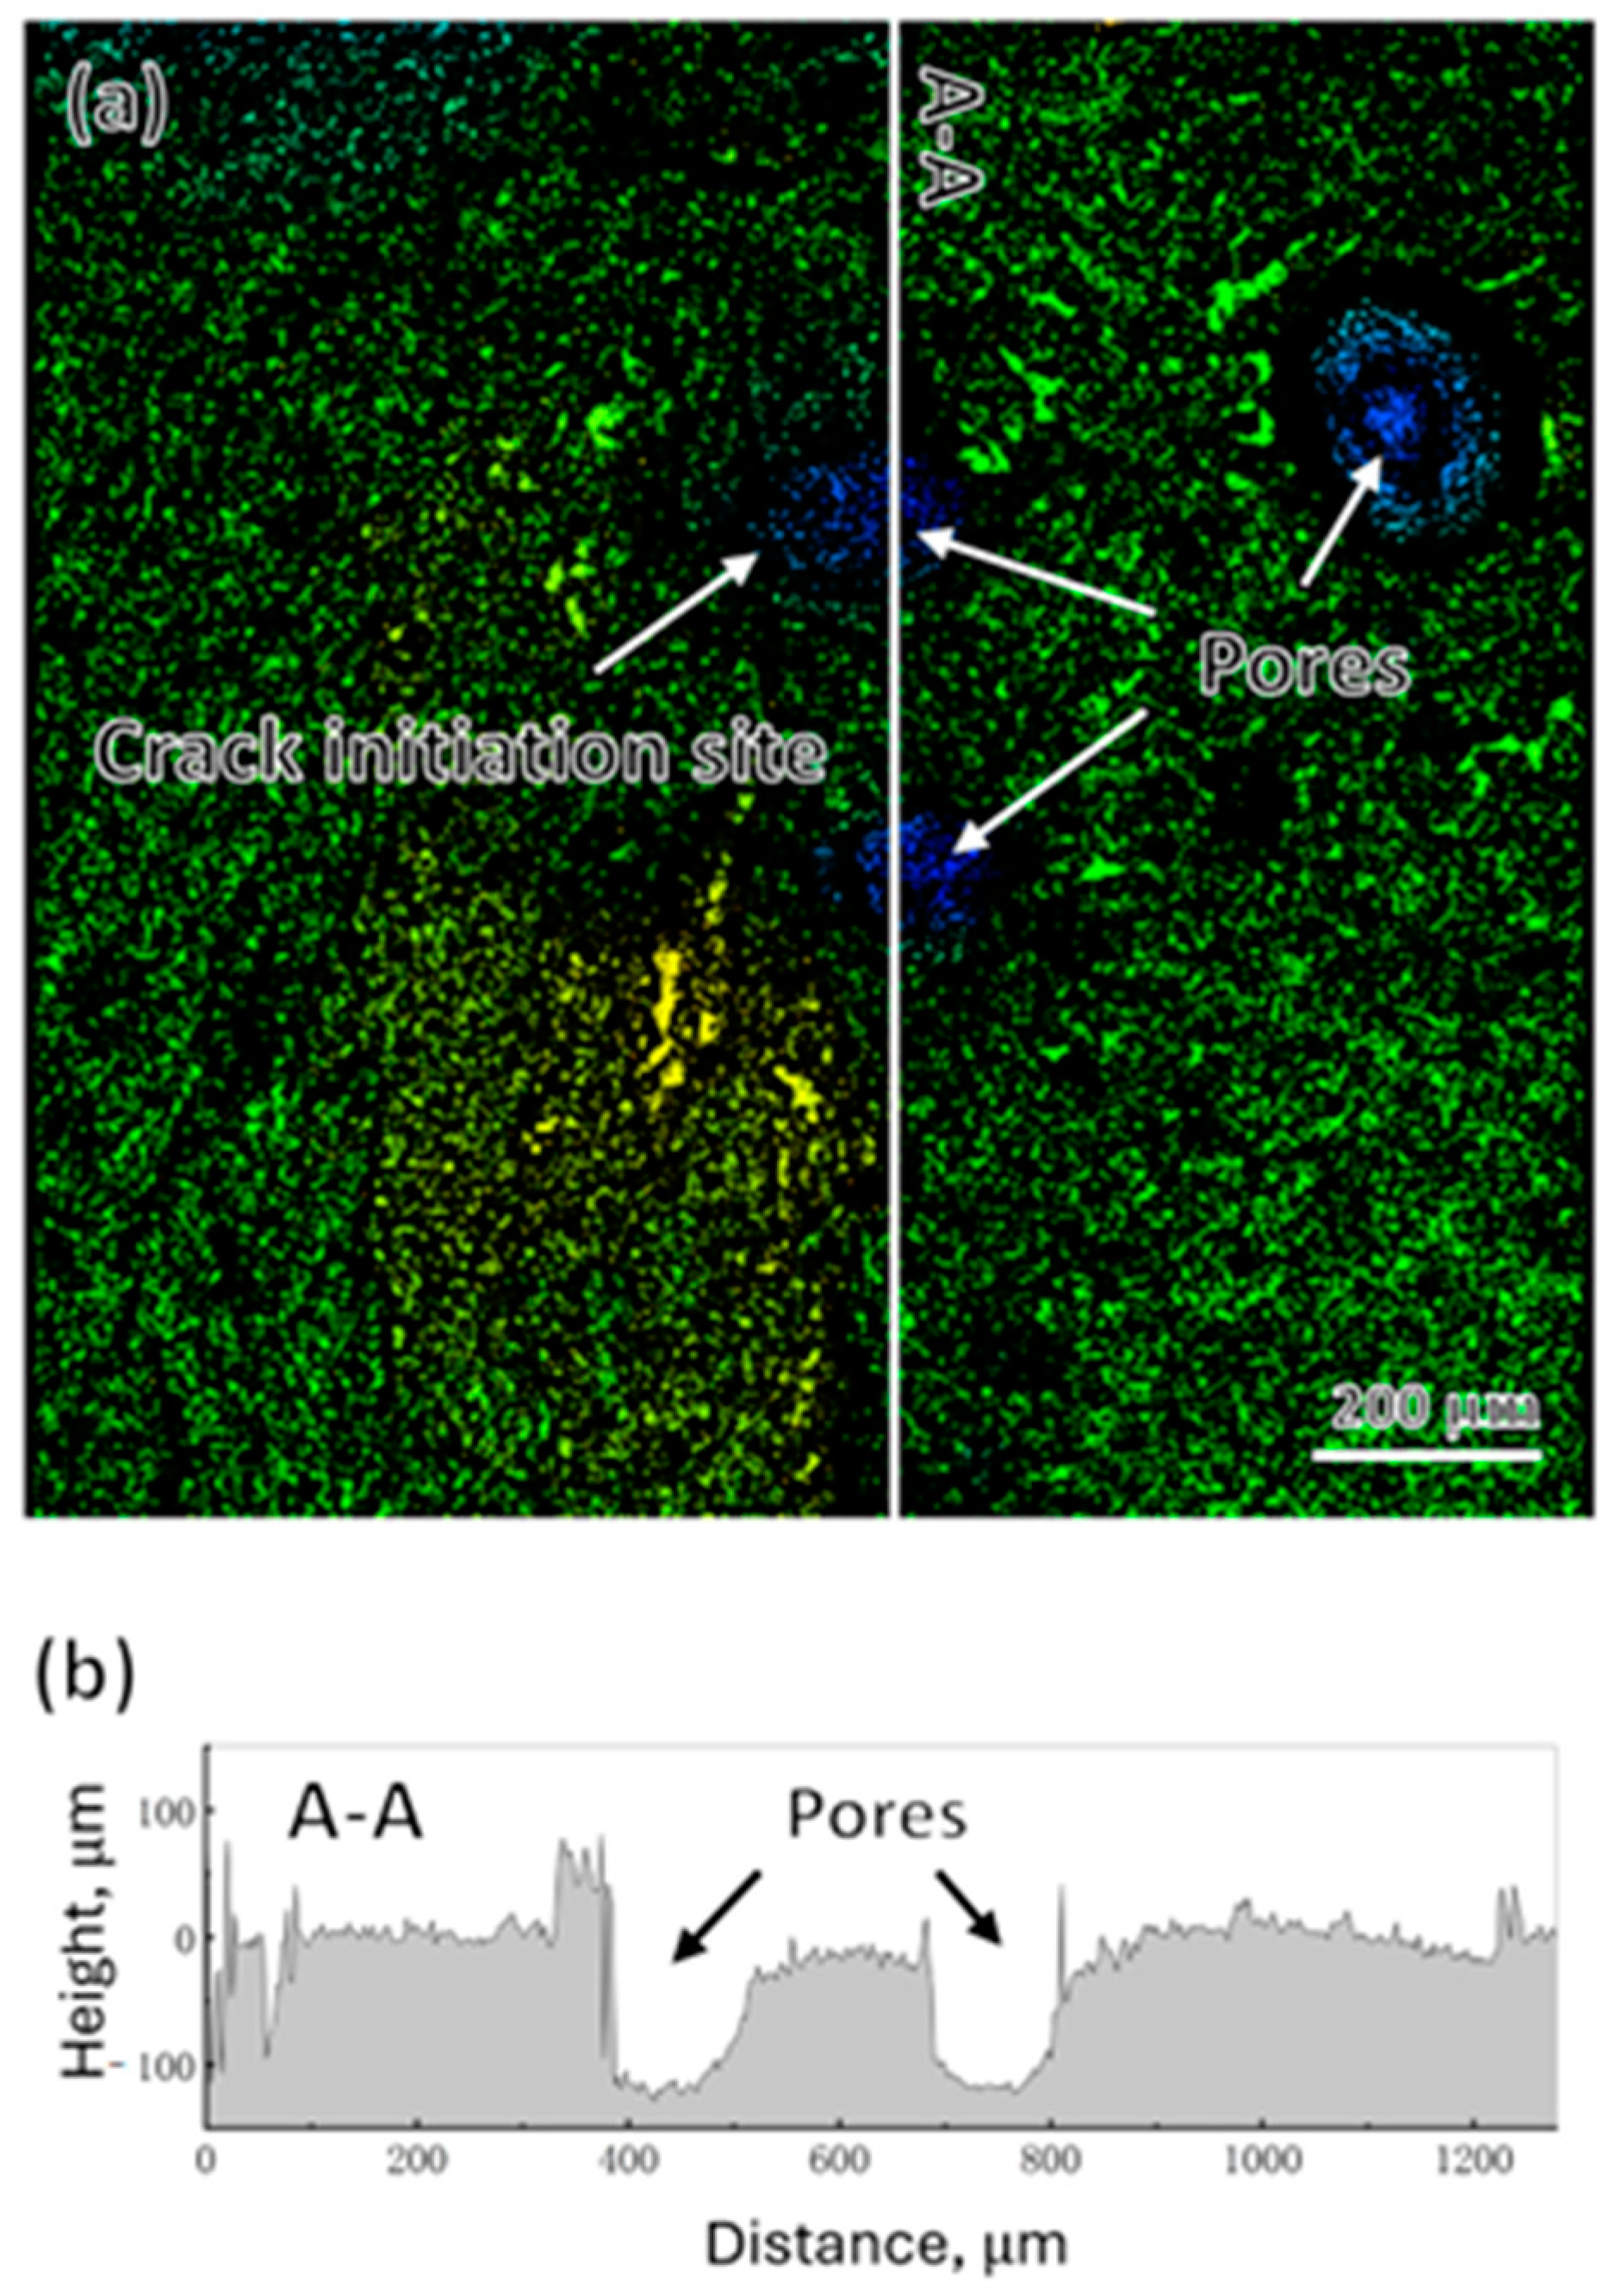
Figure 10 illustrates the fatigue fracture surface of a plate specimen under uniaxial loading. The fatigue crack initiated within a cluster zone composed of three pores. The height data from section A-A in Figure 10a was extracted, and a contour plot was created, as shown in Figure 10b. It can be observed that the diameter of a single pore was approximately 90~100 μ m , but the spacing between the pores was quite small, around 106 μ m . Typically, larger pore sizes are more prone to initiating fatigue cracks. At the same time, clusters of smaller pores gathered in a confined area can also lead to significant stress concentration [31]. Therefore, clusters of small pores can also be a primary inducement for the initiation of fatigue cracks. Additionally, it was noticeable that the fracture surface near the pores appeared horizontal, indicating that the direction of fatigue crack propagation is essentially perpendicular to the loading direction. This suggests that under uniaxial loading, the crack propagation is predominantly governed by the maximum principal stress, and the fatigue crack propagates in a Mode I manner perpendicular to the plane of the maximum principal stress.
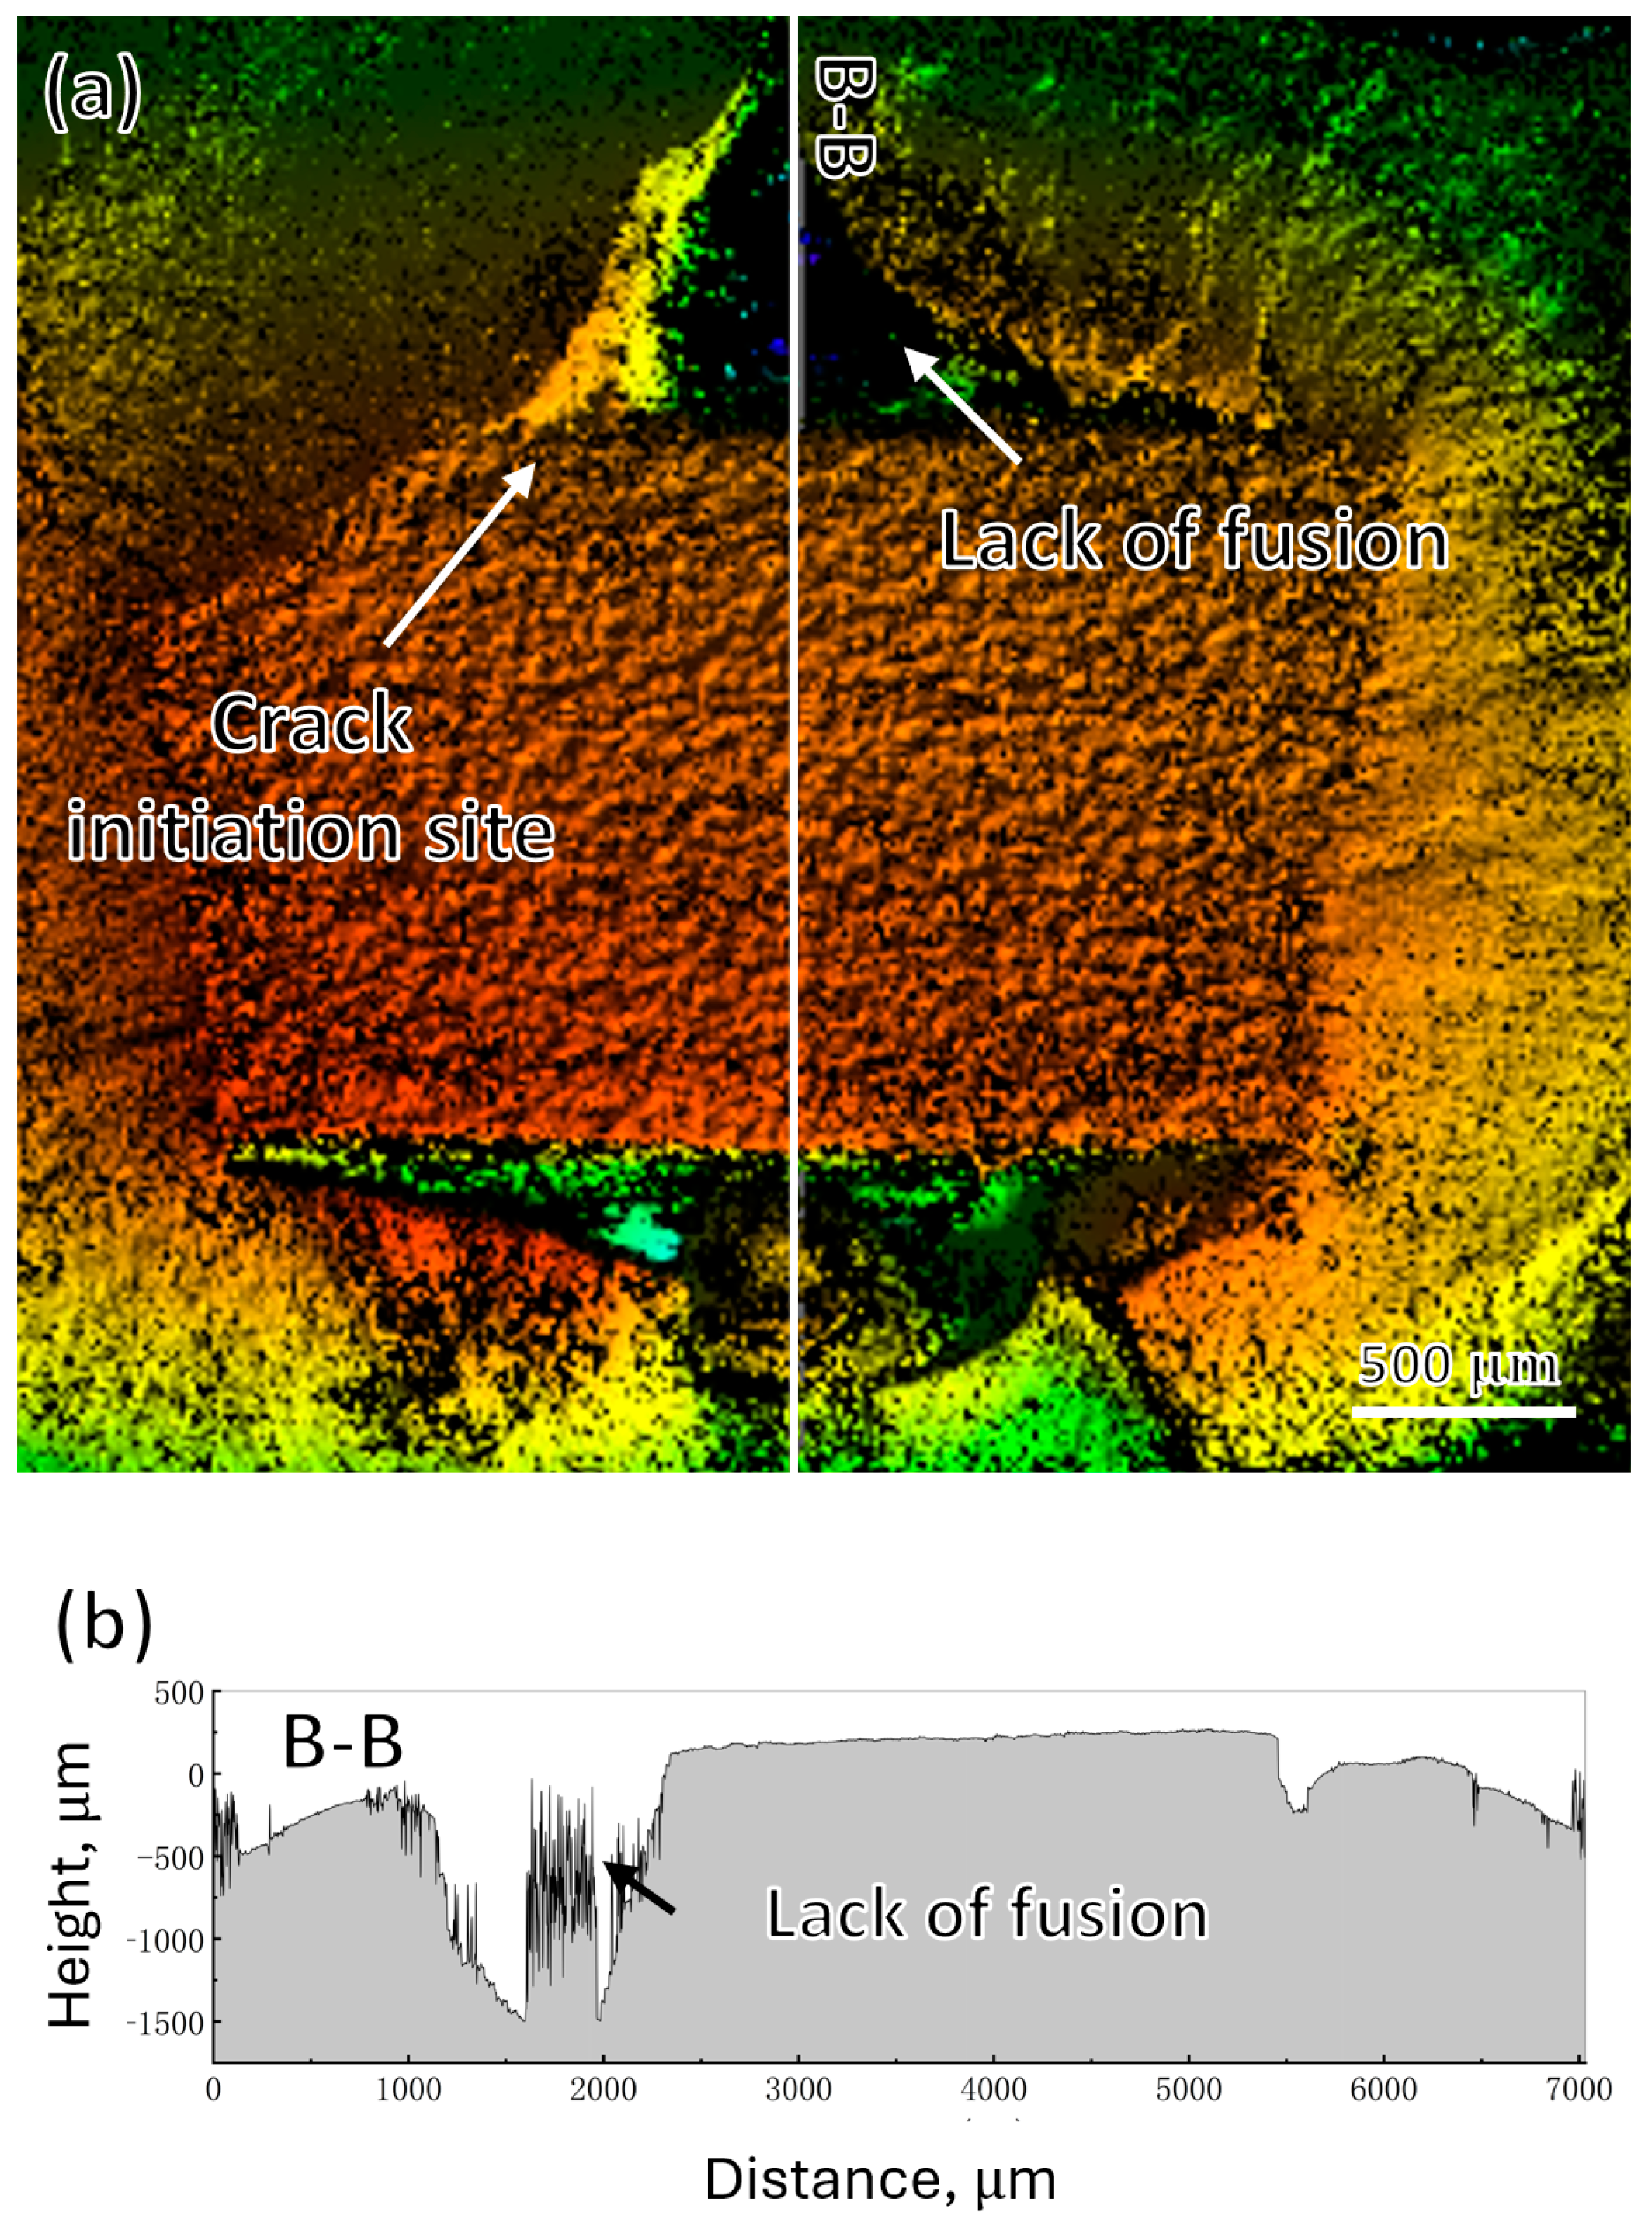
The three-dimensional morphology of the fatigue fracture surface of the cruciform specimen under biaxial loading is depicted in Figure 11a. The central square region of the fracture surface was notably elevated above the surrounding areas and was comparatively flat. A large unfused defect, which served as the initiation point for the fatigue crack, was observed in the upper region of the fracture surface. The height profile data for section Bb in Figure 11a is presented in Figure 11b. The fatigue crack surface within the central square region was exceptionally smooth and laid on a horizontal plane perpendicular to one of the principal stress directions in biaxial loading. In contrast, the crack surfaces on either side of the central region were inclined. Previous studies have found that the initiation of fatigue cracks typically occurs on the plane of maximum shear stress [32,33], resulting in a fracture surface that is inclined relative to the direction of the principal stress. However, the area of crack initiation is usually confined to the size of only a few grains [34]. In the present study, we observed an inclined fracture surface within the crack propagation zone. During this stage, the direction of crack propagation is predominantly governed by the maximum principal stress. The inclined surfaces on both sides of the fracture indicate that under the combined effect of biaxial loading, the crack propagates rapidly along the direction of the maximum principal stress at 45 degrees, extending to the surface of the weld reinforcement on the specimen.

3.5. Crystal Orientation Analysis of Materials near Pore

The phenomenon of fatigue crack initiation is not only related to the stress concentration level at the edge of the pores but also greatly influenced by the size and orientation of the local grains. Therefore, we cut and polished the axial section at the fatigue crack initiation site to reveal the microstructure of the matrix on the section below the crack surface, and the results are shown in Figure 12a. The microstructure near the pore could be seen to be mainly composed of coarse grains and fine grains, with the coarse grains mainly exhibiting a banded distribution. The orientation characteristics of the grains are shown in Figure 12b, and it can be observed that the oriented distribution of coarse grains in bands exhibited a distinct texture feature. Moreover, at the crack initiation site, several clusters composed of grains with approximately consistent orientations could be found, indicating that a textured microstructure has a significant influence on crack initiation. In Fatigue 12c, the kernel average misorientation (KAM) results show that the dislocation density is much higher in areas with similar orientations, which also confirms that plastic deformation is easy to occur within the micro-textured location. Previous studies have also shown that microstructural features consisting of grains with similar orientations within the material promote a nearly consistent orientation of slip directions within the grains [27,35]. As a result, the resistance to slip-induced cracking is significantly reduced, making fatigue cracks more likely to initiate from areas with microstructural features. In this study, the abundant microstructural banding features near the stomata are identified as another major factor promoting crack initiation at the stomata edge. Therefore, the fatigue strength of the Fusion zone will significantly decrease compared to the heat-affected zone and the base materials.

3.6. Discussion on Fatigue Failure Mechanism

In this work, we primarily observed the initiation of fatigue cracks stemming from two types of defects: porosity and lack of fusion. Pores, being smaller in size compared to lack of fusion defects, predominantly lead to fatigue failures in plate specimens subjected to uniaxial loading. In contrast, fatigue cracks in cruciform specimens are mainly initiated by a larger lack of fusion defects. The welding process for cruciform specimens is more complex, involving four weld seams that must be executed in a specific sequence. This complexity increases the difficulty of defect control compared to flat butt-welded specimens. Consequently, the presence of larger defects is a key factor contributing to the significantly lower fatigue strength of cruciform welded joints under biaxial loading compared to the fatigue strength of plate specimens under uniaxial loading. Moreover, the geometric shapes that lack fusion defects are often complex, which can lead to severe stress concentration under loading conditions. Current research has also indicated that the stress concentration factors caused by lack of fusion defects are significantly higher than those associated with internally smooth pores [36,37]. Therefore, within cruciform welded joints containing both lack of fusion and porosity defects, fatigue cracks are more likely to initiate at the sites of lack of fusion defects.
The observed lack of fusion defects was predominantly located at the interface between the base metal and the weld metal. Compared to cruciform welded joints, butt-welded plate specimens have fewer weld interfaces, resulting in a reduced number of lack of fusion defects. This is one of the reasons why flat plate specimens exhibit higher fatigue strengths. Furthermore, existing research indicates that the stress concentration factors caused by defects of the same size vary depending on their location [38]. Defects on the surface or subsurface of a specimen are more likely to initiate fatigue cracks than those located internally [39]. Consequently, in this work, nearly all fatigue cracks originated from defects on the surface or subsurface of the specimens.
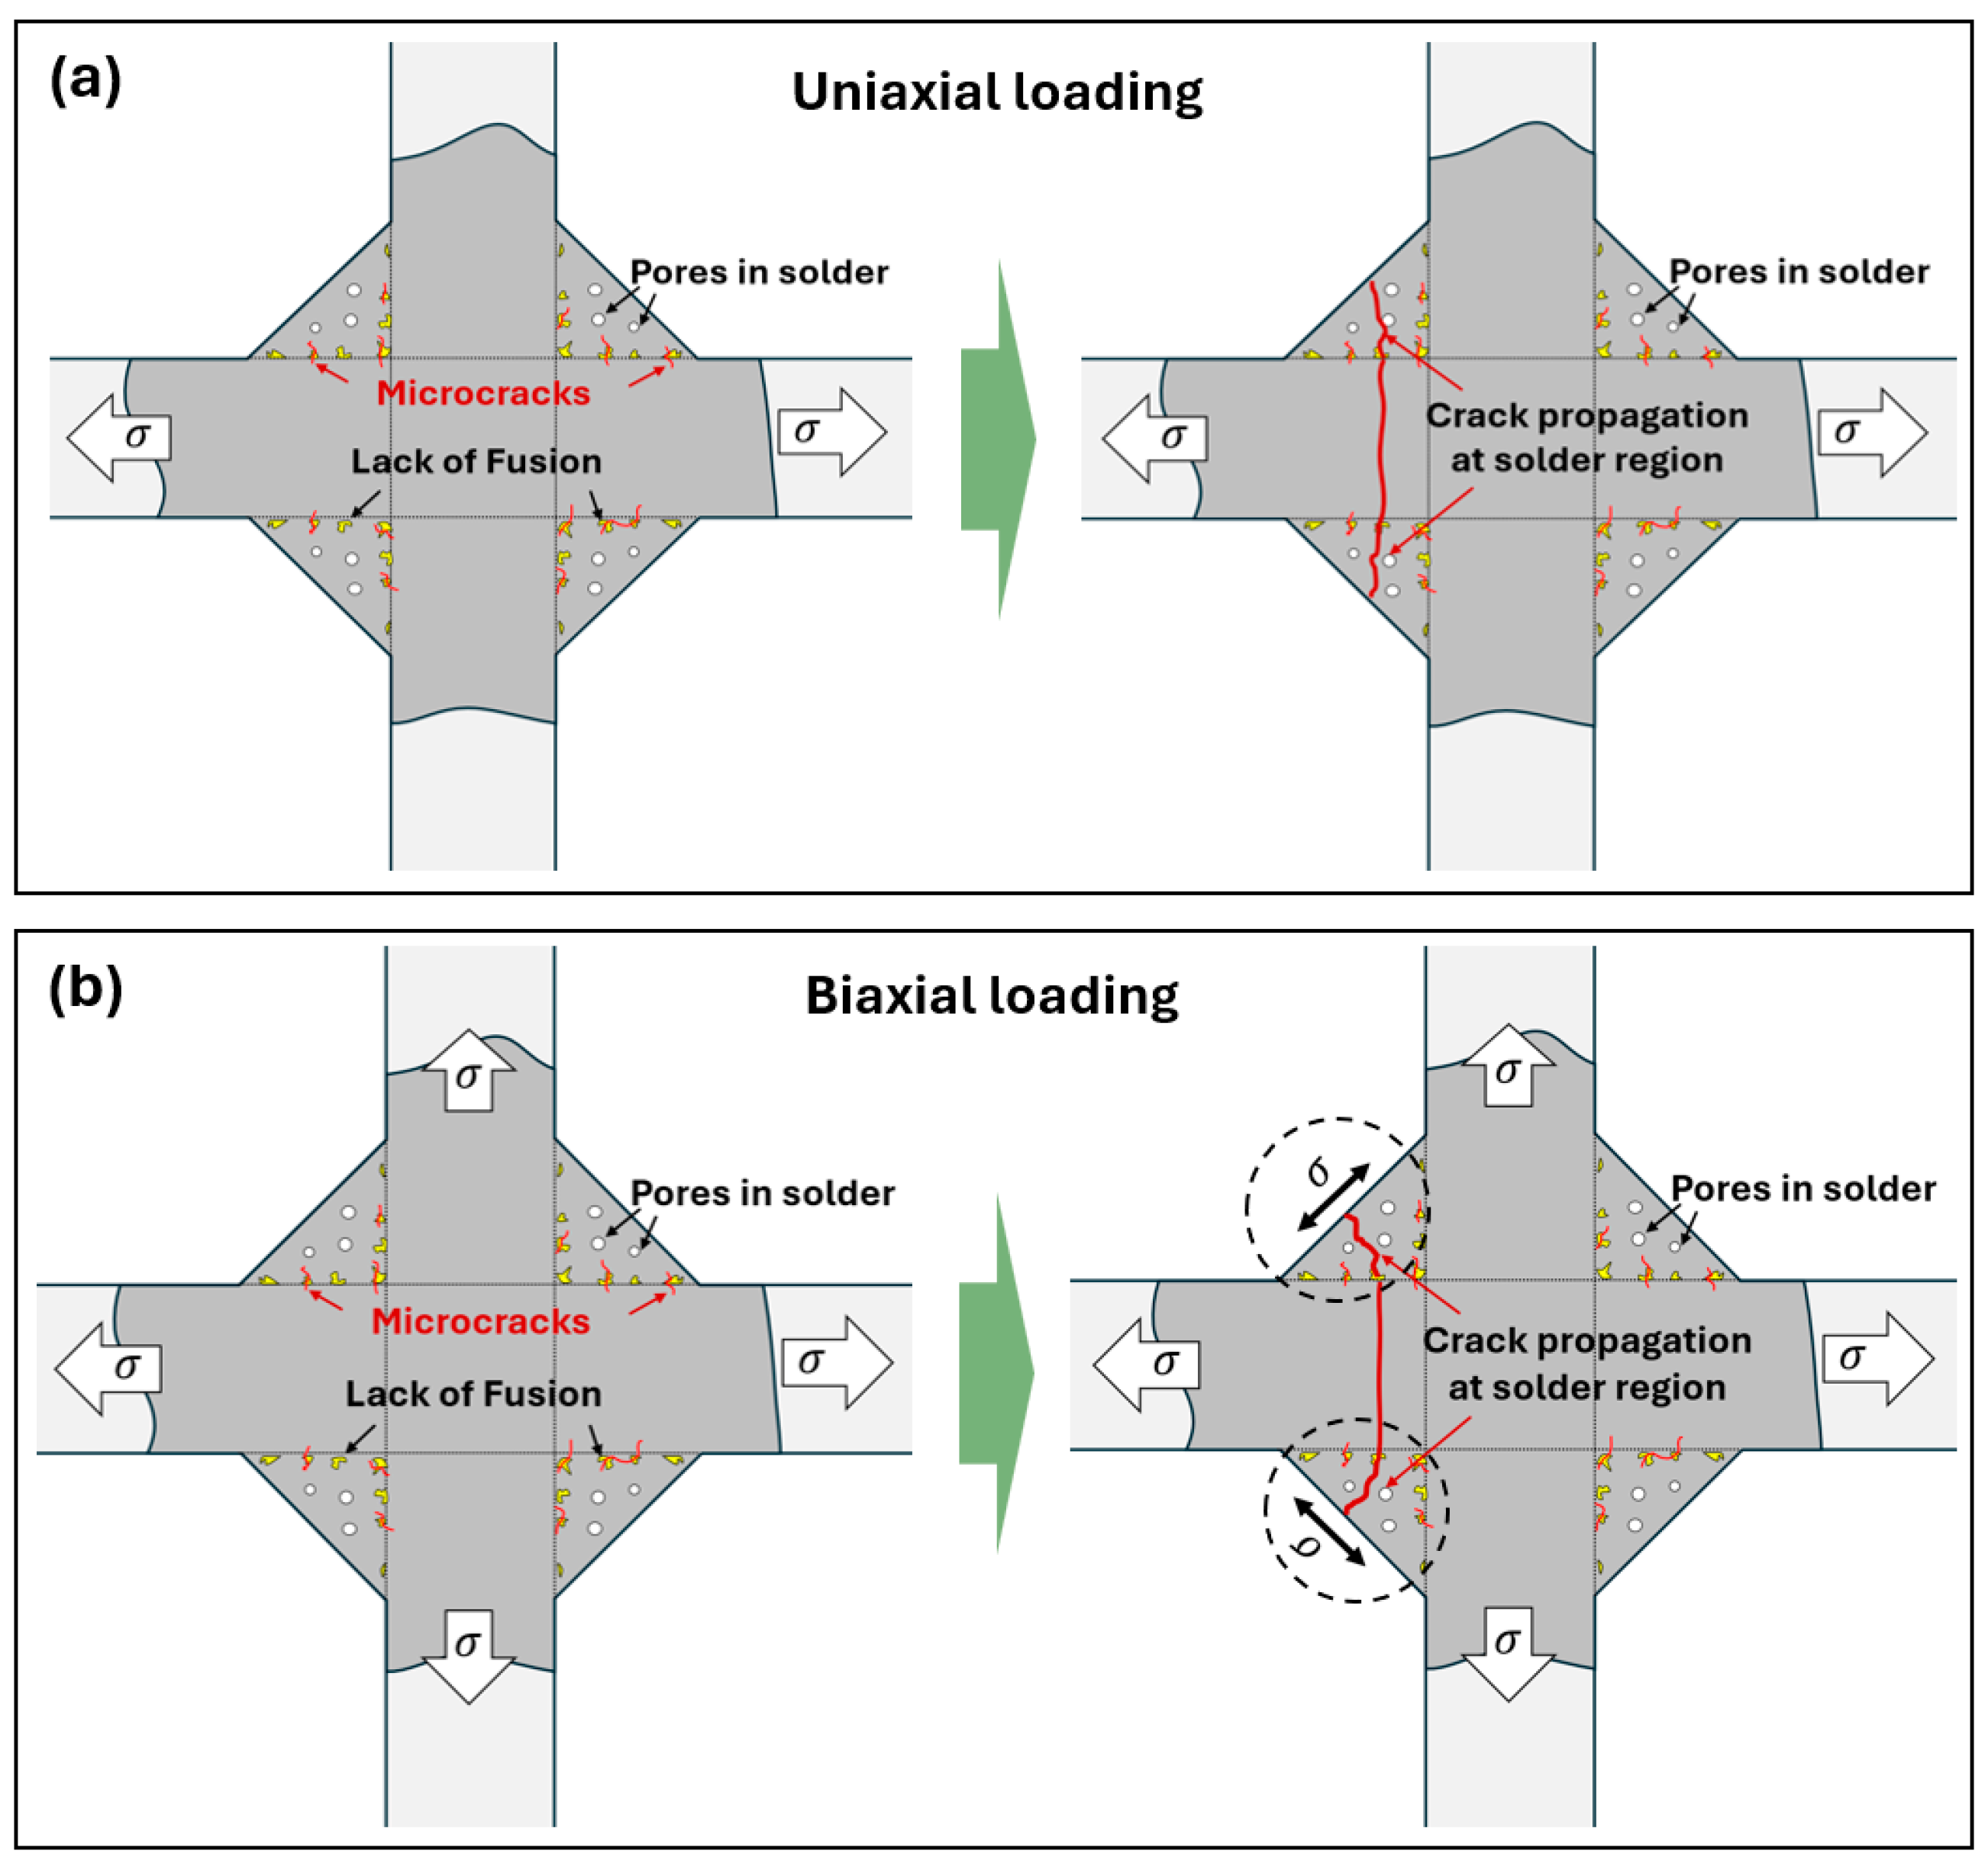
Cruciform joint specimens exhibited significant differences in fatigue strength under uniaxial and biaxial loading conditions, although the underlying mechanisms of crack initiation remained consistent (Figure 8 and Figure 9). Three-dimensional morphological analysis (Figure 10 and Figure 11) revealed that under biaxial loading, the propagation paths of fatigue cracks in the weld metal region differed, as shown in Figure 13. The lack of fusion defects was predominantly located at the interface between the solder and the base material. Under both uniaxial and biaxial loading, a lack of fusion defects was the primary contributor to crack initiation. During the early stages of crack propagation, the direction of the maximum principal stress determined the crack growth path [33]. Therefore, under uniaxial loading, cracks tended to propagate in planes perpendicular to the loading direction, resulting in fatigue fracture surfaces that were more likely to be perpendicular to the loading direction, as illustrated in Figure 13a. Under biaxial loading conditions, the direction of the maximum principal stress at the weld reinforcement is oriented along an inclined plane that intersects both loading stress directions, as depicted in Figure 13b. Based on the theory of plane stress conditions [40], the maximum value of the principal stress under biaxial loading exceeds that under uniaxial loading. Consequently, fatigue cracks are more likely to propagate in the planes perpendicular to the direction of the maximum principal stress, and the rate of crack propagation is greater under biaxial loading conditions compared to uniaxial loading. Previous studies have indicated that internal welding defects can readily act as initiators of fatigue cracks, significantly reducing the crack initiation life or, in some cases, completely eliminating the initiation stage [12,15,16,18]. Consequently, the VHCF life of welded joints with welding defects is predominantly influenced by the crack propagation stage. Under biaxial loading conditions, the crack propagation rate in cruciform joints is higher, resulting in a substantial reduction in fatigue life and lower strength compared to uniaxial loading conditions.

4. Conclusions

This study utilizes an ultrasonic fatigue testing system to achieve biaxial loading conditions and conducts a comprehensive experimental investigation into the VHCF failure mechanisms of cruciform welded joints under biaxial loading. The key findings are summarized as follows:
(1)
Fatigue testing of cruciform specimens under biaxial loading revealed a fatigue strength of only 80 MPa, which is significantly lower than that under uniaxial loading conditions (180 MPa);
(2)
Fatigue cracks in plate specimens primarily originated from surface porosity, whereas fatigue cracks in cruciform welded joint specimens predominantly initiated from a lack of fusion defects;
(3)
There are many band-like textured regions near the defects in the fusion zone, and fatigue cracks are more likely to initiate from these textured zones;
(4)
Welding processes, the size and shape of defects, and the stress state significantly affect the distribution of defects and the degree of stress concentration. These factors collectively influence the initiation and propagation of fatigue cracks and ultimately determine the fatigue strength and life of the welded joints.

Author Contributions

Methodology, B.X. and M.R.; Software, Y.L. and C.L.; Validation, C.L.; Formal analysis, M.R.; Investigation, W.Y.; Resources, Y.D.; Data curation, S.S.; Supervision, C.H.; Project administration, C.H. All authors have read and agreed to the published version of the manuscript.

Funding

This project is financially supported by the joint research fund of Hubei Provincial Natural Science Foundation and China Three Gorges Corporation (No. 2022CFD166), along with the China Yangtze Power Co., Ltd. (Contract No. Z152302013).

Data Availability Statement

Data are contained within the article.

Conflicts of Interest

The authors declare that this study received funding from China Yangtze Power Co., Ltd. The funder was not involved in the study design, collection, analysis, interpretation of data, the writing of this article or the decision to submit it for publication.

References

  1. Phillips, D.H. Welding Engineering: An Introduction; John Wiley & Sons: Hoboken, NJ, USA, 2023. [Google Scholar]
  2. Radaj, D.; Sonsino, C.; Fricke, W. Recent developments in local concepts of fatigue assessment of welded joints. Int. J. Fatigue 2009, 31, 2–11. [Google Scholar] [CrossRef]
  3. Braun, M.; Wang, X. A review of fatigue test data on weld toe grinding and weld profiling. Int. J. Fatigue 2021, 145, 106073. [Google Scholar] [CrossRef]
  4. England, A.; Toumpis, A.; Gorash, Y. Very high cycle fatigue of welds: A review. Metals 2023, 13, 1860. [Google Scholar] [CrossRef]
  5. Daniel, T.; Smaga, M.; Beck, T.; Schopf, T.; Stumpfrock, L.; Weihe, S.; Rudolph, J. Investigation of the very high cycle fatigue (VHCF) behavior of austenitic stainless steels and their welds for reactor internals at ambient temperature and 300 C. In Proceedings of the Pressure Vessels and Piping Conference, 2020, Online, 3 August 2020; American Society of Mechanical Engineers: Houston, TX, USA, 2020. [Google Scholar]
  6. Da Silva, R.R.; Caloba, L.P.; Siqueira, M.H.S.; Rebello, J.M.A. Pattern recognition of weld defects detected by radiographic test. NDT E Int. 2004, 37, 461–470. [Google Scholar] [CrossRef]
  7. Zhan, R.; Wang, D.; Ren, Z.; Deng, C.; Xu, X.; Liang, H. Evolution of Welding Residual Stresses Involving the Cutting Process and Its Effect on Fatigue Performance. Int. J. Press. Vessel. Pip. 2022, 197, 104636. [Google Scholar] [CrossRef]
  8. Zerbst, U.; Ainsworth, R.A.; Beier, H.T.; Pisarski, H.; Zhang, Z.L.; Nikbin, K.; Nitschke-Pagel, T.; Münstermann, S.; Kucharczyk, P.; Klingbeil, D. Review on Fracture and Crack Propagation in Weldments—A Fracture Mechanics Perspective. Eng. Fract. Mech. 2014, 132, 200–276. [Google Scholar] [CrossRef]
  9. Tsutsumi, S.; Fincato, R.; Luo, P.; Sano, M.; Umeda, T.; Kinoshita, T.; Tagawa, T. Effects of Weld Geometry and HAZ Property on Low-Cycle Fatigue Behavior of Welded Joint. Int. J. Fatigue 2022, 156, 106683. [Google Scholar] [CrossRef]
  10. Ren, X.; Xu, X.; Jiang, C.; Huang, Z.; He, X. Strain distribution and fatigue life estimation for steel plate weld joint low cycle fatigue based on DIC. Opt. Lasers Eng. 2020, 124, 105839. [Google Scholar] [CrossRef]
  11. Dai, Y.; Liu, C.; Zhan, M.; Wang, X.; He, C.; Wang, Q. Heterogeneous deformation of friction stir welded aluminum alloy 6061 in tension and high cycle fatigue. Int. J. Struct. Integr. 2022, 13, 813–828. [Google Scholar] [CrossRef]
  12. He, C.; Huang, C.; Liu, Y.; Wang, Q. Fatigue damage evaluation of low-alloy steel welded joints in fusion zone and heat affected zone based on frequency response changes in gigacycle fatigue. Int. J. Fatigue 2014, 61, 297–303. [Google Scholar] [CrossRef]
  13. He, C.; Huang, C.; Liu, Y.; Li, J.; Wang, Q. Effects of mechanical heterogeneity on the tensile and fatigue behaviours in a laser-arc hybrid welded aluminium alloy joint. Mater. Des. (1980–2015) 2015, 65, 289–296. [Google Scholar] [CrossRef]
  14. Ma, M.; Lai, R.; Qin, J.; Wang, B.; Liu, H.; Yi, D. Effect of Weld Reinforcement on Tensile and Fatigue Properties of 5083 Aluminum Metal Inert Gas (MIG) Welded Joint: Experiments and Numerical Simulations. Int. J. Fatigue 2021, 144, 106046. [Google Scholar] [CrossRef]
  15. Yin, D.; Wang, D.; Jing, H.; Huo, L. The effects of ultrasonic peening treatment on the ultra-long life fatigue behavior of welded joints. Mater. Des. 2010, 31, 3299–3307. [Google Scholar] [CrossRef]
  16. Zhu, M.-L.; Xuan, F.-Z. Failure mechanisms and fatigue strength assessment of a low strength Cr−Ni−Mo−V steel welded joint: Coupled frequency and size effects. Mech. Mater. 2016, 100, 198–208. [Google Scholar] [CrossRef]
  17. Zhu, M.-L.; Xuan, F.-Z.; Du, Y.-N.; Tu, S.-T. Very high cycle fatigue behavior of a low strength welded joint at moderate temperature. Int. J. Fatigue 2012, 40, 74–83. [Google Scholar] [CrossRef]
  18. Cremer, M.; Zimmermann, M.; Christ, H.-J. High-frequency cyclic testing of welded aluminium alloy joints in the region of very high cycle fatigue (VHCF). Int. J. Fatigue 2013, 57, 120–130. [Google Scholar] [CrossRef]
  19. Cremer, M.; Kolyshkin, A.; Zimmermann, M.; Christ, H.J. Influence of process-related defects on the fatigue behaviour of welded aluminium joints at very high cycles. Adv. Mater. Res. 2014, 891, 1476–1481. [Google Scholar] [CrossRef]
  20. Mayer, H. Recent developments in ultrasonic fatigue. Fatigue Fract. Eng. Mater. Struct. 2016, 39, 3–29. [Google Scholar] [CrossRef]
  21. Ilie, P.; Lesperance, X.; Ince, A. Development of an ultrasonic fatigue testing system for gigacycle fatigue. Mater. Des. Process. Commun. 2020, 2, e120. [Google Scholar] [CrossRef]
  22. Bharat, V. Nanoindentation hardness measurements using atomic force microscopy. Appl. Phys. Lett. 1994, 64, 1653–1655. [Google Scholar]
  23. Xue, T.C. Design of Ultrasonic Fatigue Specimen. Acta Aeronaut. 2004, 25, 425–428. [Google Scholar]
  24. Peng, B.; Zhang, M.; Ye, D. DIC/DSI based studies on the local mechanical behaviors of HR3C/T92 dissimilar welded joint during plastic deformation. Mater. Sci. Eng. A 2022, 857, 144073. [Google Scholar] [CrossRef]
  25. Invernizzi, S.; Montagnoli, F.; Carpinteri, A. Experimental evidence of specimen-size effects on EN-AW6082 aluminum alloy in VHCF regime. Appl. Sci. 2021, 11, 4272. [Google Scholar] [CrossRef]
  26. Xu, L.; Wang, Q.; Zhou, M. Micro-crack initiation and propagation in a high strength aluminum alloy during very high cycle fatigue. Mater. Sci. Eng. A 2018, 715, 404–413. [Google Scholar] [CrossRef]
  27. Nikitin, A.; Palin-Luc, T.; Shanyavskiy, A. Crack initiation in VHCF regime on forged titanium alloy under tensile and torsion loading modes. Int. J. Fatigue 2016, 93, 318–325. [Google Scholar] [CrossRef]
  28. Xu, W.; Chen, X.; Gao, Z.; Li, Y.; He, Y.; Tao, C. Fatigue behaviors of a titanium alloy in the VHCF regime based on a vibration-based bending fatigue test. Fatigue Fract. Eng. Mater. Struct. 2022, 45, 2549–2562. [Google Scholar] [CrossRef]
  29. Nie, B.; Chen, D.; Zhao, Z.; Zhang, J.; Meng, Y.; Gao, G. Notch effect on the fatigue behavior of a TC21 titanium alloy in very high cycle regime. Appl. Sci. 2018, 8, 1614. [Google Scholar] [CrossRef]
  30. Xu, K.; Feng, M.; Qiu, X. Distinguishing welding defects from the stress concentration zone using metal magnetic memory field parameters. Trans. Indian Inst. Met. 2019, 72, 343–351. [Google Scholar]
  31. Afroz, L.; Inverarity, S.B.; Qian, M.; Easton, M.; Das, R. Analysing the effect of defects on stress concentration and fatigue life of L-PBF AlSi10Mg alloy using finite element modelling. Prog. Addit. Manuf. 2023, 9, 341–359. [Google Scholar] [CrossRef]
  32. He, C.; Wu, Y.; Peng, L.; Su, N.; Chen, Q.; Yuan, S.; Liu, Y.; Wang, Q. Effect of microstructure on small fatigue crack initiation and early propagation behavior in Mg-10Gd-3Y-0.3 Zr alloy. Int. J. Fatigue 2019, 119, 311–319. [Google Scholar]
  33. Li, X.; He, C.; Wang, X.; Chen, Y.; Wang, C.; Zhang, H.; Li, L.; Liu, Y.; Wang, Q. Effects of microstructure on crack initiation in super martensitic stainless steel under very-high-cycle fatigue at elevated temperature. Fatigue Fract. Eng. Mater. Struct. 2023, 46, 1060–1077. [Google Scholar] [CrossRef]
  34. Li, X.; Dai, Y.; Wang, X.; Liu, Y.; Chen, Y.; Wang, C.; Zhang, H.; Li, L.; Liu, H.; He, C.; et al. Effects of local microstructure on crack initiation in super martensitic stainless steel under very-high-cycle fatigue. Int. J. Fatigue 2022, 163, 107019. [Google Scholar] [CrossRef]
  35. Szczepanski, C.; Jha, S.; Larsen, J.; Jones, J. Microstructural influences on very-high-cycle fatigue-crack initiation in Ti-6246. Metall. Mater. Trans. A 2008, 39, 2841–2851. [Google Scholar] [CrossRef]
  36. Benoit, M.J.; Mazur, M.; Easton, M.A.; Brandt, M. Effect of alloy composition and laser powder bed fusion parameters on the defect formation and mechanical properties of Inconel 625. Int. J. Adv. Manuf. Technol. 2021, 114, 915–927. [Google Scholar] [CrossRef]
  37. Wu, Z.; Wu, S.; Gao, X.; Lin, Y.; Xue, Y.; Withers, P.J. The role of internal defects on anisotropic tensile failure of L-PBF AlSi10Mg alloys. Sci. Rep. 2023, 13, 14681. [Google Scholar] [CrossRef]
  38. Liu, F.; He, C.; Chen, Y.; Zhang, H.; Wang, Q.; Liu, Y. Effects of defects on tensile and fatigue behaviors of selective laser melted titanium alloy in very high cycle regime. Int. J. Fatigue 2020, 140, 105795. [Google Scholar] [CrossRef]
  39. He, C.; Cui, S.; Liu, Y.; Wang, Q. Effect of pore on super long fatigue life of aluminium alloywelded joint. Trans. China Weld. Inst. 2014, 35, 18–22. [Google Scholar]
  40. Reiss, E.L.; Locke, S. On the theory of plane stress. Q. Appl. Math. 1961, 19, 195–203. [Google Scholar] [CrossRef]
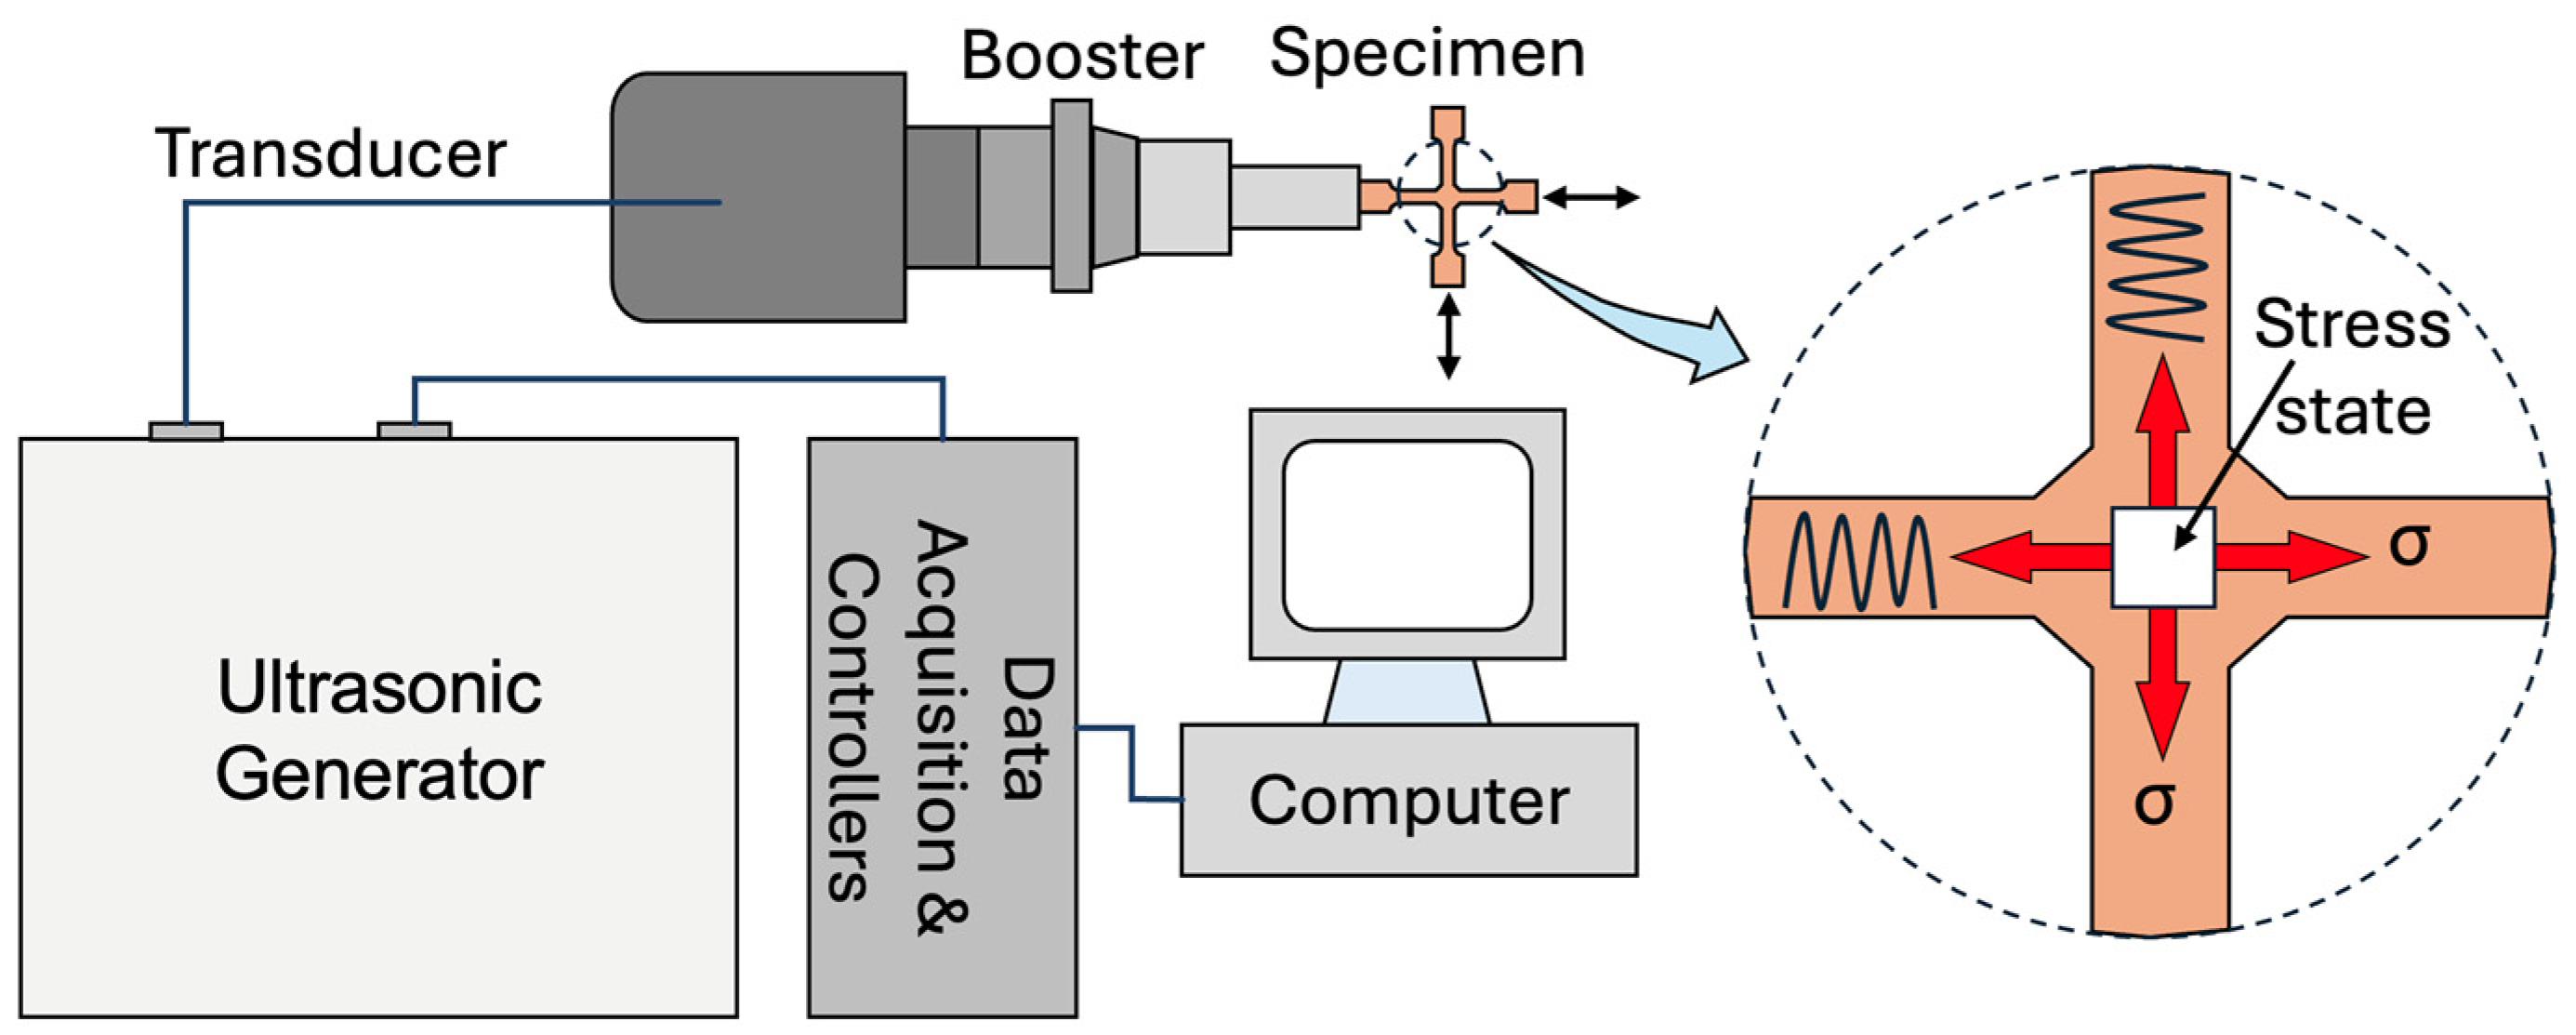
Figure 1. Schematic diagram of ultrasonic fatigue test system and stress state at the center of the specimen.
Crystals 14 00850 g001
Figure 2. Design and sizing of ultrasonic fatigue specimens. (a) Plate specimen; (b) Photograph of plate specimen; (c) Cruciform specimen; (d) Photograph of cruciform specimen.
Crystals 14 00850 g002
Figure 3. Results of Finite Element Modal Analysis for Two Specimens. (a) Plate specimen; (b) Cruciform specimen.
Crystals 14 00850 g003
Figure 4. Microstructure of different regions of welded joints. (a) Base material; (b) Boundary between heat affected zone and fusion zone; (c) Fusion zone.
Crystals 14 00850 g004
Figure 5. Full-field hardness diagram of the welded area.
Crystals 14 00850 g005
Figure 6. Fatigue data of two types of specimens under uniaxial and biaxial loading conditions.
Crystals 14 00850 g006
Figure 7. Representative fatigue fracture morphology of plate specimens under uniaxial loading, showing that fatigue crack initiates from pores at specimen surface. (a) 245 MPa, 8.00 × 10⁴ cycles; (b) 180 MPa, 6.03 × 10⁸ cycles.
Crystals 14 00850 g007
Figure 8. Fatigue crack initiation site of the cruciform specimen under uniaxial loading, showing that lack of fusion with singular geometry leads to fatigue crack initiation. (a) 185 MPa, 7.41 × 10⁶ cycles; (b) 180 MPa, 3.92 × 10⁶ cycles.
Crystals 14 00850 g008
Figure 9. Fatigue failure characteristic of the cruciform specimen under biaxial loading, showing that the fatigue crack site appears at the edge of lack of fusion. (a) 108 MPa, 3.31 × 10⁶ cycles; (b) 185 MPa, 1.76 × 10⁶ cycles.
Crystals 14 00850 g009
Figure 10. Fatigue crack initiation caused by a region composed of multiple pores. (a) Three-dimensional topography of crack initiation area of a plate specimen tested at 195 MPa and failed at 2.03 × 10⁶ cycles); (b) Contour features at sections A-A.
Crystals 14 00850 g010
Figure 11. Crack initiation at lack of fusion under biaxial loading of a cruciform specimen (108 MPa, 3.31 × 10⁶ cycles). (a) Three-dimensional topography of crack initiation area; (b) Contour features at sections B-B.
Crystals 14 00850 g011
Figure 12. Morphology of the cross-section at the fatigue crack initiation site. (a) Grain boundaries of the cross-section area; (b) Crystal orientation near the pore; (c) Kernel average misorientation map.
Crystals 14 00850 g012
Figure 13. Schematic diagram of the distribution of weld defects in the cruciform specimen and the mechanism leading to fatigue crack initiation. (a) Uniaxial loading; (b) Biaxial loading.
Crystals 14 00850 g013
Disclaimer/Publisher’s Note: The statements, opinions and data contained in all publications are solely those of the individual author(s) and contributor(s) and not of MDPI and/or the editor(s). MDPI and/or the editor(s) disclaim responsibility for any injury to people or property resulting from any ideas, methods, instructions or products referred to in the content.