Article

Effect of Trace Rare Earth Element Cerium (Ce) on Microstructure and Mechanical Properties of High Strength Marine Engineering Steel

1
School of Materials Science and Engineering, Inner Mongolia University of Technology, Hohhot 010051, China
2
Engineering Research Center of Rare Earth Metal Materials, Inner Mongolia University of Technology, Hohhot 010051, China
3
Technical Center of Inner Mongolia Baotou Steel Union Co, Ltd., Baotou City 014010, China
4
The Rare Earth Steel Plates Plant of Baotou Iron and Steel Co., Ltd., Baotou 014010, China
5
State Key Laboratory of Rolling Technology and Continuous Rolling Automation, Northeastern University, Shenyang 110819, China
*
Authors to whom correspondence should be addressed.
Crystals 2024, 14(10), 863; https://doi.org/10.3390/cryst14100863
Submission received: 29 August 2024 / Revised: 15 September 2024 / Accepted: 27 September 2024 / Published: 30 September 2024
(This article belongs to the Special Issue Microstructure Evolution and Mechanical Properties of Steels)

Abstract

:
In this paper, FH460 special steel with rare earth element cerium (Ce) was selected, and the control group without Ce was set up. By changing the content of Ce, the microstructure, phase transition point, and mechanical properties of the test steel were observed to study the effect of trace rare earth element Ce on the microstructure and mechanical properties of high-strength marine engineering steel. The morphology and energy spectrum of inclusions in three kinds of test steels were observed by SEM, and the morphological changes in inclusions in FH460 high-strength marine engineering steel after adding Ce were investigated. The fracture morphology and energy spectrum analysis were carried out by combining the tensile test at room temperature and the gradient low temperature impact toughness test, and the effect of trace Ce on the mechanical properties of the test steel was comprehensively analyzed. The results show that the addition of Ce changes the phase transformation temperature of Ac1 and Ac3, and refines the original microstructure of the test steel. SEM observation showed that the addition of Ce changed the long strip MnS and polygonal irregular Al2O3 inclusions into ellipsoids, which reduced the size of inclusions. The gradient low temperature impact test shows that with the decrease in temperature, the fracture dimple depth of the three test sheets of steel decreases, and the Ce-containing test steel forms a deep dimple centered on rare earth inclusions, which hinders the crack propagation and significantly improves the low temperature impact toughness of the test steel.

1. Introduction

Special steel for offshore platforms is a large, welded structural steel, which has a harsh service environment and needs to withstand complex stress during service [1]. The development and utilization of high-strength marine engineering steel, and improving the mechanical properties and corrosion resistance of marine engineering steel are the key research directions [2]. Compared with other alloying elements, rare earth elements (REs) have a larger atomic radius, which makes it easy for REs to lose their outer electrons and form cations, and the electronegativity is low. Therefore, REs exhibit strong activity in molten steel. They are not only easy to combine with non-metallic elements such as oxygen and sulfur in molten steel to form rare earth compounds with a high melting point, but can also interact with many low melting point metals in steel, thereby reducing their harm to the mechanical properties of materials.
A large number of studies have found that REs can improve the low temperature impact performance of steel, mainly for the following reasons. First, rare earth can purify molten steel, improve the purity of molten steel, improve the morphology of sulfur and oxygen inclusions in steel, and purify and strengthen grain boundaries [3]. REs can effectively replace irregular polygonal inclusions such as aluminum oxide and manganese sulfide, and transform into spherical rare earth composite inclusions with a size of less than 3 μm. There is less stress concentration around them, which means it is not easy to produce cracks and reduce crack sources in steel. The impact energy, hardness, and ultimate tensile strength of RE-modified alloy steel are significantly improved [4]. The small spherical rare earth inclusions are not easy to break, and there is relative deformation with the steel matrix. During the loading process, the cracks need to consume more energy to bypass the rare earth inclusions, which can effectively slow down the stress concentration at the crack tip and hinder the crack propagation [5,6,7]. Adding an appropriate amount of rare earth in the steel can change the fracture morphology from the previous brittle fracture to ductile fracture. Generally, rare earth inclusions exist in the form of dimples during the fracture process. The larger the dimple, the better the toughness of the steel [8]. The radius of RE atoms is large, and its solid solution in the lattice of steel can also produce a certain solid solution strengthening effect [9]. Adding rare earth elements to offshore platform steel can improve its mechanical properties and service life.
In this paper, the offshore platform steel FH460 with trace rare earth element cerium (Ce) is taken as the research object, and the effects of RE element modification inclusions and microalloying on the microstructure are studied. The effects of RE element on the overall mechanical properties, microstructure changes, and inclusions of offshore platform steel are further studied.

2. Experimental Section

2.1. Preparation of Experimental Materials

The test steel used in this experiment was produced by a steel plant, the rare earth content was controlled, and the control group was set up. At the same time, the alloying elements titanium (Ti) and niobium (Nb) were added to control the grain size of the test steel, so as to refine the grain and improve the strength of the test steel. The specific components are shown in Table 1.
The production process of the test steel was as follows: The test steel was smelted by 25 kg vacuum smelting furnace, the raw material was FH460, and the columnar ingot with a diameter of 110 mm was cast. The box resistance heating furnace was used to heat the ingot, the heating temperature was 1200 °C, and the furnace time was more than 3 h to ensure that the ingot temperature was uniform and the alloy elements were fully dissolved. The hot rolling test was carried out using a φ750 × 550 mm hot rolling mill. The ingot was rolled after manual dephosphorization, and two-stage controlled rolling was adopted. Rough rolling stage: 110–95–75–55–40 mm, finishing rolling start rolling temperature 910 °C ± 10 °C, pass 40–30–20–16–14–12 mm, finishing rolling temperature 830 ± 10 °C, then cooling to 670 ± 10 °C, and a cooling rate of 8 ± 1 °C/s.
According to the national organization test standard of GB/T 13298-91 [10], the samples were cut from three kinds of steel plates using electric spark molybdenum wire cutting. The cross-section perpendicular to the rolling direction was selected, and the metallographic samples were prepared by grinding with 200~2000 Si-C sandpaper. After etching with 4% nitric acid alcohol, the microstructure was observed under an optical microscope.

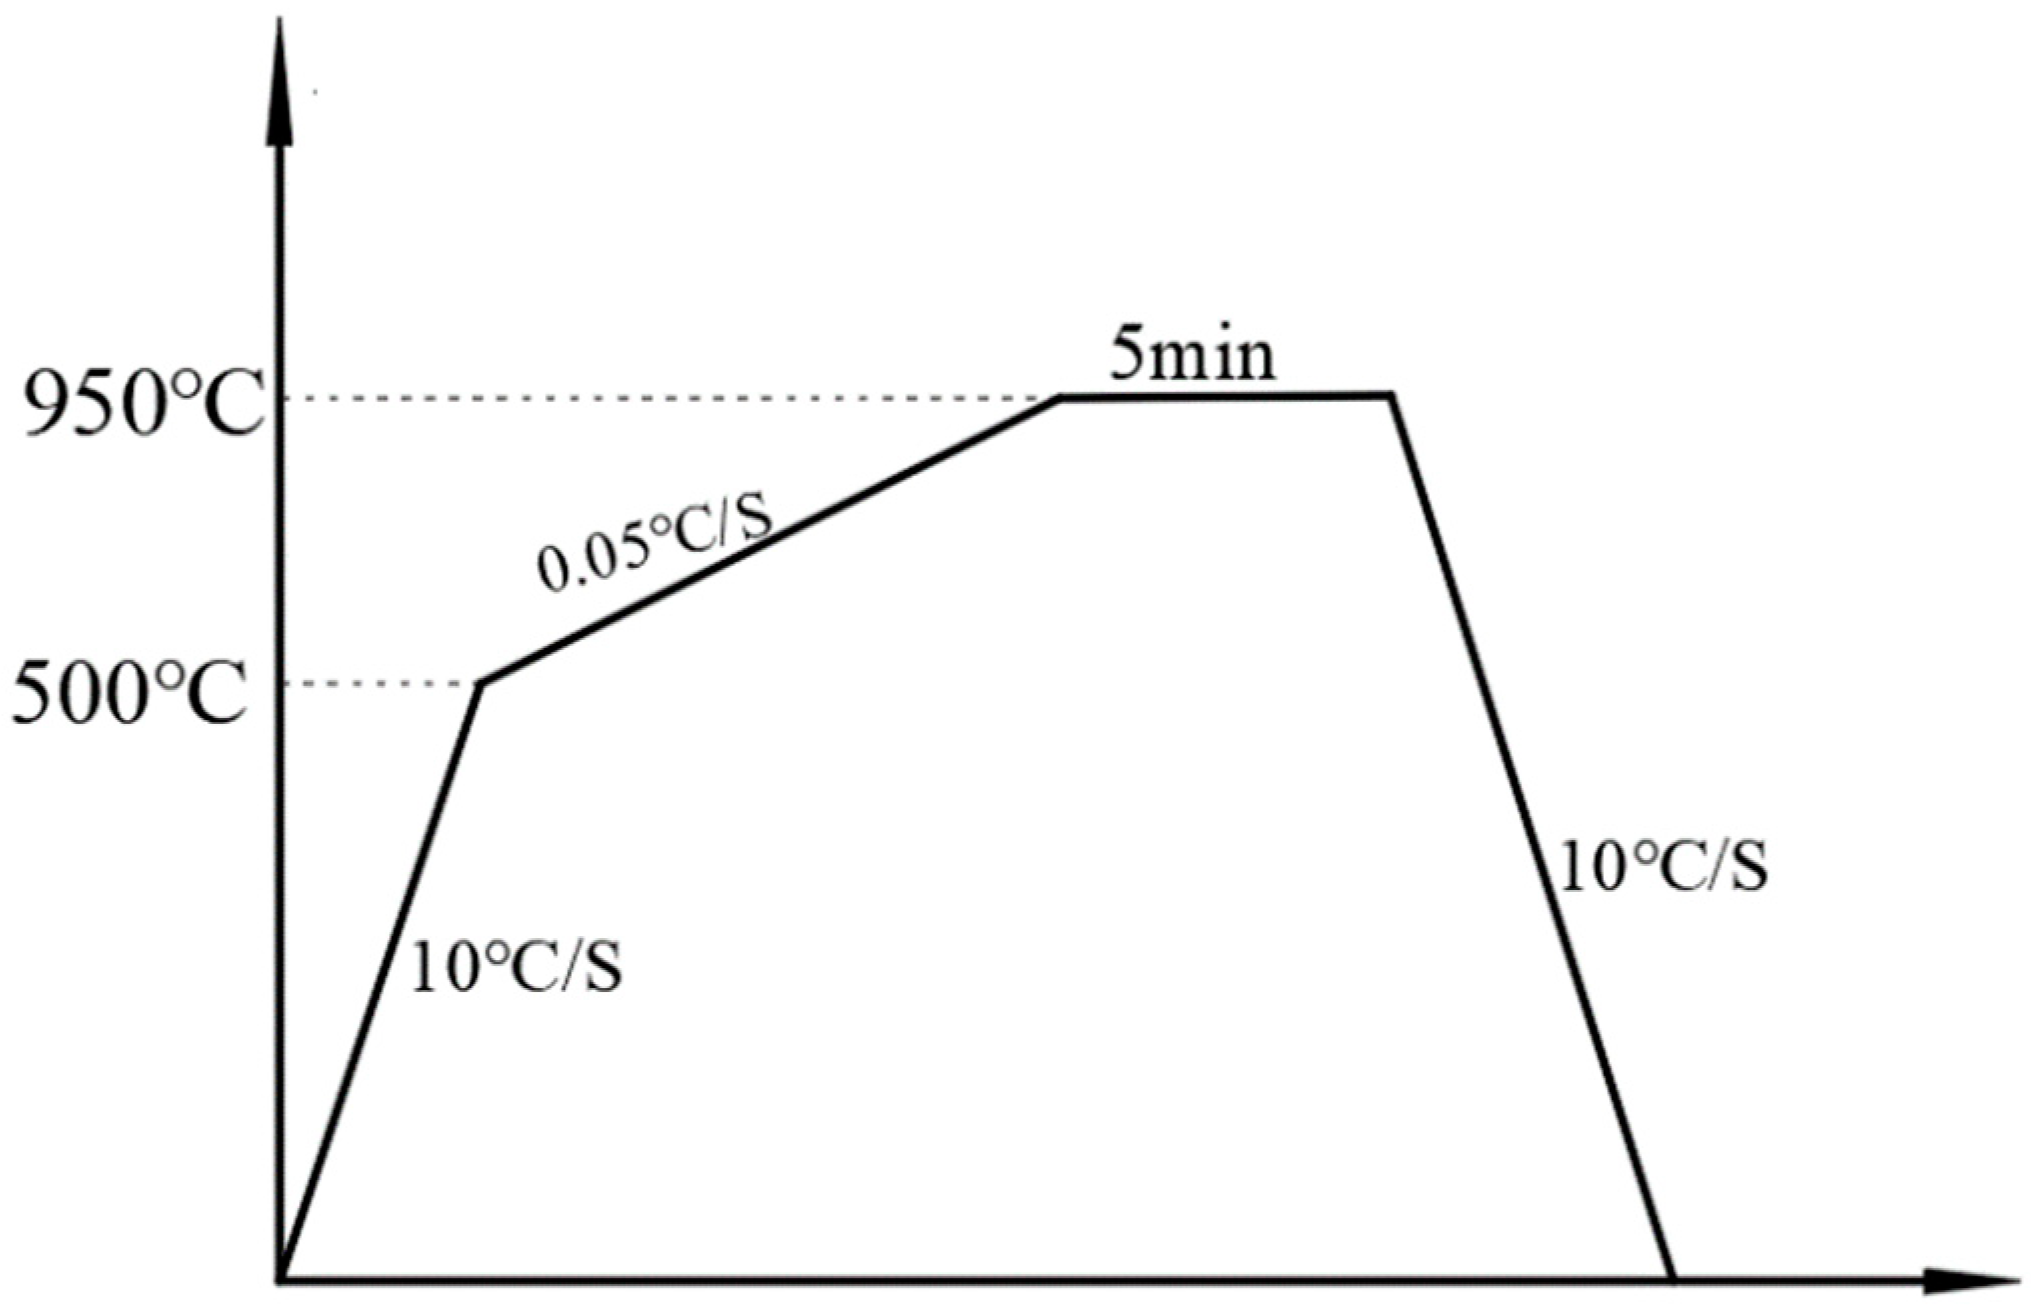
2.2. The Effect of Rare Earth Elements on the Phase Transition Point of the Test Steel

According to the requirements of YB/T 5128-2018 [11], the samples were cut for a phase transition temperature test. The experimental instrument used was the Formastor-FII automatic phase change instrument to determine the austenite phase transition temperature. The process flow adopted is as shown in Figure 1, which makes the three groups of test steels completely austenitized. The original austenite microstructure was observed with a Zeiss-Axio Observer metallographic microscope after 200–2000 Si-C sandpaper grinding.

2.3. Morphology Observation and Composition Analysis of Inclusions

The cut test steel samples were ground and polished, cleaned in an ultrasonic cleaner, and then placed in a sample dryer to prevent oxidation. The morphology and composition of inclusions were observed by FEI QUANTA 650 FEG (FEI QUANTA 650 FEG–FEI Manufacturing, Hillsboro, OR, USA) and energy spectrum.

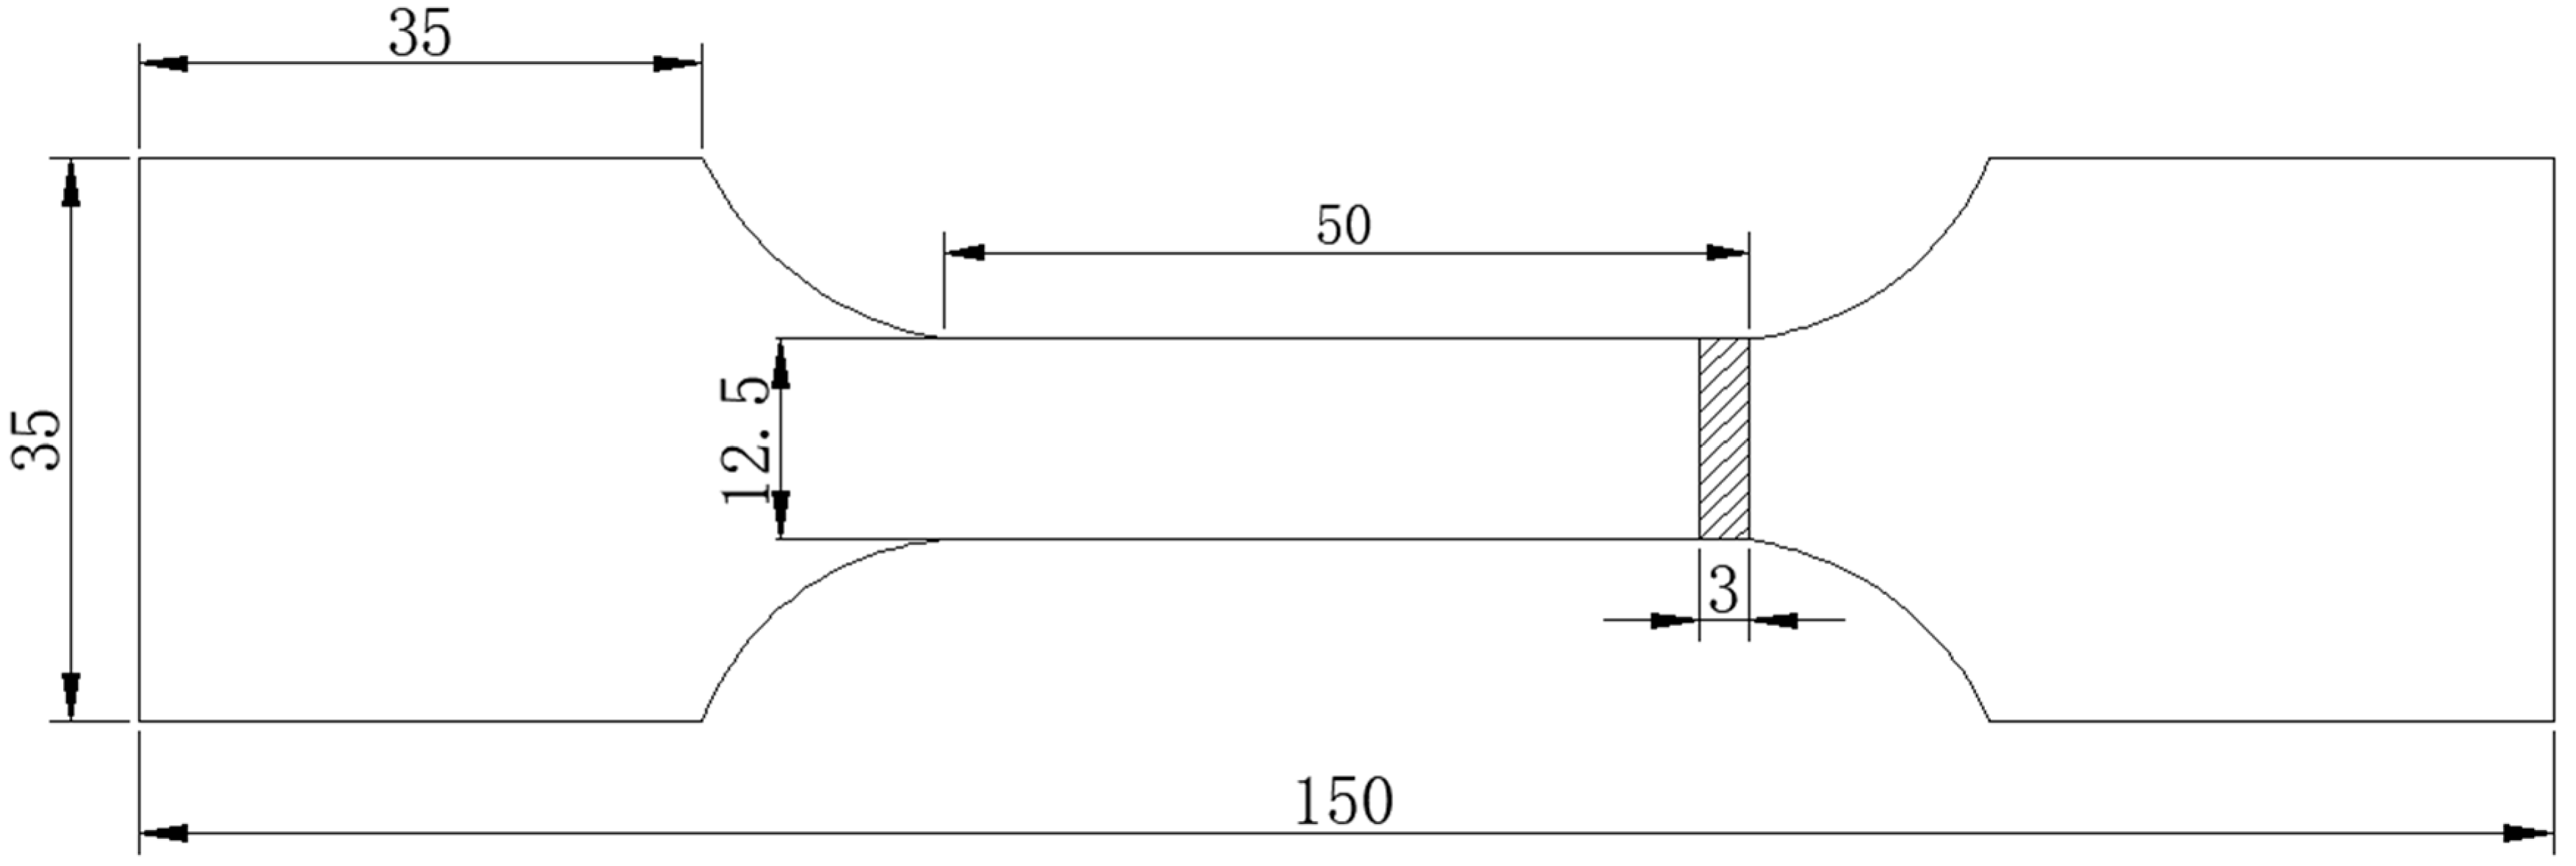
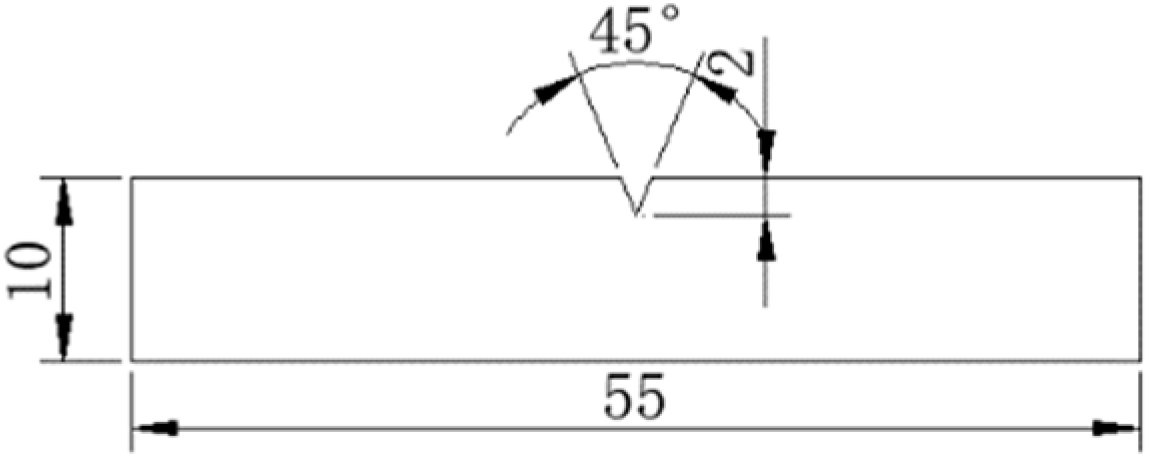
2.4. Mechanical Properties Test

According to the GB-T712-2022 [12] ship and marine engineering steel standard, the sampling method of mechanical property sample was selected. According to the requirements of GB/T228.1-2010 [13], the size of the tensile sample is shown in Figure 2, and the experimental temperature is 25 °C.
According to the national standard GB-T229-2007 [14] metal material notch impact test, the impact sample was cut by wire cutting, and the sample size is shown in Figure 3. Impact test was conducted using JBH-300 type (JBN-300 impact testing machine-China Wuzhong Tongli Material Testing Machine Co., Ltd., Wuzhong, China) oscilloscope impact testing machine. Three parallel samples were selected for each group of samples. Before the experiment, the samples were kept in the DWC-800 low temperature impact test chamber for 20 min, and the liquid nitrogen–alcohol mixed medium was used as the coolant, and the temperature was set at −40 °C, −60 °C, and −80 °C. The microstructure of the fracture was observed by scanning electron microscope. Ultrasonic cleaning was carried out before the experiment to eliminate the influence of impurities on the fracture surface.

3. Results Discussion

3.1. Original Microstructure Analysis and Phase Transformation Point Determination of Test Steel

The original structure and original austenite structure of the test steel were observed under the metallographic microscope. The metallographic structure of the three test steels is shown in Figure 4. It can be seen from the diagram that the black pearlite and white ferrite are distributed in a band along the rolling direction. From the metallographic photograph, it can be seen that the element structure of the test steel added with Ce is more uniform and the grain size is more uniform. The original austenite structure of the three test steels is shown in Figure 5. It can be seen from the figure that as the Ce content increases, the original austenite grain size of the test steel decreases. Among them, the original austenite grain of the test steel with 10 ppm Ce content is the most uniform, and the number of larger grain sizes is the least, which is concentrated in the range of smaller grain sizes. Obviously, the addition of Ce increases the phase transition temperature; at the same time, the undercooling degree is increased, so that the austenite nucleation rate is increased. The segregation at the grain boundary reduces the grain boundary energy and pinning effect, reduces the driving force of austenite growth, and strongly hinders the growth of the austenite grains.
The change in the phase transition temperature of rare earth on the test steel is shown in Table 2. The phase transformation expansion curves of three groups of test steels were measured by an automatic phase transformation instrument, and the critical temperature points were determined by the tangent method. According to the data in the table, it can be concluded that the addition of Ce increases the phase transformation temperature of Ac 1 and Ac 3. Compared with the test steel without Ce, the Ac 3 of X and Y test steel increases by 14 °C and 11 °C, respectively. Ac 1 decreased by 14 °C and 19 °C.
Because rare earth elements can inhibit the diffusion of carbon in austenite, delay the austenite transformation rate, make the austenite transformation consume more phase transformation activation energy, and slow down the transformation of pearlite to austenite, the temperature of Ac 3 phase transformation point of X and Y test steels is increased [15]. In addition, the temperature of the Ac 1 phase transition point of X and Y test steels decreases. This is because the surface activity of rare earth elements is high, and the rare earth compounds are evenly distributed in the steel, which can reduce the energy required for the critical nucleation of austenite and promote the nucleation of the nucleus core [16]. In the study of Zhang [17], as shown in Figure 6, after adding rare earth elements, rare earth elements are easy to segregate around the dislocation line, which plays a role in pinning the dislocation, and the dispersion distribution of rare earth inclusions increases the shear strength of austenite, making the Ac1, Ac3, and other phase transition points change.

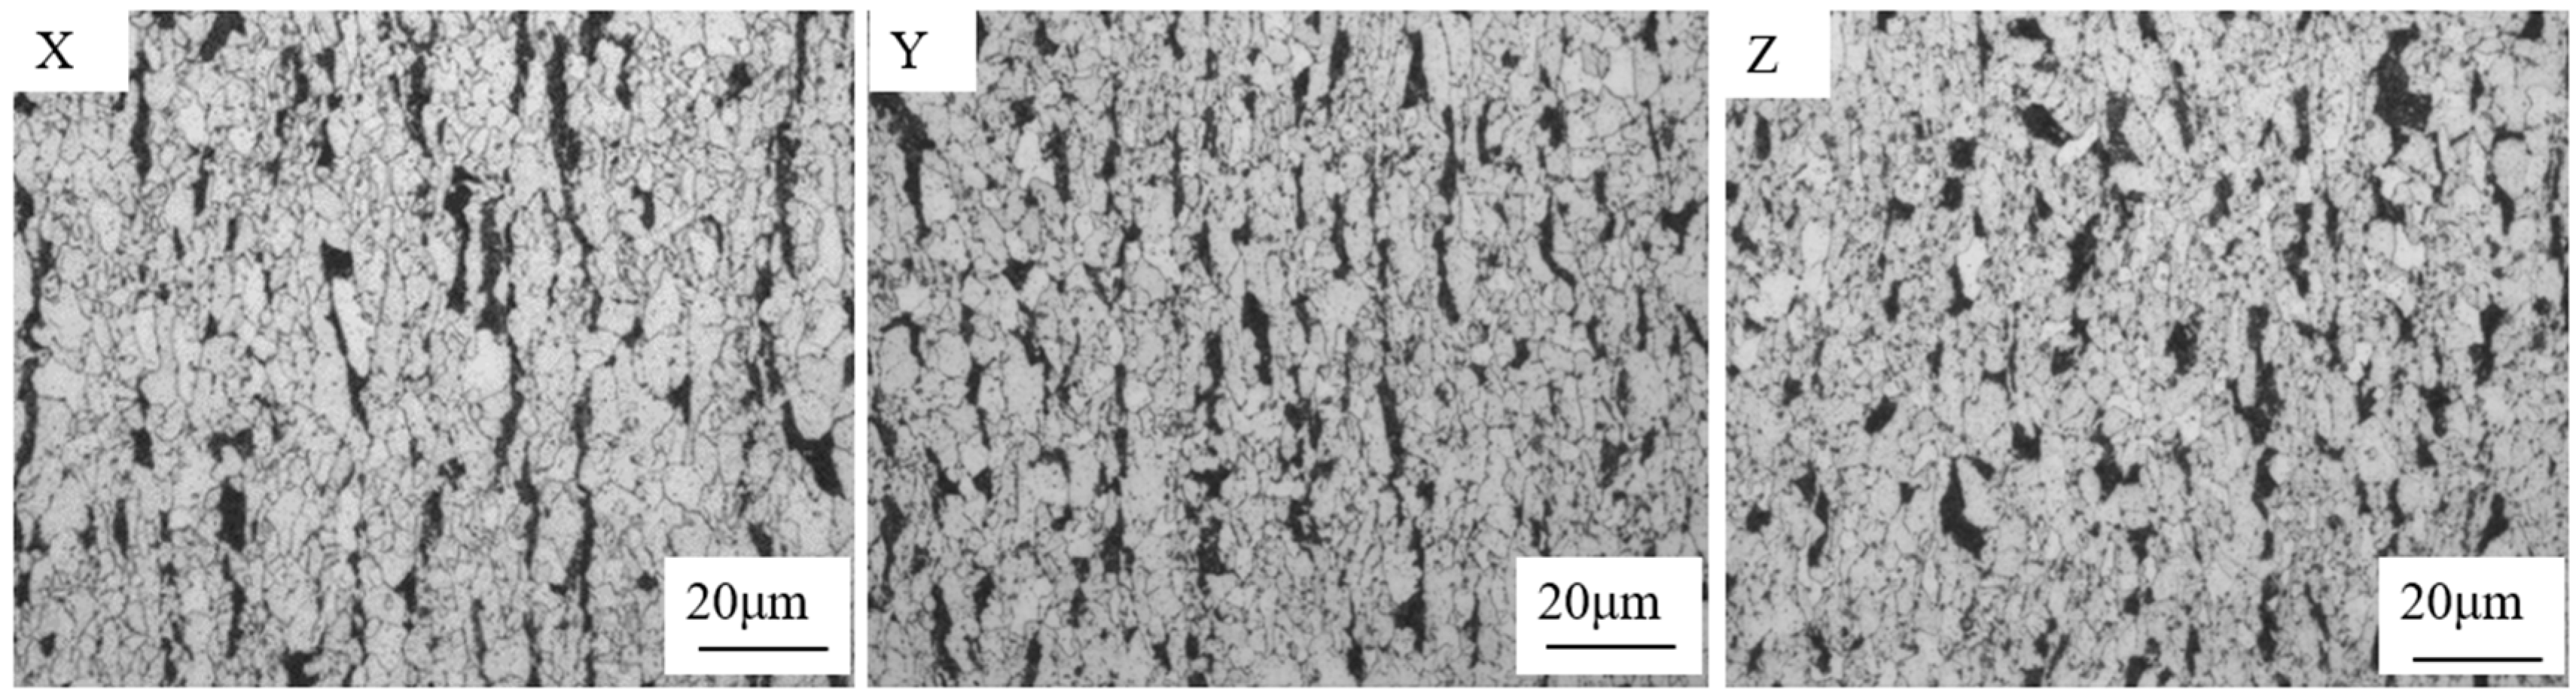
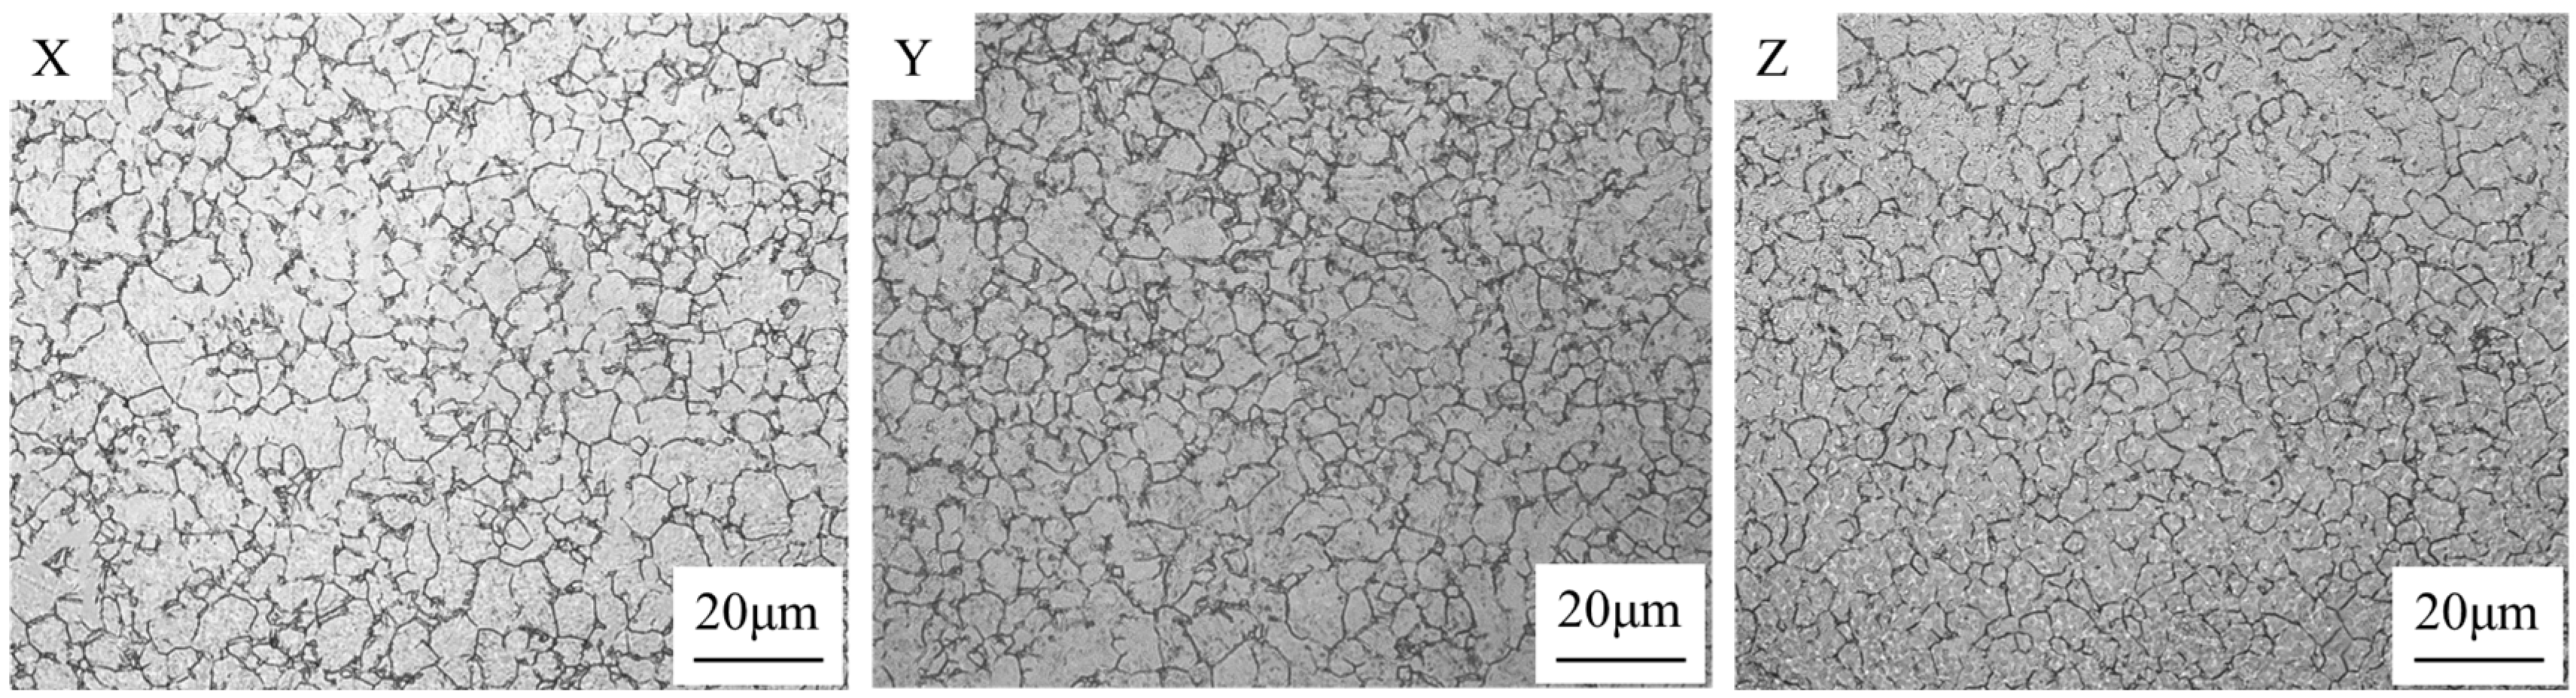
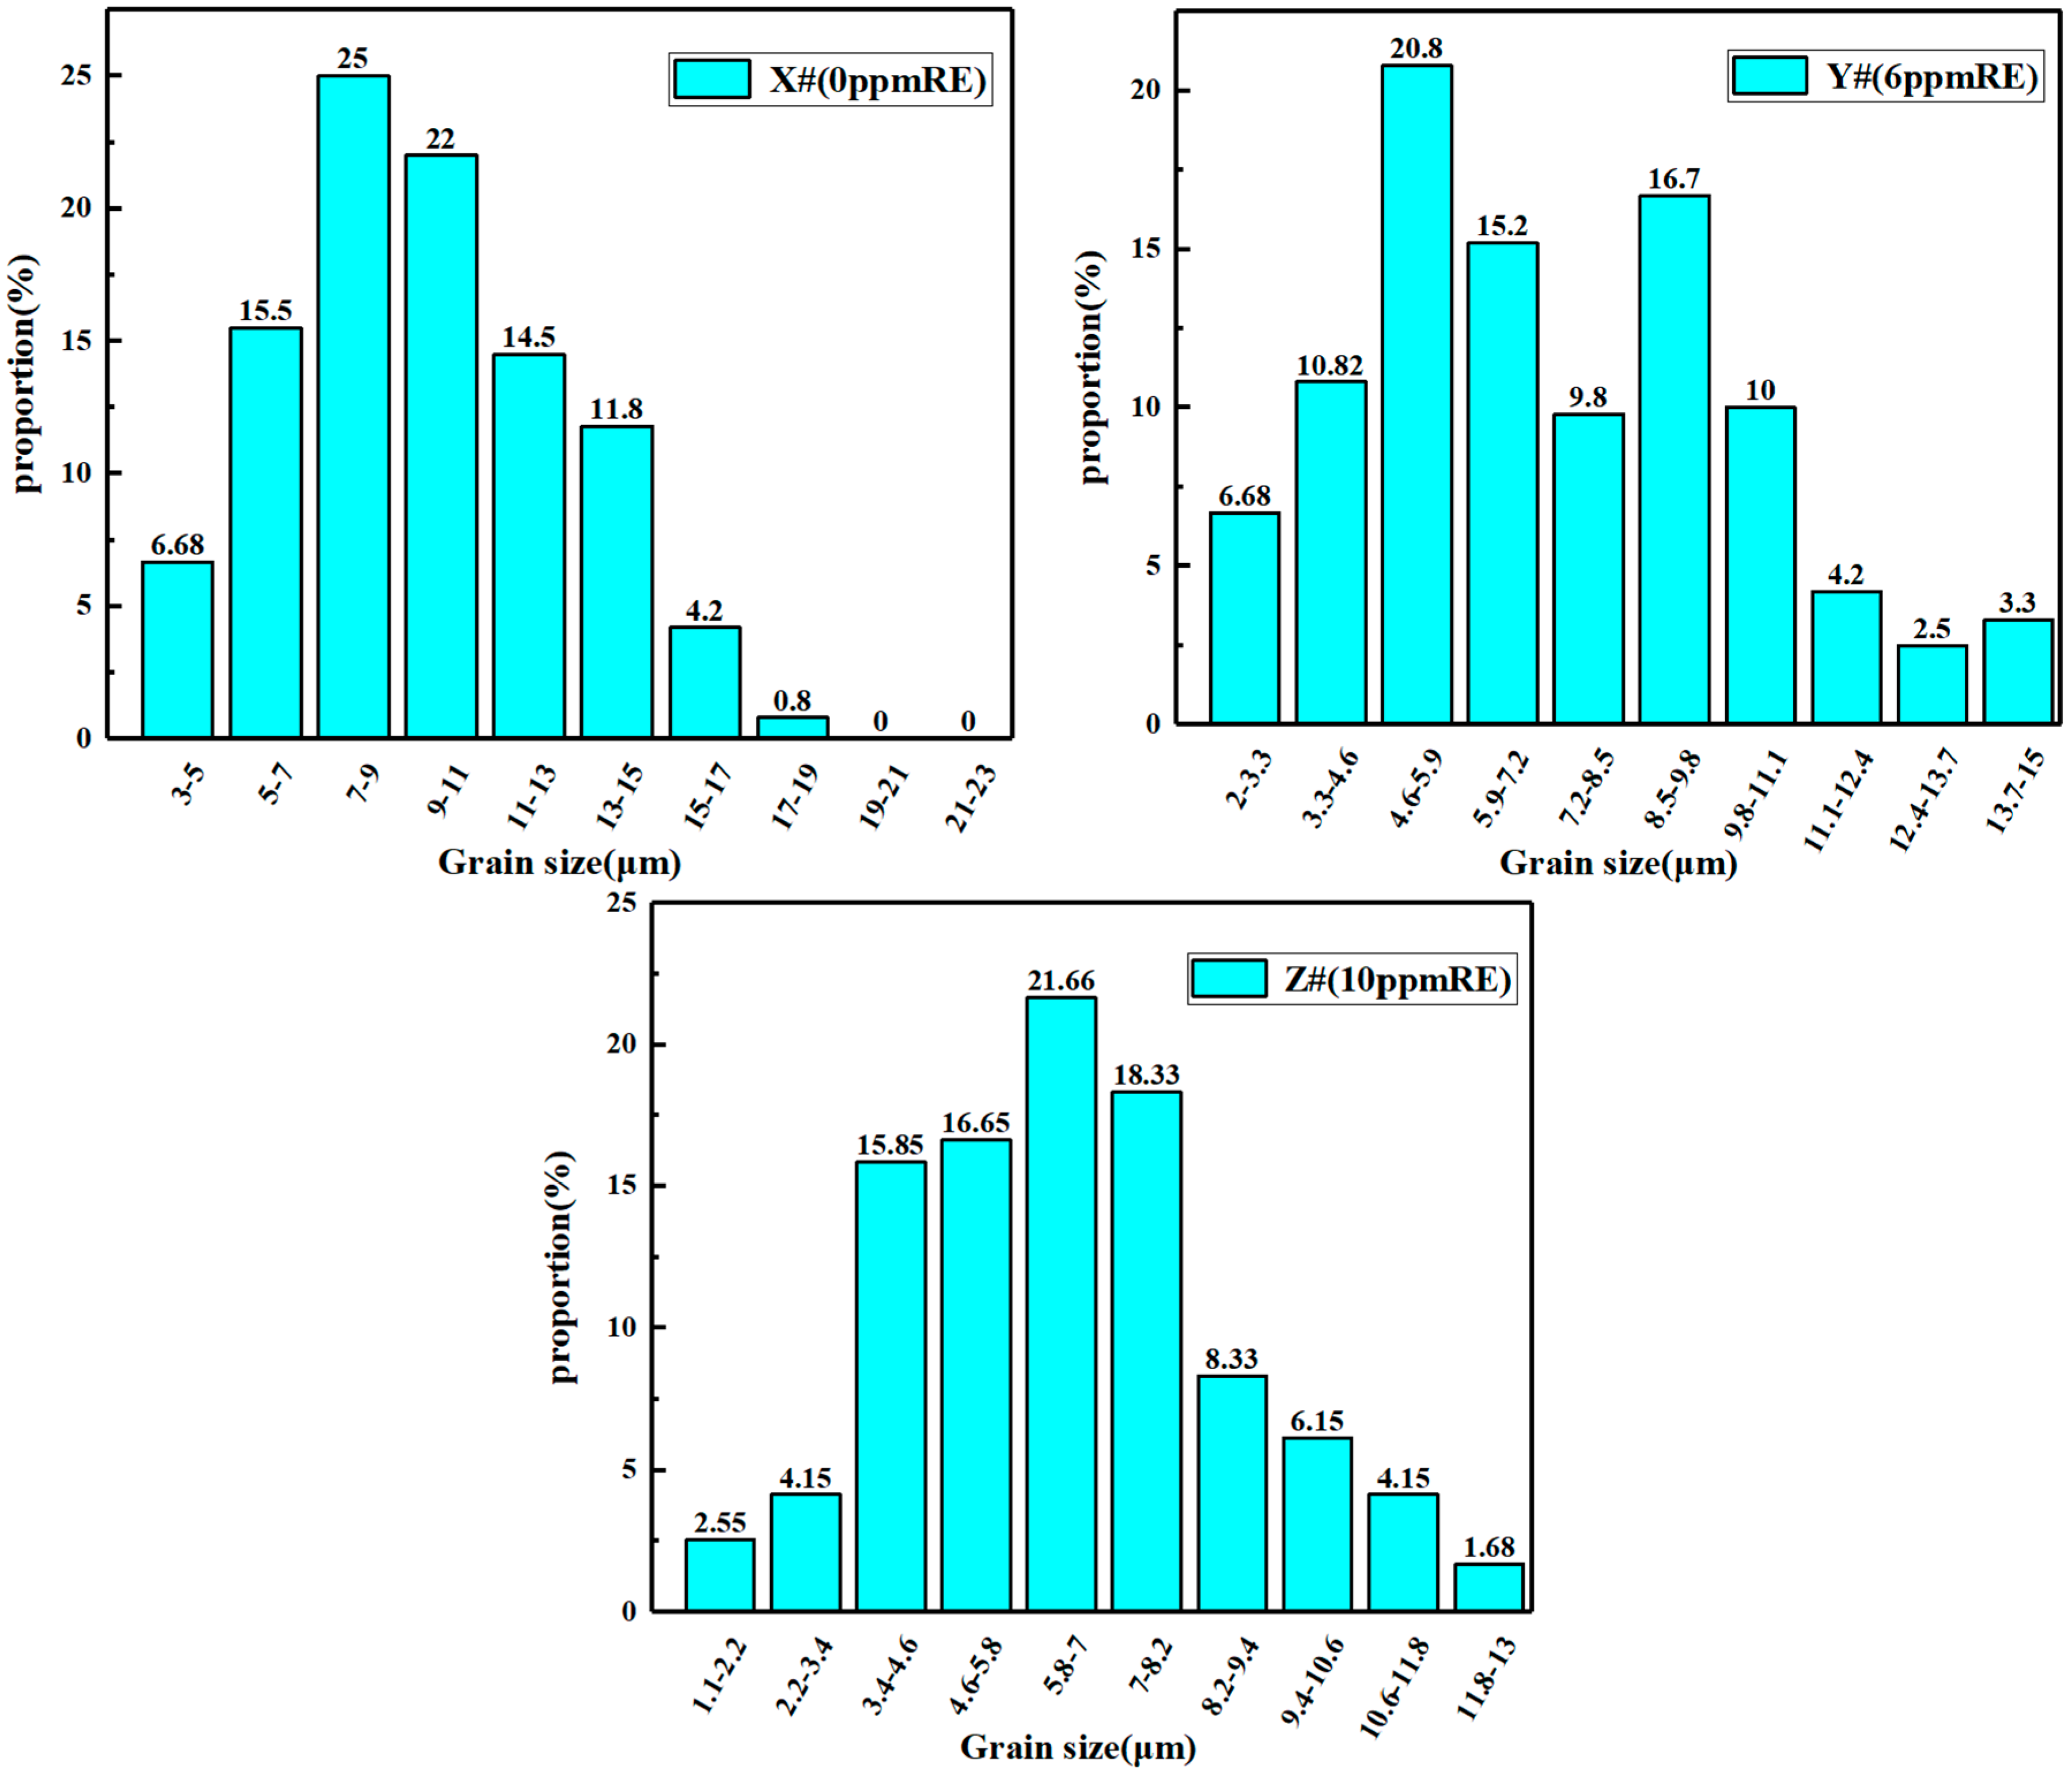
3.2. Effect of Trace Ce on the Original Austenite Grain Size

The original austenite grain size of the three groups of test steels was statistically analyzed by Image Pro Plus 6.0 (IPP) software. Figure 7 shows the distribution and statistics of the original austenite grain size of X, Y, and Z test steels. The average grain sizes of X, Y, and Z test steels are 9.1 μm, 7.325 μm, and 6.5 μm, respectively. The X test steel without Ce addition is mainly distributed between 3 and 8 μm, accounting for about 40%, and the large grains above 13.0 μm account for about 5.83%. After adding Ce, the grain number of Y test steel between 3 and 8 μm accounts for about 56.66% of the total grain, while the grain above 13.0 μm accounts for about 1.67% of the total grain. The number of grains between 3 μm and 8 μm in Z test steel is about 72.5%, and there are almost no grains above 13.0 μm.
This shows that the addition of Ce can refine the microstructure of weathering steel and achieve the effect of grain refinement. With the increase in rare earth content, the grain refinement effect is more obvious. It further proves the reliability of the tangent analysis method to measure the phase transition temperature of X #, Y #, and Z # test steels.

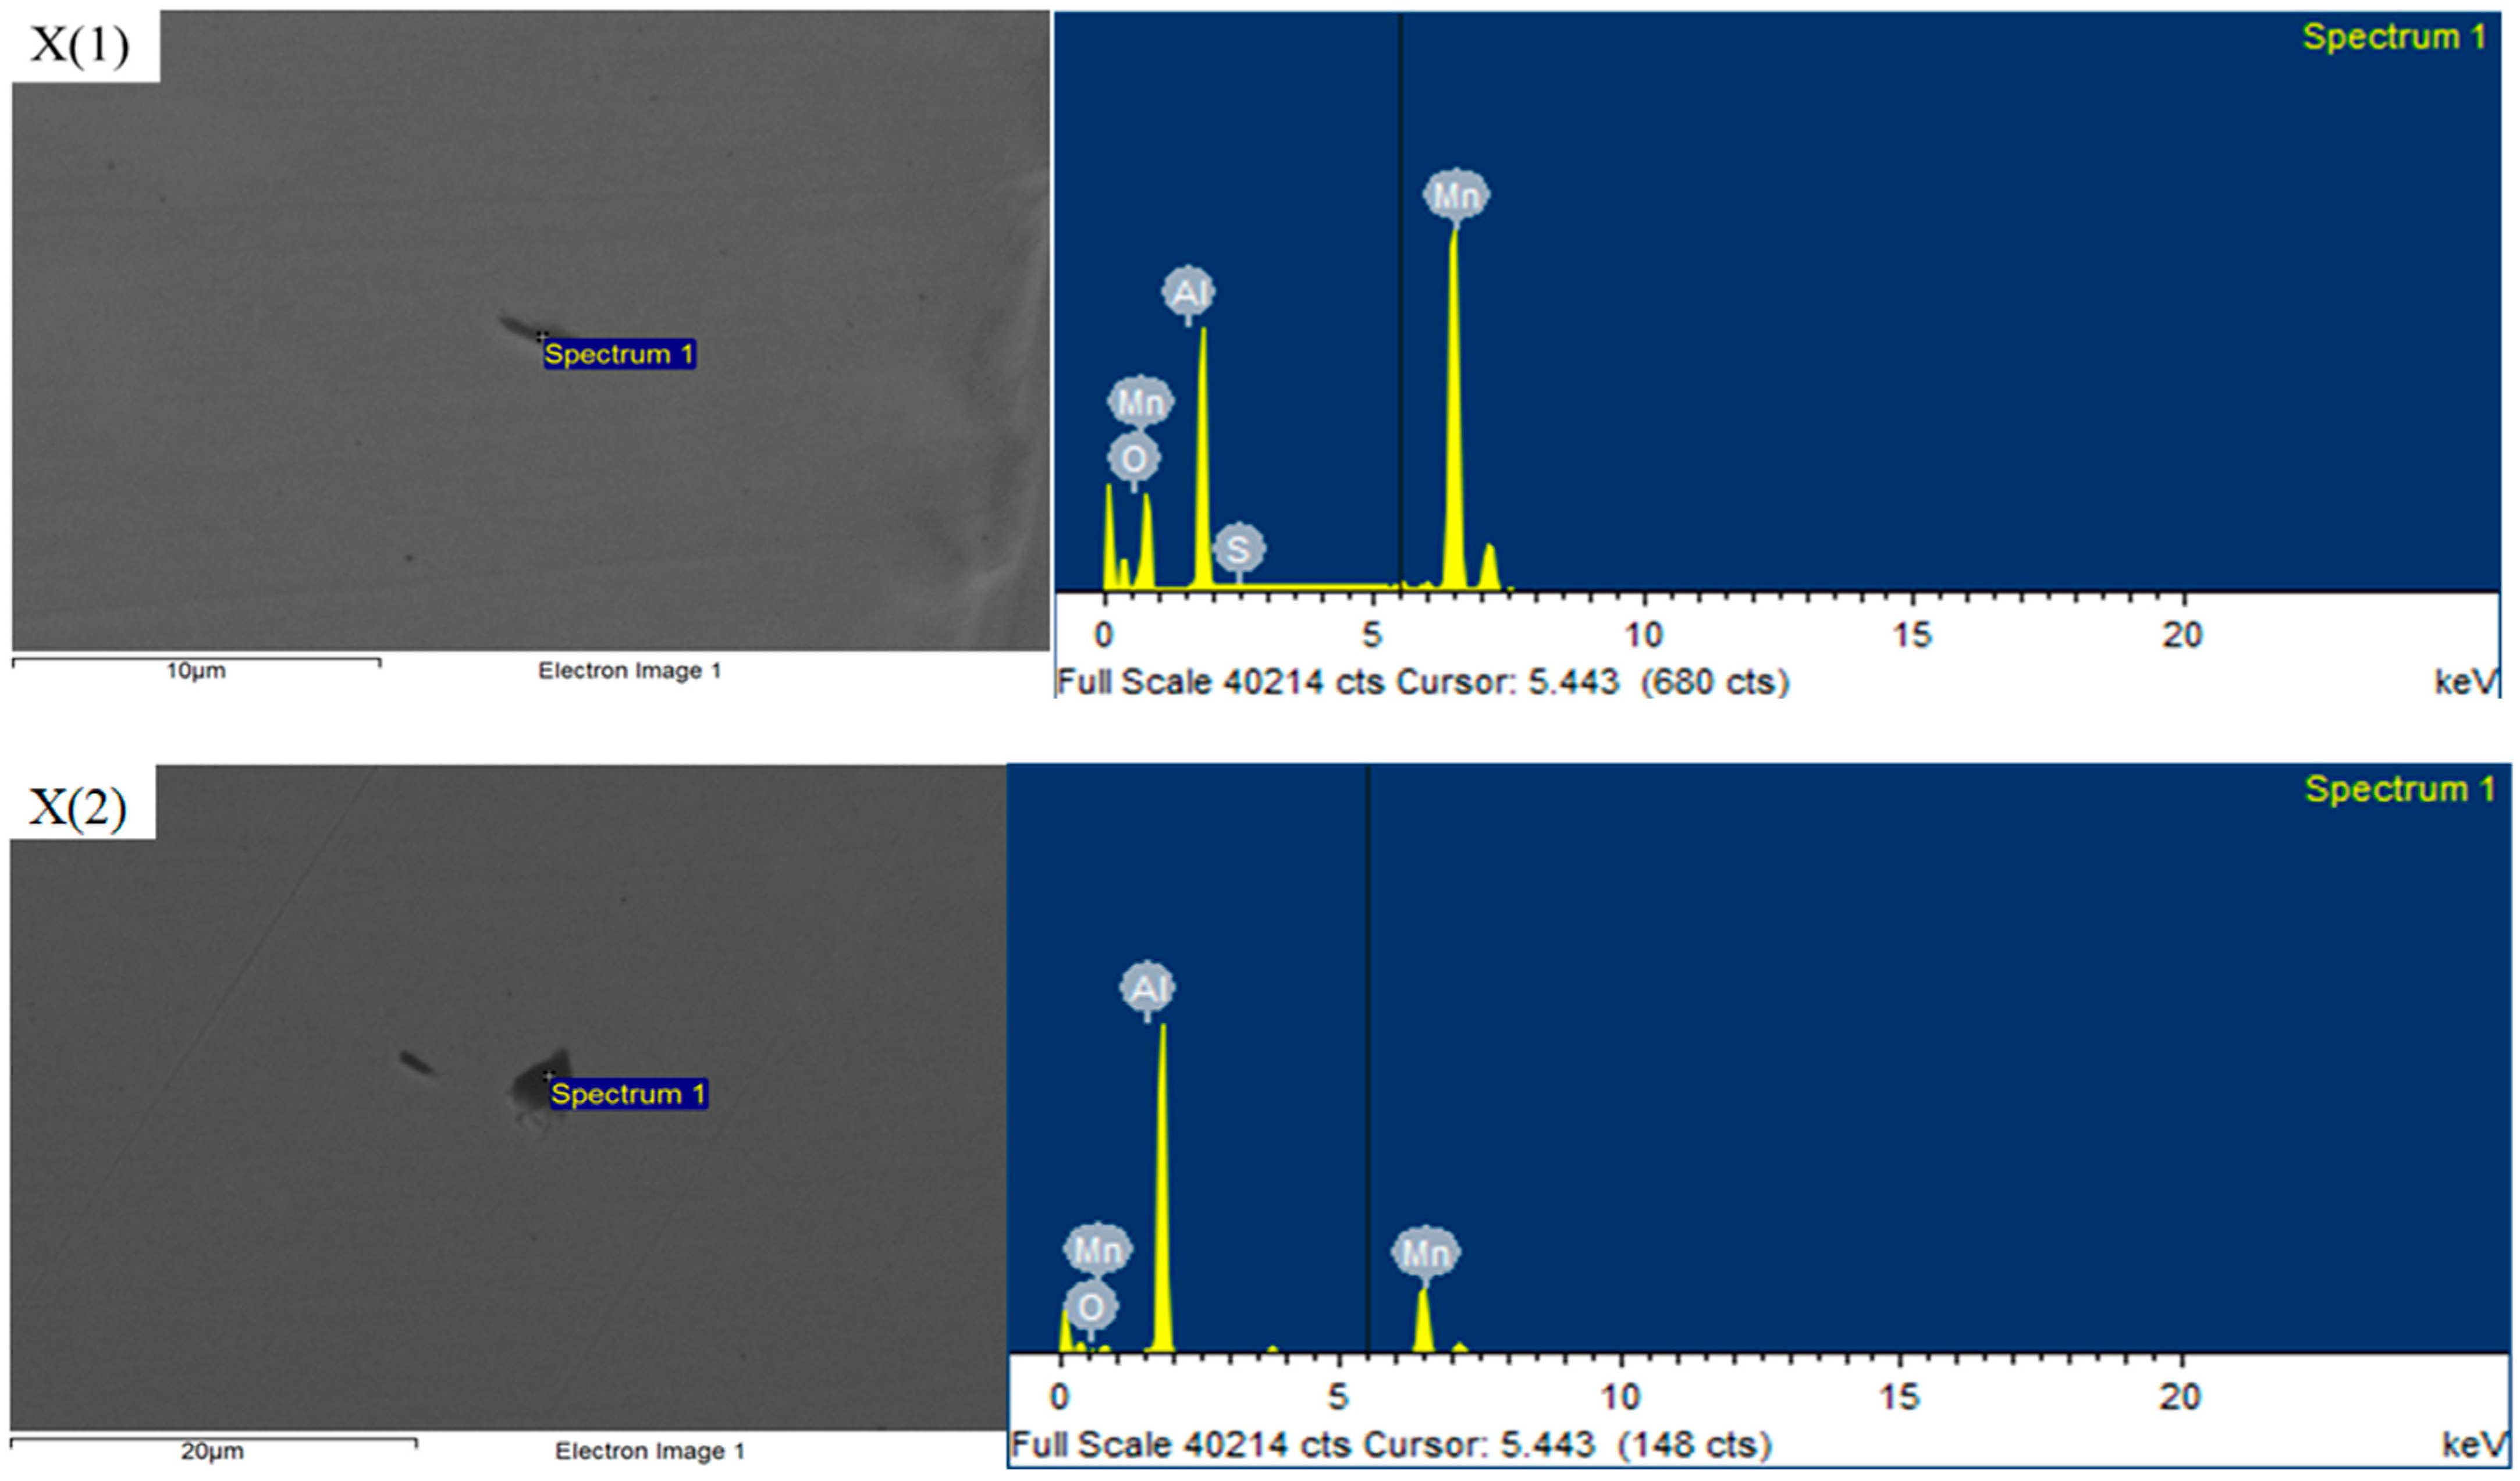
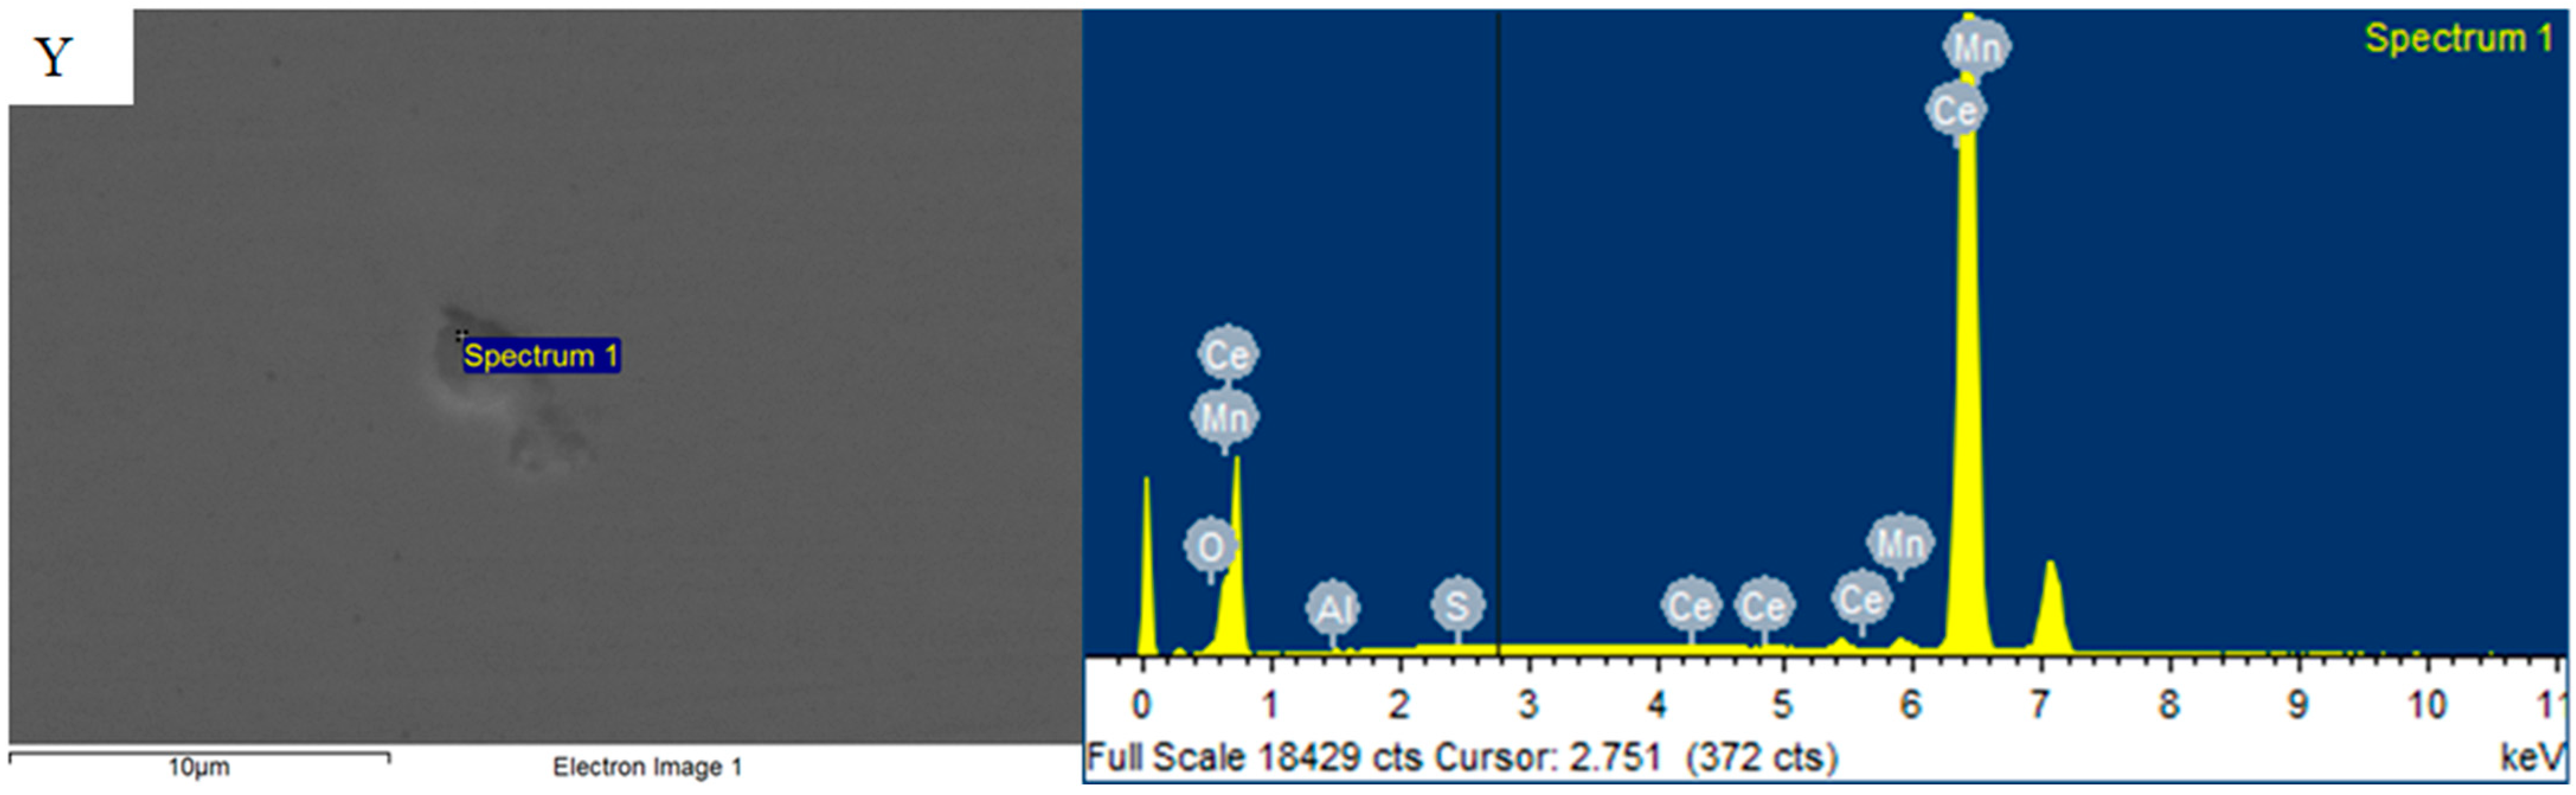
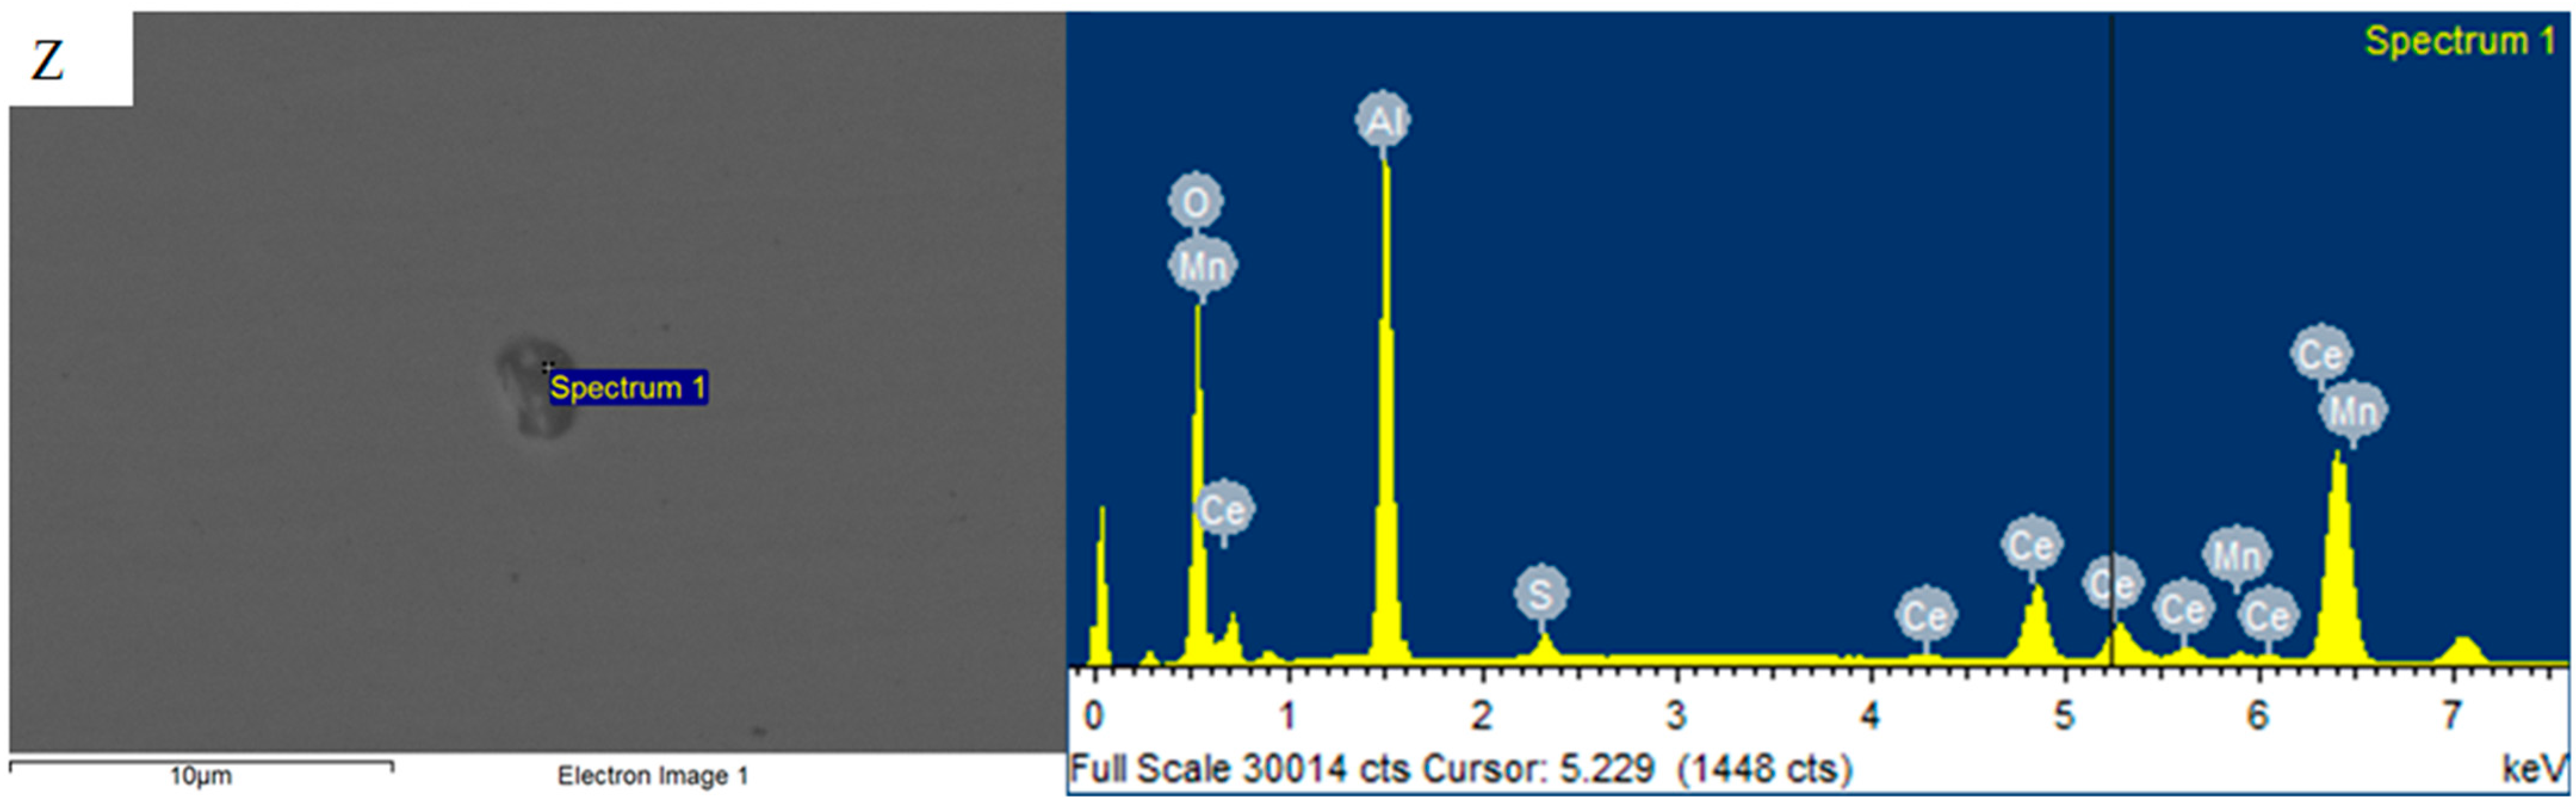
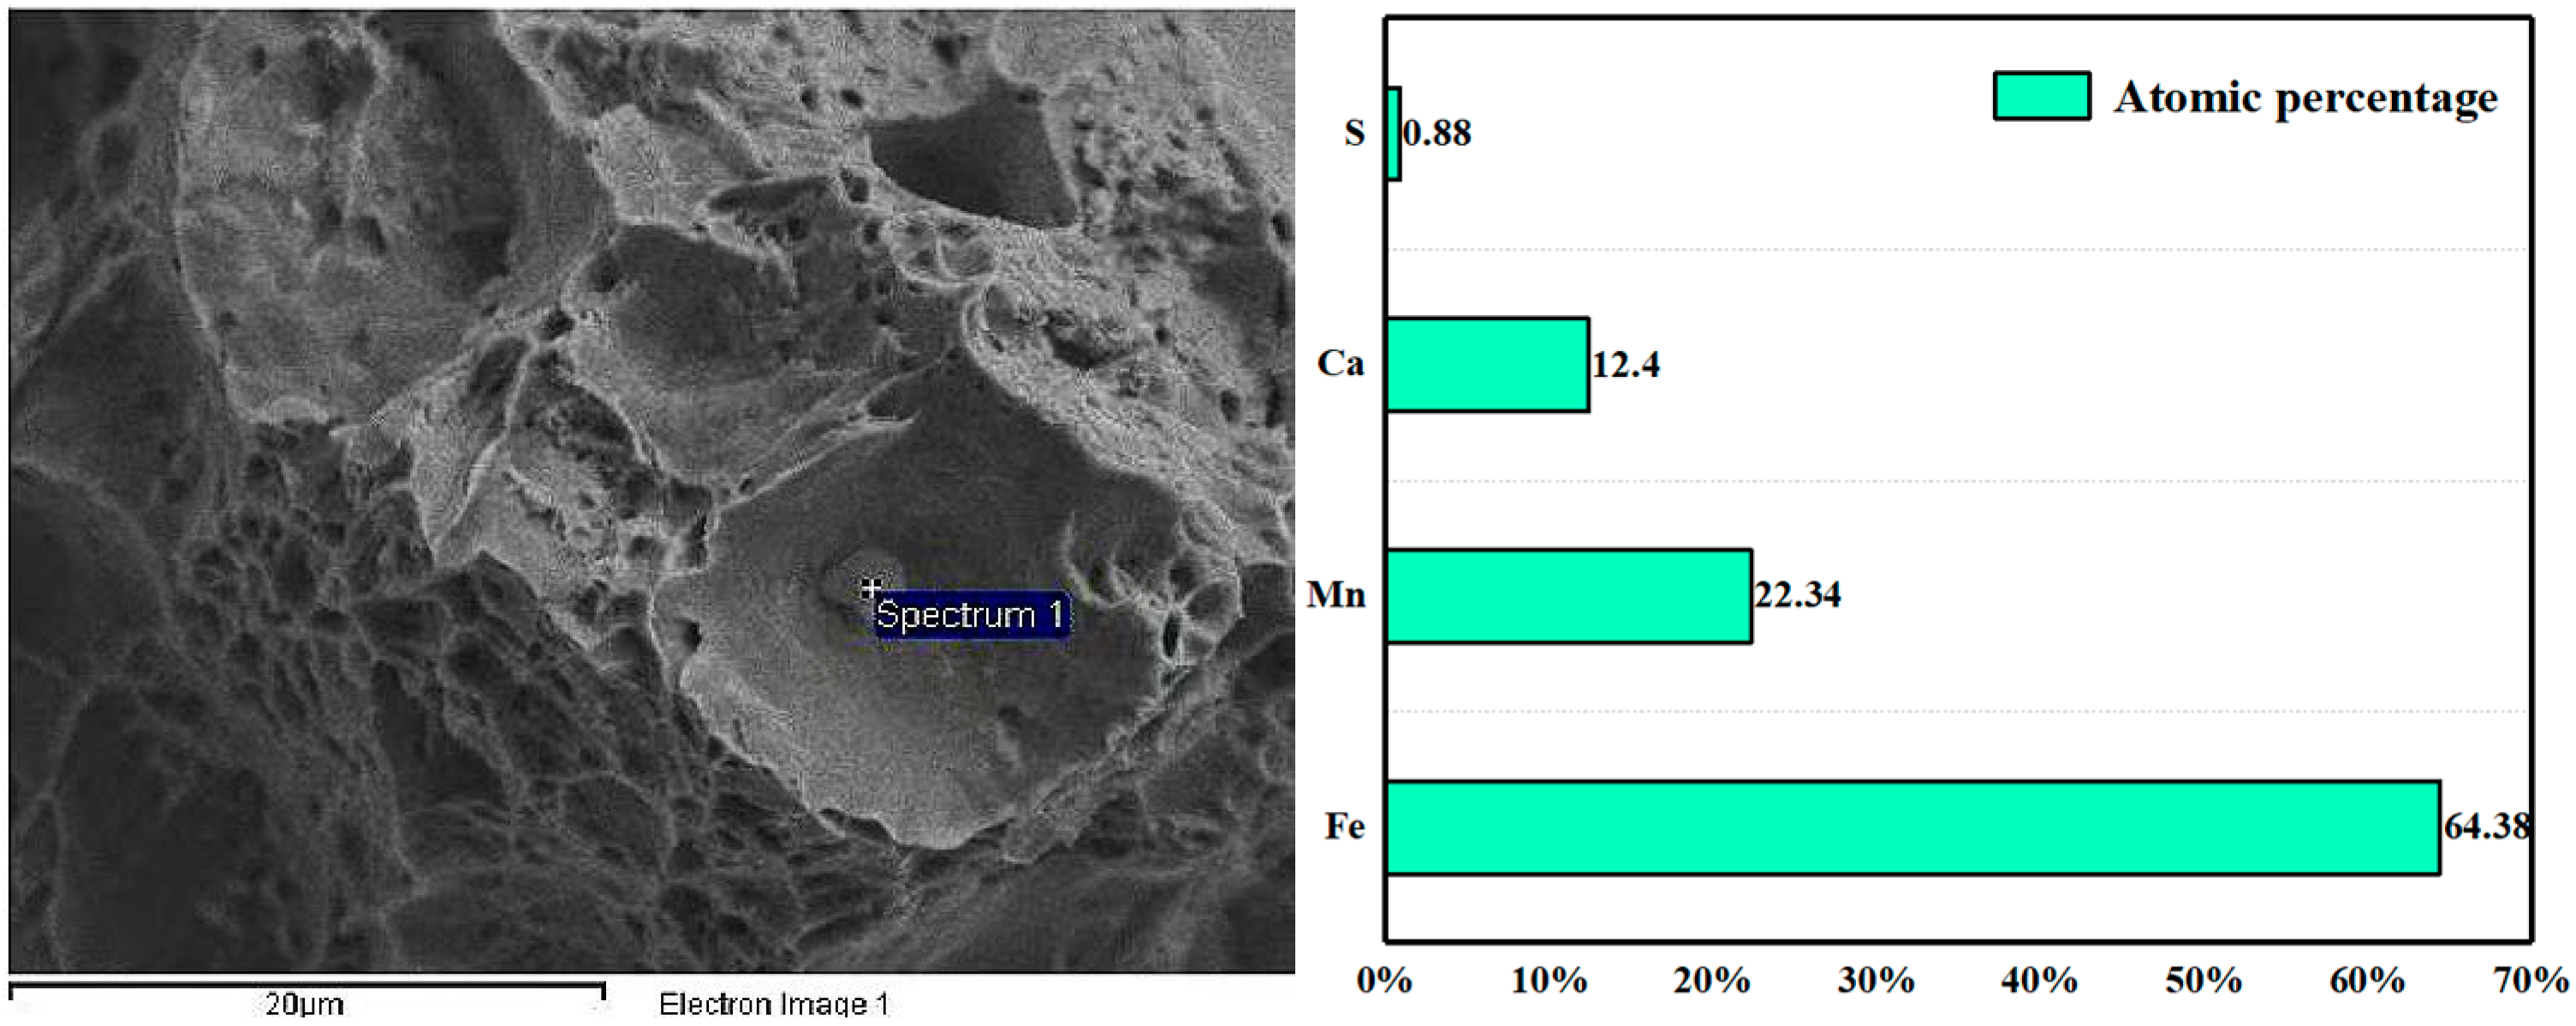
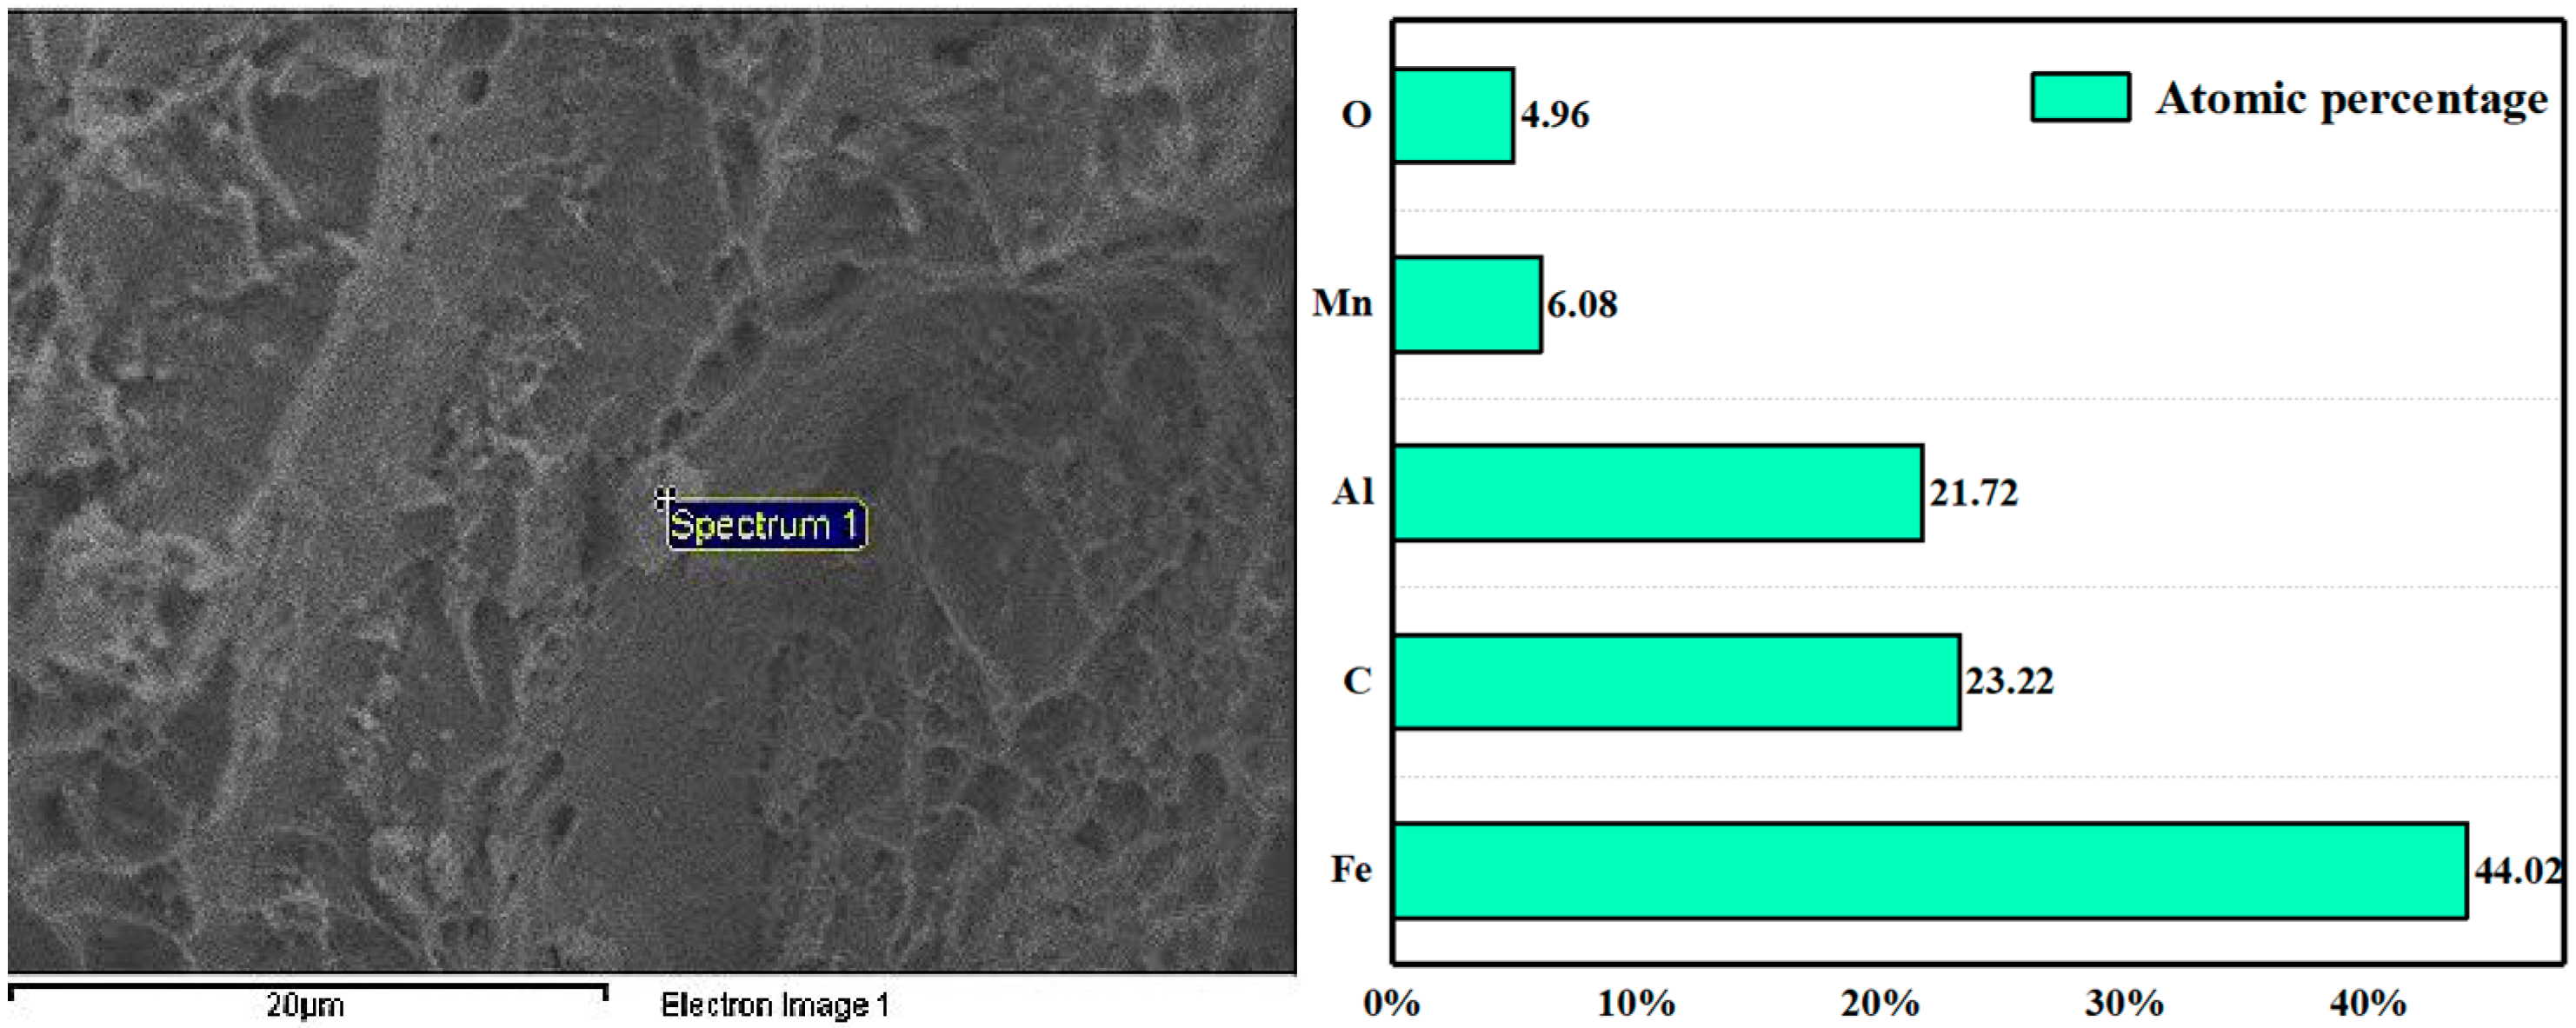
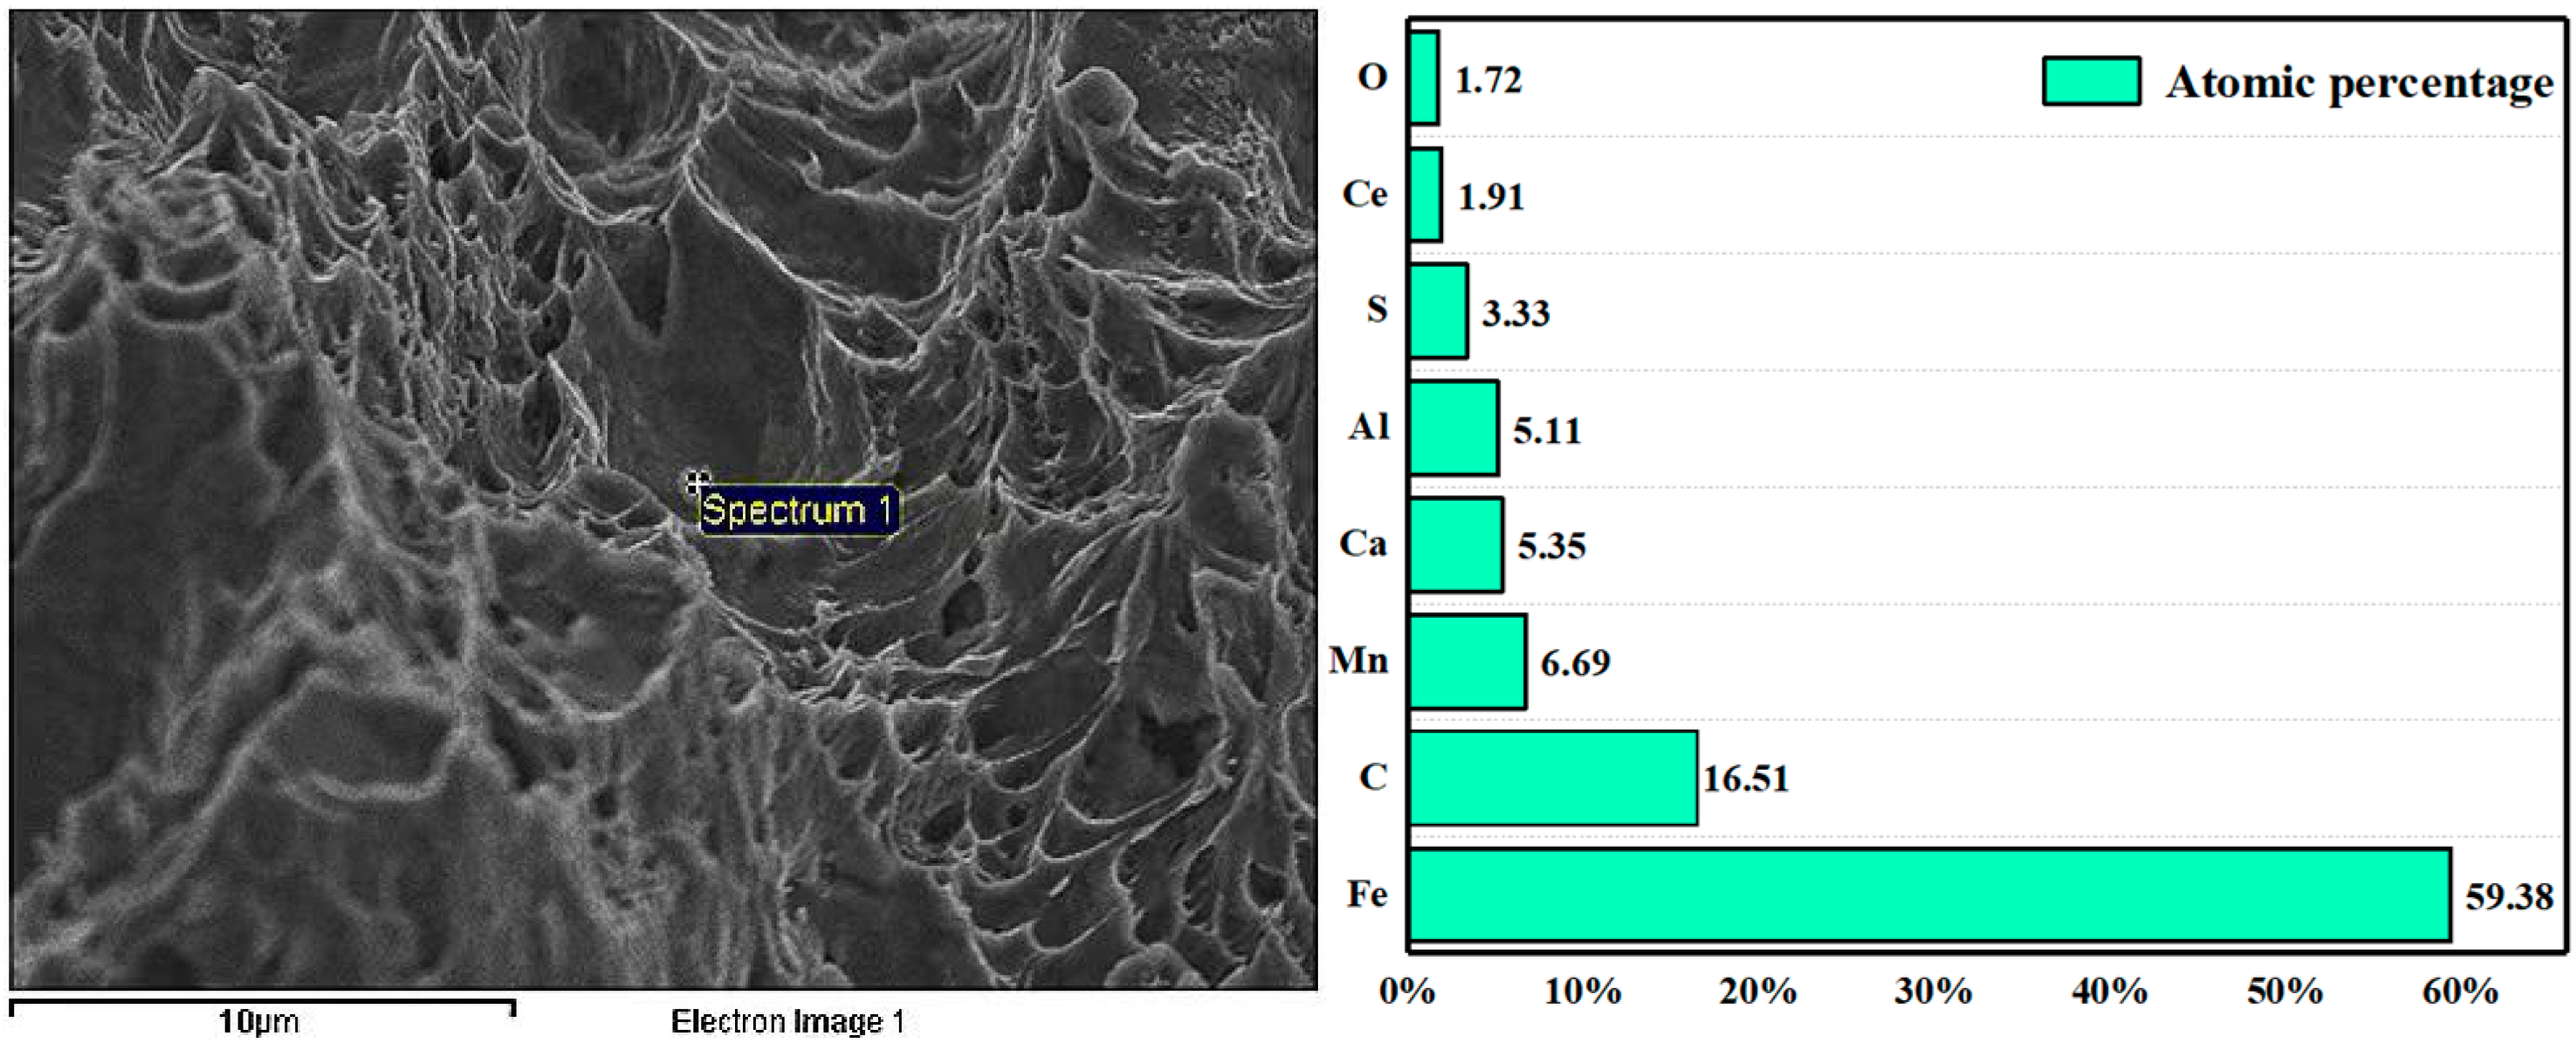
3.3. Mechanism of Rare Earth Element Ce on Inclusions

Through SEM observation and energy spectrum analysis of the test steel samples, the modification mechanism of Ce on steel inclusions was obtained. As shown in Figure 8, the inclusions in the X test steel without Ce addition are long strip MnS and irregular polygonal Al2O3, and the long strip MnS is mostly above 8 μm. During the rolling process, the breakage leads to a decrease in the continuity of the steel matrix, resulting in a decrease in the mechanical properties of the steel [18]. Irregular polygonal Al2O3 is brittle, and the corners easily cause stress concentration to produce microcracks [19,20,21]. Cao et al. calculated the work function of inclusions in steel on different crystal planes using the first principle. The work function reflects the difficulty of electron escape in the material or the minimum work performed by electrons escaping from the Fermi level to the vacuum level. The lower the work function, the lower the energy required for electron escape, and the more prone to corrosion. It can be calculated that the work function of Al2O3 is higher than that of the matrix, while the work function of MnS is lower than that of the matrix [22], which indicates that sulfide is more prone to corrosion. It is found that sulfides have poor thermal stability and are prone to pitting corrosion. When subjected to force, stress concentration easily occurs at the pitting corrosion, which affects the mechanical properties of the matrix.
Figure 9 and Figure 10 are the SEM and energy spectrum of inclusions containing Ce. It can be seen from the electron microscope images that the addition of Ce transforms irregularly shaped large-sized inclusions into fine spherical rare earth inclusions. Because rare earth elements have a higher affinity with S and O [23], the free energy of rare earth inclusions formed is lower than that of other types of inclusions. The RE element added to the steel first reacts with O and S elements, and then the excess rare earth elements react with P to form RE-O-S-P or RE-S-P inclusions. Rare earth elements can also be enriched on the surface of the original inclusions and eventually metamorphosed into rare earth inclusions. Rare earth inclusions have larger contact angles, low wettability, and large surface tension in molten steel, so rare earth inclusions are mostly spherical [24]. From the energy spectrum diagram, it can be seen that the inclusions formed by the reaction of trace Ce with O and S in the experiment are composite inclusions containing MnO and Al2O3, and the morphology of the inclusions is improved and the size is reduced, which improves the overall mechanical properties of the test steel.

3.4. Effect of Trace Rare Earth Element Ce on Mechanical Properties of Test Steel

The mechanical properties of the three test steels were measured at room temperature, as shown in Table 3. The trace Ce almost does not affect the mechanical properties of them. However, the addition of the Ce element greatly improves the low temperature impact toughness of the test steel. As shown in Figure 11, the low temperature impact toughness data of the three sheets of steel are integrated by origin, and the change in the absorption work of the test steel at different temperatures can be obtained. Figure 10 shows that at the same temperature, the addition of the Ce element enhances the absorptive properties of the test steel and improves its low-temperature brittleness to some extent.
From the histogram, it is evident that the impact toughness of the three groups of test steels increases with the increase in Ce content. The impact energy of the test steel with 10 ppm Ce content is about 60 J higher than that of the test steel without rare earth elements, and the low temperature impact toughness service performance of the test steel with Ce is better. Moreover, it can be seen from the absorption work histogram that the impact resistance of the test steel containing 10 ppm rare earth content is significantly better. This is because there is a small stress concentration and good adhesion between the rare earth inclusions and the matrix, which increases the energy required for crack initiation and propagation. In addition, the hardness of rare earth inclusions is large, so the crack propagation has to bypass the rare earth inclusions, which greatly increases the length of crack propagation. After the reaction of rare earth elements with O and S, the segregation of the rare earth elements at grain boundaries is reduced, which plays a role in purifying the grain boundaries. This results in the grain boundaries being strengthened and initial cracks reduced.

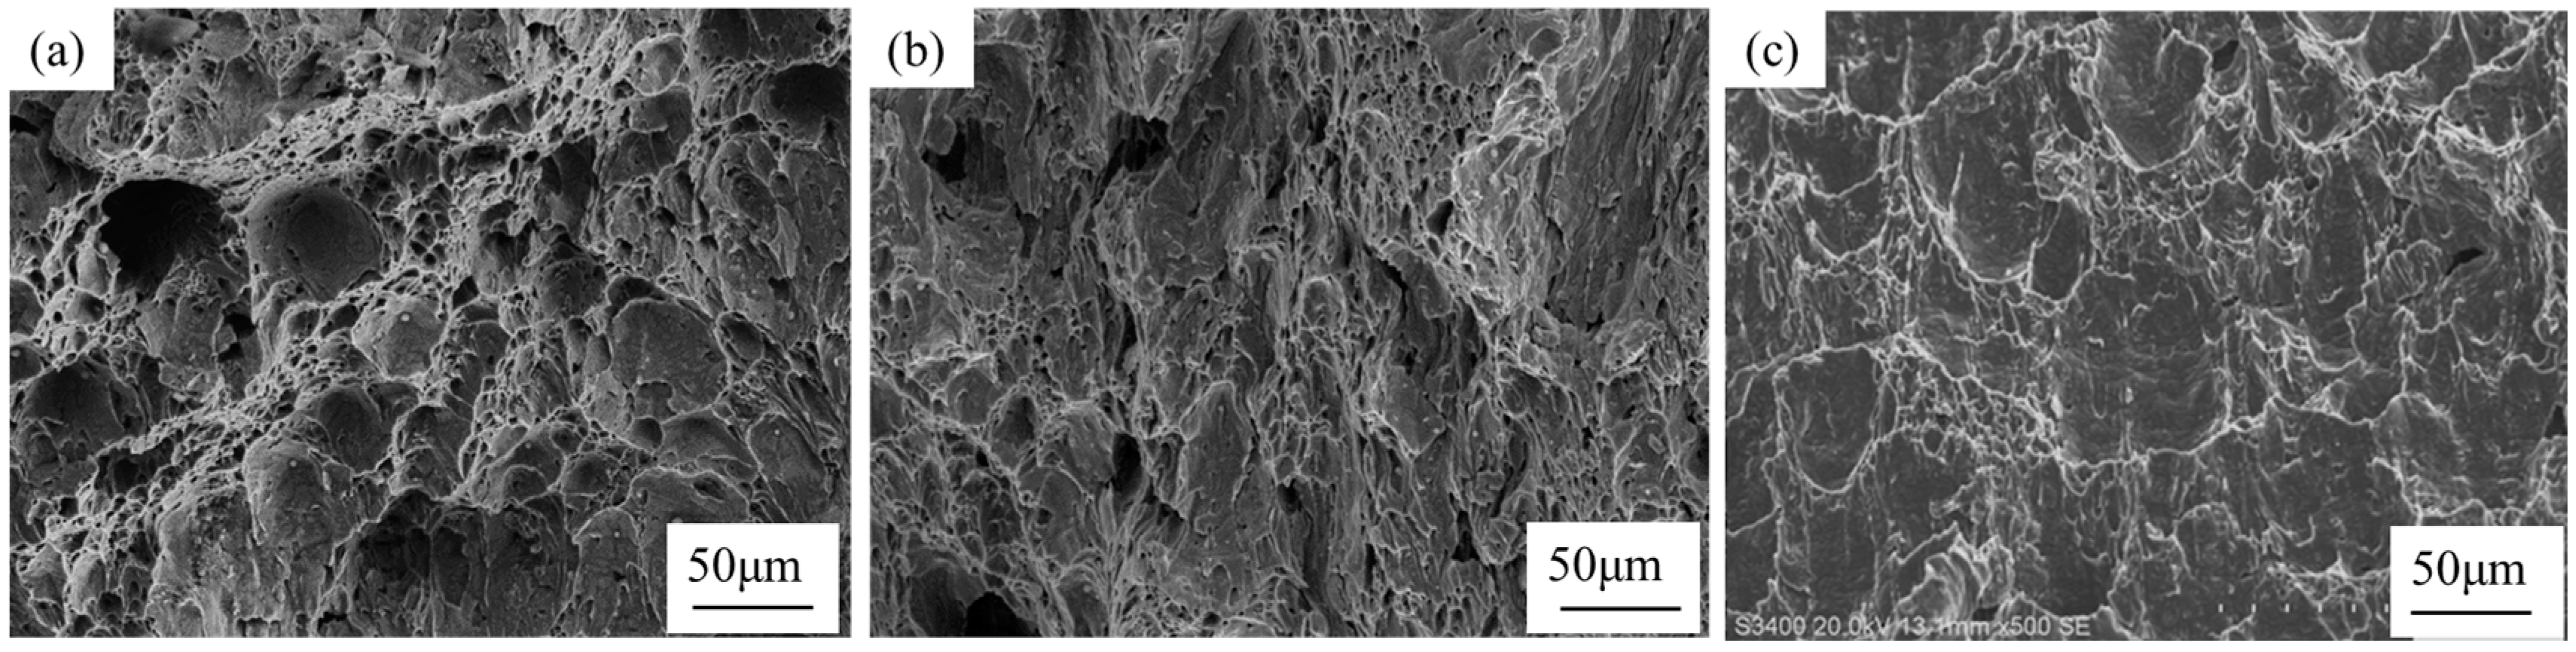
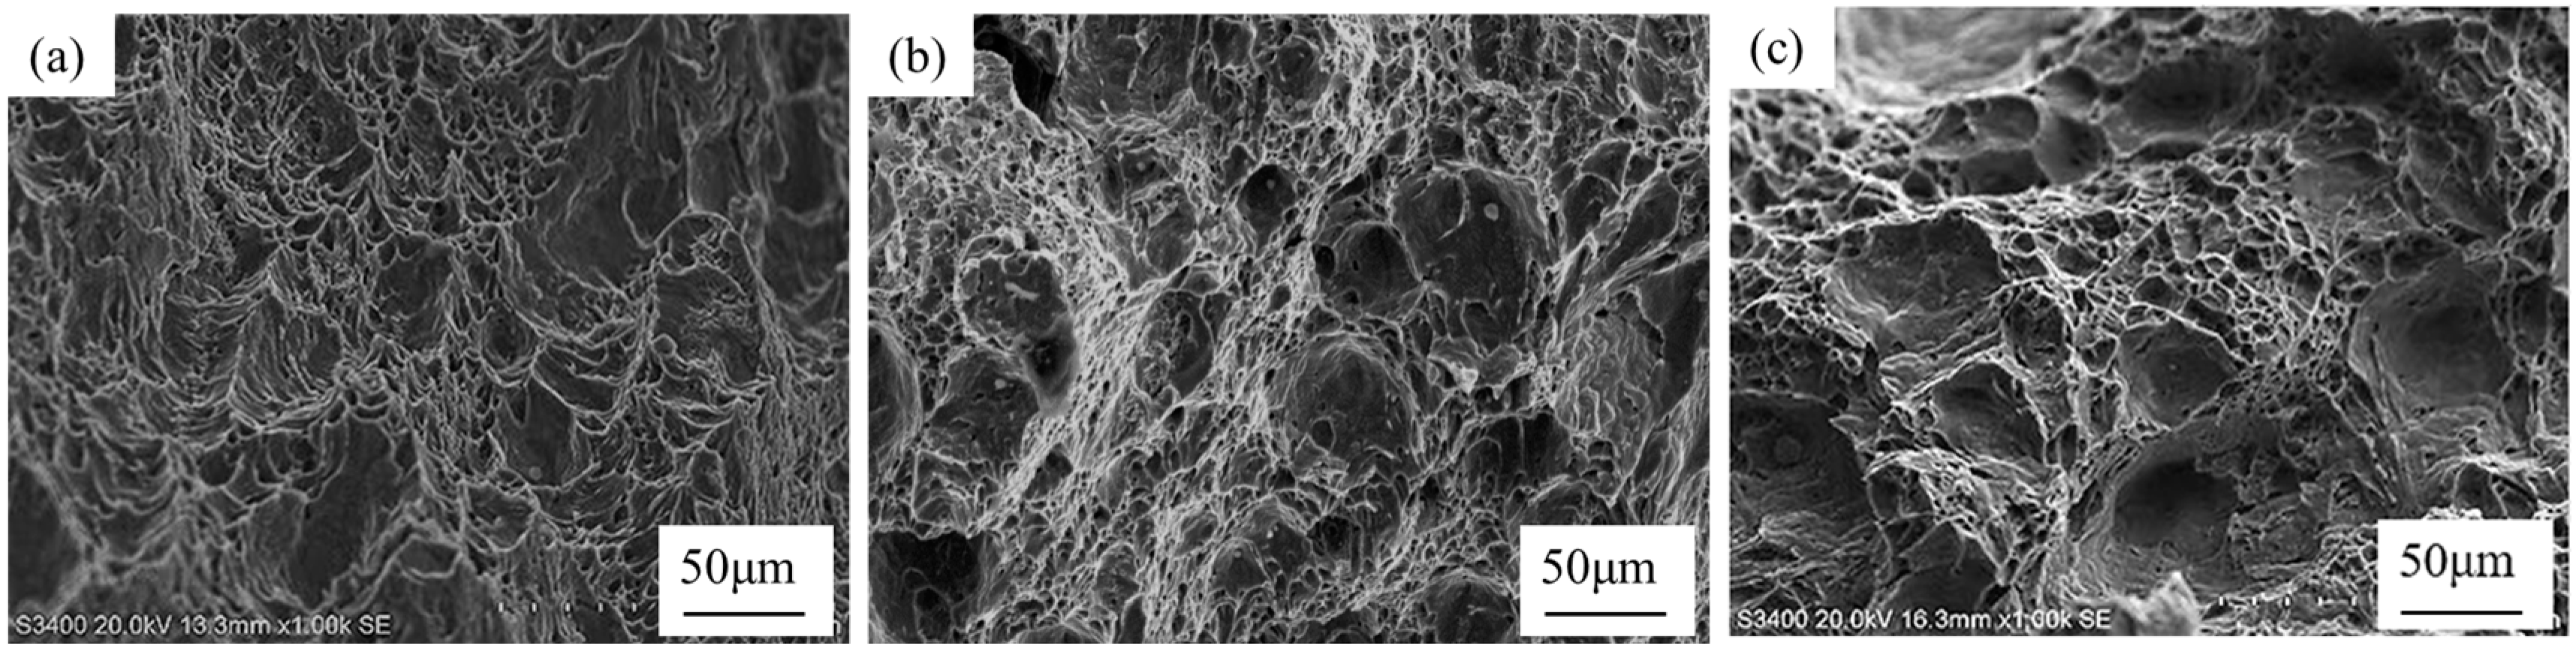
3.5. Test Steel Low Temperature Impact Fracture Analysis

The service environment of offshore platform steel is harsh, and the stress state during service is complex. At lower temperatures, the impact absorption work is more sensitive, and the lower the temperature, the more prone to brittle fracture. The microstructure and energy spectrum of the impact fracture of the three groups of test steel at −80 °C were observed by scanning electron microscopy to analyze the inclusion composition at the fracture, and the effect of the Ce addition on the fracture of the test steel was obtained. The SEM morphology of the low temperature impact fracture of the test steel without rare earth elements is shown in Figure 12.
Figure 12a,b shows an obvious ductile fracture with dimples resulting in a large amount of deformation at −40 °C and −60 °C. The fracture morphology of (c) is composed of cleavage steps, river patterns, and dimples. The cleavage step area is large and unevenly distributed, the dimples are not deep, there are obvious river patterns, and cracks appear at the grain boundaries. Before the fracture, the dislocation in the grain moves under the influence of stress, and dislocation accumulation occurs at the grain boundary, resulting in stress concentration and fracture.
The nanoindentation and micro-column compression tests carried out by Carl F. et al. explained the changes in the mechanical properties of inclusions such as MnS inside and around under the action of force, and it was concluded that the mechanical properties of the steel matrix and inclusions were different [25]. Figure 13 and Figure 14 illustrate the energy spectrum analysis of inclusions in the fracture of X test steel. As shown in Figure 12, irregular MnS inclusions were found at the dimples. Under the action of impact load, due to the different hardness and plasticity of the steel matrix and inclusions, stress concentration occurs at the manganese sulfide inclusions, which promotes the interface separation between the steel matrix and manganese sulfide inclusions and produces plastic deformation. During the rolling process, the inclusions will be banded along the rolling direction, so that the mechanical properties of the material will change in the direction of the rolling and vertical rolling. MnS inclusions in the direction of rolling and vertical rolling will become stress concentration points. The thermal expansion coefficients of Al2O3 and MnS inclusions in steel are 8.1 × 10⁻⁶/°C and 18.2 × 10⁻⁶/°C, respectively, which are quite different from the thermal expansion coefficient of steel matrix (12.5 × 10⁻⁶/°C) [26,27,28]. In the process of steel rolling and machining, the existence of inclusions will destroy the continuity of the steel matrix, and inclusions are the main factors leading to the deterioration of low temperature impact toughness. As shown in Figure 13, hard polygonal Al2O3 inclusions were found at the fracture. Under the action of impact load, the stress concentration is formed around the Al2O3 inclusions, and the cracks are generated in the inclusions and the matrix. The cracks initiate and propagate around the steel matrix. At the same time, due to the easy formation of cracks around the Al2O3 inclusions and the steel matrix during the rolling process, the crack propagation consumes low energy in the inclusion expansion, the crack propagation resistance is small, and it is more prone to fracture. When the number of brittle Al2O3 inclusions in the steel matrix is large, the crack is more likely to connect and expand into a large crack.
The SEM morphology of the gradient impact fracture of the test steel with Y (containing 6 ppm Ce) and Z (containing 10 ppm Ce) is shown in Figure 15 and Figure 16, respectively. Under the impact of −40 °C and −60 °C, the fracture morphology of the test steel containing the Ce element shows typical dimple tearing characteristics, and there are small dimples around the large dimples, which is a ductile fracture. Compared with the fracture morphology of X test steel without rare earth elements at −40 °C and −60 °C, the dimples are significantly larger and deeper, reflecting the better mechanical properties than X test steel.
Compared with the impact fracture morphology of X test steel at −80 °C, there are still obvious dimples in the fracture morphology of Y and Z test steel with Ce element. The fracture morphology of Y test steel is tear-like dimples and river patterns, indicating that the mechanical properties of Y test steel at −80 °C are significantly reduced, but the toughness is better than that of X test steel. However, the fracture morphology of Z test steel is composed of cleavage steps and small dimples. There are deep holes in the fracture. Large plastic deformation occurs before fracture, which absorbs a lot of impact energy to hinder crack propagation, and the impact toughness is the best. According to first principle calculations [29], Ce exhibits a very negative segregation energy in the adjacent atomic layers around the grain boundary, which is much lower than other alloying elements added to the steel matrix. Therefore, RE elements are more easily bound to the interior of the grain and the region with high vacancy concentration (grain boundary), and the atomic arrangement at the grain boundary is looser than that inside the grain, resulting in the tendency of RE elements to segregate at the grain boundary [30]. As mentioned above, rare earth inclusions improve the plasticity and toughness of grain boundaries, which makes the crack bypass the rare earth inclusions during fracture, and the length of crack propagation increases, forming deep dimples.
Figure 17 and Figure 18 are the analysis of inclusions in the fracture of the test steel containing Ce element. According to the energy spectrum analysis, the addition of rare earth elements makes the inclusions become re-checked rare earth inclusions. Compared with the test steel without rare earth elements, the addition of Ce significantly reduces the size of inclusions. Studies have shown that after adding pure rare earth elements, the main evolution form of inclusions is M/M + REeAleO/REeAleO + RE2O2S/RE2O2S + αREeS/RE2O2S + αREeO, accompanied by an increase in the content of rare earth elements (M represents the inclusions before the addition of rare earth elements). The final inclusion type obtained after the modification of rare earth elements is related to the relative content of S and O in steel. In addition, fine, regular, and uniformly distributed inclusions can be obtained by adding appropriate rare earth elements [24].

4. Conclusions

  • Compared with the blank test steel, the Ce element increases the Ac3 phase transformation point and decreases the Ac1 phase transformation point of the test steel, and expands the austenite phase region. This makes the test steel containing Ce element obtain a finer original austenite structure, and the distribution is more uniform, which plays the role of fine grain strengthening and can effectively improve the comprehensive mechanical properties of the test steel.
  • After the addition of the Ce element, the long strip MnS and irregular Al2O3 can be modified into elliptical rare earth composite inclusions. In addition, the addition of Ce reduces the segregation of O and S at the grain boundary, plays a role in purifying the grain boundary, improves the strength of the grain boundary, and reduces the initiation of cracks at the grain boundary.
  • The inclusions modified by the Ce element are only a few microns in size, which play a powerful role in dispersion strengthening and grain refinement. The continuity of the steel matrix is strengthened and the stress concentration of the steel matrix is reduced. With the increase in rare earth content at each temperature, the impact absorption energy is improved. The addition of the Ce element improves the low temperature impact toughness of steel.

Author Contributions

Data curation, formal analysis, writing—original draft, R.D.; data curation, formal analysis, writing—original draft, P.Z.; methodology, writing—review and editing, J.C.; investigation, Y.L.; validation, data curation, Y.W.; resources, J.G., X.Y., and Q.C. All authors have read and agreed to the published version of the manuscript.

Funding

This research was funded by the National Natural Fund of China, Regional Fund grant number [52161015].

Data Availability Statement

Data will be made available on request.

Acknowledgments

The authors thank Yang Xiong, Guo Jing and Cui Qingling again for the experimental materials and technical support provided. Thank Zhang Wenhua for the suggestions made in the process of revising the article.

Conflicts of Interest

Author Xiong Yang was employed by the company Technical Center of Inner Mongolia Baotou Steel Union Co, Ltd., Author Jing Guo was employed by the company The Rare Earth Steel Plates Plant of Baotou Iron and Steel Co., Ltd. The remaining authors declare that the research was conducted in the absence of any commercial or financial relationships that could be construed as a potential conflict of interest.

References

  1. Shao, J. Research Status and Development of Shipbuilding Steel. Angang Technol. 2013, 382, 183–185. [Google Scholar]
  2. Hao, W.; Liu, Z.; Wang, X. Status and development trend of strength and corrosion resistance of high strength steel for offshore platform. Equip. Environ. Eng. 2014, 11, 50–56. [Google Scholar]
  3. Song, R.; Zhao, W.; Bao, X.; Chen, L.; Wang, X. Effect of rare earth element Ce and heat treatment on microstructure and mechanical properties of hypereutectoid rail steel. Heat Treat. Met. 2022, 47, 162–167. [Google Scholar]
  4. Chen, R.; Wang, Z.; He, J.; Zhu, F.; Li, C. Effects of Rare Earth Elements on Microstructure and Mechanical Properties of H13 Die Steel. Metals 2020, 10, 918. [Google Scholar] [CrossRef]
  5. Zhao, M.; Wang, F.; Xi, X.; Yang, S.; Li, J. Effect of Y on inclusions characteristics and tensile properties in EH36 shipbuilding steel. Iron Steel 2019, 54, 61–67. [Google Scholar]
  6. Lian, X.-T.; Chen, L.; Fan, Z.-W.; Liu, T.S.; Xu, D.X.; Dong, H. Effects of Modified Inclusions and Precipitates Alloyed by Rare Earth Element on Corrosion and Impact Properties in Low Alloy Steel. Acta Metall. Sin. Engl. Lett. 2022, 35, 1719–1730. [Google Scholar] [CrossRef]
  7. Liu, X.; Yang, J.; Cai, C.; Li, A.; Lei, X.; Yang, C. Effect of Microalloyed Elements M (M = Ce, Ti, V, and Nb) on Mechanical Properties and Electronic Structures of gamma-Fe: Insights from a First-Principles Study. Steel Res. Int. 2021, 92, 2100053. [Google Scholar] [CrossRef]
  8. Meng, X.; Yu, Y.; Kang, J.; Su, J.; Wang, S. Effect of rare earth on inclusions and low temperature impact properties of A572. Gr65 steel. Heat Treat. Met. 2020, 45, 15–18. [Google Scholar]
  9. Yu, Z. Rare Earths in Steel; Metallurgical Industry Press: Beijing, China, 1982. [Google Scholar]
  10. GB/T 13298-91; Metallic Microstructure Test Method. China National Standardization Administration: Beijing, China, 1991.
  11. YB/T 5128-2018; Determination of Continuous Cooling Transformation Curve of Steel-Expansion Method. National Metallurgical Industry Bureau: Beijing, China, 2018.
  12. GB/T 712-2022; Structural Steel for Ship and Ocean Engineering. China National Standardization Administration: Beijing, China, 2022.
  13. GB/T 228.1-2010; Tensile Test of Metal Materials-Part 1: Room Temperature Test Method. National Standardization Administration of China: Beijing, China, 2010.
  14. GB/T 229-2007; Charpy Pendulum Impact Test Method for Metal Materials. China National Standardization Administration: Beijing, China, 2007.
  15. Fei, G.; Zheng, C.-W.; Wang, P.; Li, D.-Z.; Li, Y.-Y. Effects of Rare Earth on Austenite-Ferrite Phase Transformation in a Low-Carbon Fe-C Alloy. Acta Metall. Sin. Engl. Lett. 2022, 36, 141–146. [Google Scholar]
  16. Ji, Y.; Liu, Z.; Wang, H.; Ren, H. Effect of Solid-solution Rare Earth in Steel on Transformation of Super-cooled Austenite. Hot Work. Technol. 2015, 44, 113–118. [Google Scholar]
  17. Zhang, X. Effect of trace rare earth elements on microstructure and corrosion properties of offshore platform steel. Coll. Mater. Sci. Eng. 2022, 17–18. [Google Scholar] [CrossRef]
  18. Xu, Q.; Yang, L.; Xia, M.; Qing, C.; Zhao, L. Effect of rare earth Ce on CCT curves of H13 steel. Heat Treat. Met. 2022, 47, 197–202. [Google Scholar]
  19. Mao, N.; Yang, W.; Chen, D.; Lu, W.; Zhang, X.; Chen, S.; Xu, M.; Pan, B.; Han, L.; Zhang, X.; et al. Effect of Lanthanum Addition on Formation Behaviors of Inclusions in Q355B Weathering Steel. Materials 2022, 15, 7952. [Google Scholar] [CrossRef] [PubMed]
  20. Zheng, H.; Liu, L.; Zhang, Z. Effects of Hot Processing on Sulfide and Oxide Inclusions. Mater. Rev. 2021, 35, 13168–13176. [Google Scholar]
  21. Summers, J.M.; Chakraborty, S.; Bartlett, L.N.; O’Malley, R.J.; Buchely, M.F.; Pilon, R. On the Effect of Hot Rolling on Inclusion Size and Distribution in a Cast AISI 1070 Steel Railroad Wheel. Int. J. Met. 2022, 17, 1277–1295. [Google Scholar] [CrossRef]
  22. Cao, Y.; Li, G.; Hou, Y.; Moelans, N.; Guo, M. DFT study on the mechanism of inclusion-induced initial pitting corrosion of Al-Ti-Ca complex deoxidized steel with Ce treatment. Phys. B Condens. Matter 2019, 558, 10–19. [Google Scholar] [CrossRef]
  23. Xi, Z.; Sun, T.; Xiao, H.; Fan, Z.; Liu, T.; Lian, X.; Li, J.; Dong, H. Effects of Rare Earth Elements on Inclusions and Impact Toughness in a Weathering Steel. Trans. Indian Inst. Met. 2023, 77, 831–841. [Google Scholar] [CrossRef]
  24. Wang, X.; Wu, Z.; Li, B.; Chen, W.; Zhang, J.; Mao, J. Inclusions modification by rare earth in steel and the resulting properties: A review. J. Rare Earths 2024, 42, 431–445. [Google Scholar] [CrossRef]
  25. Kusche, C.F.; Gibson, J.S.K.-L.; Wollenweber, M.A.; Korte-Kerzel, S. On the mechanical properties and deformation mechanisms of manganese sulphide inclusions. Mater. Des. 2020, 193, 108801. [Google Scholar] [CrossRef]
  26. Liu, C.; Revilla, R.I.; Zhang, D.; Liu, Z.; Lutz, A.; Zhang, F.; Zhao, T.; Ma, H.; Li, X.; Terryn, H. Role of Al2O3 inclusions on the localized corrosion of Q460NH weathering steel in marine environment. Corros. Sci. 2018, 138, 96–104. [Google Scholar] [CrossRef]
  27. Liu, X.; Yang, J.; Zhang, F.; Fu, X.; Li, H.; Yang, C. Experimental and DFT study on cerium inclusions in clean steels. J. Rare Earths 2021, 39, 477–486. [Google Scholar] [CrossRef]
  28. Ren, Y.; Yang, W.; Zhang, L. Deformation of Non-metallic Inclusions in Steel during Rolling Process: A Review. ISIJ Int. 2022, 62, 2159–2171. [Google Scholar] [CrossRef]
  29. Yang, C.; Luan, Y.; Li, D.; Li, Y. Effects of rare earth elements on inclusions and impact toughness of high-carbon chromium bearing steel. J. Mater. Sci. Technol. 2019, 35, 1298–1308. [Google Scholar] [CrossRef]
  30. Zhang, J.; Li, G.; Wang, H.; Wan, X.; Hu, M.; Cao, Y. Achieving superior cryogenic impact toughness and sufficient tensile properties in a novel high-Mn austenitic steel weld metal via cerium addition. J. Mater. Res. Technol. 2023, 23, 5016–5030. [Google Scholar] [CrossRef]
Figure 1. Austenitizing process curve.
Crystals 14 00863 g001
Figure 2. Size of tensile specimen.
Crystals 14 00863 g002
Figure 3. Impact specimen size.
Crystals 14 00863 g003
Figure 4. Metallographic photos of the original microstructure of three test steels.
Crystals 14 00863 g004
Figure 5. Metallographic photos of original austenite of three test steels.
Crystals 14 00863 g005
Figure 6. Continuous transformation curves (CCT curves, 1 #: without rare earth elements, 2 #: 13 ppm Ce, 3 #: 19 ppm Ce) of three groups of test steels at different cooling rates [17].
Crystals 14 00863 g006
Figure 7. Effect of rare earth on the original austenite size distribution of the test steel.
Crystals 14 00863 g007
Figure 8. Inclusion morphology and energy spectrum of X test steel without rare earth elements.
Crystals 14 00863 g008
Figure 9. Inclusion morphology and energy spectrum of Y test steel containing 6 ppm Ce.
Crystals 14 00863 g009
Figure 10. Inclusion morphology and energy spectrum of Z test steel containing 10 ppm Ce.
Crystals 14 00863 g010
Figure 11. Columnar diagram of low temperature impact absorption energy of test steel.
Crystals 14 00863 g011
Figure 12. Fracture morphology of test steel (X) without rare earth elements at different temperatures: (a) −40 °C; (b) −60 °C; (c) −80 °C.
Crystals 14 00863 g012
Figure 13. SEM morphology and energy spectrum of MnS inclusions in X test steel fracture at −80 °C.
Crystals 14 00863 g013
Figure 14. SEM morphology and energy spectrum of Al2O3 inclusions in fracture of X test steel at −80 °C.
Crystals 14 00863 g014
Figure 15. The fracture morphology of test steel (Y) containing 6 ppm Ce element at different temperatures: (a) −40 °C; (b) −60 °C; (c) −80 °C.
Crystals 14 00863 g015
Figure 16. The fracture morphology of the test steel (Z) containing 10 ppm Ce element at different temperatures: (a) −40 °C; (b) −60 °C; (c) −80 °C.
Crystals 14 00863 g016
Figure 17. SEM morphology and energy spectrum analysis of composite inclusions in −80 °C fracture of Y test steel.
Crystals 14 00863 g017
Figure 18. SEM morphology and energy spectrum analysis of composite inclusions in −80 °C fracture of Z test steel.
Crystals 14 00863 g018
Table 1. Chemical compositions of experimental steels.
SimpleCMnPSSiCaNiCrCuTiNbCe
X#0.081.20<0.012<0.0020.240.00120.3780.5360.4050.0150.045-
Y#0.081.21<0.012<0.0020.240.00120.3430.5840.4560.0160.0420.0006
Z#0.071.19<0.012<0.0020.250.00120.3790.5480.4150.0160.0420.0010
Table 2. Phase transformation temperature of test steel.
SampleAc1/°CAc3/°C
X#700843
Y#681854
Z#686857
Table 3. Tensile properties of test steel at room temperature.
Samplesσy/MPaσt/MPaε/%
X (0 ppmRE)476 ± 3572 ± 635 ± 2
Y (6 ppmRE)462 ± 4560 ± 334 ± 1
Z (10 ppmRE)475 ± 3590 ± 734 ± 0
Disclaimer/Publisher’s Note: The statements, opinions and data contained in all publications are solely those of the individual author(s) and contributor(s) and not of MDPI and/or the editor(s). MDPI and/or the editor(s) disclaim responsibility for any injury to people or property resulting from any ideas, methods, instructions or products referred to in the content.

