Article

Thermal Processing Map Study of the GH99 Nickel-Based Superalloy Based on Different Instability Criteria

1
School of Materials Science and Engineering, Shenyang University of Technology, Shenyang 110870, China
2
Shenyang Key Laboratory of Advanced Structural Materials and Applications, Shenyang University of Technology, Shenyang 110870, China
*
Author to whom correspondence should be addressed.
Crystals 2024, 14(10), 869; https://doi.org/10.3390/cryst14100869
Submission received: 18 August 2024 / Revised: 16 September 2024 / Accepted: 28 September 2024 / Published: 1 October 2024
(This article belongs to the Section Crystalline Metals and Alloys)

Abstract

:
The thermal compression experiments of the GH99 alloy were carried out at different strains from 1020 °C to 1170 °C and 0.001 s−1–1 s−1 conditions using a Gleeble-3800 thermal compression simulation tester. Construction of thermal processing maps with four instability criteria were superimposed on Murty, Prasad, Gegel, and Malas at different strains based on stress-strain data. Based on the theoretical basis, prediction results, and EBSD microstructure characterization method of four instability criteria, the suitable forming processing region and rheological instability region of the alloy were predicted. It was found that the Prasad instability criterion had the most accurate prediction results. The instability range predicted by Murty was accurate under minor strains, but as the strain increased, the expected instability range slightly increased compared to the actual range. However, the Gegel and Malas criteria have biases in predicting alloys under low-rate conditions at different strains. A scientific and rational optimization was carried out to select hot working process parameters for GH99 alloy in response to the influence of strain on its hot deformation behavior.

1. Introduction

The GH99 alloy, an advanced nickel-based high-temperature alloy, has garnered considerable attention for its extensive use in the aerospace and energy industries. It exhibits exceptional high-temperature strength, oxidation, and corrosion resistance, particularly in high-stress and high-temperature environments. Additionally, it displays outstanding resistance to thermal fatigue and creep [1,2]. For instance, in aero-engine turbine blades and combustion chambers, GH99 alloy endures extreme temperatures and stresses, maintaining structural integrity and functional performance [3].
The thermal deformation properties of the GH99 alloy are critical in its processing and application. During the machining process, it has the characteristics of severe work hardening, high cutting force, and temperature, as well as the easy occurrence of thermal deformation, making the machining difficulty relatively high. Rheological behavior at high temperatures, recrystallization properties, and dependence on temperature and strain rate directly affect the processing results and final properties of the alloy. Suitable thermal processing can optimize the grain structure of the alloy, which improves its performance in high-temperature environments. Zhang et al. [4] studied the microstructure evolution and dynamic recrystallization mechanism of Ti-6554 alloy during high-temperature deformation, providing the theoretical basis and data support for the hot processing of Ti-6554 alloy. Qin et al. [5] also used a dynamic material model and Prasad instability criterion to establish the machining diagram of 42CrMo steel plate. Research has shown that the steady-state deformation zone occurs when the deformation temperature is between 850 °C and 1150 °C and the strain rate is between 0.05 s−1 and 0.35 s−1. The optimal deformation process parameters are 1100 °C–0.05 s−1. Ji et al. [6] also established a thermal process diagram for 42CrMo steel through hot compression data to avoid processing in unstable areas during hot deformation, which has important guiding significance for the actual industrial production of the thermal processing technology for alloy. Jiao et al. [7] studied the hot compression deformation behavior of the GH4169 alloy. They developed a mathematical model and a hot working diagram to optimize the hot working process parameters of the alloy to determine a more precise hot working range. These studies indicate that hot working diagrams have become a critical research method for understanding and predicting the behavior of materials under high-temperature processing conditions. Displaying the rheological properties of materials under different temperatures, strain rates, and stress conditions helps determine stable and unstable regions during the material processing process, which is crucial for ensuring processing quality and avoiding defect formation [8,9]. However, there are still some shortcomings in predicting the thermal deformation behavior of metal materials in the above studies. Therefore, we need more rigorous methods to predict optimal hot working conditions for alloys. The instability criteria of Murty, Prasad, Gegel, and Malas provide important theoretical bases for analyzing and predicting the thermal deformation behavior of alloys. The Murty [10,11] criterion is mainly based on the theory of severe plastic deformation continuity, which assumes that the energy dissipation of materials during thermal deformation is related to the evolution of microstructure. This criterion identifies stable regions of material flow by evaluating changes in energy dissipation efficiency. The Prasad criterion concentrates on the material’s strain rate sensitivity and flow stress changes, and it considers the internal structural changes of the material during thermal deformation based on the Dynamic Material Model (DMM). By analyzing the effect of strain rate on flow stress, the criterion predicts possible machining defects [12]. The Gegel criterion [13] assesses the material’s stability during thermal deformation through the maximum rate of destabilization principle. The Malas criterion [14] considers the stress state and strain rate to predict the flow instability of a material at elevated temperatures. These four instability criteria are commonly used in the analysis of thermal process maps, and each is based on different theoretical frameworks and assumptions aimed at predicting and explaining the thermal deformation behavior of alloys, enabling the thermal process maps to more accurately reflect the behavior of the material under complex working conditions. It has been researched that by constructing the thermal processing map of a certain kind of instability criterion, the stable and unstable regions in the whole range of thermal deformation are predicted, and the optimal thermal processing conditions are determined in combination with the microstructure [15,16,17]. Some scholars compare several instability criteria to predict the thermal processing of materials more comprehensively, providing a theoretical basis and practical guidance for its performance optimization in applications [18,19,20]. These studies mainly aim at other metallic materials, while few reports have been made on the study of different hot working diagram theories for nickel-based superalloys, and even fewer reports have been made on the GH99 alloy. Hot working diagrams, however, are only useful for predicting the appropriate processing range under specific strains, and it is important to understand how strain affects the hot deformation behavior of high-temperature alloys when analyzing hot working diagrams. Different strain levels can affect the microstructural evolution of materials, such as dynamic recrystallization and changes in size angle grain boundaries, which in turn affect the mechanical properties of materials. Therefore, establishing hot working diagrams of GH99 alloy under different strains based on different instability criteria is significant for optimizing processing parameters and improving alloy properties.
In this study, thermal compression simulation experiments were conducted on GH99 alloy under the deformation temperature range of 1020 °C–1170 °C, strain rate range of 0.001 s−1–1 s−1, and strain variables of 0.45 and 0.7. Based on the construction of thermal processing maps superimposed on four destabilization criteria of Murty, Prasad, Gegel, and Malas at different strains, the effect of strain on the thermal deformation behavior of this alloy is determined and a multidimensional analysis is carried out in order to optimize the processing parameters and predict and control the microstructure.

2. Experimental Materials and Method

The material being tested in this study is GH99 alloy, and its chemical composition is detailed in Table 1. The alloy is shaped into cylindrical samples measuring Φ10 mm × 15 mm for our experiments and is tested under thermal compression using a Gleeble-3500 simulator. The testing includes strain rates of 0.45 and 0.7, deformation temperatures ranging from 1020 °C to 1170 °C, and strain rates from 0.001 s to 1 s. The thermal compression procedure and the initial microstructure of the GH99 alloy are illustrated in Figure 1. After the thermal compression, the specimens are rapidly water-cooled to maintain the microstructure post-high-temperature deformation.
The compressed samples are sliced in radially to facilitate grinding and polishing, while the alloy is examined for its grain morphology, orientation, and boundaries through the EBSD characterization technique. The electrolyte ratio for the electrolytic polishing process consists of perchloric acid (HClO4) and ethanol (C2H5OH) in a 10:90 mixture. This electrolytic polishing process takes place for 30 s at a voltage of 25 V and at room temperature, with the current controlled at about 1.5 mA.

3. Result

3.1. True Stress-Strain Curve

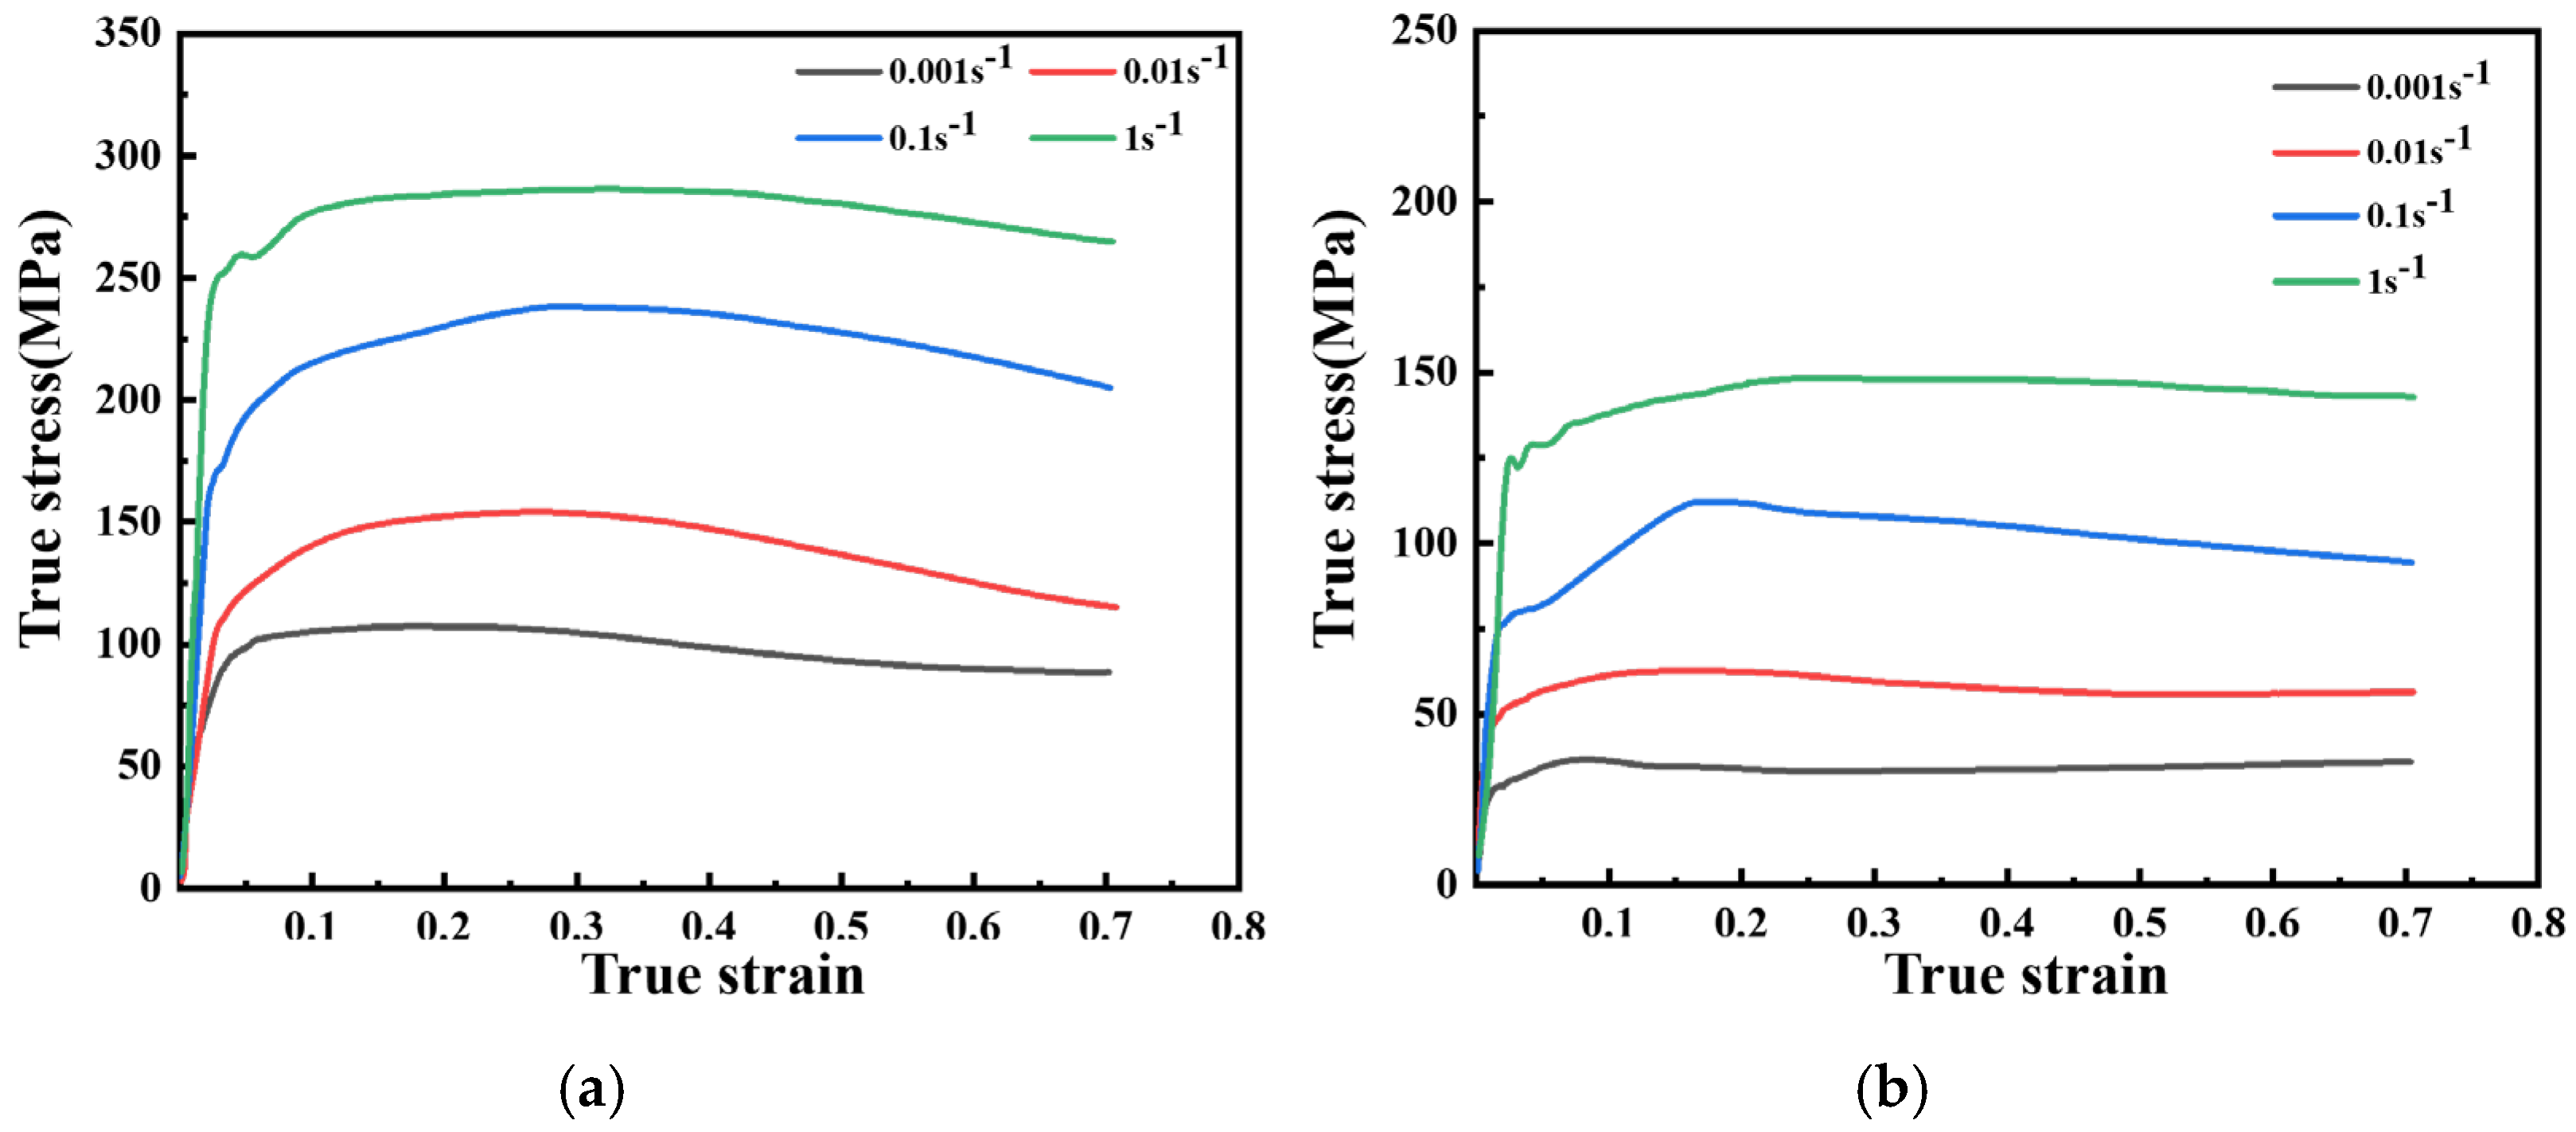
This article selects two temperatures (1020 °C and 1170 °C) and four strain rates (0.001 s−1–1 s−1) to conduct hot compression experiments on GH99 alloy. The rheological stress curve is shown in Figure 2. As the strain increases, the work-hardening effect rapidly increases the rheological stress curve until dynamic recrystallization occurs. Dynamic softening gradually exceeds work hardening, causing the rheological stress to decrease slowly. When work hardening and dynamic softening are in equilibrium, the rheological stress curve tends to stabilize, which is consistent with the research results of low dislocation energy nickel-based high-temperature alloys [21,22]. When the deformation temperature is 1020 °C, the rheological stresses for all strain rate conditions show a slow decrease after reaching the peak stress (Figure 2a). The low deformation temperature limits the dynamic softening behavior, which makes the rheological stress decrease little with deformation [23]. When the temperature rises to 1170 °C, the dynamic softening effect of the four rheological curves in Figure 2b is insignificant, and there is no apparent peak stress. However, the rheological stress curve can only observe the dynamic recrystallization behavior from a macroscopic perspective. Detailed discussions are needed in conjunction with thermal processing diagrams and microscopic observations to optimize the processing technology and study the deformation mechanism.

3.2. Establishment of Power Dissipation Diagram

The heat treatment map established by Prasad et al. [23], based on the Dynamic Material Model (DMM), can reflect the microstructure of materials under different deformation conditions, distinguish between unstable and stable regions, and provide theoretical guidance for the thermal processing parameters of materials. The DMM considers that during thermal processing, the total external energy input (total power absorbed by the material per unit volume, P) consists of power dissipation from plastic deformation (G) and power dissipation from tissue transformation during deformation (J), which is expressed as [24]:
P = σ ε ˙ = G + J = 0 ε ˙ σ d ε ˙ + 0 σ ε ˙ d σ
The strain rate sensitivity index (m) was introduced to represent the ratio relationship between G and J [25]:
m = J G = ln σ ln ε ˙
The power dissipation factor (η) is used to describe the relationship between the J consumed by the organizational evolution and the maximum linear dissipation (Jmax) in the ideal case; the higher the value of η, the more stable the organizational change. The relation [26] is:
η = J J max = 2 m m + 1
Excluding the instability region, it is usually assumed that the region with a larger value of η corresponds to the region where the microstructure evolves better during thermal deformation, indicating that the alloy can be processed in this region to obtain better organization and properties [27].
The relationship between stress and strain can be expressed in terms of a third-degree polynomial (Equation (4)), hence the m expression is shown in Equation (5).
lg σ = a + b lg ε ˙ + c ( lg ε ˙ ) 2 + d ( lg ε ˙ ) 3
m = lg σ lg ε ˙ = b + 2 c lg ε ˙ + 3 d ( lg ε ˙ ) 2
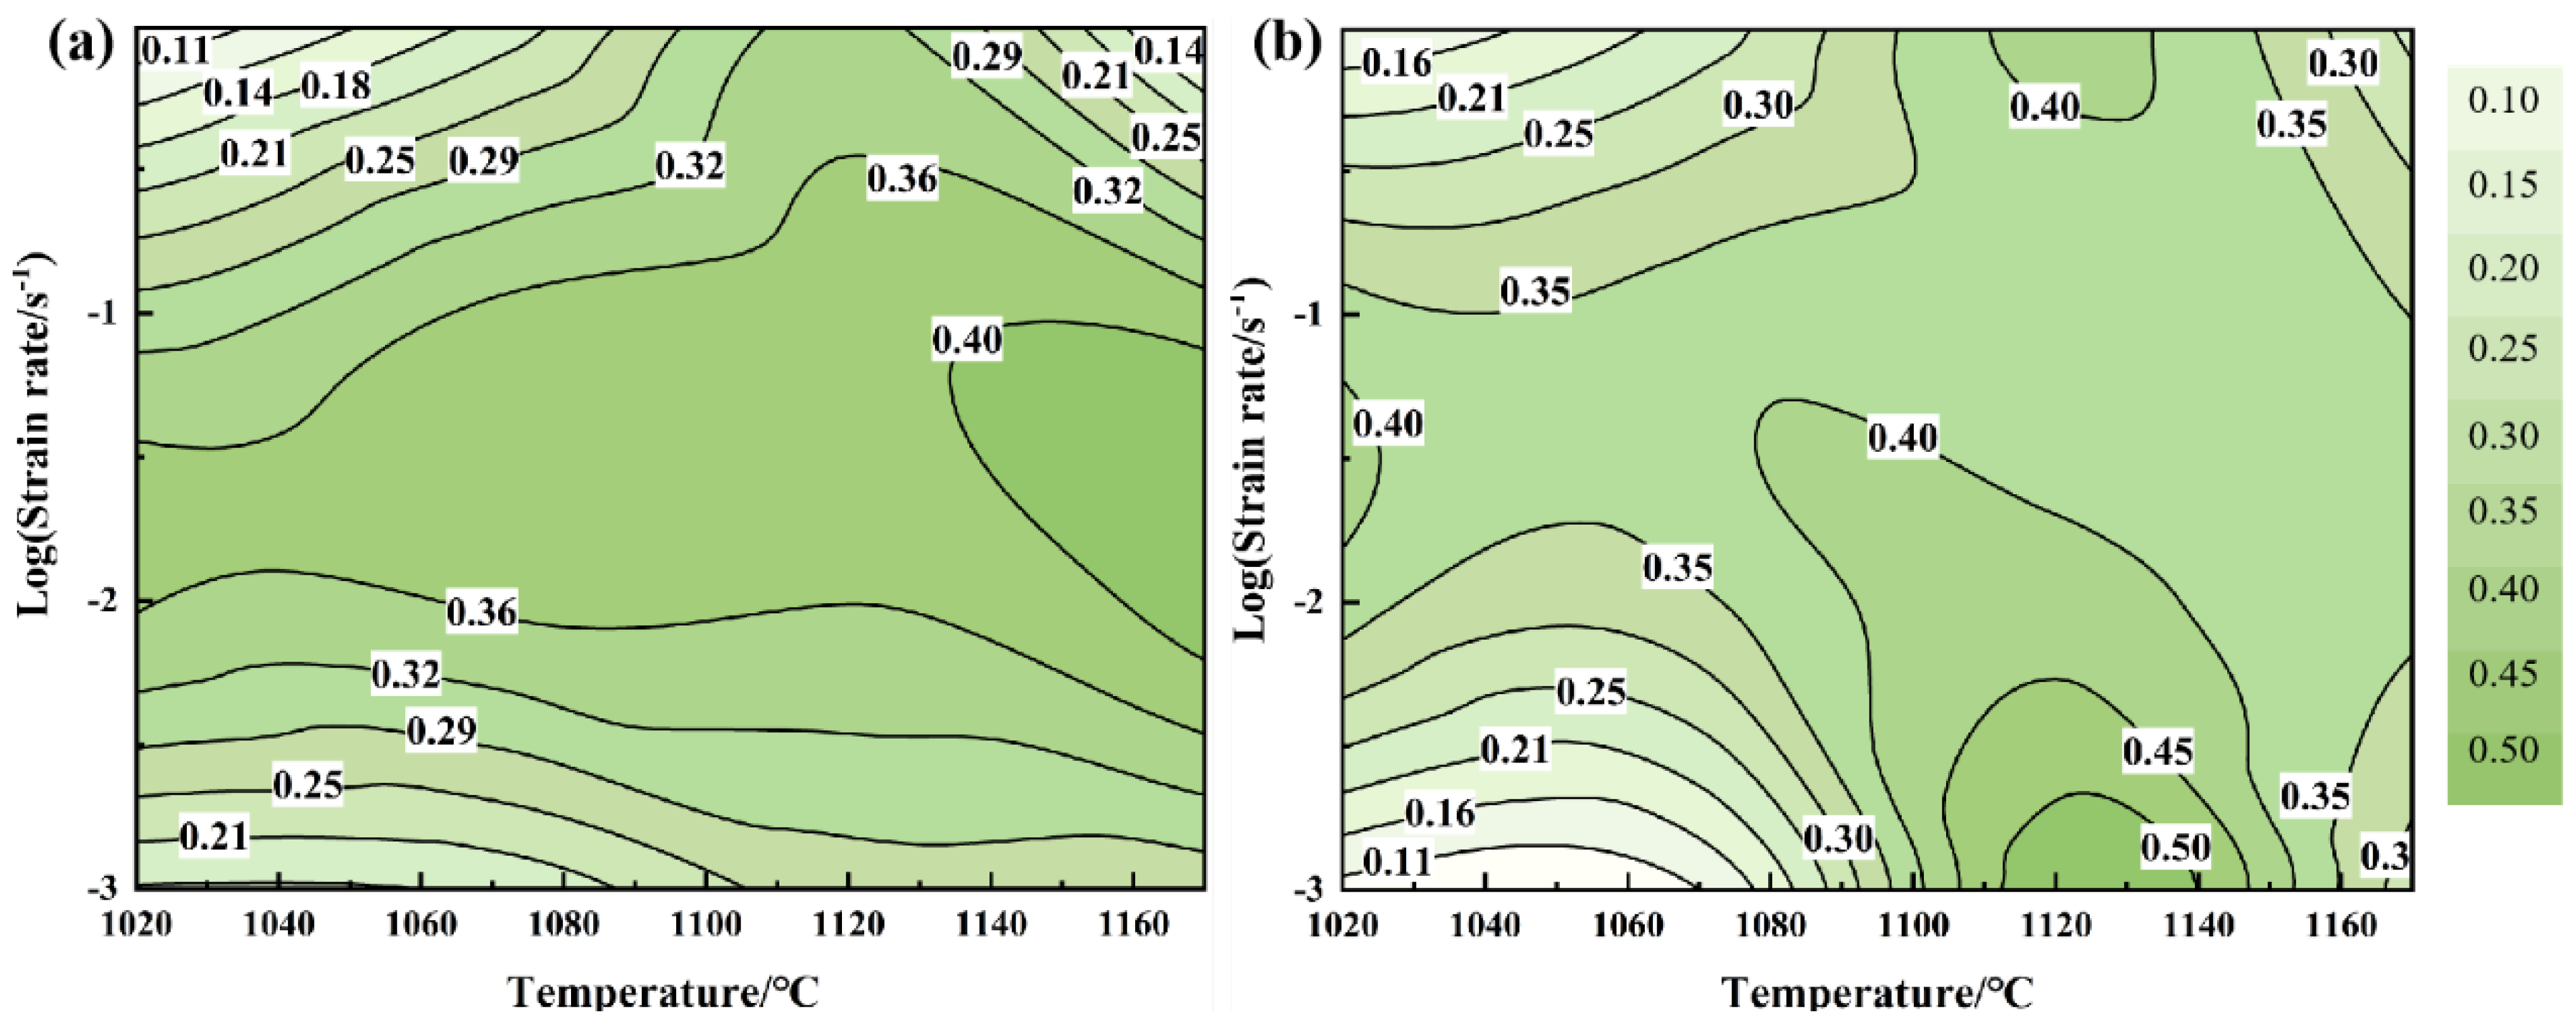
By taking the values of fitting constants b, c, and d at different deformation temperatures and bringing them into the above equation, the value of m can be calculated, and by bringing the value of m into Equation (3) the power dissipation rate η can be calculated for this deformation condition. The power dissipation diagram of the GH99 alloy at different strains was made using T as the horizontal coordinate, ε ˙ as the vertical coordinate, and ƞ as the contour value is shown in Figure 3. At a strain of 0.45, the alloy has a peak η of 0.40, which lies within the deformation parameters of 1130 °C–1170 °C, 0.007 s−1–0.05 s−1, and ƞ stabilizes around 0.36–0.4 throughout the temperature interval. At a strain of 0.7, the η of the alloy reaches 0.5. This performance is achieved under deformation parameters ranging from 1113 °C to 1140 °C, with a strain rate from 0.001 s−1–0.002 s−1. In addition, high temperature and low-rate deformation conditions (temperature interval 1100 °C–1150 °C, strain rate interval 0.001 s−1–0.0316 s−1) have higher η values around 0.4–0.5. Usually, when the power dissipation rate exceeds 0.3, the material is prone to dynamic recrystallization during thermal processing, enhancing its forming properties [28]. However, the adiabatic shear bands and localized deformation phenomena that can be brought about by excessive temperatures or large strain rates are accompanied by the thermal processing and forming of metallic materials. Therefore, the instability region requires full consideration in the study.

3.3. Thermal Processing Maps Based on Different Instability Criteria

According to the extreme value principle of irreversible thermodynamics under macroplastic flow, known as Prasad’s theory of instability [12], it is considered that rheological instability occurs during thermal deformation of metallic materials when the power dissipation coefficients and the strain rate satisfy the inequality (Equation (6)). The transformation of Equation (6) into Equation (7), therefore the criterion for predicting instability during thermal processing, can be obtained as shown in Equation (8).
J / ε ˙ < J / ε ˙
ln J / ln ε ˙ = ln ( m m + 1 ) / ln ε ˙ + ln σ / ln ε ˙ + 1
ln J / ln ε ˙ < 1 ξ = ln ( m m + 1 ) ln ε ˙ + m < 0
Murty [29,30,31,32] et al. have argued that m in Prasad’s instability criterion does not serve as a constant, but rather as a variable, and thus Equation (9) can be derived based on the definition of the power dissipation covariate. The power dissipation factor is rewritten as Equation (10), which in turn yields a brief plastic instability criterion applicable to any kind of stress-strain rate curve, as shown in Equation (11).
J / ε ˙ = ε ˙ σ / ε ˙ = σ ln σ / ln ε ˙ = m σ
η = J / J max = 2 J / σ ε ˙
J / ε ˙ = 1 / 2 2 m < η   or   η 0
In Gegel’s [13] instability criterion, rheological instability of metallic materials is considered to be related to the temperature sensitivity index (S) of the metallic material, which can be expressed in Equation (12). In addition, rheological instability occurs during the thermoforming of metallic materials when the relationship of Equation (13) is satisfied. Therefore, the Gegel instability criterion can be expressed as Equation (14).
S = 1 / T ( ln σ / ( 1 T ) ) = ln σ / T
η ln ε ˙ > 0
S ln ε ˙ = ( ln σ ) ( ln T · ln ε ˙ ) = m ln T > 0 η ln ε ˙ > 0 , m ln T < 0
Malas [14], based on the instability criterion proposed by Gegel, considered the power dissipation factor to be the strain rate sensitivity factor, and thus produced the Malas instability criterion:
m ln ε ˙ > 0 , m ln T < 0
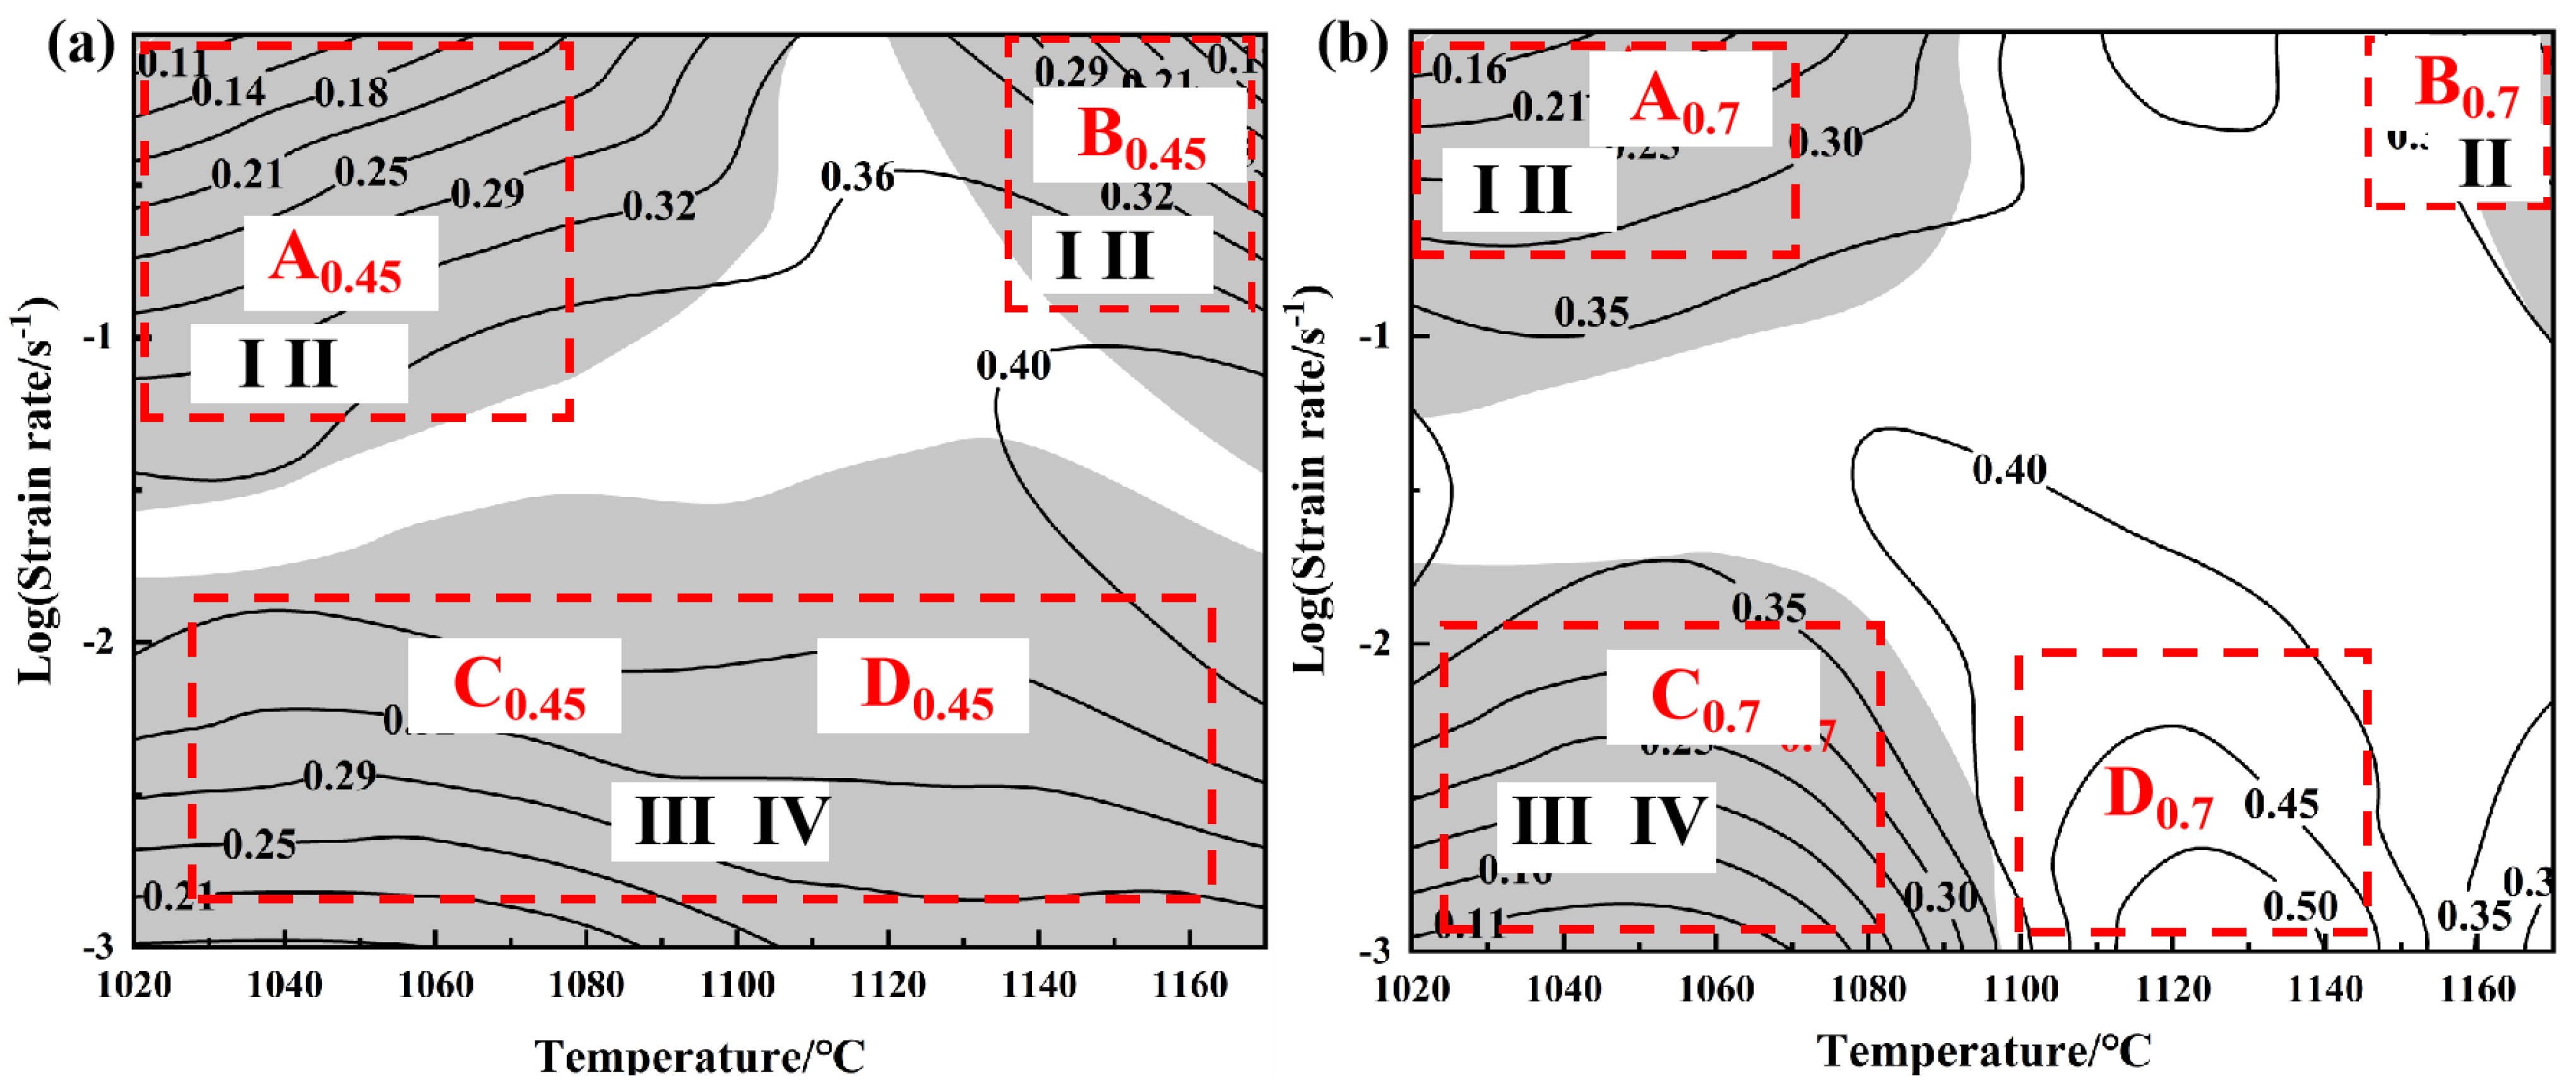
By superimposing the power dissipation maps with the instability maps, we can obtain the thermal processing maps of the alloy based on the four instability criteria. Figure 4 shows the total thermal processing map of the destabilization regions obtained from the four destabilization criteria for the alloy at 0.45 and 0.7 strain superimposed on each other, where the shading indicates the destabilization regions. It is clear that the region of instability predicted varies due to theoretical differences in each criterion (Table 2). At a strain of 0.45 (Figure 4a), the regions of instability based on the Prasad criterion are mainly concentrated in the low-temperature and high-rate (1020 °C–1085 °C, 0.05 s−1–1 s−1) conditions and the high-temperature and high-rate (1140 °C–1170 °C, 0.06 s−1–1 s−1) conditions, as shown by the red dashed lines in the figure with the regions marked A0.45 and B0.45. The region of instability for the Murty criterion is similar to that of the Prasad criterion and is also concentrated in the high-rate of deformation conditions, which is related to their similar determination mechanisms. The instability region of the Geiger criterion is located at low-strain-rate (1020 °C–1140 °C, 0.001 s−1–0.008 s−1) conditions, as shown by the red dashed line in the region labeled C0.45, D0.45. Since the Malas standard is based on Gegel, the Malas destabilization region (1020 °C–1170 °C, 0.001 s−1–0.021 s−1) is similar to Gegel. In turn, the destabilization interval can be divided into three major regions: the low-temperature high-rate region, the high-temperature high-rate region, and the low-rate region. At small strains, the thermal processing map is almost covered by the four instability criteria, and the peak power dissipation region exists outside of the moderate strain rate and instability intervals.
Figure 4b shows the thermal processing map of the alloy at 0.7 strain superimposed on different instability criteria, and shows that the instability regions of all four criteria decrease to varying degrees with increasing strain. The low-temperature high-rate region (A0.7) is slightly narrower than the A0.45 range, and the change is more pronounced in that Prasad is located in the region where high-temperature high-rate instability disappears. Meanwhile, Gegel and Malas are located in the instability range narrowed to C0.7 at low strain rates (1020 °C–1063 °C, 0.001 s−1–0.007 s−1; 1020 °C–1097 °C, 0.001 s−1–0.018 s−1). At large strain values, the range of the instability region decreases, and the suitable processing region is within the peak power dissipation region located at 1113 °C–1140 °C and 0.001 s−1–0.002 s−1 deformation parameter. The decrease in the instability region with increasing true strain is attributed to the fact that the thermal effect of deformation and the deformation storage energy within the metal increase accordingly with a growing degree of deformation, thus improving the nucleation rate and microstructure. The variation of power dissipation values and instability regions in the thermal processing map is an outward manifestation of the organization changes, therefore the microstructure of the instability region and the suitable processing region will be investigated in further detail in the following sections.

4. Discussion

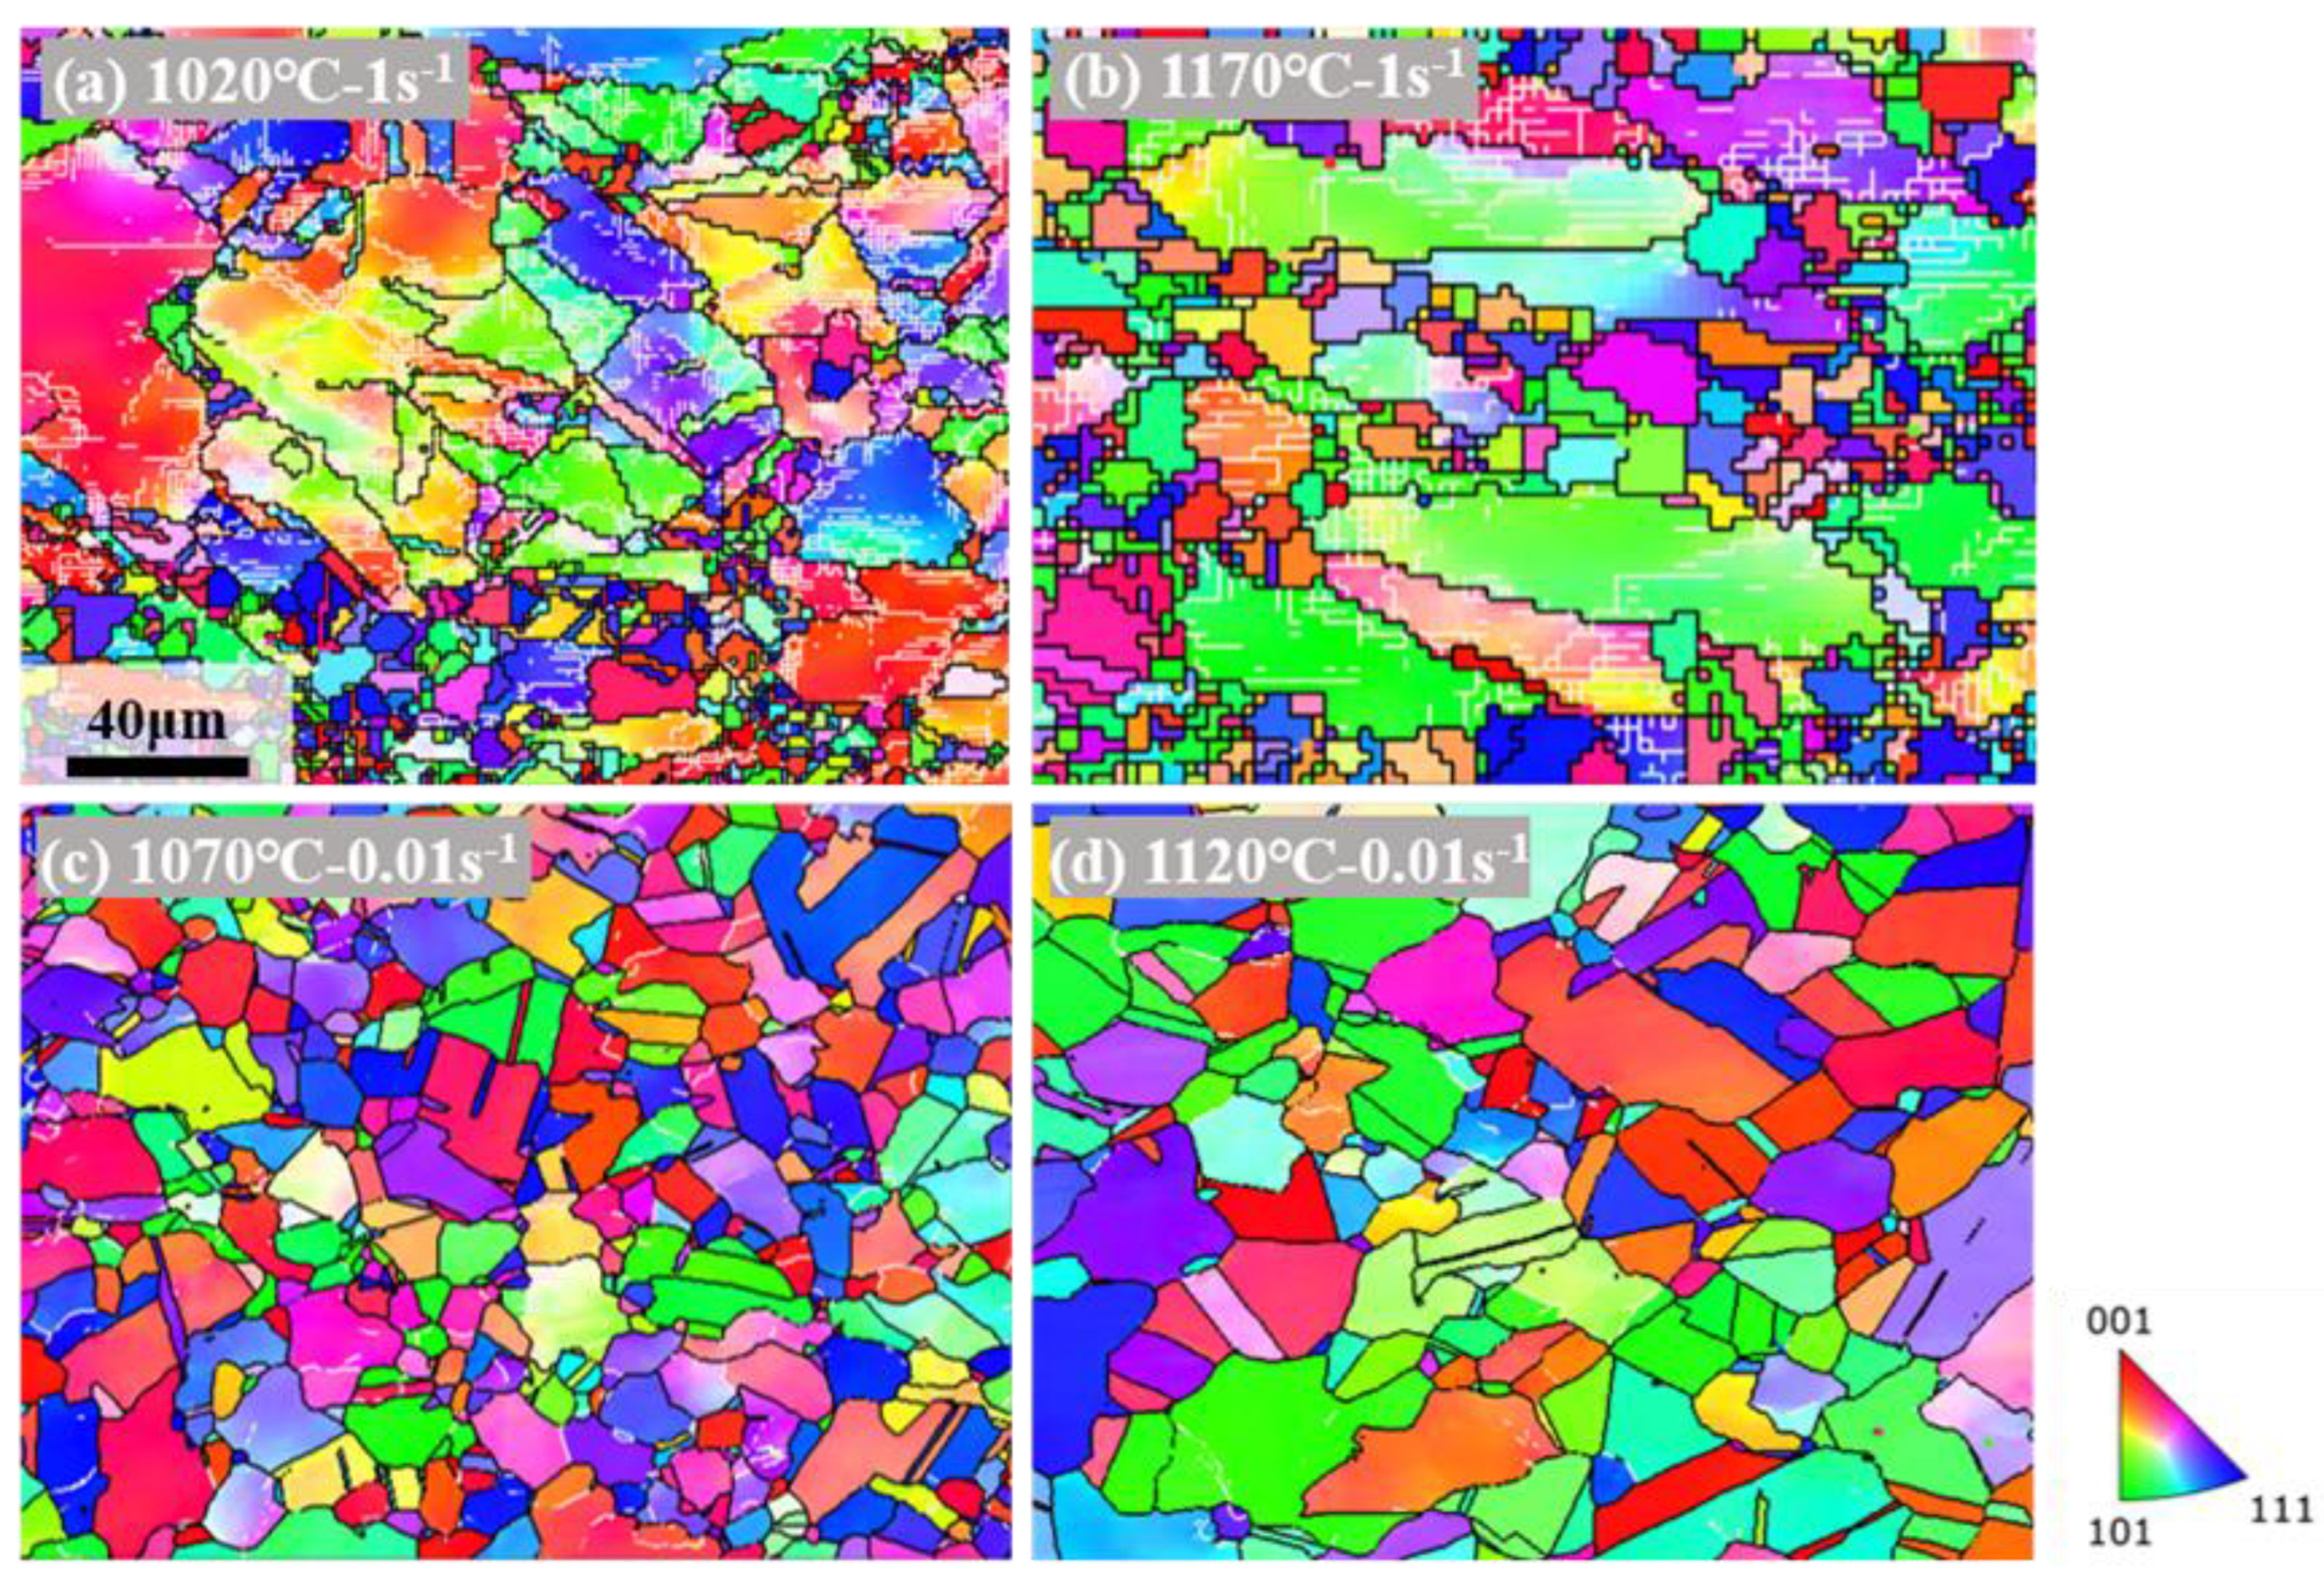
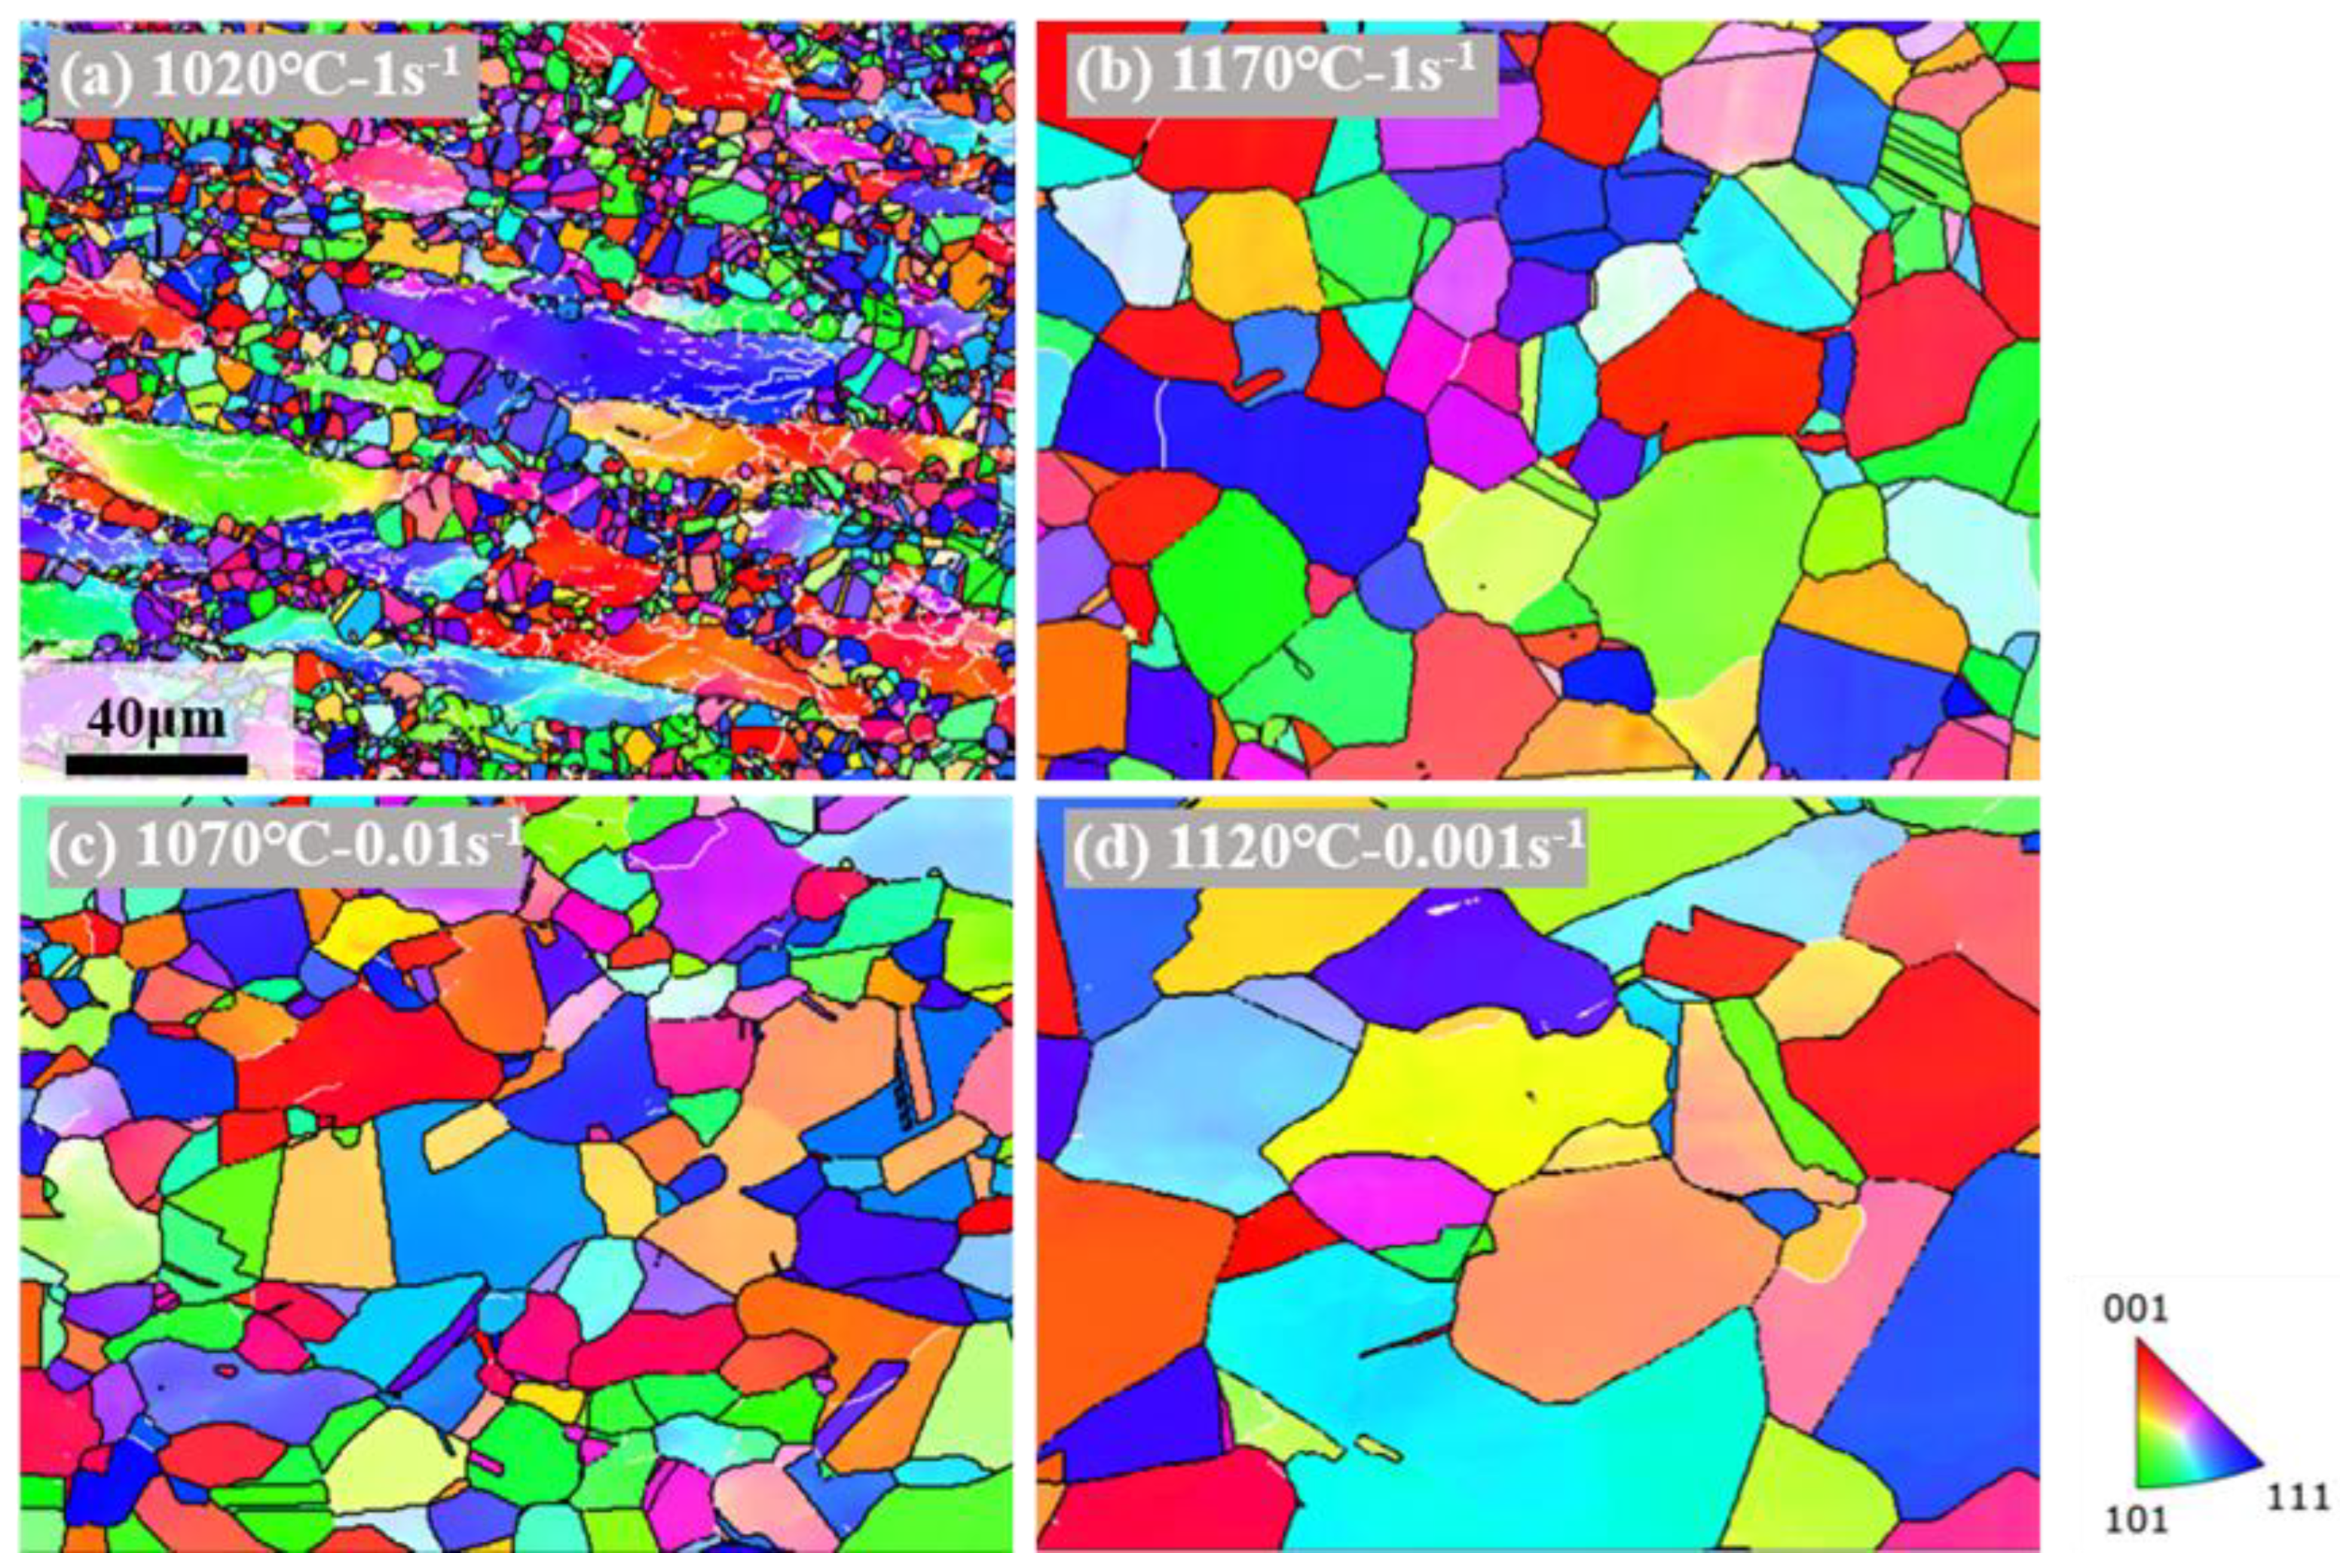
This study characterized the microstructure of unstable and suitable processing areas. Figure 5 shows the IPF images of different unstable areas (A–D) at a strain of 0.45, where the white lines represent low-angle grain boundaries of 2–15° and the black lines represent high-angle grain boundaries of >15°. The IPF plot under deformation-parameter interval A0.45 (Figure 5a) shows a grain size of 14.656 µm. There are many small grains around the grain boundaries of the original grains, and the interior of the small grains is smooth, with almost no small angle grain boundaries appearing. The large grain boundaries are tortuous and exhibit a typical form of grain boundary arching, indicating that the deformation mechanism of the alloy at this point is mainly DDRX. In the unstabledeformation-parameter range B0.45 (Figure 5b), when the temperature rises to 1170 °C, sufficient energy is provided for recrystallization growth, and recrystallization engulfs dislocations. At the same time, dislocations continuously slip and climb, and the dislocation density decreases. Compared to 1020 °C, the grain size significantly increases at this point, but some original grains still exist, and the proportion of low-angle grain boundaries decreases. However, the recrystallized grains are still relatively small at this point, while the original grains exhibit elongation. Still, the number of original grains decreases, resulting in a slight reduction in grain size to 12.009 µm. The strain rate decreases in the C0.45 range (Figure 5c), and dynamic recrystallization has more time to nucleate and grow, almost entirely replacing the original grains. However, the recrystallized grains are relatively small at this point, with a grain size of 6.645 µm. In addition, many twin crystals can be observed in Figure 5c, which facilitate the formation of dynamic recrystallization and accelerate dynamic softening. At the instability deformation parameter range D0.45 (Figure 5d), the temperature rises to 1120 °C, and the dynamic recrystallization grain size reaches 11.158 µm. At this point, almost no small angle grain boundaries appear inside the grain, and the grain orientation is uniform. Compared with the unstable region in Figure 4a, at high strain rates, there are significantly more original grains, higher dislocation density, weaker dynamic softening effect, and more susceptibility to instability. Under low-strain-rate conditions, dynamic recrystallization gradually replaces the original grains, dynamic softening dominates, and the work hardening effect weakens, making it more suitable for processing. Therefore, combining the four instability criteria, it can be found that the instability intervals predicted by the Prasad and Murty instability criteria are more in line with microscopic analysis. In contrast, the low-strain-rate instability regions predicted by the Gegel and Malas instability criteria have strong softening effects and are less prone to instability phenomena.
The IPF graph obtained at a strain of 0.7 is shown in Figure 6. The recrystallized grains are still relatively small under the deformation parameter range A0.7 (Figure 6a). However, compared with the IPF graph under strain 0.45 (Figure 5a), it can be observed that the content of recrystallized grains between the original grains increases. However, due to the limitation of grain boundary energy, the recrystallized grains cannot increase, resulting in a smaller average grain size of only 4.892 µm. In the unstable-deformation-parameter range B0.7 (Figure 6b), when the temperature rises to 1170 °C, it can be seen that the original grains disappear entirely and are replaced by equiaxed grains, gradually increasing to 11.501 µm. At a temperature of 1070 °C and a strain rate of 0.01 s−1 (C0.7), the grain size increased to 7.577 µm (Figure 6c). Compared to Figure 5b, it can be observed that low strain is not conducive to recrystallization nucleation. In the instability range D0.7, the grain size of the alloy is the largest (Figure 6d), which is 21.097 µm. From the above analysis, it can be concluded that as the temperature increases and the strain rate decreases, the dynamically recrystallized grains have sufficient energy and time to grow continuously, and the dynamic softening effect is enhanced.
When comparing the microstructures at 0.45 and 0.7 strains, it was observed that the proportion of original grains and low-angle grain boundaries was higher at low strains. Dynamic recrystallization is challenging to nucleate and grow, which is not conducive to processing. However, by using four instability criteria to predict the instability range under these two strain conditions, it was found that the instability regions determined by the Prasad and Murty instability criteria were concentrated in the high-strain-rate zone, where dislocations were reduced, equiaxed grain orientation was uniform, dynamic recrystallization grew, and dynamic softening effect was good. The instability criteria of Gegel and Malas predict that there are more large deformation grains, low-angle grain boundaries, and dislocations in the instability zone under low-strain-rate conditions, which makes instability more likely to occur in processing and production.
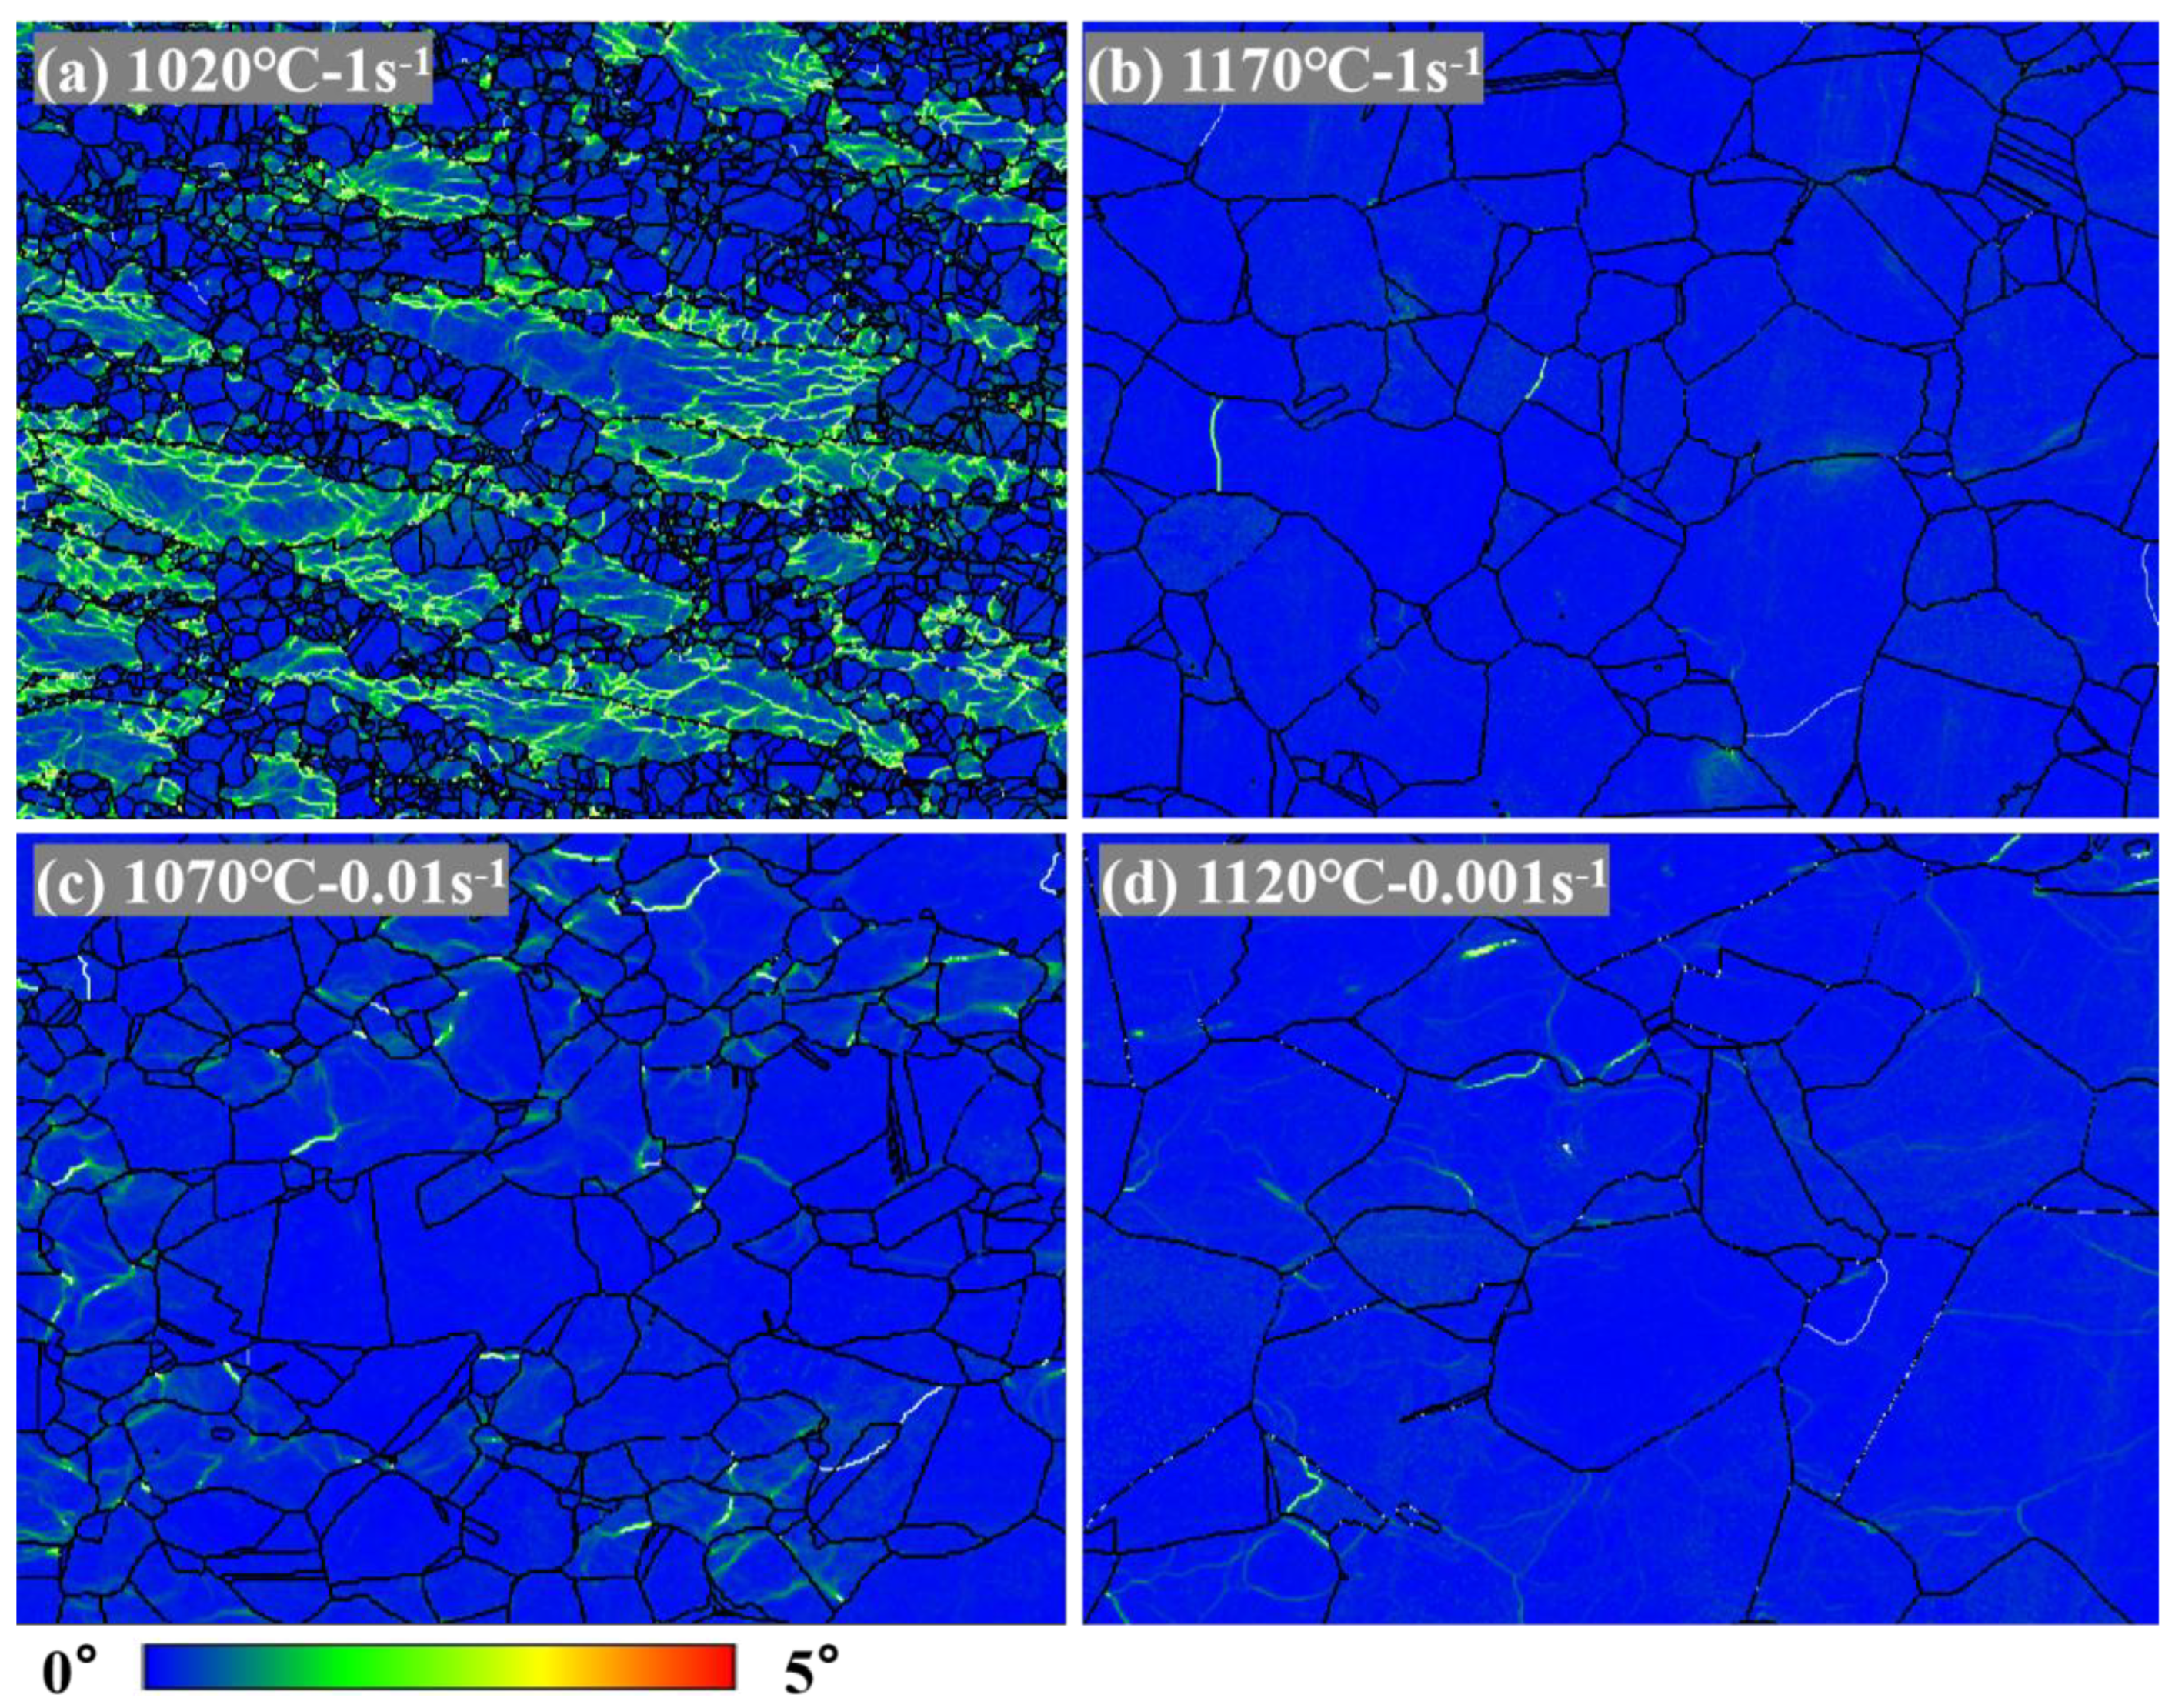
The KAM maps of different regions (A-D) in the hot working diagram under 0.45 strain, composed of four instability criteria, are shown in Figure 7. Under the deformation-parameter interval A0.45 (Figure 7a), which is destabilized under both the Prasad and Murty destabilization criteria, dislocations are concentrated firstly in the vicinity of the grain boundaries of the original grains, resulting in strain gradients and grain boundary bending [33]. The organization consists of a large number of deformed grains and a small number of fine grains, with numerous orientation variances at the deformed grain boundaries. At the same time, dynamic recrystallization (DRX) nucleation and grain boundary migration are suppressed, resulting in a large amount of energy and orientation gradient stored within the original grain after deformation without significant deformation. It indicates that the alloy has a high resistance to deformation and is difficult to deform plastically. Therefore, deformation in this state is prone to the formation of cracks and other defects and is an unstable state. Under the unstable-deformation-parameter interval B0.45 (Figure 7b), the number of deformed grains decreases when the deformation temperature increases up to 1170 °C, and there is an obvious elongation phenomenon with the formation of many DRX grains along the deformed grains near the grain boundaries. Although the high temperature promotes the DRX softening behavior to coordinate the deformation, the high strain rate is prone to trigger the adiabatic phenomenon leading to local deformation, and there is not enough time to grow up after the DRX nucleation [34]. After deformation, the organization presents a mixed structure of large deformed grains and fine DRX grains, which should be avoided for thermal processing in practical industrial production. The organization of the instability regions C0.45 and D0.45 predicted by the the Gegel and Malas criteria is shown in Figure 7c,d. All the deformed grains disappeared and formed a complete DRX grain organization at a lower strain rate of 0.01 s−1. At the deformation temperature of 1070 °C, the migration of grain boundaries is slower, and some DRX grains are still characterized by orientation differences and small-angle grain boundaries, which make the grains smaller in size. When the deformation temperature increases to 1120 °C, the grains begin to grow, and the dislocation density decreases significantly. Thus, it is evident that there is no significant instability of the tissue at low strain rates, which is in error with the instability predicted by the Gegel and Malas criteria. The above discussion of microstructure indicates that the unstable deformation parameters predicted by Prasad and Murty of instability criteria at 0.45 strain are the actual parameters for instability.
The KAM diagram of the unstable region (A–C) and the peak power dissipation region (D) in the hot working diagram of the alloy under 0.7 strain, combined with the instability criterion, is shown in Figure 8, where the orientation difference of the organization is reduced in all regions compared to 0.45 strain. After destabilizing deformation in the deformation-parameter interval A0.7 under the Prasad and Murty criteria (Figure 6a), tiny DRX grains with a typical necklace structure are formed along the elongated deformed grain boundaries, with dislocations aggregated in the vicinity of grain boundaries of the original large grains and arranged in a regularly shaped lattice. The dynamic softening behavior occurs to a fuller extent than at 0.45 strain due to the larger strain, but the low deformation temperature and high strain rate still inhibit the rapid onset of DRX, allowing the tissue to undergo pronounced adiabatic shear phenomena [35]. The B0.7 region is the instability region predicted by the Murty criterion, where not only is there no significant localized rheology, but also the deformed grains disappear completely (Figure 6b). The organization consists of equiaxed grains of relatively uniform size, and there are almost no orientation differences, such as dislocations, present within the grains. The rapid accumulation of dislocations at high strain rates promotes DRX nucleation, while the high temperature accelerates the rate of grain boundary migration. The substructure around the engulfed DRX nuclei grows with the strain as the grain boundaries migrate [36]. Therefore, the organization after deformation to 0.7 strain at 1170 °C–1 s−1 parameter is better and does not destabilize, so the high-temperature and high-rate instability region predicted by Murty’s criterion at 0.7 strain is biased. It is related to the fact that the Murty instability criterion treats the value of m as a variable, resulting in a slightly larger region of identified instability. Figure 6c shows the organization in the low-temperature, low-rate (C0.7) region predicted by the Gegel and Malas criteria, which is similar to that at 0.45 strain (Figure 5c) and does not show instability, but rather an increase in grain size and a decrease in the orientation difference as the strain is increased. Therefore, the Gegel and Malas criteria at 0.7 strain will not predict the instability process window of GH99 alloy. The organization corresponding to the peak power dissipation power region D0.7 is shown in Figure 6d, where significant grain growth occurs driven by high-temperature, low-rate deformation conditions, and where greater DRX softening behavior provides an effective way to reduce deformation resistance and coordinate plastic deformation. These tissue evolutions consume a significant amount of energy in the system, resulting in high power dissipation values. Therefore, the D0.7 region (1100 °C–1150 °C, 0.001 s−1–0.03 s−1) is the optimal processing window for this alloy.

5. Conclusions

Through the thermal compression experiments of the GH99 alloy at 1020 °C–1170 °C and 0.001 s−1–1 s−1 conditions under the strain variables of 0.45 and 0.7, respectively, and based on the thermal processing maps superimposed on the four instability criteria (Prasad, Murty, Gegel, and Malas) as well as the means of microstructural characterization of the EBSD, the destabilization process parameters of the alloy have been predicted comprehensively and suitable machining process windows and the main conclusions are drawn as follows:
1. At a strain of 0.45, the instability process parameters of the alloy have two intervals. The first one is located at 1020 °C–1085 °C, 0.05 s−1–1 s−1. When a large orientation and grain size differences exist in the microstructure, the dislocation density is high, and it is challenging to coordinate plastic deformation. The second one is located at 140 °C–1170 °C, 0.06 s−1–1 s−1. Although the deformation temperature is high, high strain rates often cause adiabatic phenomena, leading to local deformation.
2. As the strain increases to 0.7, the instability interval decreases and exists only at 1020 °C–1080 °C, 0.01 s−1–1 s−1. The degree of dynamic recrystallization occurring at low temperatures and high strain rates is still suppressed, and the organization undergoes significant adiabatic shear. In addition, the optimum process range for the alloys is 1100 °C–1150 °C, 0.001 s−1–0.03 s−1.
3. A comparison of the four instability criteria at different strains shows that Prasad is the most accurate; Murty’s predicted instability range is accurate at small strains, but as the strain increases, the predicted range of instability increases slightly compared to the actual; and the Gegel and Malas criteria have a bias in predicting the alloys at different strains.

Author Contributions

Y.P. and G.Z. designed the experimental program, X.M. and X.J. conducted the experiments, Y.P. processed the experimental data and prepared the draft paper, H.Z. and S.Z. examined the data, and G.Z. led project acquisition and fund management, Resources, L.C. All authors have read and agreed to the published version of the manuscript.

Funding

This research was funded by [Support Program for Young and Middle-aged Talents in Science and Technology Innovation in Shenyang City] grant number [RC220147] and the APC was funded by [zhouge@sut.edu.cn].

Data Availability Statement

No new data were created or analyzed in this study. Data sharing is not applicable to this article.

Conflicts of Interest

The authors declare no conflicts of interest.

References

  1. Li, H.X.; Wei, H.M.; He, P.; Lin, T.S.; Feng, J.C.; Huang, Y.D. Effects of alloying elements in GH99 superalloy on microstructure evolution of reactive brazing TiAl/GH99 joints. Intermetallics 2013, 34, 69–74. [Google Scholar] [CrossRef]
  2. Li, W.Q.; Hu, S.P.; Lei, Y.Z.; Lei, Y.; Song, X.G.; Feng, J.C. Interfacial microstructure and mechanical properties of GH99 superalloy and Nb brazed joint using Cu75Pt25 filler. Trans. Nonferrous Met. Soc. China 2020, 30, 2724–2736. [Google Scholar] [CrossRef]
  3. Hu, Y.L.; Lin, X.; Li, Y.L.; Wang, J.; Zhang, S.Y.; Lu, X.F.; Huang, W.D. Effect of heat treatment on the microstructural evolution and mechanical properties of GH4099 additive-manufactured by directed energy deposition. J. Alloys Compd. 2019, 800, 163–173. [Google Scholar] [CrossRef]
  4. Zhang, D.; Dong, X.J.; Xu, Y.; Lu, S.Q.; Wei, K.; Huang, L. Dynamic recrystallization mechanism of Ti-6554 alloy during high-temperature deformation. J. Alloys Compd. 2023, 959, 170534. [Google Scholar] [CrossRef]
  5. Qin, F.C.; Li, Y.T.; Qi, H.P.; Wei, X.J. Microstructure and mechanical properties of as-cast 42CrMo ring blank during hot rolling and subsequent quenching and tempering. J. Mater. Eng. Perform. 2017, 26, 1300–1310. [Google Scholar] [CrossRef]
  6. Ji, H.C.; Duan, H.L.; Li, Y.G.; Li, W.D.; Huang, X.M.; Pei, W.C.; Lu, Y.H. Optimization the working parameters of as-forged 42CrMo steel by constitutive equation-dynamic recrystallization equation and processing maps. J. Mater. Res. Technol. 2020, 9, 7210–7224. [Google Scholar] [CrossRef]
  7. Jiao, Y.X.; Qi, Q.Q.; Gong, Y.M.; Gao, Y.F.; Chen, H.Q.; Chen, F.; Zhou, F.W.; Li, X.X. Research on hot deformation behavior and microstructure evolution mechanism of GH4169 superalloy. Mater. Today Commun. 2024, 40, 109958. [Google Scholar] [CrossRef]
  8. Chen, L.; Zhang, B.; Yang, Y.; Zhao, T.L.; Xu, Y.; Wang, Q.; Zan, B.; Cai, J.; Wang, K.S.; Chen, X. Evolution of hot processing map and microstructure of as-forged nickel-based superalloy during hot deformation. J. Mater. Res. Technol. 2023, 24, 7638–7653. [Google Scholar] [CrossRef]
  9. Cai, D.Y.; Xiong, L.Y.; Liu, W.C.; Sun, G.D.; Yao, M. Characterization of hot deformation behavior of a Ni-base superalloy using processing map. Mater. Des. 2009, 30, 921–925. [Google Scholar] [CrossRef]
  10. Murty, S.V.S.N.; Rao, B.N. On the development of instability criteria during hotworking with reference to IN 718. Mater. Sci. Eng. A 1998, 254, 76–82. [Google Scholar] [CrossRef]
  11. Murty, S.V.S.N.; Rao, B.N.; Kashyap, B.P. Improved ductile fracture criterion for cold forming of spheroidised steel. J. Mater. Process. Technol. 2004, 147, 94–101. [Google Scholar] [CrossRef]
  12. Somani, M.C.; Muraleedharan, K.; Prasad, Y.V.R.K.; Singh, V. Mechanical processing and microstructural control in hot working of hot isostatically pressed P/M IN-100 superalloy. Mater. Sci. Eng. A 1998, 245, 88–99. [Google Scholar] [CrossRef]
  13. Prasad, Y.V.R.K.; Gegel, H.L.; Doraivelu, S.M.; Malas, J.C.; Morgan, J.T.; Lark, K.A.; Barker, D.R. Modeling of dynamic material behavior in hot deformation: Forging of Ti-6242. Metall. Trans. A 1984, 15, 1883–1892. [Google Scholar] [CrossRef]
  14. Malas, J.C.; Seetharaman, V. Using material behavior models to develop process control strategies. JOM 1992, 44, 8–13. [Google Scholar] [CrossRef]
  15. Wu, Y.S.; Wang, C.S.; Qin, X.Z.; Zhou, L.Z. The Role of Strain and Dynamic Recrystallization During Hot Deformation of a Fe-Ni-Cr-Based Alloy. Adv. Eng. Mater. 2022, 24, 2200250. [Google Scholar] [CrossRef]
  16. Tan, G.; Li, H.Z.; Wang, Y.; Yang, L.; Qiao, S.C.; Huang, Z.Q.; Liu, M.X. Hot working characteristics of HEXed PM nickel-based superalloy during hot compression. Trans. Nonferrous Met. Soc. China 2020, 30, 2709–2723. [Google Scholar] [CrossRef]
  17. Wang, Y.L.; Li, Y.; Zhang, H.; Yang, J.L.; Ma, X.D.; Chen, Q.; Guo, J.Z. Quasi-static hot deformation behavior of a novel third-generation Ni-based powder metallurgy superalloy. Proc. Inst. Mech. Eng. Part L J. Mater. Des. Appl. 2020, 235, 743–751. [Google Scholar] [CrossRef]
  18. Babu, K.A.; Mozumder, Y.H.; Saha, R.; Mandal, S.A. Systematic Assessment of Various Stability/Instability Criteria in Predicting the Hot Deformation-Related Instabilities in Super-304H Stainless Steels. J. Mater. Eng. Perform. 2019, 28, 4718–4730. [Google Scholar] [CrossRef]
  19. Ma, X.; Zeng, W.D.; Wang, K.X.; Lai, Y.L.; Zhou, Y.G. The investigation on the unstable flow behavior of Ti17 alloy in α+β phase field using processing map. Mater. Sci. Eng. A 2012, 550, 131–137. [Google Scholar] [CrossRef]
  20. Li, J.Q.; Liu, J.; Cui, Z.S. Hot Deformation Stability of Extruded AZ61 Magnesium Alloy Using Different Instability Criteria. Acta Metall. Sin. 2015, 28, 1364–1372. [Google Scholar] [CrossRef]
  21. Yang, P.R.; Liu, C.X.; Guo, Q.Y.; Liu, Y.C. Variation of activation energy determined by a modified Arrhenius approach: Roles of dynamic recrystallization on the hot deformation of Ni-based superalloy. J. Mater. Sci. Technol. 2021, 72, 162–171. [Google Scholar] [CrossRef]
  22. Tan, L.M.; Li, Y.P.; He, G.A.; Liu, F.; Nie, Y.; Jiang, L. Optimized hot workability of a powder metallurgy nickel-base superalloy. Mater. Charact. 2019, 147, 340–352. [Google Scholar] [CrossRef]
  23. Jia, L.; Cui, H.; Yang, S.F.; Lv, S.M.; Xie, X.F.; Qu, J.L. Hot deformation behavior and flow stress modeling of coarse-grain nickel-base GH4151 superalloy ingot materials in cogging. J. Mater. Res. Technol. 2023, 26, 6652–6671. [Google Scholar] [CrossRef]
  24. Prasad, Y.; Seshacharyulu, T. Processing maps for hot working of titanium alloys. Mater. Sci. Eng. A 1998, 243, 82–88. [Google Scholar] [CrossRef]
  25. Yang, X.Z.; Zhang, L.C.; Shi, Y.S.; Yu, S.F.; Hua, W.L. Effect of niobium addition on hot deformation behaviors of medium carbon ultra-high strength steels. J. Wuhan Univ. Technol. 2017, 32, 162–172. [Google Scholar] [CrossRef]
  26. Prasad, Y. Processing maps: A status report. J. Mater. Eng. Perform. 2003, 12, 638–645. [Google Scholar] [CrossRef]
  27. Li, C.M.; Huang, L.; Zhao, M.J.; Guo, S.Q.; Su, Y.; Li, J.J. Characterization of hot workability of Ti-6Cr-5Mo-5V-4Al alloy based on hot processing map and microstructure evolution. J. Alloys Compd. 2022, 905, 164161. [Google Scholar] [CrossRef]
  28. Guo, S.L.; Wu, S.S.; Guo, J.T.; Shen, Y.Z.; Zhang, W. An investigation on the hot deformation behavior and processing maps of Co-Ni-Cr-W-based superalloy. J. Manuf. Process. 2022, 74, 100–111. [Google Scholar] [CrossRef]
  29. Murty, S.V.S.; Rao, B.N. On the flow localization concepts in the processing maps of titanium alloy Ti-24Al-20Nb. J. Mater. Process. Technol. 2000, 104, 103–109. [Google Scholar] [CrossRef]
  30. Murty, S.V.S.; Rao, B.N. On the hot working characteristics of INCONEL alloy MA 754 using processing maps. Scand. J. Metall. 2003, 29, 146–150. [Google Scholar] [CrossRef]
  31. Murty, S.V.S.; Rao, B.N.; Kashyap, B.P. On the hot working characteristics of 6061Al-SiC and 6061-Al2O3 particulate reinforced metal matrix composites. Compos. Sci. Technol. 2003, 63, 119–135. [Google Scholar] [CrossRef]
  32. Murty, S.V.S.; Rao, B.N.; Kashyap, B.P. Identification of flow instabilities in the processing maps of AISI 304 stainless steel. J. Mater. Process. Technol. 2005, 166, 268–278. [Google Scholar] [CrossRef]
  33. Zhao, X.; Lv, J.J.; Liu, H.L.; Zheng, L. Hot deformation behavior of a novel Ni-W-Co high-density Ni-based alloy with ultra-high W content. J. Alloys Compd. 2023, 950, 169937. [Google Scholar] [CrossRef]
  34. Kareem, S.A.; Anaele, J.U.; Aikulola, E.O.; Olanrewaju, O.F.; Omiyale, B.O.; Bodunrin, M.O.; Alaneme, K.K. Hot deformation behaviour, constitutive model description, and processing map analysis of superalloys: An overview of nascent developments. J. Mater. Res. Technol. 2023, 26, 8624–8669. [Google Scholar] [CrossRef]
  35. Zhang, Z.W.; Liu, R.X.; Li, D.Y.; Peng, Y.H.; Zhou, G.W.; Jia, Z.H.; Ma, W.T. Investigation on deformation behaviors and dynamic recrystallization mechanism of spray formed Al-Zn-Mg-Cu alloy under hot compression. J. Mater. Res. Technol. 2024, 28, 4401–4416. [Google Scholar] [CrossRef]
  36. Tian, Y.H.; Zhang, P.; Zhao, G.H.; Li, H.Y.; Ma, L.F.; Li, J. A systematic study on thermo-mechanical behavior, processing maps and recrystallization mechanism of Incoloy825 superalloy during hot compression. J. Mater. Res. Technol. 2024, 28, 4551–4566. [Google Scholar] [CrossRef]
Figure 1. (a) Thermal compression process diagram, (b) original organization of the GH99 alloy.
Crystals 14 00869 g001
Figure 2. True stress-strain curves of the GH99 alloy at different deformation temperatures: (a) 1020 °C, (b) 1170 °C.
Crystals 14 00869 g002
Figure 3. Power dissipation map of alloy at different strains: (a) 0.45, (b) 0.7.
Crystals 14 00869 g003
Figure 4. Thermal processing maps of four instability criteria superimposed at different strains: (a) 0.45, (b) 0.7.
Crystals 14 00869 g004
Figure 5. IPF diagrams of different instability regions under 0.45 strain: (a) A0.45, (b) B0.45, (c) C0.45, (d) D0.45.
Crystals 14 00869 g005
Figure 6. IPF diagrams of different instability regions under 0.7 strain (a) A0.7, (b) B0.7, (c) C0.7, (d) D0.7.
Crystals 14 00869 g006
Figure 7. KAM diagrams of different instability regions under 0.45 strain: (a) A0.45, (b) B0.45, (c) C0.45, (d) D0.45.
Crystals 14 00869 g007
Figure 8. KAM diagrams of different instability regions under 0.7 strain: (a) A0.7, (b) B0.7, (c) C7, (d) D7.
Crystals 14 00869 g008
Table 1. Chemical composition of the GH99 alloy (wt.%). The standard range for adding alloy chemical components is indicated in parentheses.
Cr
(17.0–20.0)
Co
(5.0–8.0)
W
(5.0–7.0)
Mo
(3.5–4.5)
Al
(1.7–2.4)
Ti
(1.0–1.5)
Fe
(≤2.0)
C
(≤0.08)
Ni
18.306.405.904.022.191.160.240.045Bal.
Table 2. Instability range predicted by different instability criteria.
Instability CriteriaRheological Instability Range
(0.45 Strain)
Rheological Instability Range
(0.7 Strain)
Prasad1020 °C–1085 °C, 0.05 s−1–1 s−1
1140 °C–1170 °C, 0.06 s−1–1 s−1
1020 °C–1080 °C, 0.01 s−1–1 s−1
Murty1020 °C–1150 °C, 0.028 s−1–1 s−1
1120 °C–1170 °C, 0.028 s−1–1 s−1
1020 °C–1090 °C, 0.056 s−1–1 s−1
1155 °C–1170 °C, 0.1 s−1–1 s−1
Gegel1020 °C–1140 °C, 0.001 s−1–0.008 s−11020 °C–1063 °C, 0.001 s−1–0.007 s−1
Malas1020 °C–1170 °C, 0.001 s−1–0.021 s−11020 °C–1097 °C, 0.001 s−1–0.018 s−1
Disclaimer/Publisher’s Note: The statements, opinions and data contained in all publications are solely those of the individual author(s) and contributor(s) and not of MDPI and/or the editor(s). MDPI and/or the editor(s) disclaim responsibility for any injury to people or property resulting from any ideas, methods, instructions or products referred to in the content.