Abstract
Lithium carbonate is an important material in the lithium battery. The materials can be obtained from a reactive crystallization process. To prepare the higher-quality crystals, such as purity, crystal size distribution, and desired morphology, it needs to be controlled effectively in the crystallization process. Therefore, a study of crystallization kinetics was required. Here, the metastable region was explored first. Subsequently, a LiCl-K2CO3-H2O reaction system in a continuous stirred-tank crystallizer with controlling pH was used to study the crystallization kinetics, such as nucleation rate (B0), agglomeration kernel (β), and crystal growth rate (G), which can be determined with measured crystal size distribution at a steady-state condition using an agglomeration population balance model. The process variables include lithium chloride solution flow rate, potassium carbonate solution flow rate, and stirring speed. The results show that B0, β, and G were in the range of 3.47 × 10⁹–5.98 × 10¹² no/m3·s, 1.78 × 10⁻¹⁹–1.20 × 10⁻¹² m3-slurry/no·s, and 3.00 × 10⁻¹¹–2.11 × 10⁻¹⁰ m/s, respectively, depending on the operating conditions. All relative supersaturations were in the range of 1.22–2.04. In addition, the crystal size observed was found to be in the range of 1.28–32.7 μm, with irregular platelet forms in most cases. In addition, more slurry density can be obtained at the feed rate of 40 mL/min. A linear regression for crystallization kinetics was also discussed in this work. Finally, this process demonstrated that the recycling of lithium was possible for a circular economy. Therefore, the result can be used as a reference for larger-scale operations in industry.
1. Introduction
In recent years, as lithium batteries are increasingly being used in electric vehicles, power storage, mobile phones, and other applications, the consumption of various lithium compounds has increased accordingly. The disposal of used lithium batteries will impact the environment. Thus, recycling is necessary for a circular economy. In the industrial battery composition, Li2CO3 accounts for about 60%, followed by LiOH, which accounts for 23% [1]. The demand for Li2CO3 is estimated to increase from 237,000 tons in 2018 to 4.4–7.5 million tons of LCE by 2100, an increase of 20–30 times in 80 years. Therefore, the demand for lithium will be larger in the future. Besides the use of the raw materials of lithium, recycling lithium from discarded electrical appliances or electronic devices (mobile phones, computers, TV) and recycling lithium from discarded lithium batteries have become inevitable trends [2,3,4,5,6]. Due to this, the circular economy and environmental safety can be promoted, and on the other hand, supply chain security can be maintained. Based on this, some scholars have been engaged in the recovery of lithium metal in succession, such as the recovery of lithium metal from salt lakes and brine [7,8]. In addition, some scholars used Na2CO3 as a precipitant to react with Li+ ions in the lithium battery waste liquid for crystallization to recover Li2CO3 [9,10,11,12,13]. Han et al. [11] used the precipitation method containing impurities to recover lithium carbonate. They found that the feeding rate of carbonate and the stirring rate had an effect on particle size distribution. Uniform particles were obtained with a semi-batch process. A faster carbonate feeding rate can result in a smaller particle size due to the high relative supersaturation. In order to obtain high-purity Li2CO3, some effective methods were adopted [14,15,16]. From the literature surveyed, it can be concluded that two processes were adopted: one is the liquid–liquid reactive crystallization process (homogeneous), and the other is gas–liquid reactive crystallization process (heterogeneous).
For homogeneous precipitation, Han et al. [17] attempted to use Li2SO4 as a simulated solution to react with a Na2CO3 solution for homogeneous reactive crystallization to recover Li2CO3. The variables included temperature, stirring rate, liquid feed rate, etc. In order to study the crystallization kinetics of Li2CO3, Zhao et al. [5] determine the kinetics and mechanisms of Li2CO3 reactive crystallization, including nucleation and growth, by induction time measurements and model and optimize the crystallization process using response surface methodology. King et al. [18] found that inorganic solutions have an effect on lithium carbonate crystal growth. During reactive crystallization, the agglomeration phenomena are hard to avoid. Yang et al. [19] studied the crystal agglomeration of lithium carbonate and proposed that the crystal agglomeration mainly results from these aggregates of precursors rather than collisions of well-formed crystals.
In a heterogeneous process, several steps are involved, including contacting, absorption, reaction, and precipitation, which are also explored in some of the literature [1,17,20,21,22,23,24,25,26]. The formation of carbonate ions was controlled by the absorption of mass transfer and pH value. CO2 absorption reaction with Li2SO4 solution was studied by Han and Louhi-Kultanen [17], and the variables included temperature, gas flow rate, mixing rate, etc. Differences between homogeneous and heterogeneous could be observed. The former achieved a higher recovery rate due to higher carbonate concentration, and a higher stirring rate resulted in a smaller particle size. The heterogeneous reactive crystallization showed that the temperature and final pH had a significant impact on reactive crystallization. Moreover, Matsumota et al. [23] used LiNO3 as the lithium-ion source and microwaves to produce CO2 microbubbles to generate Li2CO3 nanoparticles. Sun et al. [24] employed a rotating disk reactor to study the gas–liquid reactive crystallization of LiOH/CO2 and enhanced the reaction with ultrasound. It was found that ultrasound, temperature, and gas flow rate could influence the particle size. Afterward, Sun et al. [25] used the LiOH/CO2 system to study gas–liquid reactive crystallization with a falling film column. The Reynolds number, falling film thickness, and exposure time were important parameters. The results show that high temperature or high LiOH concentration resulted in larger particle sizes, and the crystallization promoted the accelerated transport of carbonate ions from the gas–liquid interface to the bulk phase, so the absorption rate was increased. There is a certain relationship between the absorption rate and crystallization rate.
In addition, Zhou et al. [27] used reaction and solvent extraction to recover Li2CO3 from the LiCl/CO2 system. They used tri-n-octyl amine and iso-octanol as extractants to remove HCl and increase the yield of Li2CO3. Tian et al. [26] put LiCl/NH4OH/CO2 in a batch stirring tank and found that a higher temperature led to a shorter induction time and a higher yield. In addition, they found that higher NH4OH concentration resulted in smaller particle sizes. Battaglia et al. [1] added some components in the LiCl solution to simulate a salt solution, discussed the liquid–liquid reaction method, i.e., Na2CO3/LiCl for Li2CO3 recovery, and discussed the gas–liquid reaction method, i.e., NaOH/LiCl/CO2 system for Li2CO3 recovery. They found that in the liquid–liquid reaction system, the recovery rate of Li+ ions increased with the CO32−/Li+ ratio, while the purity slightly decreased as the ratio increased (98–90%). They also found that the recovery rate was high when the temperature was high, and the recovery rate increased with the ion strength. The positive and negative ions had different degrees of influence. In the gas–liquid reactant system, an increase in the OH−/Li+ ratio could increase the recovery rate, but the purity was about 100%. It was also found that a high ion strength or temperature resulted in a higher recovery rate; this trend was similar to that of liquid–liquid reactions.
For most liquid–liquid reaction cases, batch mode processes were selected in the production of lithium carbonate [5,28,29]. However, a continuous mode process was required for larger-scale operations in industry. Up to now, no kinetic data have been obtained from Mixed-suspension, Mixed-Product-Removal (MSMPR) processes. Therefore, the purpose of this work is not only to determine the metastable region of lithium carbonate but also to explore the crystallization kinetics of lithium carbonate using an MSMPR crystallizer. Using the population model, crystallization kinetics can be determined using equations of moments [30,31,32,33,34,35,36]. Finally, the relative supersaturation was evaluated, and kinetic correlation equations were also obtained for further analysis.
2. Determination of Kinetic Data
Assume a perfectly mixed continuous flow in a crystallizer; the population balance equation with agglomeration in volume coordinate was used to obtain the crystallization kinetic data [33]:
where Gv is the crystal-volume-independent overall growth rate (m3/s), and is the population density (no./m3·m3). (birth rate) and (death rate) are shown below:
and
Substitute Equations (2) and (3) into Equation (1), they become
The agglomeration kernel β (u, v − u) is a measurement of the frequency of collisions between particles of volume u and v − u that are successful in forming a particle of volume v. The factor 1/2 in Equation (2) ensures that collisions are not counted twice. Equation (4) was multiplied by vidv and integrated from 0 to ∞ to obtain moment equations, which were expressed in matrix form:
where
Here, B0 is the nucleation rate (no./s·m3), and the jth moment can be determined by the following:
where the population density is
In Equation (9), τ is the mean residence time. Once the measured particle size distribution was used to evaluate the three moments, the crystallization kinetic data, including Gv, β and B0, could be determined simultaneously from Equation (9).
3. Relative Supersaturation
The relative supersaturation can be defined as
In Equation (10), γ1 and γ2 are the activity coefficients for Li+ and CO32−, respectively. Ksp is the solubility product of lithium carbonate. The activity coefficients can be evaluated by the Bromley equation [34]:
The equation can be used to predict high ionic strength solutions up to 6M. Here, zi is the valence of i component, I is the ionic strength, and B1 is a parameter. In addition, the ionic strength is
In the K2CO3/LiCl/KOH/H2O system, the K2CO3 and LiCl solutions are continuously fed into the crystallizer simultaneously, and the KOH solution was added to the solution when the pH value was less than the set value. In order to calculate the ionic strength, the concentrations of species in the crystallizer need to be determined, such as carbonate, lithium ion, chloride ion, potassium ion, and pH value, with the aid of material balances. The mass action equations for the K2CO3/LiCl/KOH/H2O system are as shown in Table 1 [35,36]. However, the carbonate distribution can be expressed as shown in Figure 1, which shows that the carbonate ion can be adjusted by changing the pH value. In here, α is shown in Equations (13) and (14).

Table 1.
Mass action equations for K2CO3/LiCl/KOH/H2O system at 30 °C.
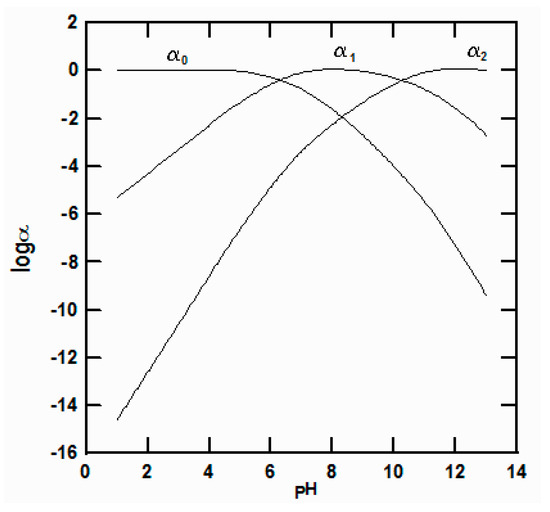
Figure 1.
A plot of species of carbonate versus pH value.
4. Experimental Features
4.1. Determination of Metastable Region
First, add LiCl solutions (3 M, 8 M) step by step (by titration) into Na2CO3 solutions (0.6 M–2.4 M) presented in a beaker and mix with a stirrer for both solutions. During operation, the temperature was kept at 30 °C. Once the solution presented turbidity, the experiment was stopped, the concentrations of [Li+] (A) and [CO32+] (B) were measured, and pH value was recorded. Repeat the similar experiments: a plot of pA (=−log[Li+]) versus pB (=−log[CO32+]) accompanied by the solubility product of Li2CO3 is required, and the metastable region of Li2CO3 can be obtained.
4.2. Crystallization Experiments
The crystallization experiment was carried out using a continuous stirred-tank crystallizer, as shown in Figure 2. It consists of a pH controller, a liquid-level controller, a 1 liter acrylic resin crystallizer, a constant-temperature water bath, and three tubing pumps, one for the feeding reactants, one for control liquid level, and one for the feeding of pH-adjusting solution, as well as an axial flow steel agitator. The diameter and height of the crystallizer are 100 mm and 130 mm, respectively. First, K2CO3 (1M), LiCl (2M), and KOH (2M) solutions were prepared at desired concentrations, and a 0.8 L LiCl solution was added to the crystallizer. Second, insert the calibrated pH electrode into the crystallizer and adjust the pH value using the KOH solution to the set value. Subsequently, put the liquid-level controller within the crystallizer at a fixed level. Finally, the K2CO3, LiCl, and KOH inlet tubes were inserted into the crystallizer. Open the tubing pumps, pH controller, liquid level controller, and agitator machine. The experiment was started. The operating time was 15 times the mean resistance time at least. During the operation, as the solution pH was less than the setting pH value, KOH solution (2M) was fed into the crystallizer automatically through the action of the pH controller. In addition, as the liquid level was higher than the setting value, the tubing pump would withdraw the slurry automatically by the liquid-level controller, maintaining the liquid level. A 20 mL slurry sample was withdrawn every thirty minutes; one part of the slurry was used to measure the crystal size distribution (CSD) using a Computerized Inspection System (Calai CIS-1), and the other part of the slurry was filtrated with a 0.22 μm filtration filter element to remove solids from solution. Then, the clear solution was used to determine the total carbonate concentration and lithium-ion concentration analyzed by Ion Analyzer (Corning Ion Analyzer 255, Corning, New York, NY, USA) and Ion Chromatograph (IC 761, Metrohm, Kanaalweg, The Netherlands), respectively. At the end of the operation, the slurry was filtered, and the precipitates were dried in an oven at 100 °C for at least two hours. Subsequently, the dried solids were used for characterization by XRD and SEM. The temperature and pH were set at 30 °C and 11.5, respectively. In addition, the feed rate and stirring speed were 20–80 mL/min and 800–1200 rpm, respectively. A total of twelve runs were conducted in this study.
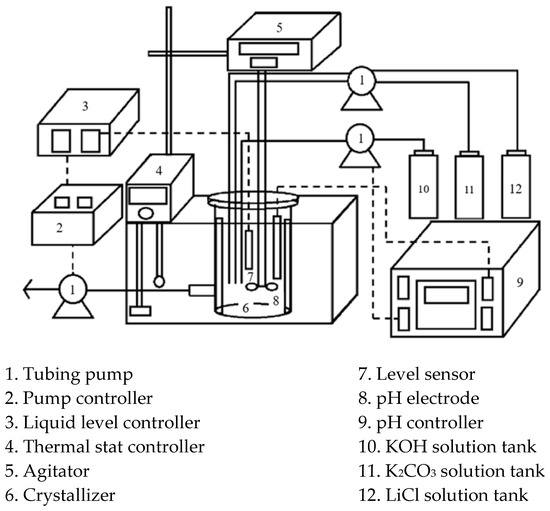
Figure 2.
A continuous stirred-tank crystallizer producing lithium carbonate crystals.
5. Result and Discussion
5.1. Metastable Region of Lithium Carbonate
Figure 3 shows the metastable region of lithium carbonate: a plot of pA versus pB. The positive points (+) are the experimental data presented here. The ranges of pA and pB were −0.69~0.492 and −0.453~2.43, respectively. The upper solid line is the solubility curve obtained using the equation pA + pB = pKsp. It was found that three regions were observed, which were divided by two lines. The three regions are the labile region, unstable region, and metastable region, respectively. The labile region is a stable region with no crystals forming; the unstable region is a higher supersaturation region with primary nucleation; and the metastable region shows a lower supersaturation with crystal growth and secondary nucleation. In most sparingly soluble salts, nucleation is dominated, i.e., the unstable region is important. Figure 3 shows that the concentrations of reactant solutions can be found for the precipitation of lithium carbonate. Here, the concentrations of reactants conducted in this work were located in the unstable region at the initial stage. In order to observe the crystallization phenomena of lithium carbonate in a semi-batch process, LiCl solutions (4M) were added by titration into Na2CO3 solutions (500 mL, 4M), presented in a beaker and mixed with an agitator, keeping it at 30 °C. The induction time, precipitation rate, and morphology were found to be 4 min, 9.67 g/min, and platelet with agglomerate morphology. Please see Supplementary Material.
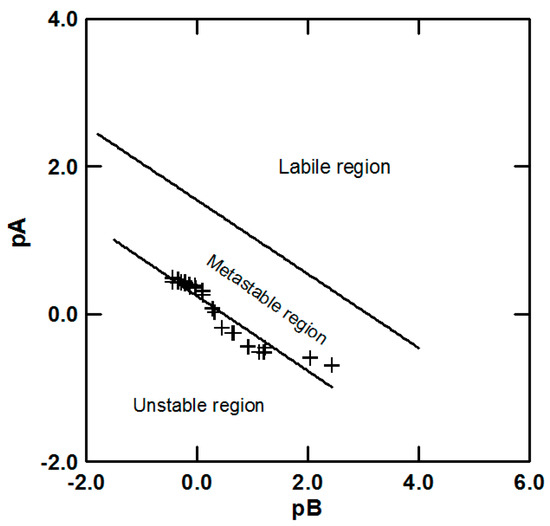
Figure 3.
Metastable region of lithium carbonate at 30 °C. (+) Data measured in this work.
5.2. Crystallization Kinetic Data
Solid samples were examined by XRD powder diffraction peaks, as shown in Figure 4 for No. 1. From the Lithium carbonate standard card (ICDD 00-022-1141) [17,25], it was found that the major peaks are (−110), (111), (−02), (002), (−112), (−311), and (311), which are lithium carbonate. Other samples all have the same results. Figure 5 was a plot of concentrations versus time showing the changes in [Li+] and [CO32−] ions from unsteady-state to steady-state conditions. It was found that the concentrations for both reached a steady state after 150 min. Figure 6 shows the measured particle number (n(#/mL)) distributions at different times, showing the particle number reached a steady state after 150 min. Using the particle size distribution at steady-state conditions, the population density can be calculated, as shown in Figure 7. Using the population density, the jth moment (j = 0, 1, 2) in Equation (6) can be determined, and hence, the nucleation rate, volume growth rate, and agglomeration kernel can be evaluated using Equation (9). All data are listed in Table 2. The nucleation rate, volume growth rate, and agglomeration kernel obtained here were in the range of 3.47 × 10⁹~5.98 × 10¹² no/m3·s, 8.12 × 10⁻²²~4.13 × 10⁻¹⁹ m3/s, and 1.78 × 10⁻¹⁹~1.20 × 10⁻¹² m3/no·s for B0, Gv, and β, respectively. In addition, the particle size, slurry density, and mean residence time were measured in the range of 1.28~32.7 μm, 0.02–5.88 kg/m3, and 4.52~17.97 min for d, M, and t, respectively. Subsequently, by dividing the πd2 (the surface area of a sphere), the volume growth rate can be transferred into the linear growth rate, which was in the range of 3.00 × 10⁻¹¹~2.11 × 10⁻¹⁰ m/s.
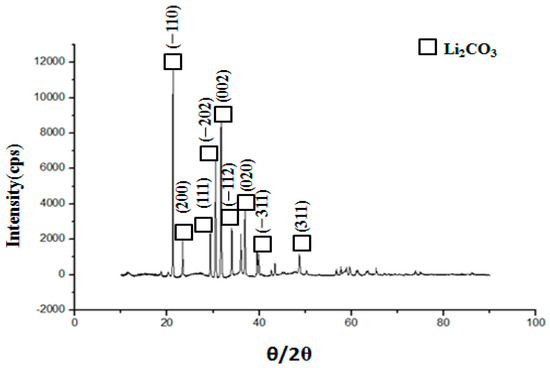
Figure 4.
XRD patterns for lithium carbonate crystals (No. 1).
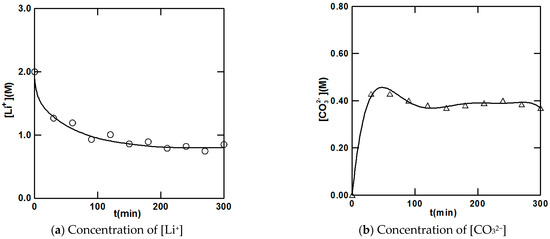
Figure 5.
Measured reactant concentrations vary with time (No.1). (a) (○) is the measured data for [Li+]; (b) (△) is the measured data for [CO32−].
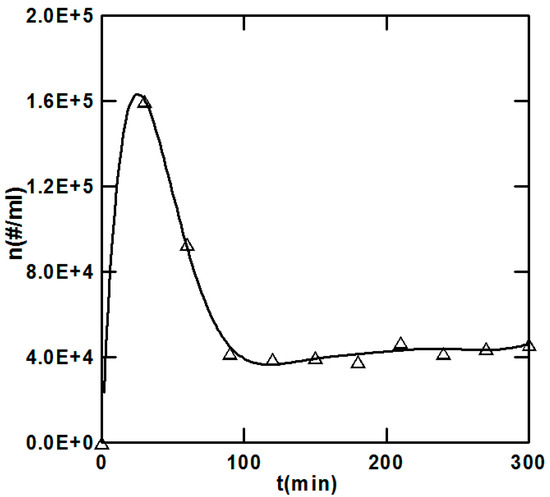
Figure 6.
Measured particle number varies with time (No. 1). (△) is the experimental data presented in this figure.
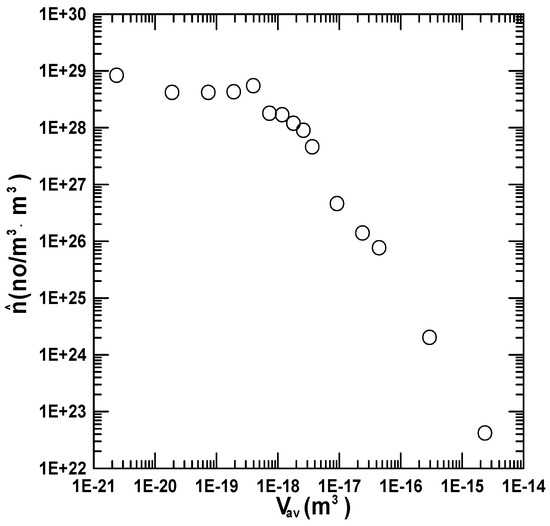
Figure 7.
A plot of population density versus average particle size (No. 1). (○) is the experimental data presented in this figure.
Table 2.
Crystallization kinetic data of lithium carbonate obtained in this work.
5.3. Relative Supersaturation Data
From the measured concentrations, C1 [Li+] and C2 [CO32−], and the material balance for non-reacting components, the ionic strength can be determined using Equation (12). Subsequently, the activity coefficients shown in Equation (11) can be obtained, and hence, the relative supersaturation can be determined using Equation (10). Table 3 shows the relative supersaturation at different conditions. Both concentrations measured were found to be 0.802~1.275 M and 0.291~0.483 M for C1 and C2, respectively. The ionic strength is in the range of 2.04~2.51M, which is confident when the Bromley equation [34] is used. In addition, the activity coefficients for γ1 and γ2 were found to be 0.5076~0.8074 and 0.06803~0.07713, respectively. Substitute all data into Equation (10); the obtained relative supersaturations were in the range of 1.22–2.04.
Table 3.
Relative supersaturations at different operating conditions.
5.4. Growth Kinetics
Linear growth rate of lithium carbonate was found to be in the range of 3.00 × 10⁻¹¹~2.11 × 10⁻¹⁰ m/s, which can be correlated with stirring speed (N) and relative supersaturation (σ). The result is
The root mean square error was 1.99%. The result shows that growth rate was obviously increased with an increase in stirring speed (N) and relative supersaturation (σ). However, the growth rate was about second-order (1.9468~2) of relative supersaturation, showing the growth rate followed the parabolic growth law, which can be found in readily soluble materials, such as K2SO4, KH2PO4, and NH4H2PO4, and sparingly soluble substances, such as AgCl, CaF2, BaSO4, CaC2O4·H2O, and CaCO3, showing surface integration control [34,37,38]. Figure 8 was a plot of log G versus log σ for different sparingly soluble substances. It was found that the growth kinetics of Li2CO3 is close to that of CaC2O4·H2O and CaCO3.
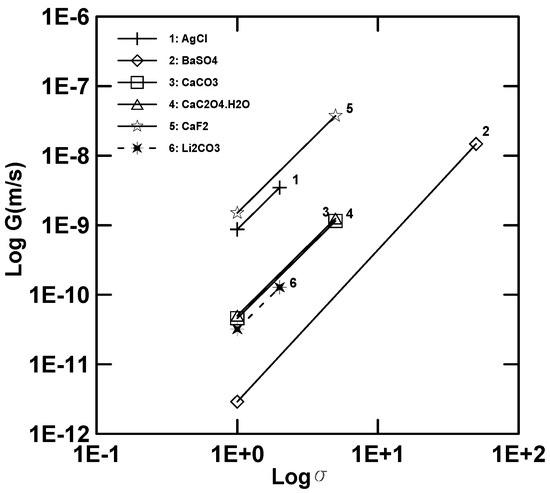
Figure 8.
A plot of log G versus log σ for different sparingly soluble substances [38].
5.5. Nucleation Kinetics
The nucleation rates obtained here were in the range of 3.47 × 10⁹~5.98 × 10¹² no/m3·s, which can be correlated with G, β, and MT. The result is
The root mean square error was 2.00%. The confidence for G, β, and MT are 1.2852 × 10⁻⁴, 5.7781 × 10⁻³, and 1.2931 × 10⁻⁴, respectively. It was found that the nucleation rate was proportional to an order of 0.1874 for growth rate and an order of 1.1877 for slurry density, while the nucleation rate was found to have a weak effect on agglomeration kernel. Nucleation rates for different materials are listed in Table 4, showing that the nucleation rates for Li2CO3 fall between 1.64 × 10⁸ and 8.4 × 10¹⁹ no/m3·s.
Table 4.
Nucleation rates for different sparingly soluble substances.
5.6. Agglomeration
Finally, the agglomeration mechanism can also be correlated with specific power and particle size, resulting in an agglomeration kernel proportional to an order of 3.3056 of crystal size, which is close to 3, belonging to shear mechanisms at high-speed stirring, as reported by Saffman and Turner [44]. In addition, agglomeration kernels for some are also listed in Table 5 for comparison. The range obtained here was 1.78 × 10⁻¹⁹~1.20 × 10⁻¹² m3/no·s, while most data were in the range of 10−17–10−13 m3/no·s, close to the reported data for different materials.
Table 5.
Agglomeration kernels for different sparingly soluble substances.
5.7. Morphology of Lithium Carbonate
Figure 9 shows SEM photographs of lithium carbonate at different conditions. All the morphologies observed are irregular platelets, but some are different in morphology, such as flakes, columns, and flowers, depending on the operating conditions. The conditions in Figure 9a–c are the same feed rate (20 mL/min) but at different stirring speeds (800, 1000, 1200 rpm), while the conditions in Figure 9d–f are the same feed rate (80 mL/min) but at different stirring speeds (800, 1000, 1200 rpm). Therefore, the feed rate and stirring speed have an influence on the morphology of lithium carbonate. On the other hand, the rosette morphology can be observed in heterogeneous (gas–liquid) reactive crystallization processes [17,25], while Wang and Hu [20] obtained column-like morphologies with agglomerate lithium carbonate crystals using a microbubble-assisted pressure carbonation method. In addition, column-like morphologies with agglomerate lithium carbonate crystals were found by King et al. [19] using homogeneous reactive crystallization. Moreover, the morphology of the commercial Li2CO3 was irregular particles with a diameter of 1–10 μm, forming agglomerates with a diameter of about 35 μm [15]. From this, it can be seen that Li2CO3 crystal morphology varies depending on reactive crystallization technologies.
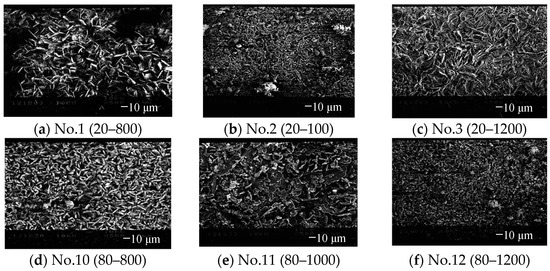
Figure 9.
Morphology of lithium carbonate at different conditions. (Amplification factor ×500 for each photo). (X-Y): Here, X is the feed rate, and Y is the stirring speed.
6. Conclusions
A continuous stirred-tank crystallizer with pH-stat operation at a steady-state condition was successfully used to study the crystallization kinetic of lithium carbonate. Nucleation in the stirred tank was found to be at the local part on one hand, and the crystal growth occurred in the bulk phase on the other, shown at the edge of the supersaturation curve presented in the metastable diagram. The linear growth rate of lithium carbonate obeyed the parabolic rate law and increased with an increase in stirring speed, showing surface integration control. Due to the smaller growth rate (<2.0 × 10⁻¹⁰ m/s), the crystal size was limited to 33 μm, which is close to the commercial size. The nucleation rate of lithium carbonate increased with an increase in growth rate and slurry density, while it was slightly affected by the agglomeration kernel. SEM photos showed that the morphology was flakes, strips, or columns, depending on the operation conditions. Our findings could provide a better understanding of the reactive crystallization kinetics of lithium carbonate and are critical in relation to the crystallization process design and control of lithium carbonate production from lithium chloride sources.
Supplementary Materials
The following supporting information can be downloaded at: https://www.mdpi.com/article/10.3390/cryst14121021/s1, Figure S1: pH of solution change with time. Figure S2: SEM photographs for lithium carbonate crystals.
Author Contributions
Conceptualization, P.-C.C.; methodology, P.-C.C.; software, P.-C.C.; validation, J.-H.J., C.-E.T. and Z.-Y.L.; formal analysis, P.-C.C.; investigation, P.-C.C. and Z.-Y.L.; resources, P.-C.C.; data curation, J.-H.J., C.-E.T. and Z.-Y.L.; writing—original draft preparation, J.-H.J., C.-E.T. and Z.-Y.L.; writing—review and editing, P.-C.C.; visualization, Z.-Y.L.; supervision, P.-C.C.; project administration, P.-C.C.; funding acquisition, P.-C.C. All authors have read and agreed to the published version of the manuscript.
Funding
This research was funded by OCEESA.
Data Availability Statement
Data are contained within the article and Supplementary Materials.
Conflicts of Interest
The authors declare no conflict of interest.
References
- Battaglia, G.; Berkemeyer, L.; Cipollina, A.; Cortina, J.L.; de Labastida, M.F.; Rodriguez, J.L.; Winter, D. Recovery of lithium carbonate from dilute Li-rich brine via homogenous and heterogeneous precipitation. Ind. Eng. Chem. Res. 2022, 61, 13589–13602. [Google Scholar] [CrossRef] [PubMed]
- Di Maria, A.; Elghoul, Z.; Van Acker, K. Environmental assessment of an innovative lithium production process. Procedia CIRP 2022, 105, 672–677. [Google Scholar] [CrossRef]
- Gao, W.; Zhang, X.; Zheng, X.; Lin, X.; Cao, H.; Zhang, Y.; Sun, Z. Lithium carbonate recovery from cathode scrap of spent lithium-ion battery: A closed-loop process. Environ. Sci. Technol. 2017, 51, 1662–1669. [Google Scholar] [CrossRef] [PubMed]
- Rouquette, L.M.J.; Lemaître, T.; Vieceli, N.; Petranikova, M. Intensification of lithium carbonation in the thermal treatment of spent EV Li-ion batteries via waste utilization and selective recovery by water leaching. Resour. Conserv. Recycl. Adv. 2023, 17, 200125. [Google Scholar] [CrossRef]
- Zhao, C.; Zhang, Y.; Cao, H.; Zheng, X.; Van Gerven, T.; Hu, Y.; Sun, Z. Lithium carbonate recovery from lithium-containing solution by ultrasound assisted precipitation. Ultrason. Sonochem. 2019, 52, 484–492. [Google Scholar] [CrossRef]
- Chen, X.; Luo, C.; Zhang, J.; Kong, J.; Zhou, T. Sustainable recovery of metals from spent lithium-ion batteries: A green process. ACS Sustain. Chem. Eng. 2015, 3, 3104–3113. [Google Scholar] [CrossRef]
- Xu, Z.; Zhang, H.; Wang, R.; Gui, W.; Liu, G.; Yang, Y. System and direct production of battery-grade lithium carbonate from a saline lake. Ind. Eng. Chem. Res. 2014, 20, 3121–3133. [Google Scholar]
- Swain, B. Recovery and recycling of lithium: A review. Sep. Purif. Technol. 2017, 172, 388–403. [Google Scholar] [CrossRef]
- Zhang, P.W.; Yokoyama, T.; Itabashi, O.; Suzuki, T.M.; Inoue, K. Hydrometallurgical process for recovery of metal values from spent lithium-ion secondary batteries. Hydrometallurgy 1998, 47, 259–271. [Google Scholar] [CrossRef]
- Nayl, A.A.; Elkhashab Badawy, S.M.; El-Khateeb, M.A. Acid leaching of mixed spent Li-ion batteries. Arab. J. Chem. 2017, 10, s3632–s3639. [Google Scholar] [CrossRef]
- Han, B.; Porvali, A.; Lundstrom, M.; Louhi-Kultanen, M. Lithium recovery by precipitation from impure solution—Lithium ion battery waste. Chem. Eng. Technol. 2018, 41, 1205–1210. [Google Scholar] [CrossRef]
- Meng, F.; McNeice, J.; Zadeh, S.S.; Ghahreman, A. Review of lithium production and recovery from minerals, brines, and lithium-ion batteries. Miner. Process. Extr. Metall. Rev. 2021, 42, 123–141. [Google Scholar] [CrossRef]
- Zheng, H.; Dong, T.; Sha, Y.; Jiang, D.; Zhang, H.; Zhang, S. Selective extraction of lithium from spent lithium batteries by functional ionic liquid. ACS Sustain. Chem. Eng. 2012, 9, 7022–7029. [Google Scholar] [CrossRef]
- Xu, Z.-G.; Sun, S.-Y. Preparation of battery-grade lithium carbonate with lithium-containing desorption solution. Metals 2021, 11, 1490. [Google Scholar] [CrossRef]
- Cai, W.; Chen, R.; Yang, Y.; Yi, M.; Xiang, L. Removal of SO42− from Li2CO3 by recrystallization in Na2CO3 solution. Crystals 2018, 8, 19. [Google Scholar] [CrossRef]
- Mendieta-George, D.; Pérez-Garibay, R.; Solís-Rodríguez, R.; Rendón Angeles, J.C. Advantages of pH and Temperature Control in the Carbonation Stage for Li2CO3 Production with Sulphated Liquors. ChemistrySelect 2021, 6, 9517–9526. [Google Scholar] [CrossRef]
- Han, B.; Louhi-Kultanen, M. Lithium carbonate precipitation by homogeneous and heterogeneous reactive crystallization. Hydrometall 2020, 195, 105386. [Google Scholar] [CrossRef]
- King, H.E.; Salisbury, A.; Huijsmans, J.; Dzade, N.Y.; Plümper, O. Influence of inorganic solution components on lithium carbonate crystal growth. Cryst. Growth Des. 2019, 19, 6994–7006. [Google Scholar] [CrossRef]
- Yang, W.; Zhou, J.L.; Dai, I.; Zhou, L.; Zhang, M.; Xie, C.; Hao, H.; Hou, B.; Bao, Y.; Yin, Q. Crystallization of lithium carbonate from aqueous solution: New insights into crystal agglomeration. Ind. Eng. Chem. Res. 2019, 58, 18448–18455. [Google Scholar] [CrossRef]
- Wang, J.; Hu, H. Microbubble-assisted pressure carbonation for preparation of high purity lithium carbonate. J. Mater. Res. Technol. 2020, 9, 9498–9505. [Google Scholar] [CrossRef]
- Klapal, F.R. Precipitation of Lithium Carbonate in a Gas Bubble Column with Carbon Dioxide. Diplom-Ingenieur in the. Master’s Program, Chemistry and Chemical Technology; Master’s Thesis, Johannes Kepler University Linz, Linz, Austria, August 2022. [Google Scholar]
- Rigopoulos, S.; Jones, A. Modeling of semibatch agglomerative gas-liquid precipitation of CaCO3 in a bubble column reactor. Ind. Eng. Chem. Res. 2003, 42, 6567–6575. [Google Scholar] [CrossRef]
- Matsumoto, M.; Morita, Y.; Yoshinaga, M.; Hirose, S.; Onoe, K. Reactive crystallization of lithium carbonate nanoparticles by microwave irritation of aqueous solution containing CO2 microbubbles. J. Chem. Eng. Jpn. 2009, 42, s242–s248. [Google Scholar] [CrossRef]
- Sun, Y.; Song, X.; Wang, J.; Yu, J. Preparation of Li2CO3 by gas-liquid reactive crystallization of LiOH and CO2. Cryst. Res. Technol. 2012, 47, 437–442. [Google Scholar] [CrossRef]
- Sun, Y.Z.; Song, X.F.; Jin, M.M.; Jin, W.; Yu, J.G. Gas–liquid reactive crystallization of lithium carbonate by a falling film column. Ind. Eng. Chem. Res. 2013, 52, 17598–17606. [Google Scholar] [CrossRef]
- Tian, M.; Wang, Z.; Cao, J.; Guo, J.; Gong, X. Insight into lithium carbonate crystallization in the mild reaction system LiCl-NH3· H2O-CO2 by stabilizing the solution with NH3 H2O. J. Cryst. Growth 2019, 520, 46–55. [Google Scholar] [CrossRef]
- Zhou, Z.; Liang, F.; Qin, W.; Fei, W. Coupled reaction and solvent extraction process to form Li2CO3: Mechanism and product characterization. AIChE J. 2014, 60, 282–288. [Google Scholar] [CrossRef]
- Chen, P.C.; Liu, S.M.; Jang, C.J.; Hwang, R.C.; Yang, Y.L.; Lee, J.S.; Jang, J.S. Interpretation of gas-liquid reactive crystallization data using a size-independent agglomeration model. J. Crystal Growth 2003, 257, 333–343. [Google Scholar] [CrossRef]
- Schnebelen, M.; Mozet, K.; Jakob, A.; Sy, D.; Plasari, E.; Muhr, H. Agglomeration Mechanisms and Kinetics during the Carbonation of a Suspension of Lime in a Pilot Batch Reactor. Cryst. Struct. Theory Appl. 2015, 4, 35–46. [Google Scholar] [CrossRef]
- Pascual, G.K.; Donnellan, P.; Glennon, B.; Wood, B.; Jones, R.C. Design and optimization of the single-stage continuous mixed suspension−mixed product removal crystallization of 2-Chloro-N-(4-methylphenyl) propenamide. ACS Omega 2022, 7, 13676–13686. [Google Scholar] [CrossRef]
- Jiang, M.; Braatz, R.D. Designs of continuous-flow pharmaceutical crystallizers: Developments and practice. CrystEngComm 2019, 21, 3534. [Google Scholar] [CrossRef]
- Tavare, N.S.; Patwardhan, A.V. Agglomeration in a continuous MSMPR crystallizer. AIChE J. 1992, 38, 377–384. [Google Scholar] [CrossRef]
- Randolph, A.O.; Larson, M.A. Theory of Particulate Processes, 2nd ed.; Academic Press, Inc.: New York, NY, USA, 1988. [Google Scholar]
- Sohnel, O.; Garside, J. Precipitation: Basic Principles and Industrial Applications; Butterworth-Heinemann Ltd.: Oxford, UK, 1992. [Google Scholar]
- Butler, J.N. Carbon Dioxide Equilibria and Their Applications; Addison-Wesley Publishing Company: Boston, MA, USA, 1982. [Google Scholar]
- Chen, P.C.; Shi, W.; Du, R.; Chen, V. Crystallization kinetics of barium carbonate crystals in a lab-scale bubble-column scrubber. J. Taiwan Inst. Chem. Eng. 2014, 45, 2418–2426. [Google Scholar] [CrossRef]
- NancolLas, G.H. The crystal growth of sparingly soluble salts. Croat. Chem. Acta 1973, 45, 225–231. [Google Scholar]
- Nielsen, A.E.; Toft, J.M. Electrolyte crystal growth kinetics. J. Crystal Growth 1984, 67, 278–288. [Google Scholar] [CrossRef]
- Chen, P.C.; Chen, C.C.; Fun, M.H.; Liao, O.Y.; Jiang, J.J.; Wang, Y.S.; Chen, C.S. Mixing and crystallization kinetics in gas-liquid reactive crystallization. Chem. Eng. Technol. 2004, 27, 519–528. [Google Scholar] [CrossRef]
- Ibis, F.; Yu, T.W.; Penha, F.M.; Ganguly, D.; Nuhu, M.A.; van der Heijden, A.E.D.M.; Kramer, H.J.M.; Era, H.B. Nucleation kinetics of calcium oxalate monohydrate as a function of pH, magnesium, and osteopontin concentration quantified with droplet microfluidics. Biomicrofluidics 2021, 15, 064103. [Google Scholar] [CrossRef]
- Małysiak, A.; Walica, T.; Fronczyk, T.; Lemanowicz, M. Influence of hydrodynamic conditions on precipitation kinetics of barium sulfate in a multifunctional reactor. Processes 2022, 10, 146. [Google Scholar] [CrossRef]
- Synowiec, P.M.; Stec, M. Analysis of CaF2 Precipitation Process in the Selected Static Mixers. J. Chem. 2019, 2019, 6728492. [Google Scholar] [CrossRef]
- Tsuge, H.; Kotaki, Y.; Hilbino, S.I. Reactive crystallization of calcium carbonate by liquid-liquid reaction. J. Chem. Eng. Jpn. 1987, 20, 374–379. [Google Scholar] [CrossRef][Green Version]
- Saffman, P.G.; Turner, J.S. Turner, 1956: On the collision of drops in turbulent clouds. J. Fluid Mech. 1956, 1, 16–30. [Google Scholar] [CrossRef]
- Collier, A.P.; Hounslow, N.J. Growth and aggregation rates for calcite and calcium oxalate monohydrate. AIChE J. 1999, 45, 2298–2305. [Google Scholar] [CrossRef]
- Livk, I.; Ilievki, D. A macroscopic agglomeration kernel model for gibbsite precipitation in turbulent and laminar flows. Chem. Eng. Sci. 2007, 62, 3787–3797. [Google Scholar] [CrossRef]
- Ilievski, D.; White, E.T. Agglomeration during precipitation: Agglomeration mechanism indentification for Al(OH)3 crystals in stirred caustic aluminate solutions. Chem. Eng. Sci. 1994, 49, 3227–3239. [Google Scholar] [CrossRef]


Disclaimer/Publisher’s Note: The statements, opinions and data contained in all publications are solely those of the individual author(s) and contributor(s) and not of MDPI and/or the editor(s). MDPI and/or the editor(s) disclaim responsibility for any injury to people or property resulting from any ideas, methods, instructions or products referred to in the content. |
© 2024 by the authors. Licensee MDPI, Basel, Switzerland. This article is an open access article distributed under the terms and conditions of the Creative Commons Attribution (CC BY) license (https://creativecommons.org/licenses/by/4.0/).