Article

Numerical Simulation of Fracture Failure in Three-Point Bending Specimens of Yellow River Granular Ice

by
Yu Deng
1,2,3,4,
Ju Liang
1 and
Juan Wang
1,*
1
School of Water Conservancy and Transportation, Zhengzhou University, Zhengzhou 450001, China
2
Yellow River Institute of Hydraulic Research, Zhengzhou 450003, China
3
Research Center on Levee Safety Disaster Prevention, MWR, Zhengzhou 450003, China
4
Yellow River Laboratory, Zhengzhou 450001, China
*
Author to whom correspondence should be addressed.
Crystals 2024, 14(12), 1071; https://doi.org/10.3390/cryst14121071 (registering DOI)
Submission received: 5 November 2024 / Revised: 4 December 2024 / Accepted: 9 December 2024 / Published: 12 December 2024
(This article belongs to the Special Issue Synthesis, Characterization and Properties of Crystalline Materials)

Abstract

:
Currently, a comprehensive understanding of the macro- and micro-scale mechanisms of ice fracture failure in the Yellow River remains limited. Therefore, this paper adopts a microscopic perspective by modeling Yellow River granular ice as a three-phase composite comprising ice grains, grain boundaries, and initial defects. A numerical approach was proposed to simulate river ice fracture using a three-dimensional random defect solid element model, accompanied by the development of an elastic–brittle constitutive model for Yellow River granular ice. The fracture process of three-point bending samples of Yellow River granular ice was numerically simulated. The results indicated that the crack locations and failure progression in the simulations aligned well with observations from physical tests. Furthermore, the numerical analysis yielded values that aligned closely with those from the physical tests. The comparison with physical tests confirms that the proposed model effectively simulates the three-point bending fracture process of river ice. These findings provide valuable insights for the numerical simulation of fracture behavior in Yellow River granular ice.

1. Introduction

As a multiphase composite quasi-brittle material, the internal microstructure of river ice significantly influences its macroscopic mechanical properties. Specifically, the micro-cracks within river ice, which form and expand along grain boundaries due to dislocation and slip, ultimately result in macroscopic cracking. However, the inherent variability of river ice and the limitations of physical testing methods make it challenging to analyze its mechanical properties solely based on its mesoscopic structure. Therefore, mesoscopic numerical simulations are essential for elucidating the failure processes of river ice.
Extensive research has been conducted on the theory of ice breakage, encompassing topics such as ice crystal dislocation, boundary slip, thermal expansion, and ice anisotropy. While significant progress has been made in studying various types of ice, including lake ice, sea ice, and artificial ice, the internal structure of Yellow River ice remains particularly complex. This complexity arises from the specificity of its material composition, the diversity of its formation and evolution processes, and the randomness inherent in effective data collection. Consequently, research on its fine structure, physical and mechanical properties, and crack evolution remains in its nascent stages.
Yellow River ice, usually referred to as the phenomenon of ice in the Yellow River, is a natural phenomenon resulting from the formation and movement of river ice due to temperature fluctuations, primarily occurring during the winter river closure and spring river opening periods; it is predominantly found in the Ningmeng and Hetao sections in the upper reaches of the Yellow River and the Shandong section in its lower reaches. The flow of the Yellow River in these regions transitions from low to high latitudes, making it particularly prone to ice-related phenomena [1]. Unlike lake ice, mountain glacier ice, or other types of river ice, Yellow River ice forms under conditions of rapid water flow and high sediment content, which complicate and destabilize its formation. The loose soil structure of the Loess Plateau, low vegetation cover, erosion caused by the river’s rapid flow, unique geological features, and certain anthropogenic activities all contribute to the river’s high mud content, compared to other river ice [2]. Furthermore, the freezing environment of the Yellow River ice sheet affects key properties, including ice density, intra-ice mud content, bubble morphology, bubble content, and equivalent bubble diameter, which vary with different structural ice crystals [3].
With the advancement of computer technology, numerical simulation has become an effective tool for studying the physical and mechanical properties of ice. For example, Deng Yu et al. [4] utilized numerical simulations to investigate the uniaxial compression failure of ice in a two-dimensional context, providing valuable insights into the microscopic damage processes of river ice. Similarly, Juan Wang et al. [5] conducted numerical simulations of Yellow River ice using a Brazilian disc configuration, modeling its three-phase structure—grains, grain boundaries, and defects—within a two-dimensional framework. Han D et al. [6] explored the bending strength of ice using an improved smoothed particle hydrodynamics (SPH) method but treated ice as a homogeneous material, neglecting its microstructure. Xue Y et al. [7] applied the PeriDynamics principle to ice materials and conducted numerical simulations of three-point bending deformation and ice crack expansion. However, the introduction of artificial damping in the algorithm altered the equations of motion, limiting the model’s ability to accurately describe the system’s actual motion.
Zhai [8] coupled the discrete element method with two-dimensional hydrodynamics to establish a numerical model of river ice dynamics and characterized the interactions between ice blocks in the processes of river ice transport and ice dam formation through a discrete element contact model in order to provide a new understanding of the river ice dynamics process from a fine-scale perspective. Jun Wang [9] analyzed the stability of ice at the leading edge of the ice cap, sorted out the literature on ice diving at home and abroad, and discussed the existing research deficiencies and future research directions. Wang [10] summarized the mechanical properties of freshwater ice in China, including compressive strength, shear strength, and bending strength, as well as some factors affecting the strength. Qi [11] found that there is an obvious dependence between the stress and grain size at a temperature of 263 K and a pressure of 10 MPa or 20 MPa in a test.
Gribanov [12,13] utilized the cohesive zone model to simulate ice compression failure, treating ice as a two-phase material composed of grains and grain boundaries. Although the study excluded grain damage, it identified variation rules for grain strength consistent with experimental results. Lu [14] conducted fracture simulations of ice sheets using commonly employed numerical methods, concluding that the element deletion method was efficient, the cohesive element method was suitable for simple models, and the extended finite element method (XFEM) remained in its developmental stage, with numerous challenges yet to be addressed.
In summary, existing mesoscopic numerical models of river ice have yielded significant results. However, further advancements are needed to analyze how the structure of river ice affects its mechanical properties, particularly through microscopic analysis. In this study, natural granular ice was collected from the Inner Mongolia section of the Yellow River during the river closure period and used as the research object. A three-dimensional mesoscale fracture model of Yellow River ice was developed, and its fracture failure process was analyzed using three-point bending samples. A notable feature of this method is its ability to control the size of ice grains and grain boundaries, as well as the content and location of initial defects. By addressing challenges associated with the physical testing of river ice, which are influenced by factors such as its temporal existence and environmental conditions, the research results will improve the theoretical understanding of the physical and mechanical properties of Yellow River granular ice. Additionally, the results will provide a scientific basis for predicting the fracture and failure of ice sheets during the Yellow River opening period.

2. Numerical Modeling of River Ice

This paper focuses on the common granular ice observed during the ice flood season of the Yellow River. Using Abaqus software (2021), a microscopic structural model of Yellow River granular ice was developed. A numerical simulation analysis was then conducted on the ice samples under three-point bending loading conditions. Yellow River granular ice was modeled as a three-phase composite material comprising ice grains, ice boundaries, and initial defects, with the latter including air bubbles, sediment, and impurities. The numerical simulation of river ice involved three main components: the establishment of the mesoscopic structure of the river ice, the determination of its constitutive relationship and failure criteria, and the selection of mesoscopic material parameters.

2.1. Generation of Ice Grains

Ice grains were generated using Voronoi polygons, which are characterized by their randomness and disorder. All polygons created through this method are convex, mirroring the actual structure of ice grains. This method effectively simulated the random distribution of crystals in granular ice found within the Yellow River. Based on the observational results of granular ice in the Yellow River reported by Wang J [15], a distribution map of granular ice grain content was obtained (Figure 1). The size and distribution of ice grains generated by the Voronoi polygons were determined according to this ratio (Figure 2), with different colors representing various sizes of ice grains.

2.2. Generation of Grain Boundaries and Initial Defects

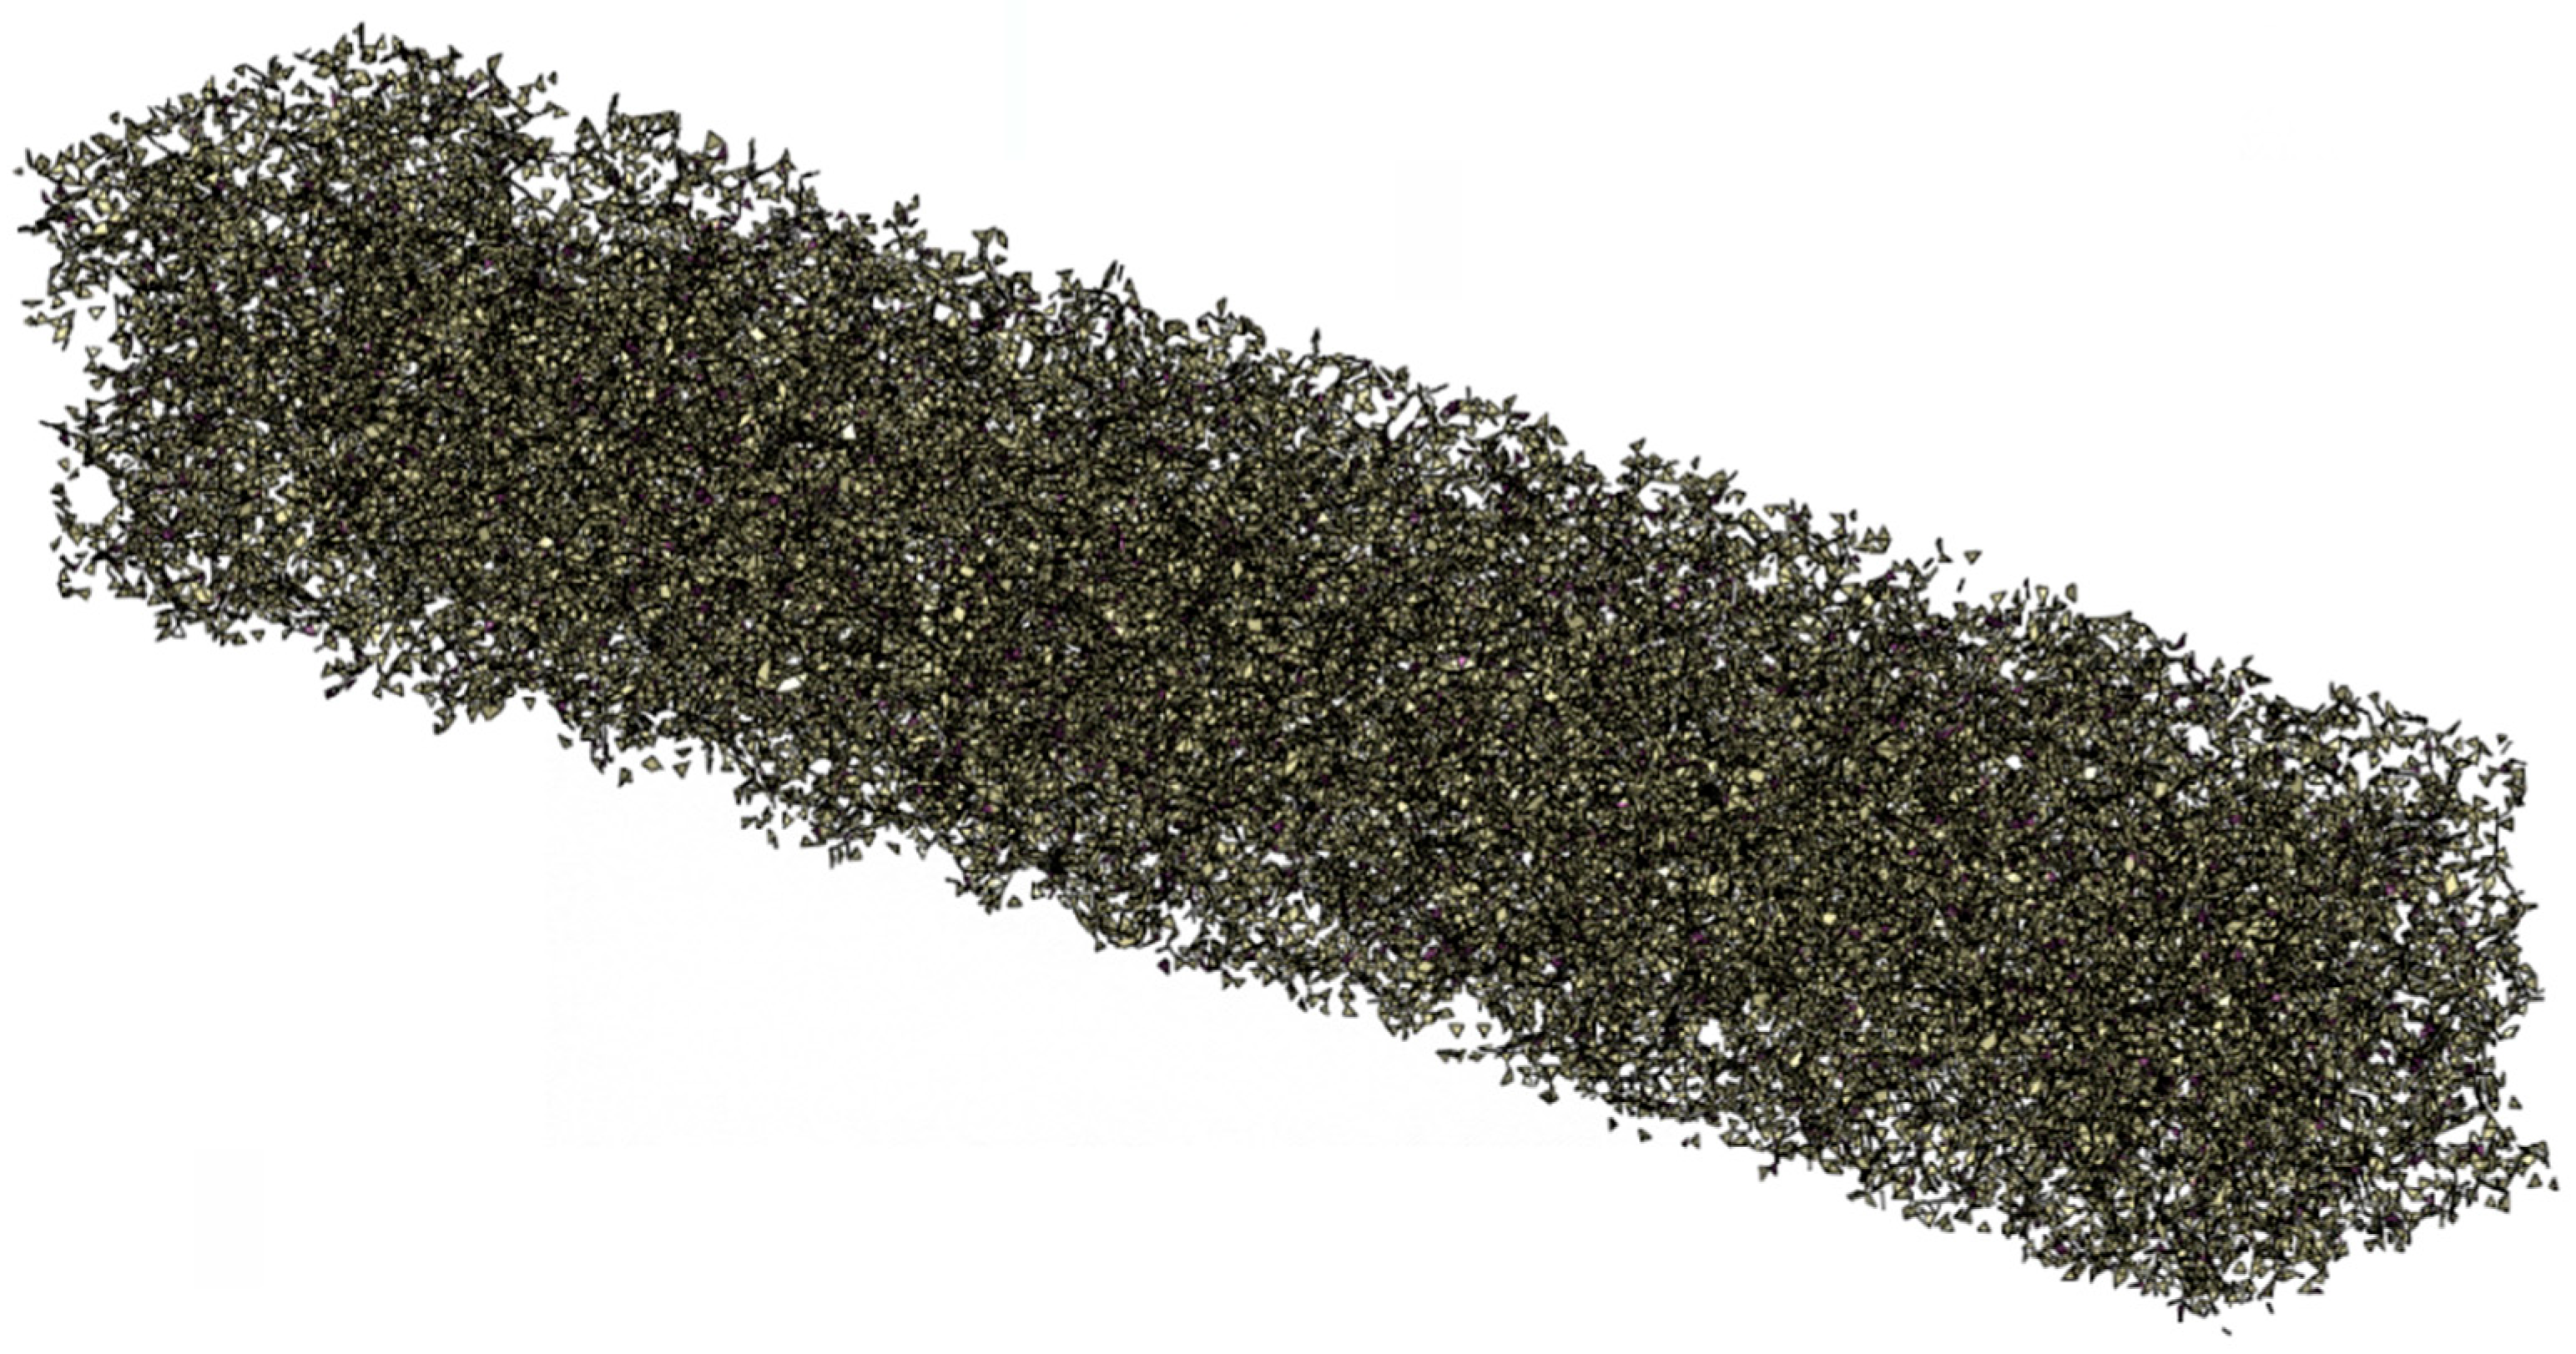
The slip of grain boundaries influences the accumulation of dislocations within ice grains, thereby affecting the mechanical properties of river ice. Therefore, the presence of grain boundaries must be considered. In polycrystalline ice, defects such as bubbles, sediment, and other impurities located along grain boundaries act as pathways for crack propagation. In this model, initial defects are assumed to be randomly distributed along the grain boundaries. Zhang Y et al. [3] studied the microstructure of river ice in the Inner Mongolia section of the Yellow River and reported that air bubble content ranged from 0.5% to 14.0%, while mud content varied from 0.001 to 0.243 kg/m3. A quantitative grain boundary unit was randomly selected as a defective unit, with each unit containing a single initial defect. These units were then assigned the attributes of their respective defects, and the initial defects were generated, as illustrated in Figure 3.

2.3. Determination of Constitutive Relationships and Damage Criteria

As a natural composite material, the mechanical properties of Yellow River ice are highly complex, shaped by its microstructure and inherent material properties, which collectively determine its fracture behavior. Numerous studies [16,17,18,19,20] investigating the mechanical properties of ice have noted its significant brittleness under high strain rates. In developing the mesoscopic numerical model for Yellow River ice, the material is considered a composite comprising ice crystals, grain boundaries, and initial defects. Each mesoscopic component is modeled as a linear elastic material. Both ice grains and grain boundaries are assumed to follow an elastic–brittle constitutive equation, as presented in Formula (1).
Among the various failure criteria, the maximum tensile stress criterion is particularly well-suited for brittle materials. Therefore, this criterion was adopted for evaluating the failure of grains and grain boundaries in our model. The failure criterion, outlined in Formula (2), states that when the maximum principal stress of an element reaches the material’s tensile strength, the elements is considered to have failed. Once failure occurs, the element loses its load-bearing capacity, simulating the formation of cracks.
σ = E ε ,
σ 1 σ t ,
where σ is the stress of the unit; E is the modulus of elasticity of the material; ε is the strain of the unit; σ 1 is the tensile strength of the material; and σ t is the first principal stress of the material.

2.4. Selection of Mesoscopic Parameters

In the computational model for river ice, two main categories of parameters must be established: microstructure parameters and micro-material parameters. The microstructure parameters primarily include the size and distribution of ice grains, the configuration of grain boundaries, and the determination of initial defects, as discussed earlier. The micro-material parameters, however, mainly encompass properties such as grain anisotropy, the elastic modulus of ice grains, fracture strength, and the mechanical properties of ice grain boundaries, among other relevant factors. The following section will focus on the selection of these meso-material parameters.

2.4.1. Selection of the Elastic Modulus of Ice Grains

Compared to macroscopic mechanical parameters, obtaining microscopic mechanical parameters for river ice is significantly more challenging. In the study by Yu [21], based on the in situ cantilever beam test adopted in the small ice pool of China Shipbuilding Science Research Centre, the elastic modulus of model ice was investigated, and the elastic modulus of model ice was obtained by fitting the deflection curve of the ice beam using the least-squares method. Gammon [22] employed Brillouin spectroscopy to measure an elastic modulus of 9.33 GPa for single-crystal ice at −16 °C. Derradji [23], in ice simulations, noted that the instantaneous elastic behavior of polycrystalline ice reflects the average elastic behavior of a single ice crystal and adopted an elastic modulus of 9.61 GPa for single-crystal ice. Sinha [24] reported that the elastic modulus of ice increased from 8.93 to 9.39 GPa as the temperature decreased from 0 °C to −38 °C. Schulson [25], analyzing brittle damage in ice, assumed an elastic modulus of 10 GPa. Kolari [26], investigating the effects of temperature-dependent dynamic friction and grain diameter on compressive strength using a novel three-dimensional wing crack model, considered the elastic modulus of ice to be 9 GPa. In summary, most researchers agree that the elastic modulus of river ice grains lies within the range of 9 to 10 GPa.

2.4.2. Selection of Tensile Strength of Ice Crystals

The failure mode of ice is closely related to its tensile strength. As a brittle material, ice exhibits a tensile strength lower than its compressive strength. Schulson [27] measured the tensile strength of single-crystal ice and found it to be typically between 1 and 2 MPa near 0 °C. Observations indicate that the tensile strength of ice grains decreases as grain size increases. Petrovic [28] prepared single-crystal ice samples to test their mechanical properties, reporting a tensile strength range of 0.1–1 MPa. Weiss [29] noted that the tensile strength of single-crystal ice generally fell between 1 and 5 MPa under various conditions. Currier [30] noted that the tensile strength of ice ranged from 0.7 to 3.1 MPa within a temperature range of −10 °C to −20 °C. Chen [31] investigated the dynamic tensile strength of ice under impact loading for 1 h using molecular dynamics simulations, observing a similar anomalous temperature effect on the dynamic tensile strength. Yu and Yang [32,33] conducted a continued analysis of the tensile strength of sea ice and freshwater ice separately, utilizing the Brazilian disc method.

2.4.3. Strength of Grain Boundaries

The ice boundary plays a crucial role in determining the physical properties of ice; however, studying it remains challenging, due to its microscopic scale and the limitations of current experimental techniques. Ice boundaries are often considered one of the initiation points for brittle fractures. The atomic arrangement at grain boundaries is typically more irregular, making these regions weak spots for crack initiation and propagation. Under stress, cracks frequently form at grain boundaries and spread along them, ultimately leading to material fracture.
Elvin [34] investigated the sliding mechanism of grain boundaries, simplifying the forces acting on them due to the difficulty in obtaining material parameters for the grain boundary region. It was assumed that grain boundaries have zero thickness and do not transmit shear stress. Cole [35] highlighted the significance of grain boundaries in polycrystalline ice, identifying them as sources of dislocation slip and stress concentrations that can lead to crack nucleation. At low temperatures, grain boundaries in ice may serve as the primary channels for slip deformation, whereas at higher temperatures, grain boundary slip and grain rearrangement dominate the deformation process. The behavior of the grain interface directly influences the creep and fracture characteristics of ice.
Caswell [36] conducted creep tests on polycrystalline ice and analyzed the viscosity of grain boundaries. Although no consensus exists regarding the determination of material properties for grain boundaries, it is generally accepted that their strength is lower than that of the grains themselves. Therefore, simulations often assume that the strength of grain boundaries ranges from 20–50% of the strength of the grains.
In summary, the primary calculation parameters for analyzing the three-point bending fracture process of Yellow River granular ice are presented in Table 1.
Based on the determined physical structure and calculation parameters of Yellow River granular ice, Figure 4 illustrates the overall model and the mesh generation for the three-point bending specimen.

3. Analysis of Numerical Simulation Results

3.1. Analysis of the Fracture Failure Process

Figure 5 shows the damage diagram of a simulated three-point bending fracture of granular ice from the Yellow River. During the initial loading stage, stress concentrations occurred at the prefabricated cracks. As the load was continuously applied, the elements at the crack tips reached their failure conditions, initiating crack aggregation, nucleation, and subsequent upward propagation. Simultaneously, relative displacement occurred at the supports. With the increasing load, the cracks progressively advanced along the pre-existing defects, with the primary failure units located at the grain boundaries. Ultimately, the cracks coalesced to form a main crack parallel to the loading direction, as depicted in Figure 6. Notably, the failure patterns observed in the simulation aligned closely with typical results from physical three-point bending tests on granular ice from the Yellow River, as shown in Figure 7.

3.2. Comparative Analysis of Test Results

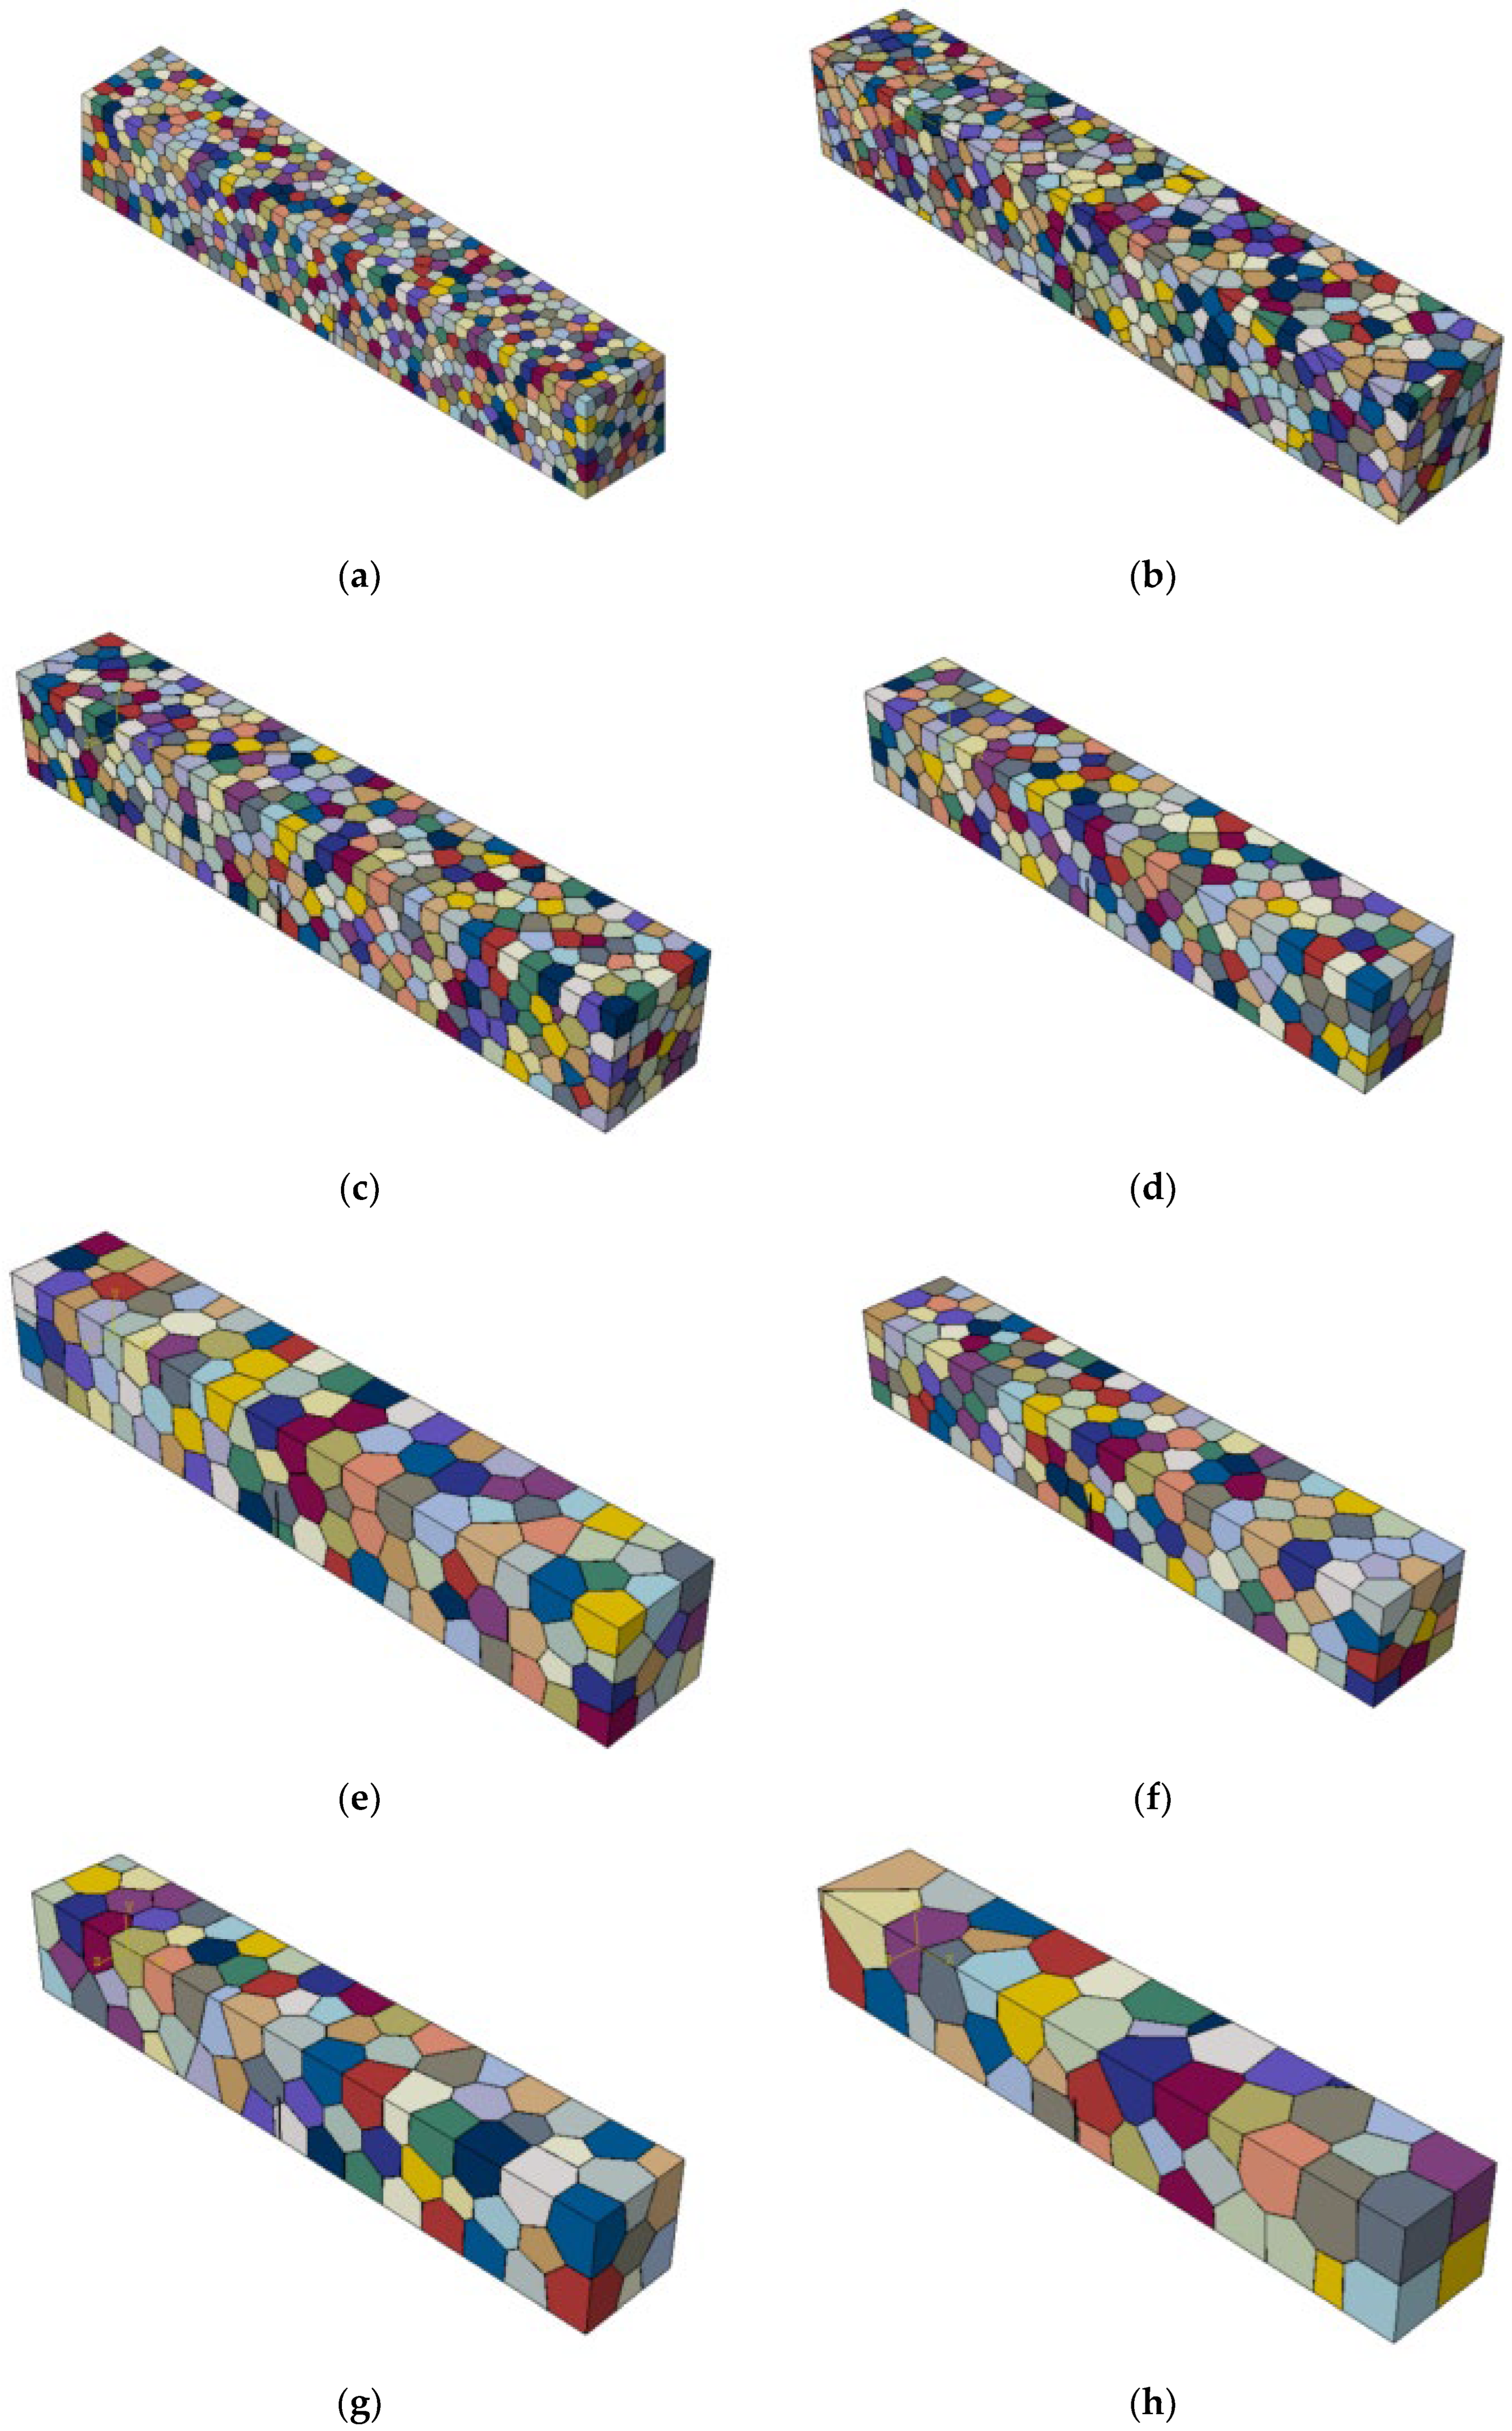
To verify the reliability of the model, the ASTM (1820-24) [37] fracture toughness formula was applied to calculate the peak fracture load of Yellow River granular ice, enabling the determination of the simulated fracture toughness value. This simulation met the conditions of the specification. To investigate the influence of varying grain sizes on the fracture toughness of this ice, models with average grain sizes ranging from 5 mm to 18 mm were considered. Figure 8 displays representative grain size distributions for average grain sizes of 5 mm, 6 mm, 8 mm, 10 mm, 12 mm, 13 mm, 16 mm, and 18 mm. Assuming a relatively uniform grain size distribution within the mesoscopic structure of the river ice, these models were analyzed and compared with experimental results [38].
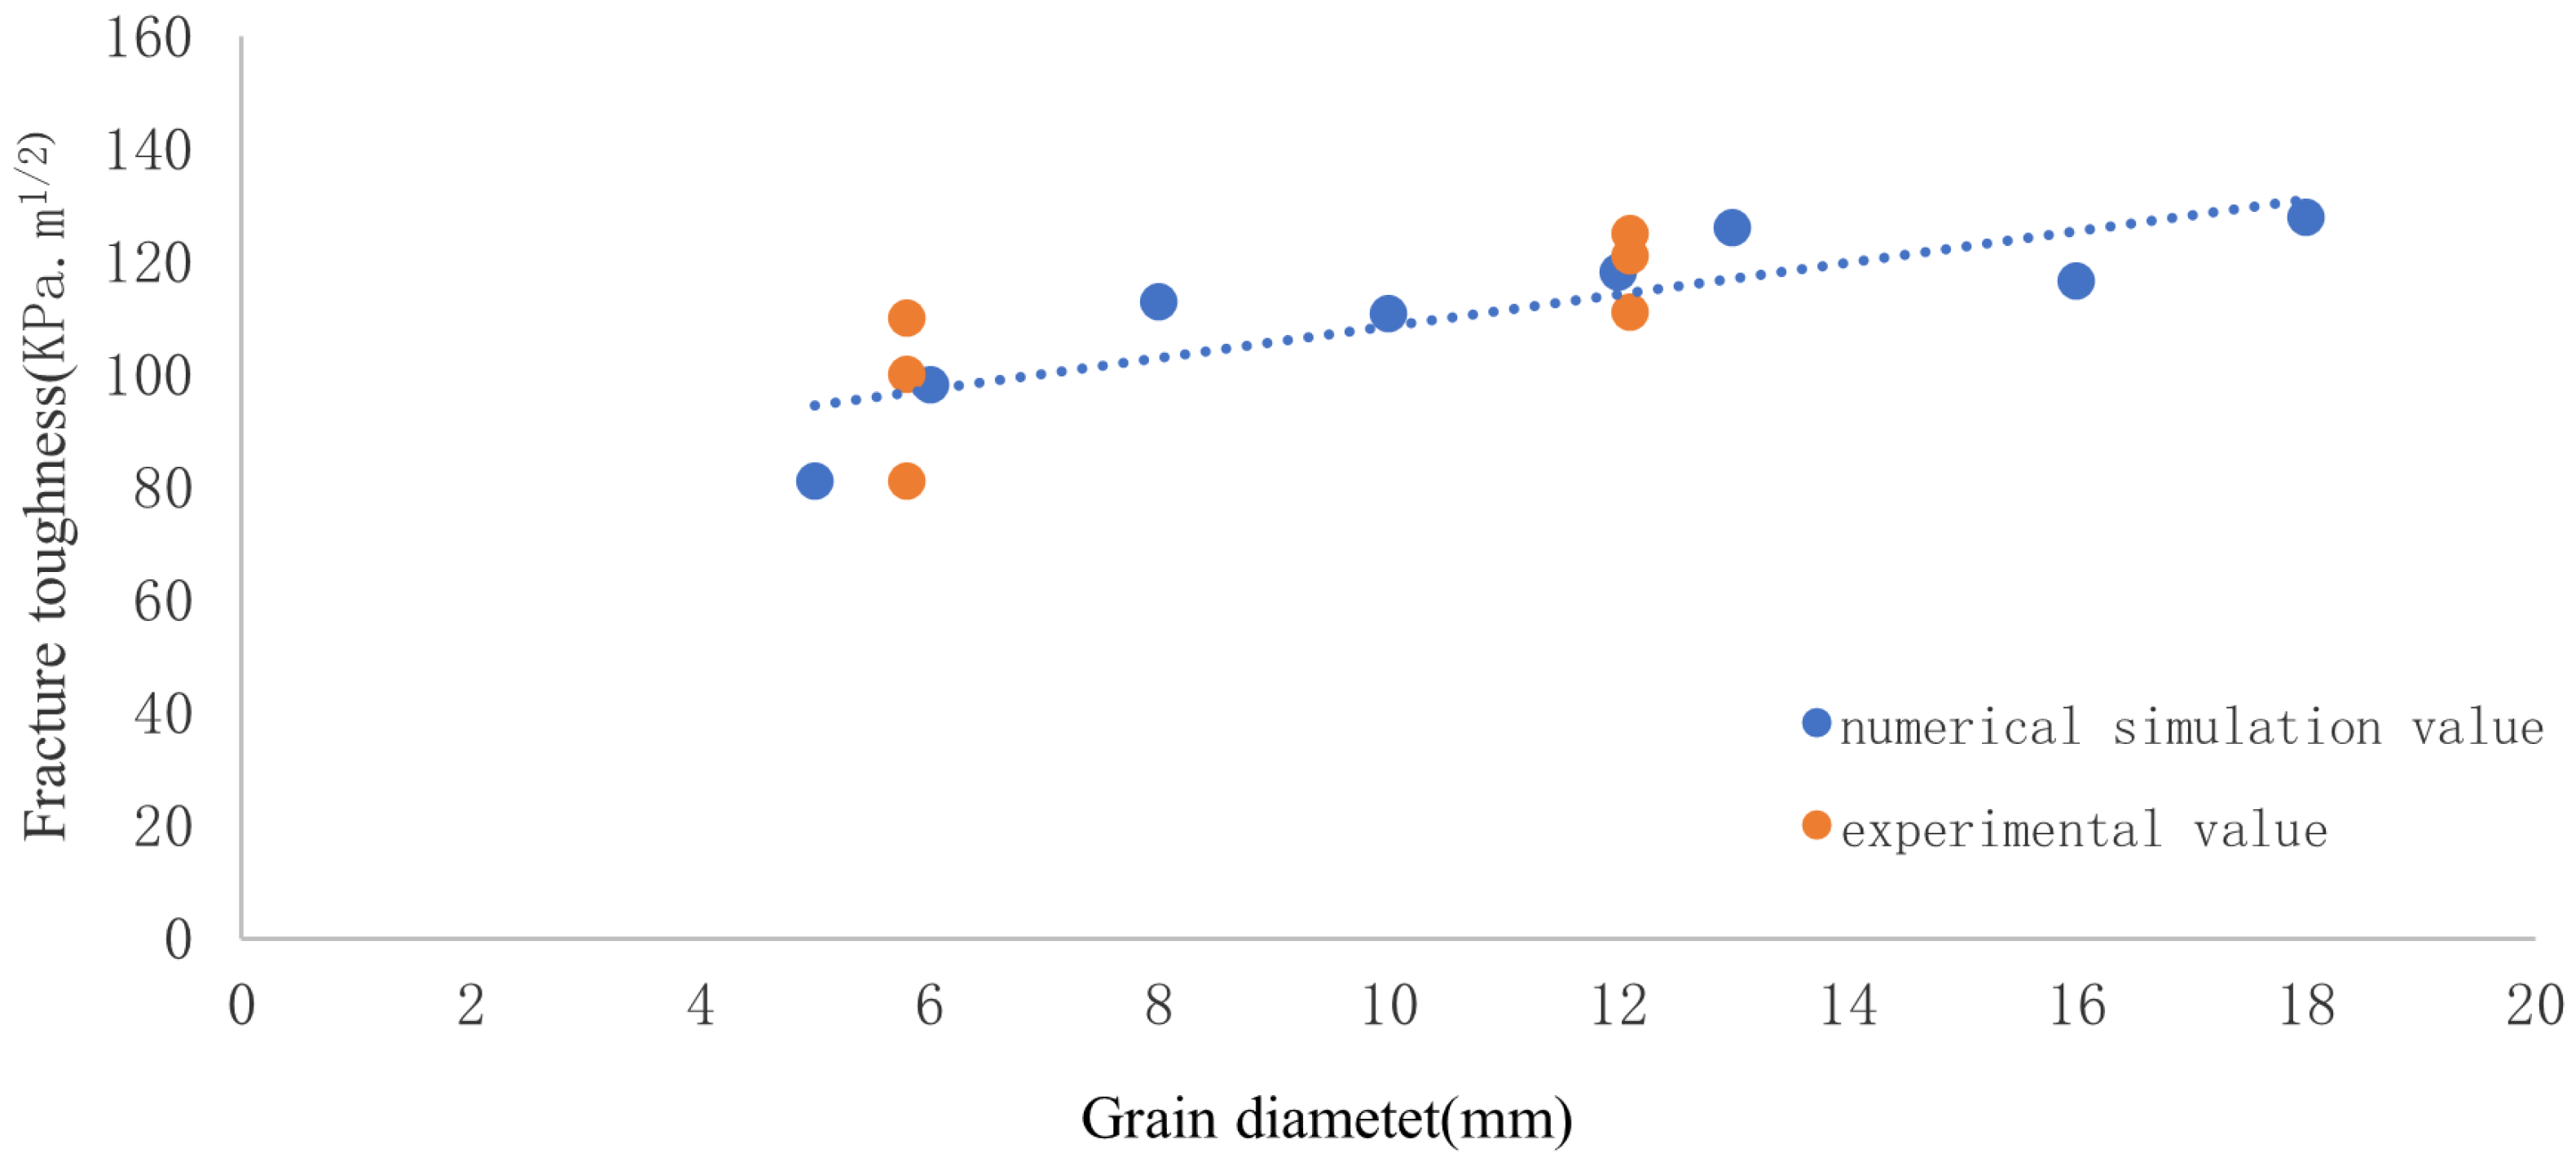
The compiled results are presented in Figure 9. The simulated fracture toughness values ranged from 81.1 to 127.8 KPa·m1/2. Notably, the simulated fracture toughness for river ice with varying ice crystal sizes showed strong agreement with the experimental values, with an average error of approximately 5% between the two datasets. Furthermore, as the average ice crystal size increased, the simulated fracture toughness values exhibited a gradual upward trend.

4. Discussion

In this simulation analysis, we defined the material properties of ice and the damage failure processes, subsequently validating the model through three-point bending tests. The simulation outcomes demonstrated a strong concordance between the model’s crack initiation site and crack propagation trajectory with those observed in physical experiments. The output data revealed a typical load–displacement relationship characteristic of brittle material fracture, wherein the load and displacement within the elastic phase increased linearly, followed by a rapid decline in bearing capacity upon reaching the damage threshold. Within the scope of this simulation, the maximum force escalated from 123.8 N to 194.84 N, although this increase was somewhat modest due to the specific configuration of initial defects. Furthermore, the intricacies of grain boundary settings and grain structures in this simulation posed challenges in mesh delineation and resulted in slower computational speeds. It is anticipated that future advancements in grain boundary setting methodologies will further refine this model.

5. Conclusions

(1) This study developed a three-dimensional mesoscopic numerical model of Yellow River granular ice using Abaqus software. The failure process of the granular ice was simulated using a three-point bending loading method. The model effectively incorporated the unique characteristics of Yellow River granular ice by modeling it as a composite of ice grains, ice grain boundaries, and initial defects; it allowed precise control over grain size and content, the dimensions of ice crystal boundaries, and the distribution and location of random defects.
(2) A comprehensive analysis of the established model revealed that its fracture process aligned closely with experimental observations. The fracture processes of models with varying grain sizes and the progression of crack development were consistent with experimental findings, and the bending fracture exhibited a classic wing-shaped crack pattern.
(3) Analysis of the simulation results revealed that, under three-point bending, the average discrepancy between the simulated fracture toughness and experimental values was approximately 5%. In the range of simulated calculated values for ice crystal sizes from 5 mm to 18 mm, the simulated fracture toughness values were primarily concentrated around 100 kPa·m1/2. Within this size range, the fracture toughness of river ice gradually increased with the enlargement of grain size.
(4) This study focused on the simulation and analysis of the three-point bending fracture process of Yellow River granular ice. Future research should expand to model different types of river ice under varying conditions and investigate the impact of diverse factors on simulation outcomes.

Author Contributions

Conceptualization, Y.D. and J.W.; methodology, J.L.; software, J.L.; data curation, J.L.; writing—original draft preparation, Y.D. and J.L.; writing—review and editing, J.W. All authors have read and agreed to the published version of the manuscript.

Funding

This research was supported by the National Natural Science Foundation of China (Grant Nos. U23A2012) and the Special Funds for Basic Scientific Research of the Yellow River Institute of Hydraulic Research (HKY-JBYW-2022-08 and HKY-JBYW-2023-05).

Data Availability Statement

The original contributions presented in this study are included in the article. Further inquiries can be directed to the corresponding author(s).

Conflicts of Interest

The authors declare no conflicts of interest.

References

  1. Wang, D.W.; Zhang, F.H. Characteristics and causes of ice flood in Ningxia-inner Mongolia section of the yellow river valley. Meteorol. Mon. 2006, 32, 32–38. [Google Scholar]
  2. Li, Z.; Yang, L.; Wang, G. The management of soil and water conservation in the loess plateau of China: Present situations, problems, and counter-solutions. Acta Ecol. Sin. 2019, 39, 7398–7409. [Google Scholar]
  3. Zhang, Y.L. Microstructure characteristics of river ice in Inner Mongolia section of the yellow river and its influencing factors. J. Hydraul. Eng. 2021, 52, 1418–1429. [Google Scholar]
  4. Deng, Y.; Wang, J.; Li, Z. Numerical simulation of uniaxial compression failure process of river ice. J. Hydraul. Eng. 2018, 49, 1339–1345. [Google Scholar]
  5. Juan, W.; Zhou, J.; Yu, D.; Vadim, G.; Peng, Z. Numerical simulation of ice fractures process of the yellow river based on disk specimen. Crystals 2020, 10, 598. [Google Scholar] [CrossRef]
  6. Han, D. Numerical simulation of ice bending strength test based on improved SPH method. Huazhong Univ. Sci. Technol. (Nat. Sci. Ed.) 2018, 46, 54–58. [Google Scholar]
  7. Xue, Y.L. Simulation of three-point bending test of ice based on peridynamic. Harbin Eng. Univ. 2018, 39, 607–613. [Google Scholar]
  8. Zhai, B.Y.; Liu, L.; Zhang, B.S. A river ice dynamic model based on coupling of discrete element method and hydrodynamics. J. Hydraul. Eng. ASCE 2020, 51, 617–630. [Google Scholar]
  9. Jun, W.; Sang, L.S.; Song, F.H.; Cheng, T.J. Research progress on the ice blocks stability in front of ice cover. J. Hydraul. Eng. ASCE 2023, 24, 1277–1286. [Google Scholar]
  10. Wang, E.L.; Xu, C.G. Research progress on mechanical properties of freshwater ice in China. Hydro Sci. Cold Zone Eng. 2019, 2, 37–43. [Google Scholar]
  11. Qi, C.; Goldsby, D.L. An experimental investigation of the effect of grain size on “dislocation creep” of ice. J. Geophys. Res. Solid Earth 2021, 126, e2021JB021824. [Google Scholar] [CrossRef]
  12. Gribanov, I.; Taylor, R.; Sarracino, R. Parallel implementation of implicit finite element model with cohesive zones and collision response using cuda. Numer. Methods Eng. 2018, 115, 771–790. [Google Scholar] [CrossRef]
  13. Gribanov, I.; Taylor, R.; Sarracino, R. Cohesive zone micromechanical model for compressive and tensile failure of polycrystalline ice. Eng. Fract. Mech. 2018, 196, 142–156. [Google Scholar] [CrossRef]
  14. Lu, W.; Lubbad, R.; Lset, S.; Hyland, K. Cohesive zone method based simulations of ice wedge bending: A comparative study of element erosion, cem, dem and xfem. In Proceedings of the 21st IAHR International Symposium on Ice, Dalian, China, 11 June 2012. [Google Scholar]
  15. Wang, J.H. Analysis of ice crystal structure characteristics of the yellow river in Inner Mongolia during freezing period. Yellow River 2021, 43, 41–45. [Google Scholar]
  16. Chen, W.T.; Zhang, P.; Chen, X.P. Study on influence of unfrozen water on mechanical properties of ice crystals by molecular dynamics simulations. J. Glaciol. Geocryol. 2023, 45, 624–640. [Google Scholar]
  17. Duval, P. Creep and fabrics of polycrystalline ice under shear and compression. J. Glaciol. 1981, 27, 129–140. [Google Scholar] [CrossRef]
  18. Xu, P.; Li, L.H. Experimental study on uniaxial compressive strength characteristics of conventional model ice in tank. Chin. J. Ship Res. 2024, 19, 1–17. [Google Scholar]
  19. Jones, S.J. High strain-rate compression tests on ice. J. Phys. Chem. B 1997, 101, 6099–6101. [Google Scholar] [CrossRef]
  20. Schulson, E.M. Brittle failure of ice. Eng. Fract. Mech. 2001, 68, 1839–1887. [Google Scholar] [CrossRef]
  21. Yu, C.G.; Tian, Y.K. Experimental investigation on elastic modulus of model ice with cantilever beam method. J. Ship Mech. 2021, 25, 1066–1072. [Google Scholar]
  22. Gammon, P.H.; Kiefte, H.; Clouter, M.J. Elastic constants of ice samples by brillouin spectroscopy. J. Phys. Chem. 1983, 87, 4025–4029. [Google Scholar] [CrossRef]
  23. Derradji, A.; Sinha, N.K.; Evgin, E. Mathematical modelling of monotonic and cyclic behaviour of fresh water columnar grained s-2 ice. Cold Reg. Sci. Technol. 2000, 31, 59–81. [Google Scholar] [CrossRef]
  24. Sinha, N.K. Elasticity of natural types of polycrystalline ice. Cold Reg. Sci. Technol. 1989, 17, 127–135. [Google Scholar] [CrossRef]
  25. Schulson, E.M.; Lim, P.N.; Lee, R. A brittle to ductile transition in ice under tension. Philos. Mag. 1984, 49, 353–363. [Google Scholar] [CrossRef]
  26. Kolari, K. Simulation of the temperature and grain size dependent uniaxial compressive strength using 3d wing crack model. In Proceedings of the 23rd International Conference on Port and Ocean Engineering under Arctic Conditions, POAC ’15, Trondheim, Norway, 14–18 June 2015. [Google Scholar]
  27. Schulson, E.M.; Duval, P. Creep and Fracture of Ice; Cambridge University Press: Cambridge, UK, 2019. [Google Scholar]
  28. Petrovic, J.J. Review mechanical properties of ice and snow. J. Mater. Sci. 2003, 38, 1–6. [Google Scholar] [CrossRef]
  29. Weiss, J.; Schulson, E.M. The failure of fresh-water granular ice under multiaxial compressive loading. Acta Metall. Mater. 1995, 43, 2303–2315. [Google Scholar] [CrossRef]
  30. Currier, J.H.; Schulson, E.M.; Lawrence, W.F. A study on the tensile strength of ice as a function of grain size. Acta Metall. 1982, 30, 1511–1514. [Google Scholar] [CrossRef]
  31. Chen, Y.Y.; Xiao, K.L. Atomistic study on the anomalous temperature-dependent dynamic tensile strength of ice under shock loading. Philos. Mag. 2021, 101, 1289–1304. [Google Scholar] [CrossRef]
  32. Yu, C.G.; Tian, Y.K.; Gang, X.H. Investigation on the tensile strength of model ice based on brazilian disc splitting test. J. Ship Mech. 2020, 24, 1158–1166. [Google Scholar]
  33. Yang, F.C.; Tang, M.G.; Zhao, H.L. Research on tensile strength and influencing factors of debris ice based on Brazil split test. J. Eng. Geol. 2024, 32, 1546–1554. [Google Scholar]
  34. Elvin, A.A.; Sunder, S.S. Microcracking due to grain boundary sliding in polycrystalline ice under uniaxial compression. Acta Mater. 1996, 44, 43–56. [Google Scholar] [CrossRef]
  35. Cole, D.M. The microstructure of ice and its influence on mechanical properties. Eng. Fract. Mech. 2001, 68, 1797–1822. [Google Scholar] [CrossRef]
  36. Caswell, T.E.; Cooper, R.F.; Goldsby, D.L. The constant-hardness creep compliance of polycrystalline ice. Geophys. Res. Lett. 2015, 42, 6261–6268. [Google Scholar] [CrossRef]
  37. ASTM E1820-24; Standard Test Method for Measurement of Fracture Toughness. ASTM International: West Conshohocken, PA, USA, 2024.
  38. Dempsey, J.P.; Wei, Y.; Defranco, S.J. Notch sensitivity and brittleness in fracture testing of s2 columnar freshwater ice. Int. J. Fract. 1992, 53, 101–120. [Google Scholar] [CrossRef]
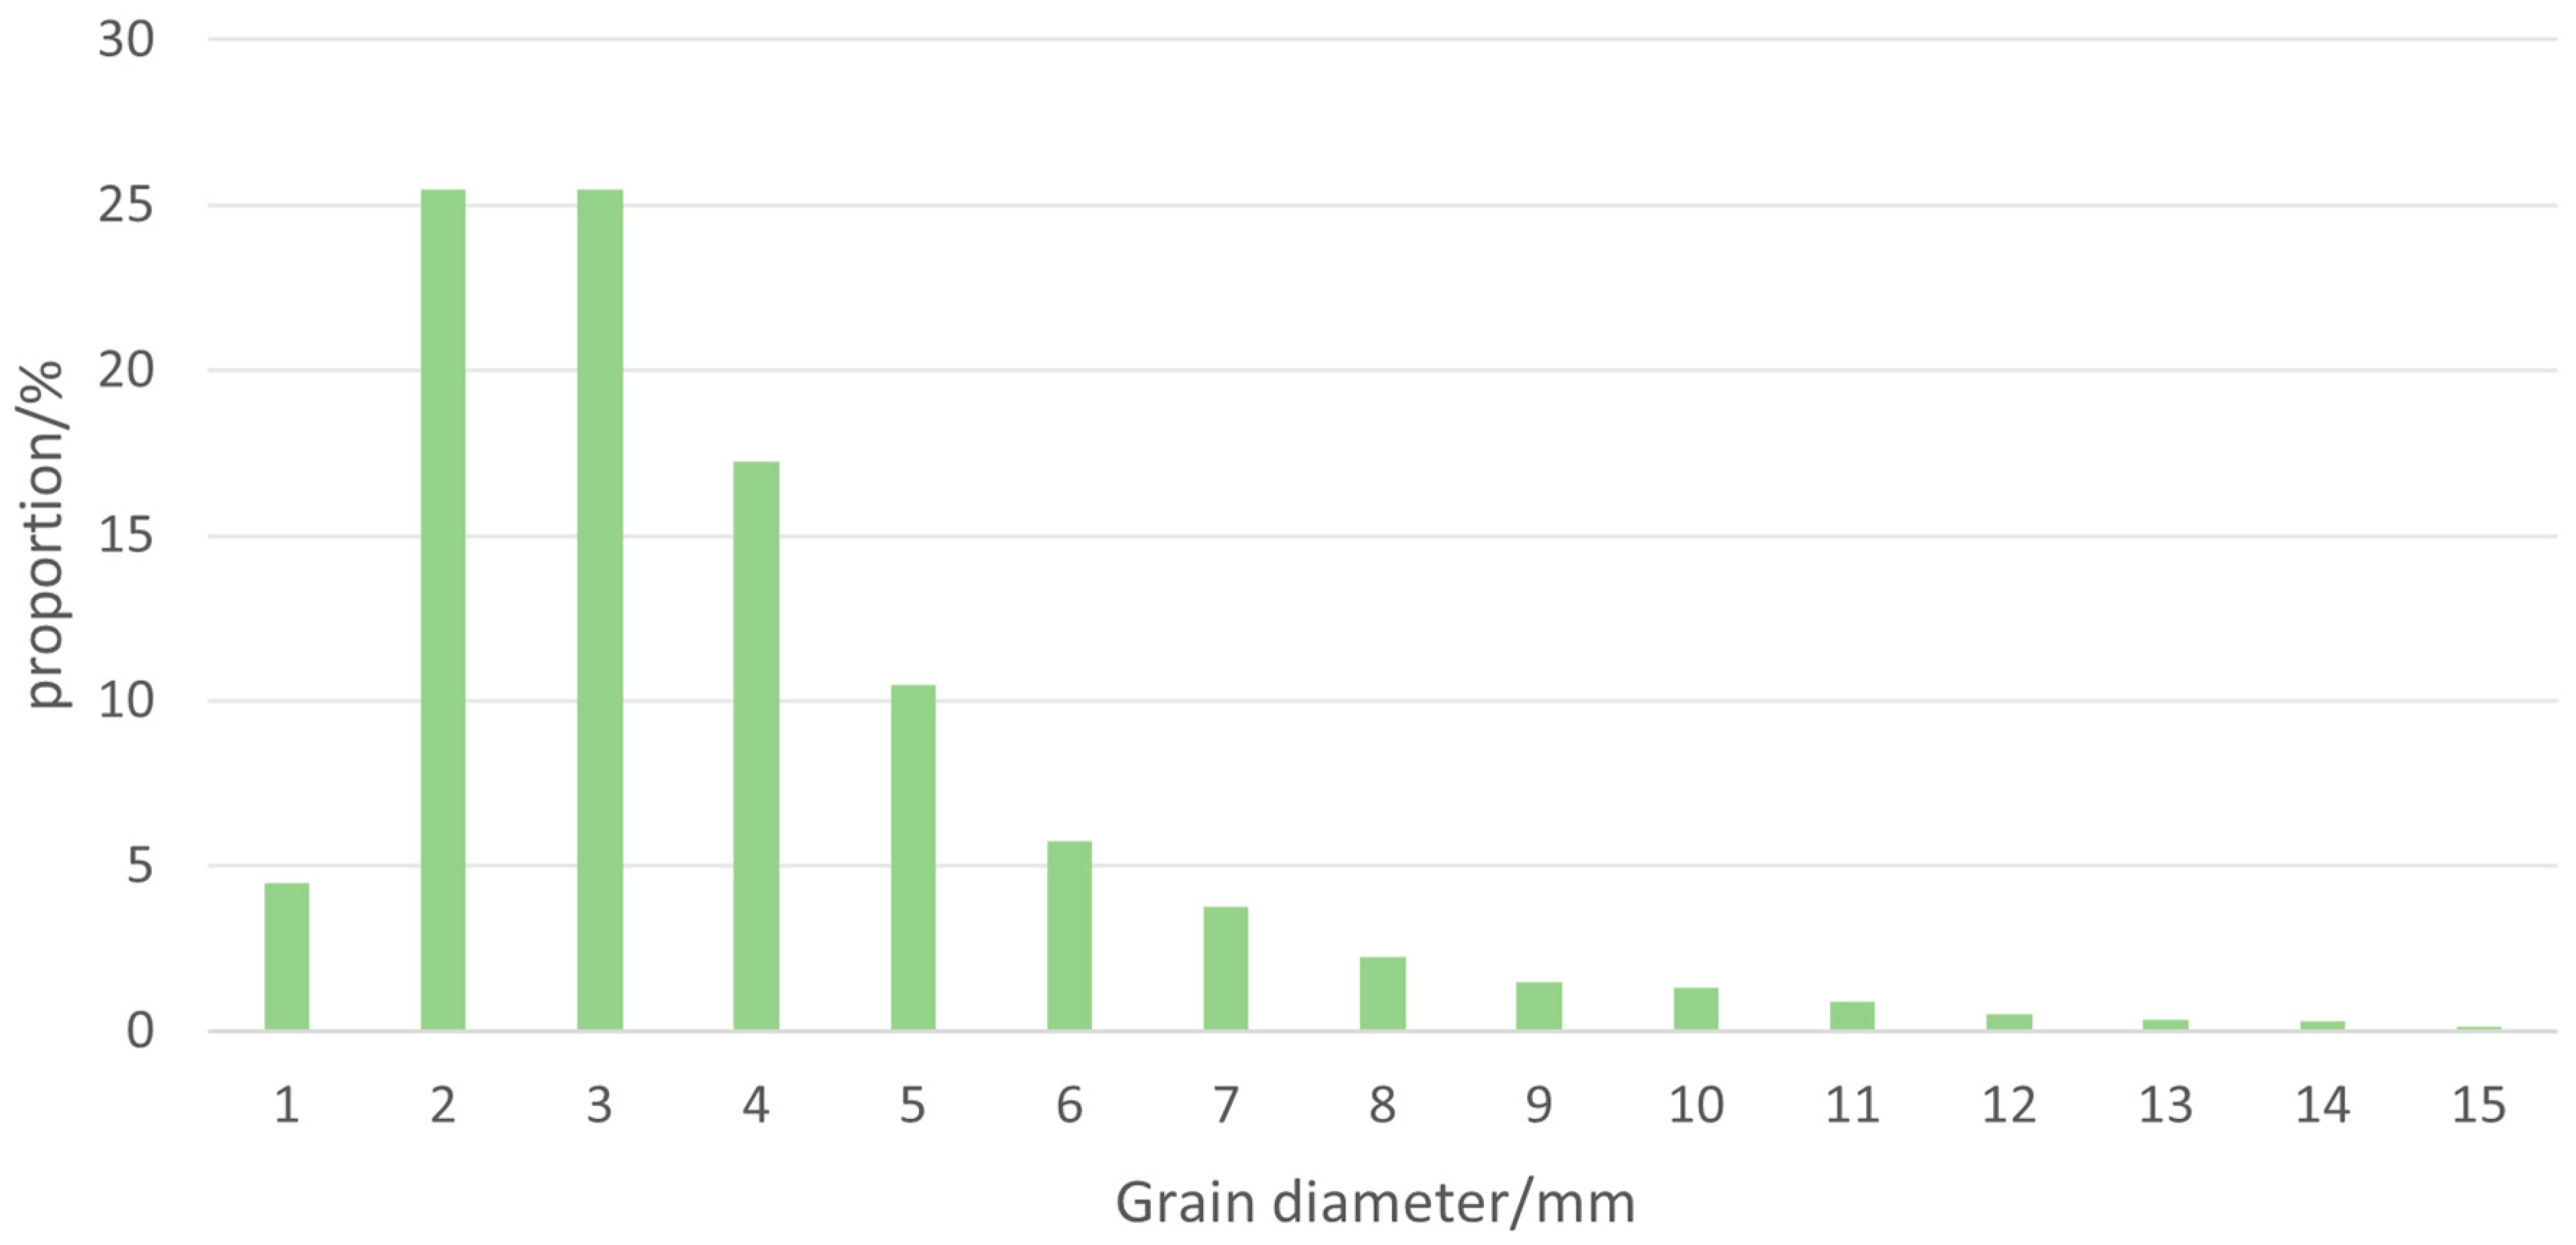
Figure 1. Distribution of the grain size of granular ice in the Yellow River.
Crystals 14 01071 g001
Figure 2. Numerical model of the grain microstructure of Yellow River granular ice. The X is a reference point on the indenter.
Crystals 14 01071 g002
Figure 3. Numerical model of the initial microscopic structure of granular ice in the Yellow River.
Crystals 14 01071 g003
Figure 4. Overall model and mesh division of three-point bending samples of granular ice from the Yellow River.
Crystals 14 01071 g004
Figure 5. Three-point bending fracture failure diagram of Yellow River granular ice.
Crystals 14 01071 g005
Figure 6. Internal crack propagation diagram.
Crystals 14 01071 g006
Figure 7. Failure mode of Yellow River ice physics test.
Crystals 14 01071 g007
Figure 8. Three-point bending beam model diagrams for different particle size distributions: (a) average particle size of 5 mm; (b) average particle size of 6 mm; (c) average particle size of 8 mm; (d) average particle size of 10 mm; (e) average particle size of 12 mm; (f) average particle size of 13 mm; (g) average particle size of 16 mm; (h) average particle size of 18 mm.
Crystals 14 01071 g008
Figure 9. Comparison of simulated and experimental values of fracture toughness for different river ice grain sizes.
Crystals 14 01071 g009
Table 1. Primary parameter values of the river ice numerical model.
Temperature (°C)Strain Rate
(s−1)
Elastic Modulus of Grain (MPa)Strength of Grain (MPa)Poisson’s Ratio of GrainElastic Modulus of Crystal Boundary
(MPa)
Strength Crystal Boundary
(MPa)
Initial Defect Content
(%)
Grain Size
(mm)
−510−4~10−5900020.3400016%1–15
Disclaimer/Publisher’s Note: The statements, opinions and data contained in all publications are solely those of the individual author(s) and contributor(s) and not of MDPI and/or the editor(s). MDPI and/or the editor(s) disclaim responsibility for any injury to people or property resulting from any ideas, methods, instructions or products referred to in the content.