Article

Texture Intensity in Grain-Oriented Steel in the Main Stages of the Production Cycle

1
Faculty of Metals Engineering and Computer Science, AGH University of Krakow, A. Mickiewicza 30 Ave., 30-059 Krakow, Poland
2
ArcelorMittal Poland S.A. Unit in Krakow, Tadeusza Sendzimira 1 Street, 31-752 Krakow, Poland
*
Author to whom correspondence should be addressed.
Crystals 2024, 14(2), 107; https://doi.org/10.3390/cryst14020107
Submission received: 26 December 2023 / Revised: 15 January 2024 / Accepted: 16 January 2024 / Published: 23 January 2024
(This article belongs to the Topic Advanced Magnetic Alloys)

Abstract

:
Grain-oriented electrical steel (GOES) has been used for many years for application in transformed cores due to its excellent magnetic properties. Magnetic properties are strongly influenced by obtaining a texture with a certain orientation (110) [001] for BCC structure. This is related to the easy direction of magnetization [001]. So far, the main research has been focused on obtaining a strong texture in the last stages of the process. The aim of the present study was to additionally trace textural changes for a slab after the continuous casting (CC) process and for a sheet after the hot rolling process. The scope of such an analysis has not been conducted before. With regard to the state after continuous casting (CC), the texture was related to measurements of the anisotropy of Barkhausen magnetic noises and the macrostructure of the slab. Based on the X-ray diffraction examinations that compared the texture intensity calculated from the texture coefficient of the slab, the hot rolled steel and the final product of grain-oriented electrical steel contained 3.1% of Si. The studies performed with the material taken from three different production steps showed high differences in the values of textural intensity indicating the occurrence of a crystallization texture, especially in the area of the columnar crystal zone; textural weakness after the hot rolling process and high texturing in the final product for textural components corresponding to the desired Goss texture.

1. Introduction

Grain-oriented electrical steels (GOES) are still one of the most important soft magnetic materials widely used in the electrical power and electronic industries [1,2]. Electrical energy is indispensable for the development of modern society. Nowadays, low-carbon, energy-saving and environmentally friendly products are required for the sustainable development of modern society; this requires the manufacturers to provide better energy-saving, larger capacity, higher voltages and reduced emission transformers and electrical machines [3]. To obtain the superior magnetic properties, the texture microstructure called Goss-oriented grains with a crystalline direction of (110) and <001> should be developed [4]. Commercially, GOES production starts with steelmaking, then continuous casting, hot rolling and cold rolling followed by annealing which are usually conducted in two stages such as primary and secondary recrystallization. A number of studies investigating the distribution of cold-rolled textures and their influence on recrystallization textures have been carried out. Goss-oriented grains usually evolve as recrystallized grains during the primary recrystallization stage which subsequently develops a Goss texture during the secondary recrystallization stage via abnormal grain growth [5,6,7,8,9]. However, it is also reported that in the conventional processing route, the origin of the final Goss texture is obtained from the hot rolling stage, where the Goss texture develops below the sheet surface due to shear deformation [10]. Goss-oriented grains are retained after cold rolling which subsequently develops the Goss texture during the final annealing process when fine primary recrystallization grains are firstly formed, and abnormal grain growth is formed with further annealing. Then, a portion of fine grains with an exact {110}〈001〉 orientation of grains (Goss texture) absorbs other grains due to surface energy differences, resulting in the sharp Goss texture [11,12]. In addition, the role of inhibitors (second-phase particles) in promoting secondary recrystallization, such as MnS and/or AlN precipitations, has also been widely investigated, and those investigations have shown that these inhibitors are used to control the texture in the steel strip [13,14,15]. A fine dispersion of precipitates is a key requirement in the manufacturing process of Fe-3%Si grain-oriented electrical steel. In order to obtain finely dispersed inhibitors, slabs are heated as far as temperatures above 1350 °C to achieve complete dissolution, and then inhibitors can be finely distributed either in the hot rolling process or in the subsequent cooling process [16]. In the production of high permeability GOES, precipitations of copper, manganese sulfides, and aluminum nitride delay the normal grain growth during primary recrystallization, causing the preferential growth of grains with a Goss orientation during secondary recrystallization. The sulfides precipitate during the hot rolling process. The aluminum nitride particles are formed during hot rolling and annealing process [17]. As is generally known, the grain size, the texture, precipitations and the internal stresses, and their distribution across the sheet thickness determine the magnetic properties of the FeSi materials, i.e., the magnetization behavior and the magnetic losses. The relevant structural features are influenced by all the production steps, especially by hot rolling, cold rolling, and final annealing [18]. This paper focuses on the changes in the texture in the material obtained in the first stages of the production process. Despite the widely described textural development during the cold rolling and annealing process, very little research work has been performed in relation to the texture of casting and hot rolling products. Park et al. [19] reported on the occurrence of Goss texture in strip-casted steel containing 4.3 wt.% of Si. Lu et al. indicated, a “texture memory” mechanism while investigating the texture of hot rolled strip. They concluded there was a lack of Goss texture at this stage [20]. Based on this “texture memory” mechanism, the objective of this work is to examine the texture of continuous casted steel containing 3.1 wt.% of Si, and then its texture after hot rolling. Moreover, the aim of this study was to analyze crystallographic texture changes, including the impact of the crystal formation effect in slabs on the texture and determination of texture intensity in the final product. In addition, the purpose of this study was to analyze the magnetization of steel, determined using Barkhausen noise measurements. In real conditions, creating a more precise texture and reducing the thickness of the final sheet leads to an increase in the magnetic domain size which also has an impact on core losses. The reduction in iron loss is one of the most important industrial issues and until now, lower iron loss materials have been developed, in particular through improvements in the texture, production of thinner sheets and refinements of the magnetic domain wall spacing in order to reduce the domain wall velocity and consequently reduce edgy current losses (as the size of magnetic domains decreases, the number of domain walls increases and their velocity also decreases) [21,22].

2. Materials and Methods

The investigated material was high silicon steel containing 3.1% of Si. After continuous casting, the sample was cut out from the face of 70 mm thickness slab over the entire width of 960 mm. The sample was cut off with a large margin and then milled and ground to the thickness of 10 mm in order to minimize the impact of structural defects on the texture of the investigated material that might arise from the cutting process. The slab sample was cut into 3 parts and then etched. A total of 5 samples, having the geometry of 45 mm × 45 mm, were taken from hot rolled coils from different heats and 4 samples were taken from the GOES final product. All investigated materials were of similar chemical composition for the same grade of steel (Table 1).

2.1. X-ray Diffraction

X-ray diffraction (XRD) tests were performed for all samples on a D8 Advance diffractometer from the Bruker Corporation using filtered cobalt anode lamp radiation (λCoKα = 0.179 nm). Measurements were performed in the angular range 2θ = [40 − 130°] in step mode with a step of Δ2θ = 0.04° and an exposure time per step of 10 s. The phase analysis was performed using PDF (powder diffraction file) patterns from the International Center for Diffraction Data (ICDD) database. The diffraction methods used were based on Bragg’s law [23]:
λ = 2 d { h k l } sin θ { h k l }
with being the monochromatic wavelength of the scattered beam. Knowing λ, Bragg’s law allows the direct determination of the lattice spacing by measuring the corresponding scattering angle of the Bragg reflection. The scattering vector direction normal for the lattice planes is the bisecting angle between the incoming and outgoing beam and describes the measurement direction in the sample of interest [24].
The aim of this study was to determine whether material texturing occurs and, if so, to what extent it is advanced. The material texture was characterized via the texture coefficient (TC) determined by the formula [25]:
T C = J h k l J 0 h k l 1 n Σ J h k l J 0 h k l
where Jhkl—measured intensity diffraction line hkl; J0hkl—hkl intensity diffraction line of a reference material taken from the ICDD database; n—number of reflections taken into account.

2.2. Magnetic Barkhausen Noise (MBN)

Additionally, the STRESSCAN 500C (produced by STRESSTECH OY, Finland) measurements were used to determine the magnetoelastic parameter (MP), being the effect of magnetic noise and also known as the Barkhausen phenomenon. This physical phenomenon originates from collisions of magnetic domain walls (DWs) with lattice imperfections (i.e., grain boundaries), where the motion of magnetic domain walls (Bloch walls) is hindered. The tensile and compressive residual stress weaken and strengthen the pinning effect, respectively. The pinning and unpinning of domain walls generates irreversible jumps and the corresponding electromagnetic pulses are detectable with a pick-up coil; when the electrical pulses produced by all domain movements are added together, a noise-like signal called Barkhausen noise is generated [26,27,28].
The sample taken from the righthand side of the slab was measured, and the areas of approximately 15 mm × 15 mm each were marked on the cross-section of the slab (Figure 1). A STRESSCAN sensor head was placed at the intersection points and magnetoelastic parameter (MP) measurements were performed on 0.2 mm depth with applied magnetizing circuit resistance of 50 kΩ.

3. Results and Discussion

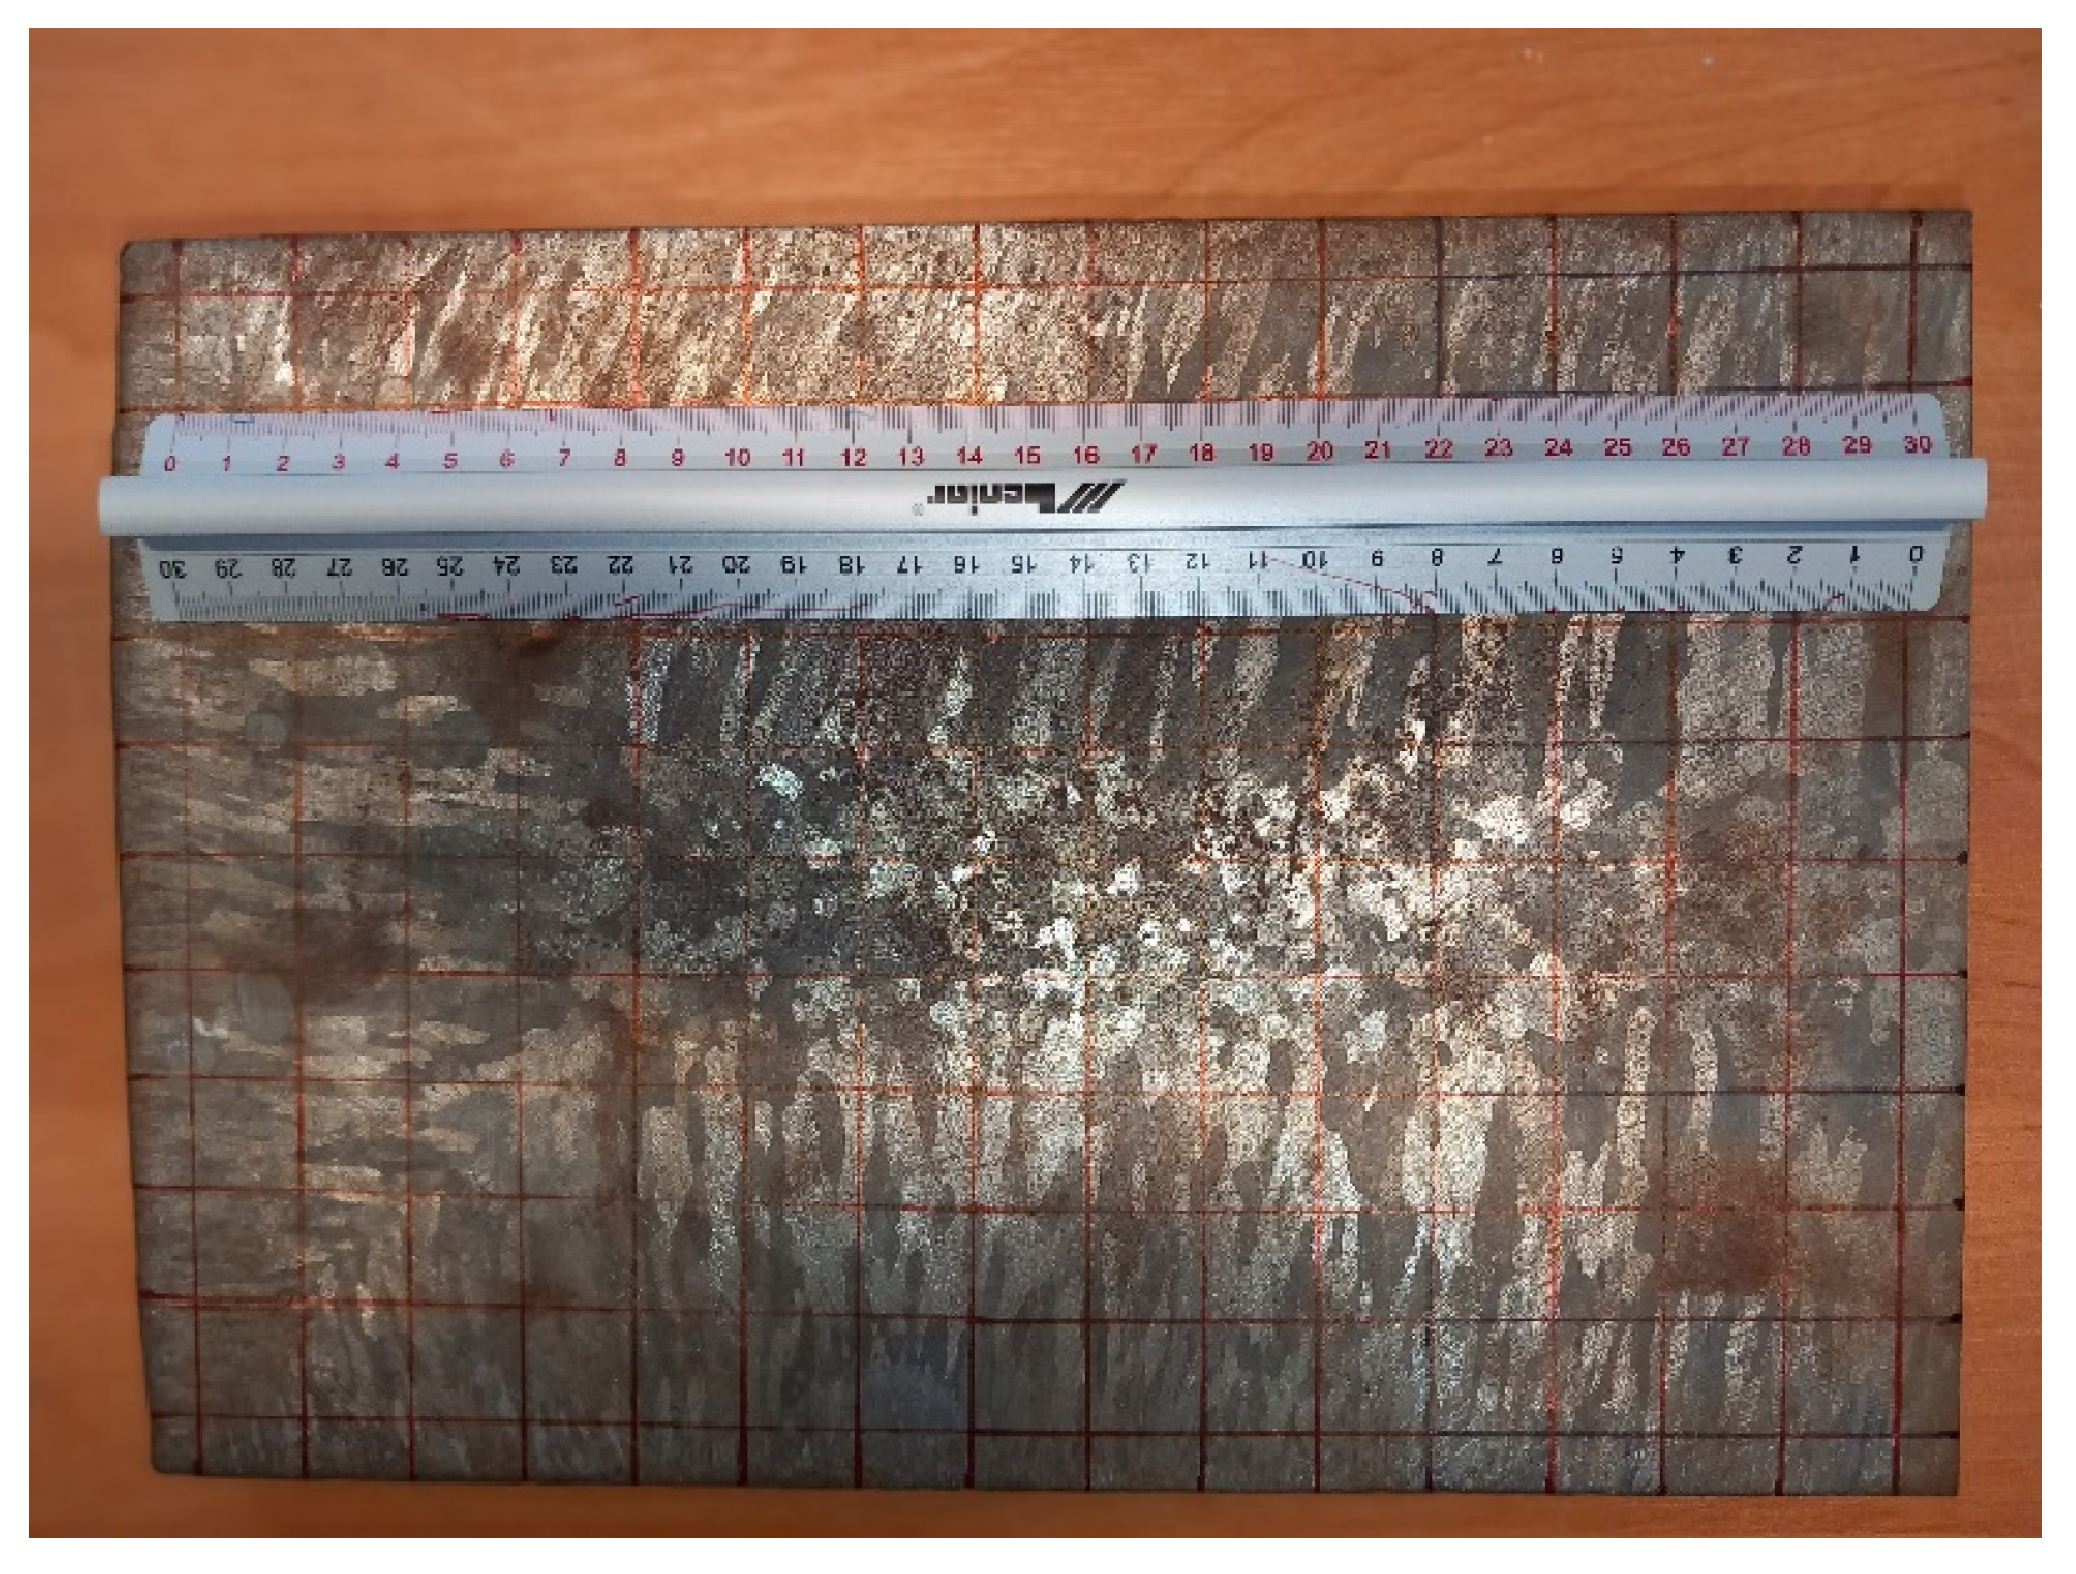
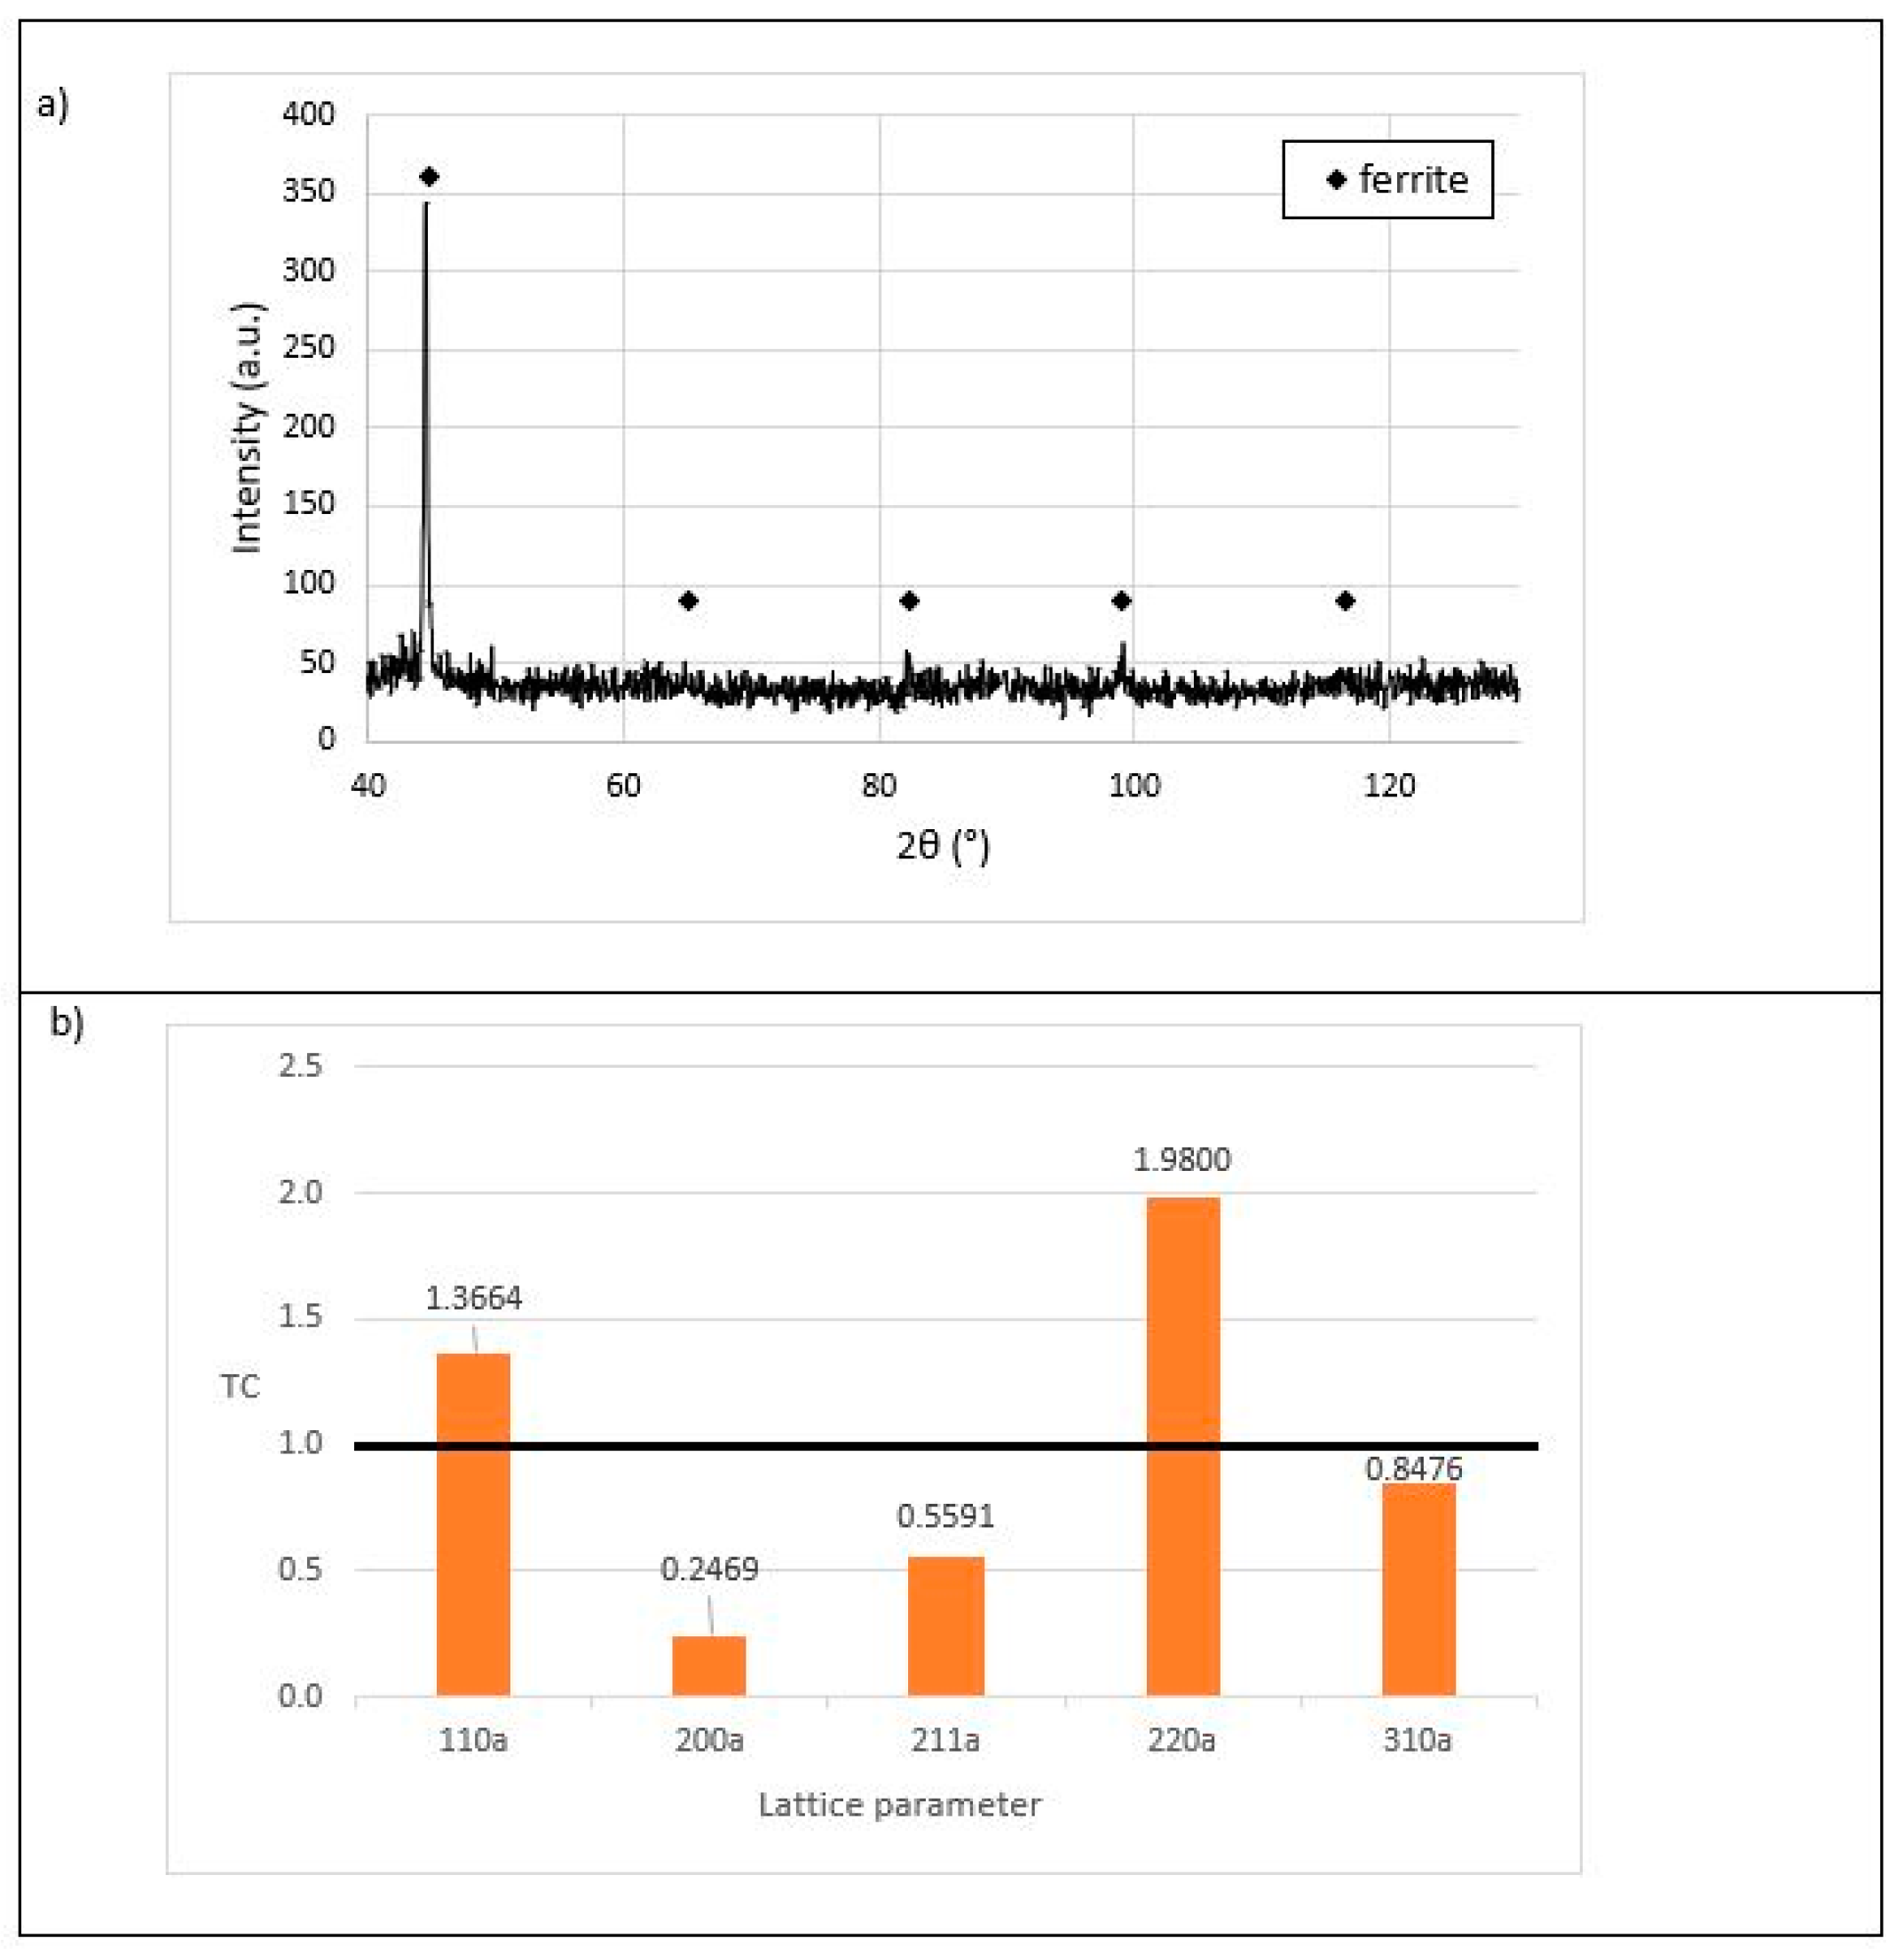
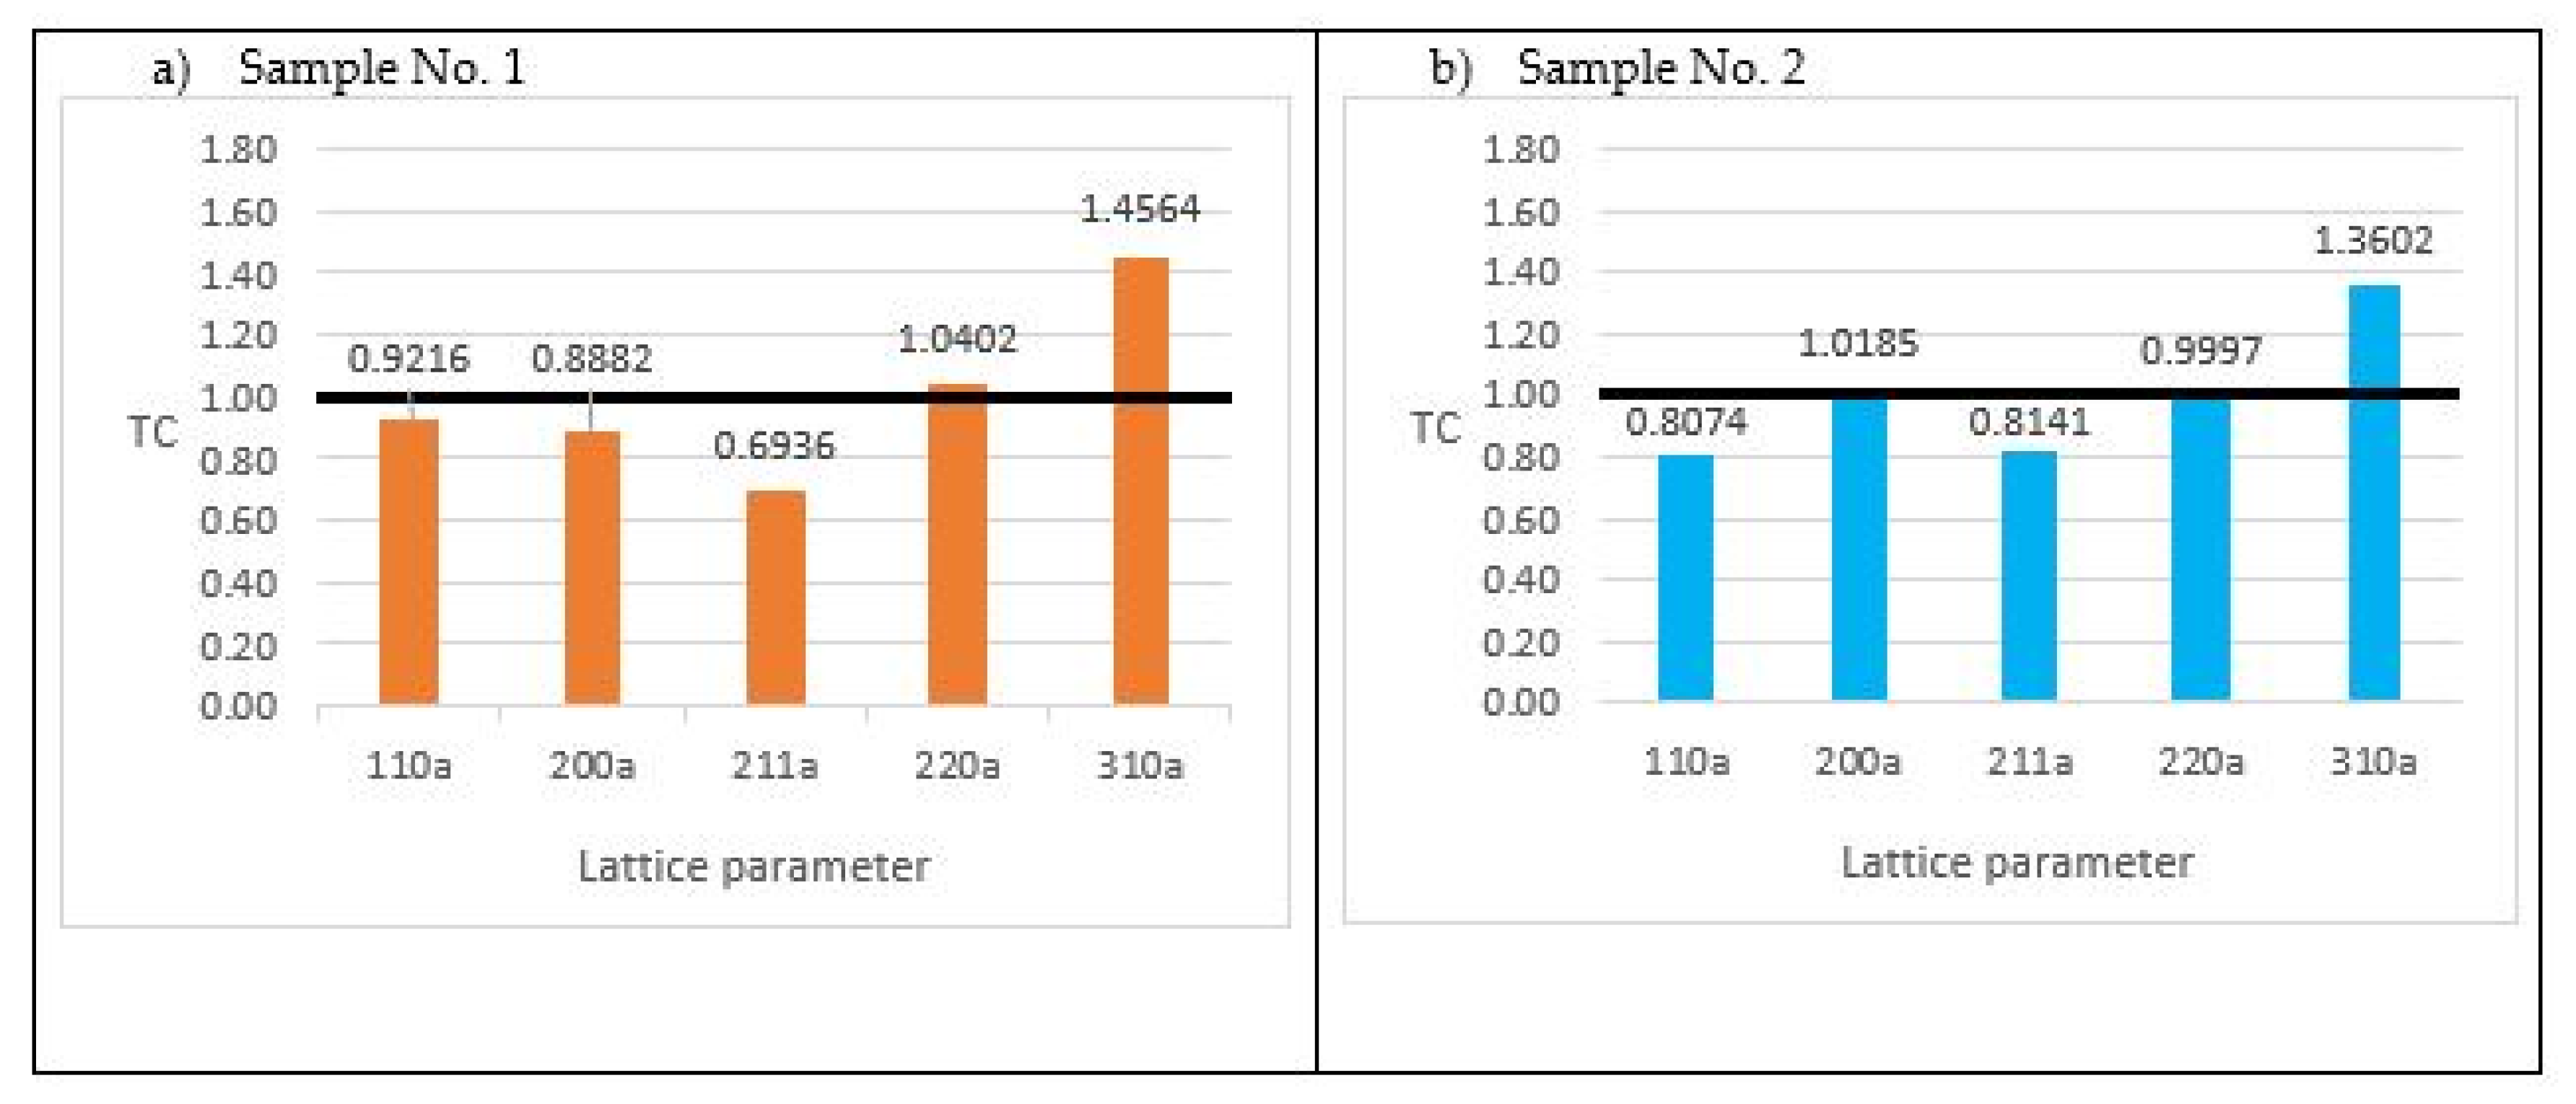
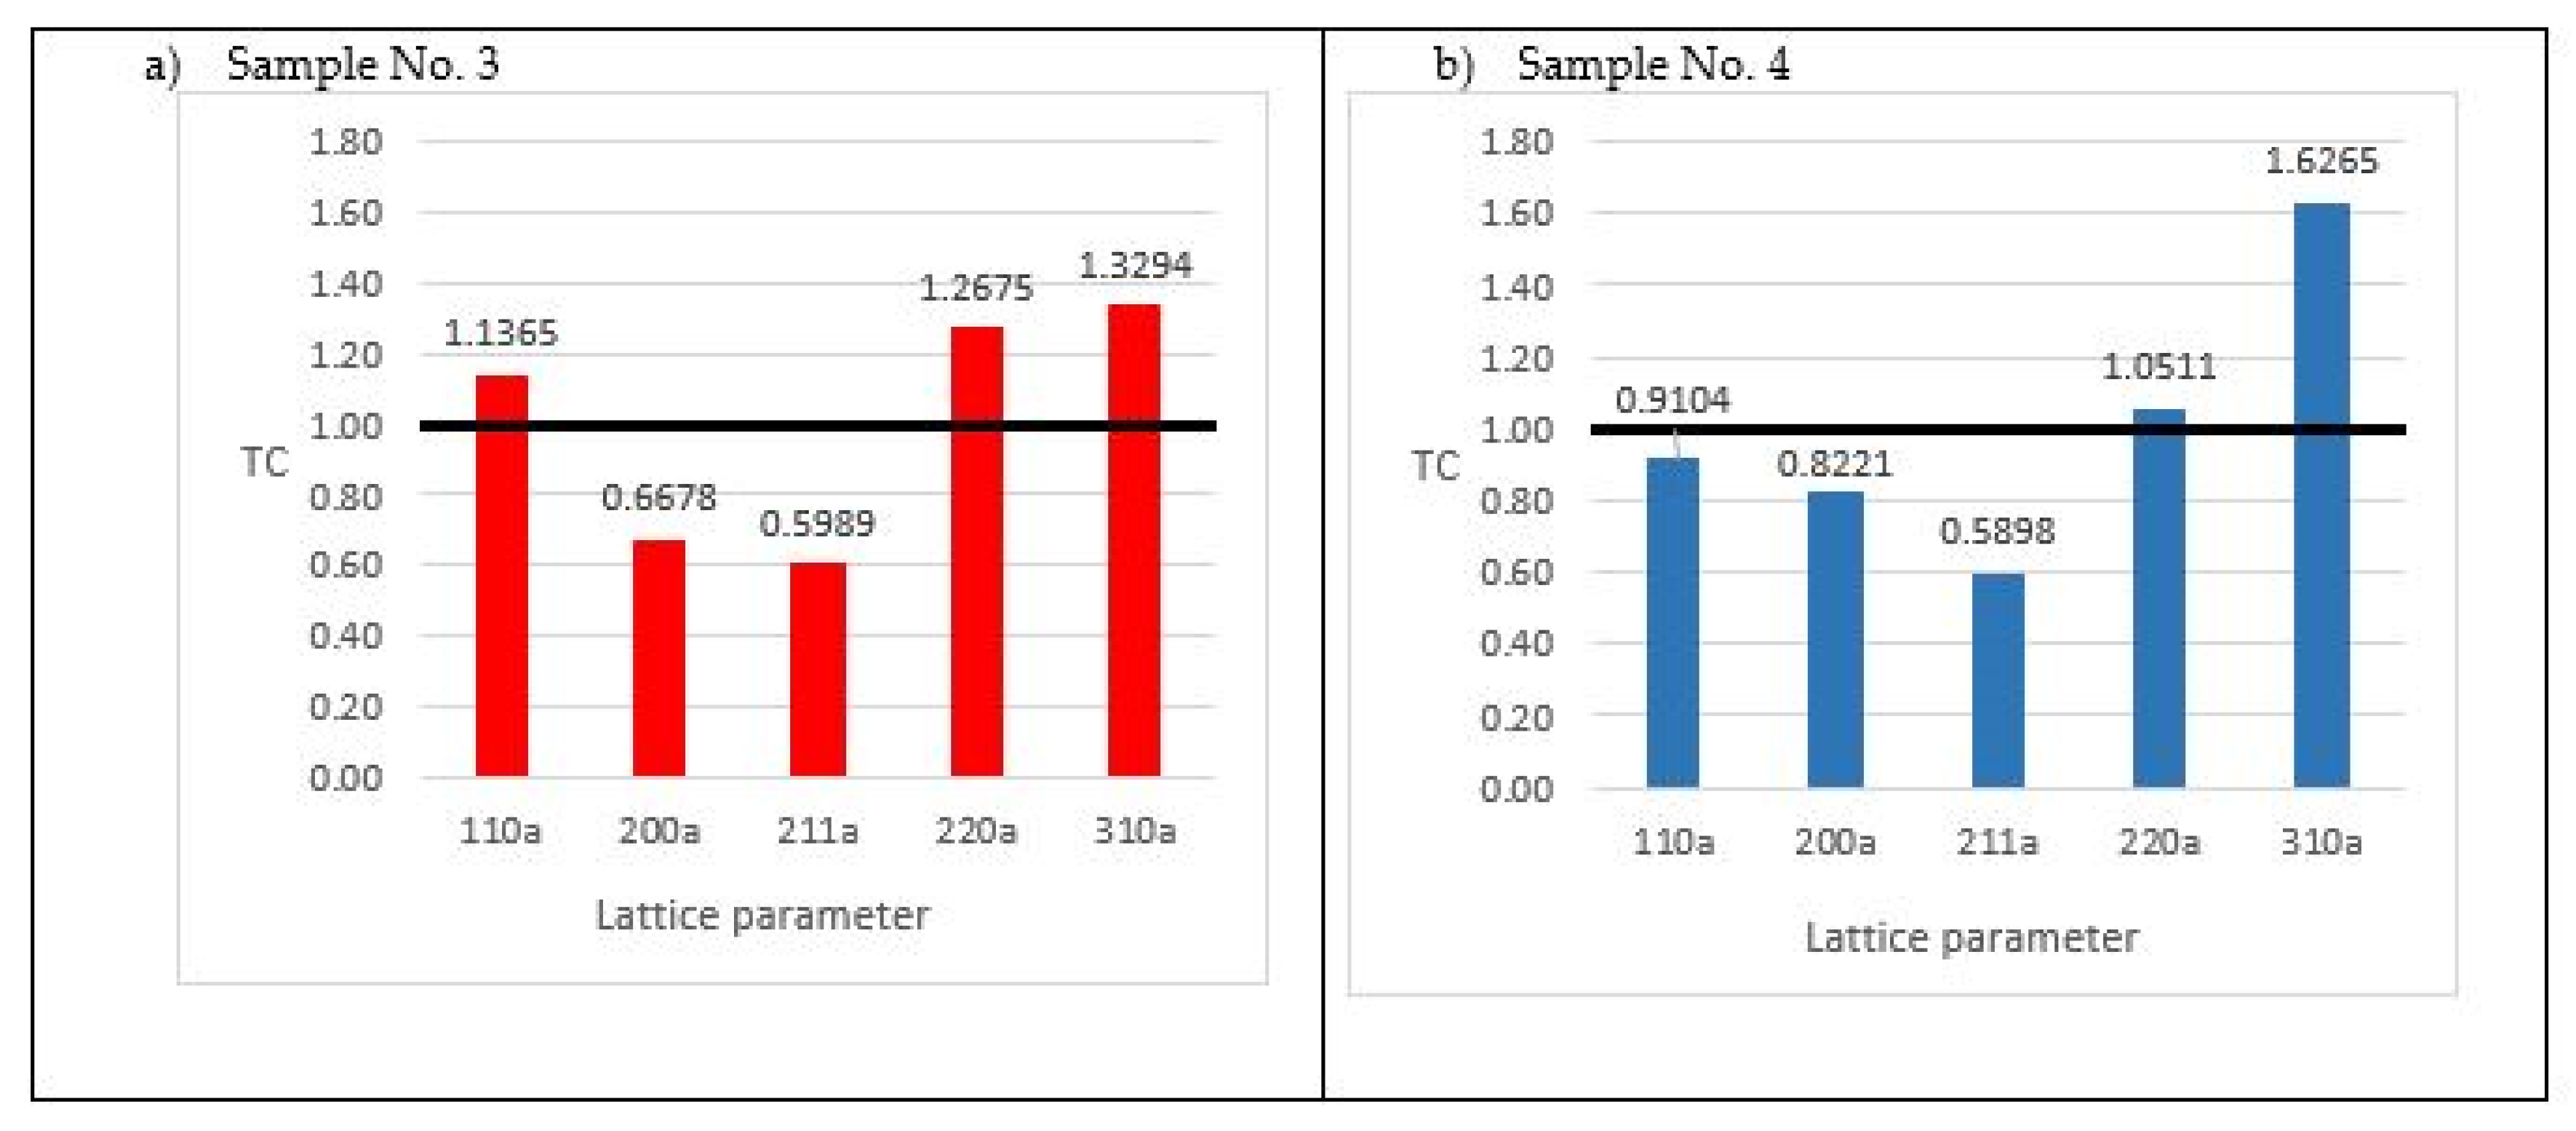
3.1. Analysis of Macrostructure, Texture and Magnetic Properties of the Slab Obtained after Continuous Casting Process

The observations of the macrostructure were performed on the cross-section of the slab, which was etched with a chemical reagent revealing its macrostructure. During the continuous casting process, molten steel was poured into water-cooled molds and the strand gradually started to solidify. As a result, the solid shell of the strand forms and moves out of the mold toward the next cooling zone in order to finally fully solidify [29]. The macrostructure of the slab is characterized by three distinct zones corresponding to individual stages of crystallization. Additional subzones were identified and are indicated in Figure 2.
  • FCZ—frozen crystal zone,
  • SCCZ—small columnar crystal zone,
  • LCCZ—large columnar crystal zone,
  • ECZ—equiaxed crystal zone.
FCZ’, SCCZ’, LCCZ’—similarly, the zones located on the other side of the slab.
It can be observed that the continuous casting slab macrostructure mainly consisted of solidified columnar grains. It is reported that the strong anisotropy of the coarse columnar grains had a notable impact on the subsequent microstructure, texture and resulting properties [30].
The research into the slab texture was performed for two zones: LCCZ and ECZ. The samples were cut out from 1/3 of the cross-section of the slab. X-ray diffraction patterns were recorded, and the TC parameter was calculated based on a comparison of the intensity of individual peaks originating from the appropriate crystallographic planes relating to the standard (Figure 3, Figure 4, Figure 5 and Figure 6). X-ray diffraction pattern shows that the investigated material is single-phase BCC material which allows the conclusion to be drawn that it is ferrite. The results presented in Figure 3 and Figure 4 and obtained for the samples No. 1 and No. 2 taken from the area of columnar crystal zone show great similarity. The TC parameter is most deflected in columnar crystal zones for lattices {200} and {220}, and there is no texture intensity for lattice {310}. At this point, it is worth mentioning that the greater the deviation of the value of TC from 1, the stronger the intensity texture occurs for a given crystallographic direction. Based on the obtained results and strong intensity of texture corresponding to the direction (100), it can be concluded that this direction is preferred for the columnar crystals’ growth. The results obtained for the sample No. 3 (Figure 5) differ from the previous ones. In this case, a strong texture is observed for each crystallographic plane, because the investigated sample was taken from the area of the largest columnar crystals, and it can be expected that the information was obtained from practically a single grain. In the zone of equiaxial crystals, texture intensity is noticed only for the crystallographic lattice {310} (Figure 6). For other lattices, TC resulted in being close to 1, probably due to larger number of grains in the investigated area and independent growth of equiaxial crystals and their small size. This can be related to the low anisotropy of the MP parameter when examining magnetic Barkhausen noises, which is why the results of the MP parameter measurements in the region of equiaxed crystals generally give average values. It should also be noted that the greatest accumulation of impurities occurred in this area, which resulted in the separation of non-metallic inclusions from the liquid in the first place, which served as a basis for the heterogeneous nucleation of equiaxed crystals with a random crystallographic orientation.
Magnetic properties are highly dependent on the grain orientation and therefore the deviation of the 〈001〉 crystal axis from easy magnetization direction {100} [31]. Registered Barkhausen noises are generated by the movement of Bloch walls. The easier the occurrence of these displacements, the higher is the MP parameter. This means that when higher MP values are obtained, there is an easier magnetization of the material in that direction; consequently, it may mean that there are crystallographic planes in that direction characteristic of easy magnetization. However, it should be noted that the MP parameter also depends on the state of stress. The physical background of these phenomena is connected with the creation of stress-induced anisotropy and its influence on the total free energy of the magnetic material [32]. Analyzing Table 2 and Table 3, it can be seen that higher MP parameters were obtained when the measuring head was placed parallel to the direction of the columnar crystals compared to measurements made perpendicular to these crystals. This indicates a noticeable anisotropy of magnetic properties in the range of columnar crystals. Greater anisotropy occurs in the area of columnar crystals located in the upper part of the slab cross-section. This anisotropy is reduced in the area of the presence of equiaxial crystals and also in the area of the edge of the slab cross-section, where columnar crystals in two directions from its side edge as well as from the top and bottom edges come into contact (marked by black line in Table 2 and Table 3). It can be concluded that the material is more isotropic due to magnetic parameters. These results also indicate that the boundaries of the formed crystals make it difficult for Bloch walls to move, and consequently increase the magnetic hardness of the the material.

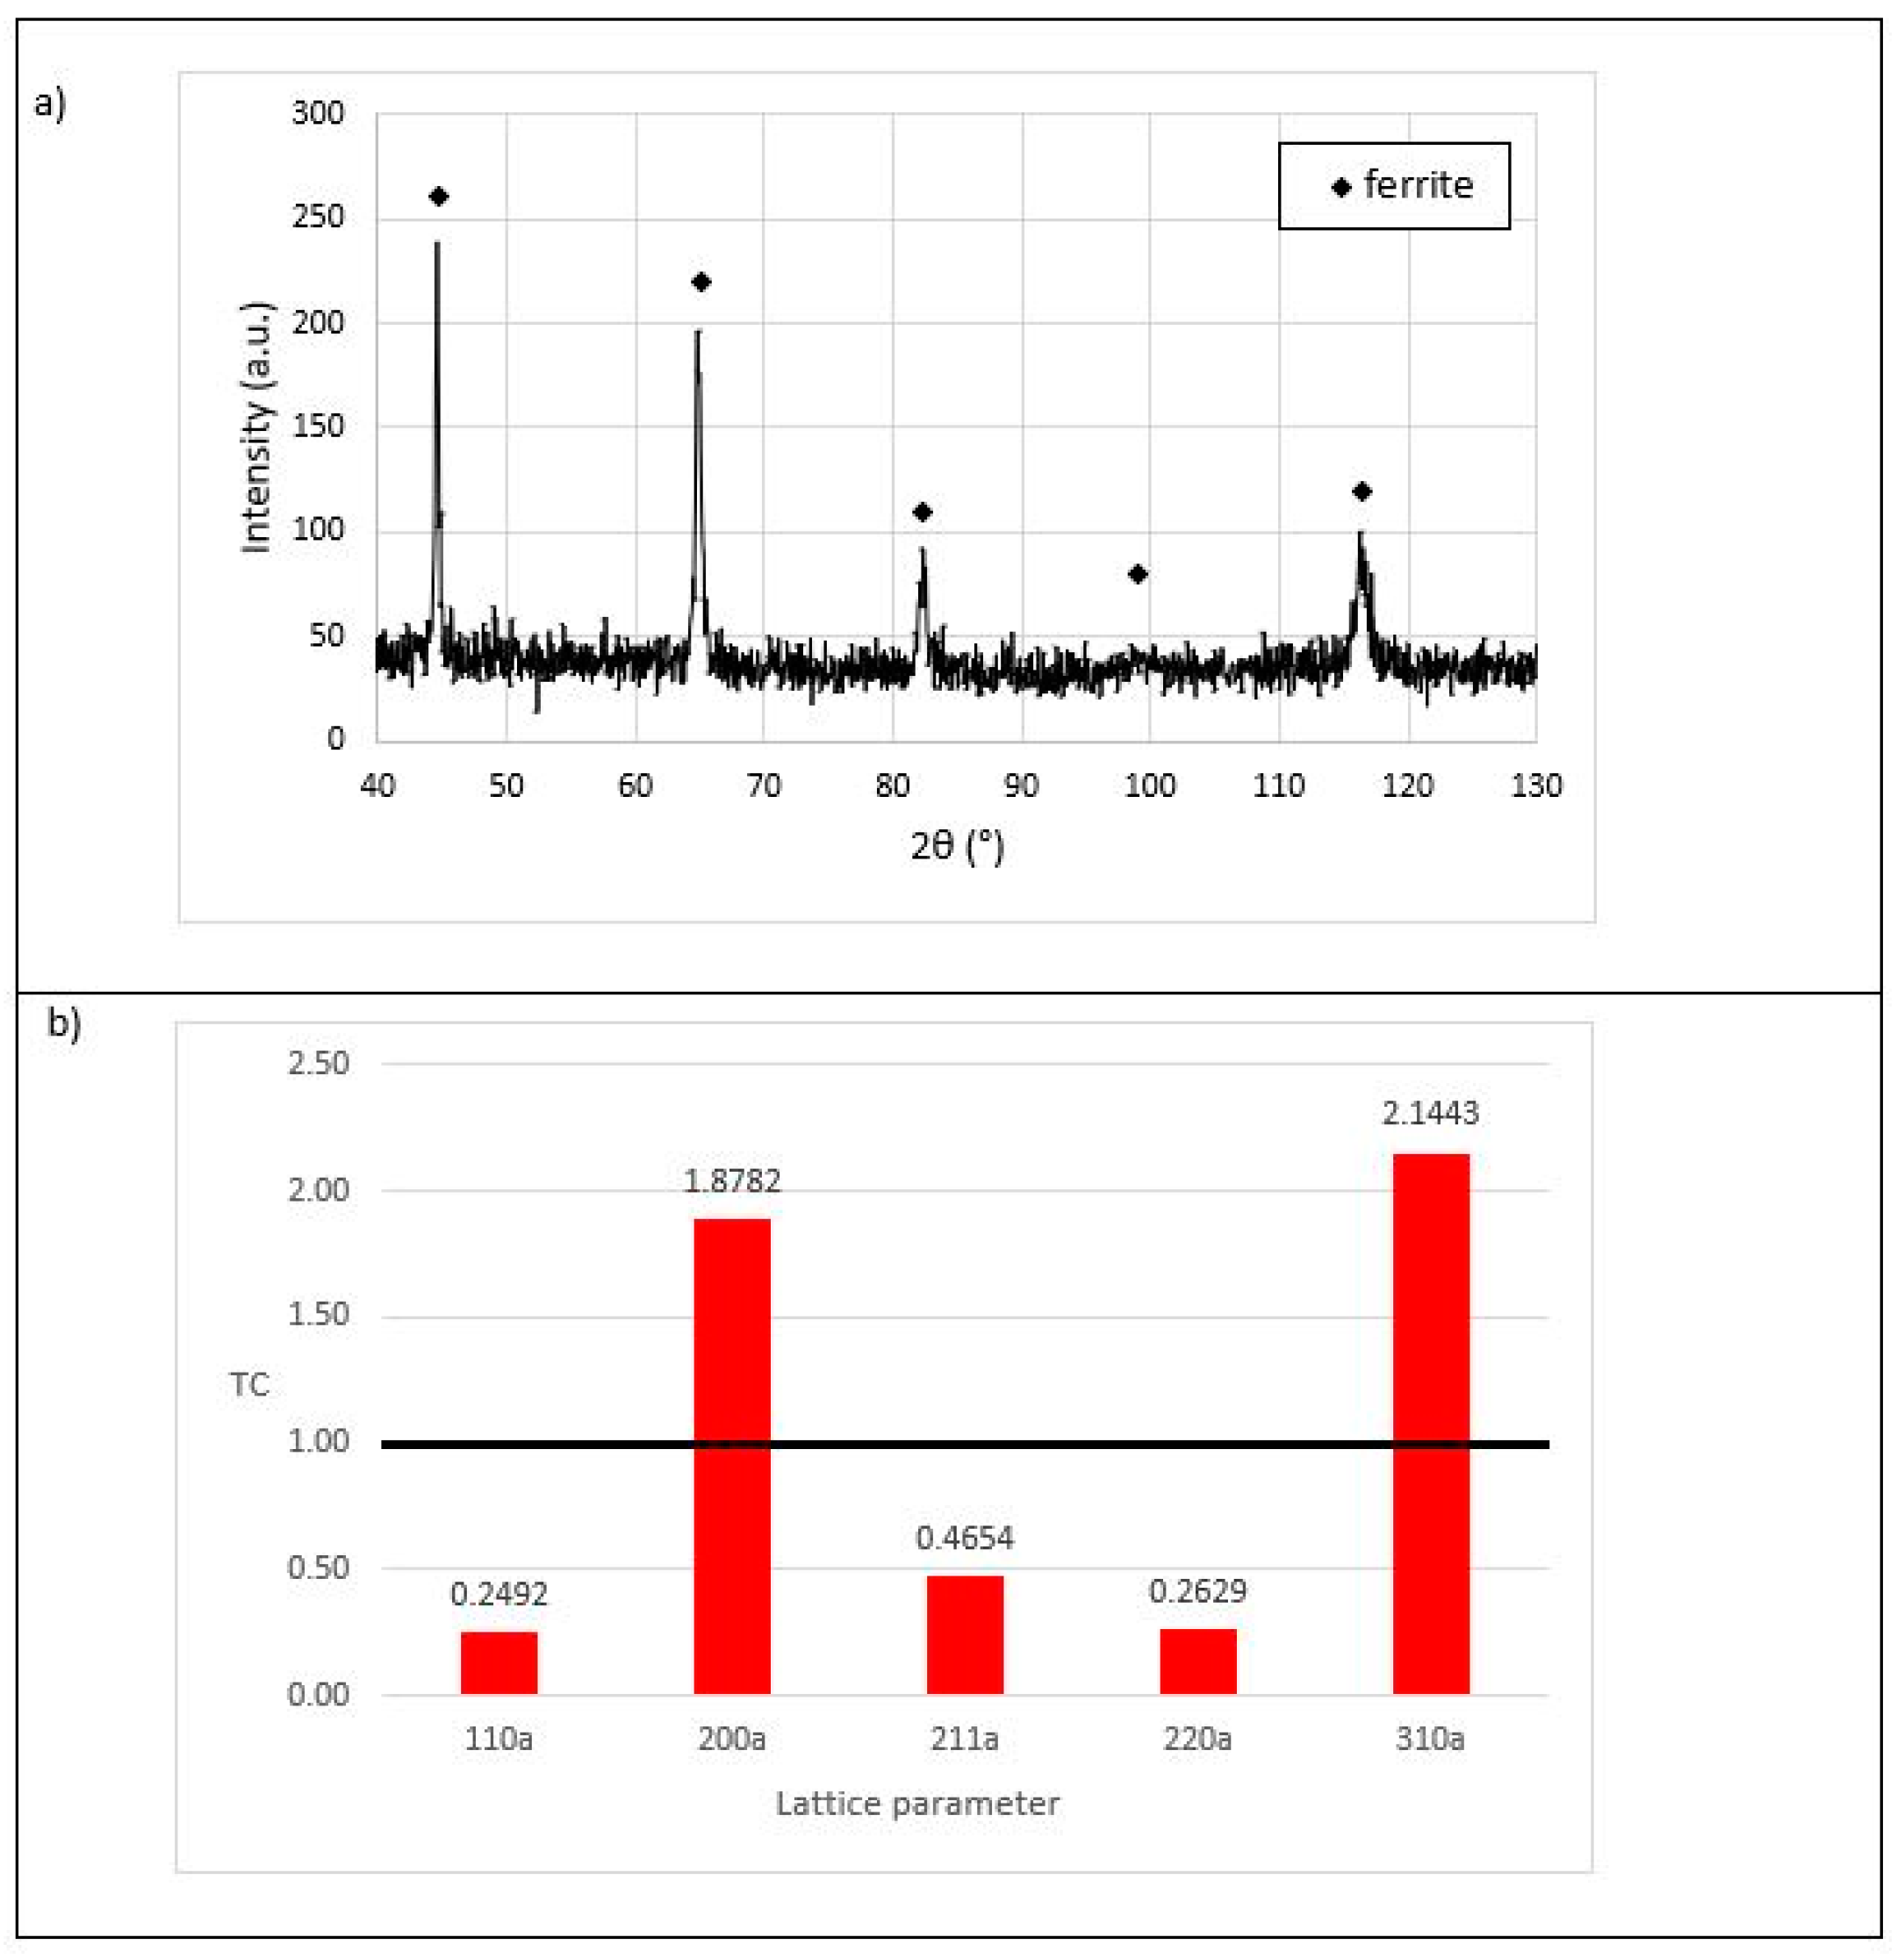
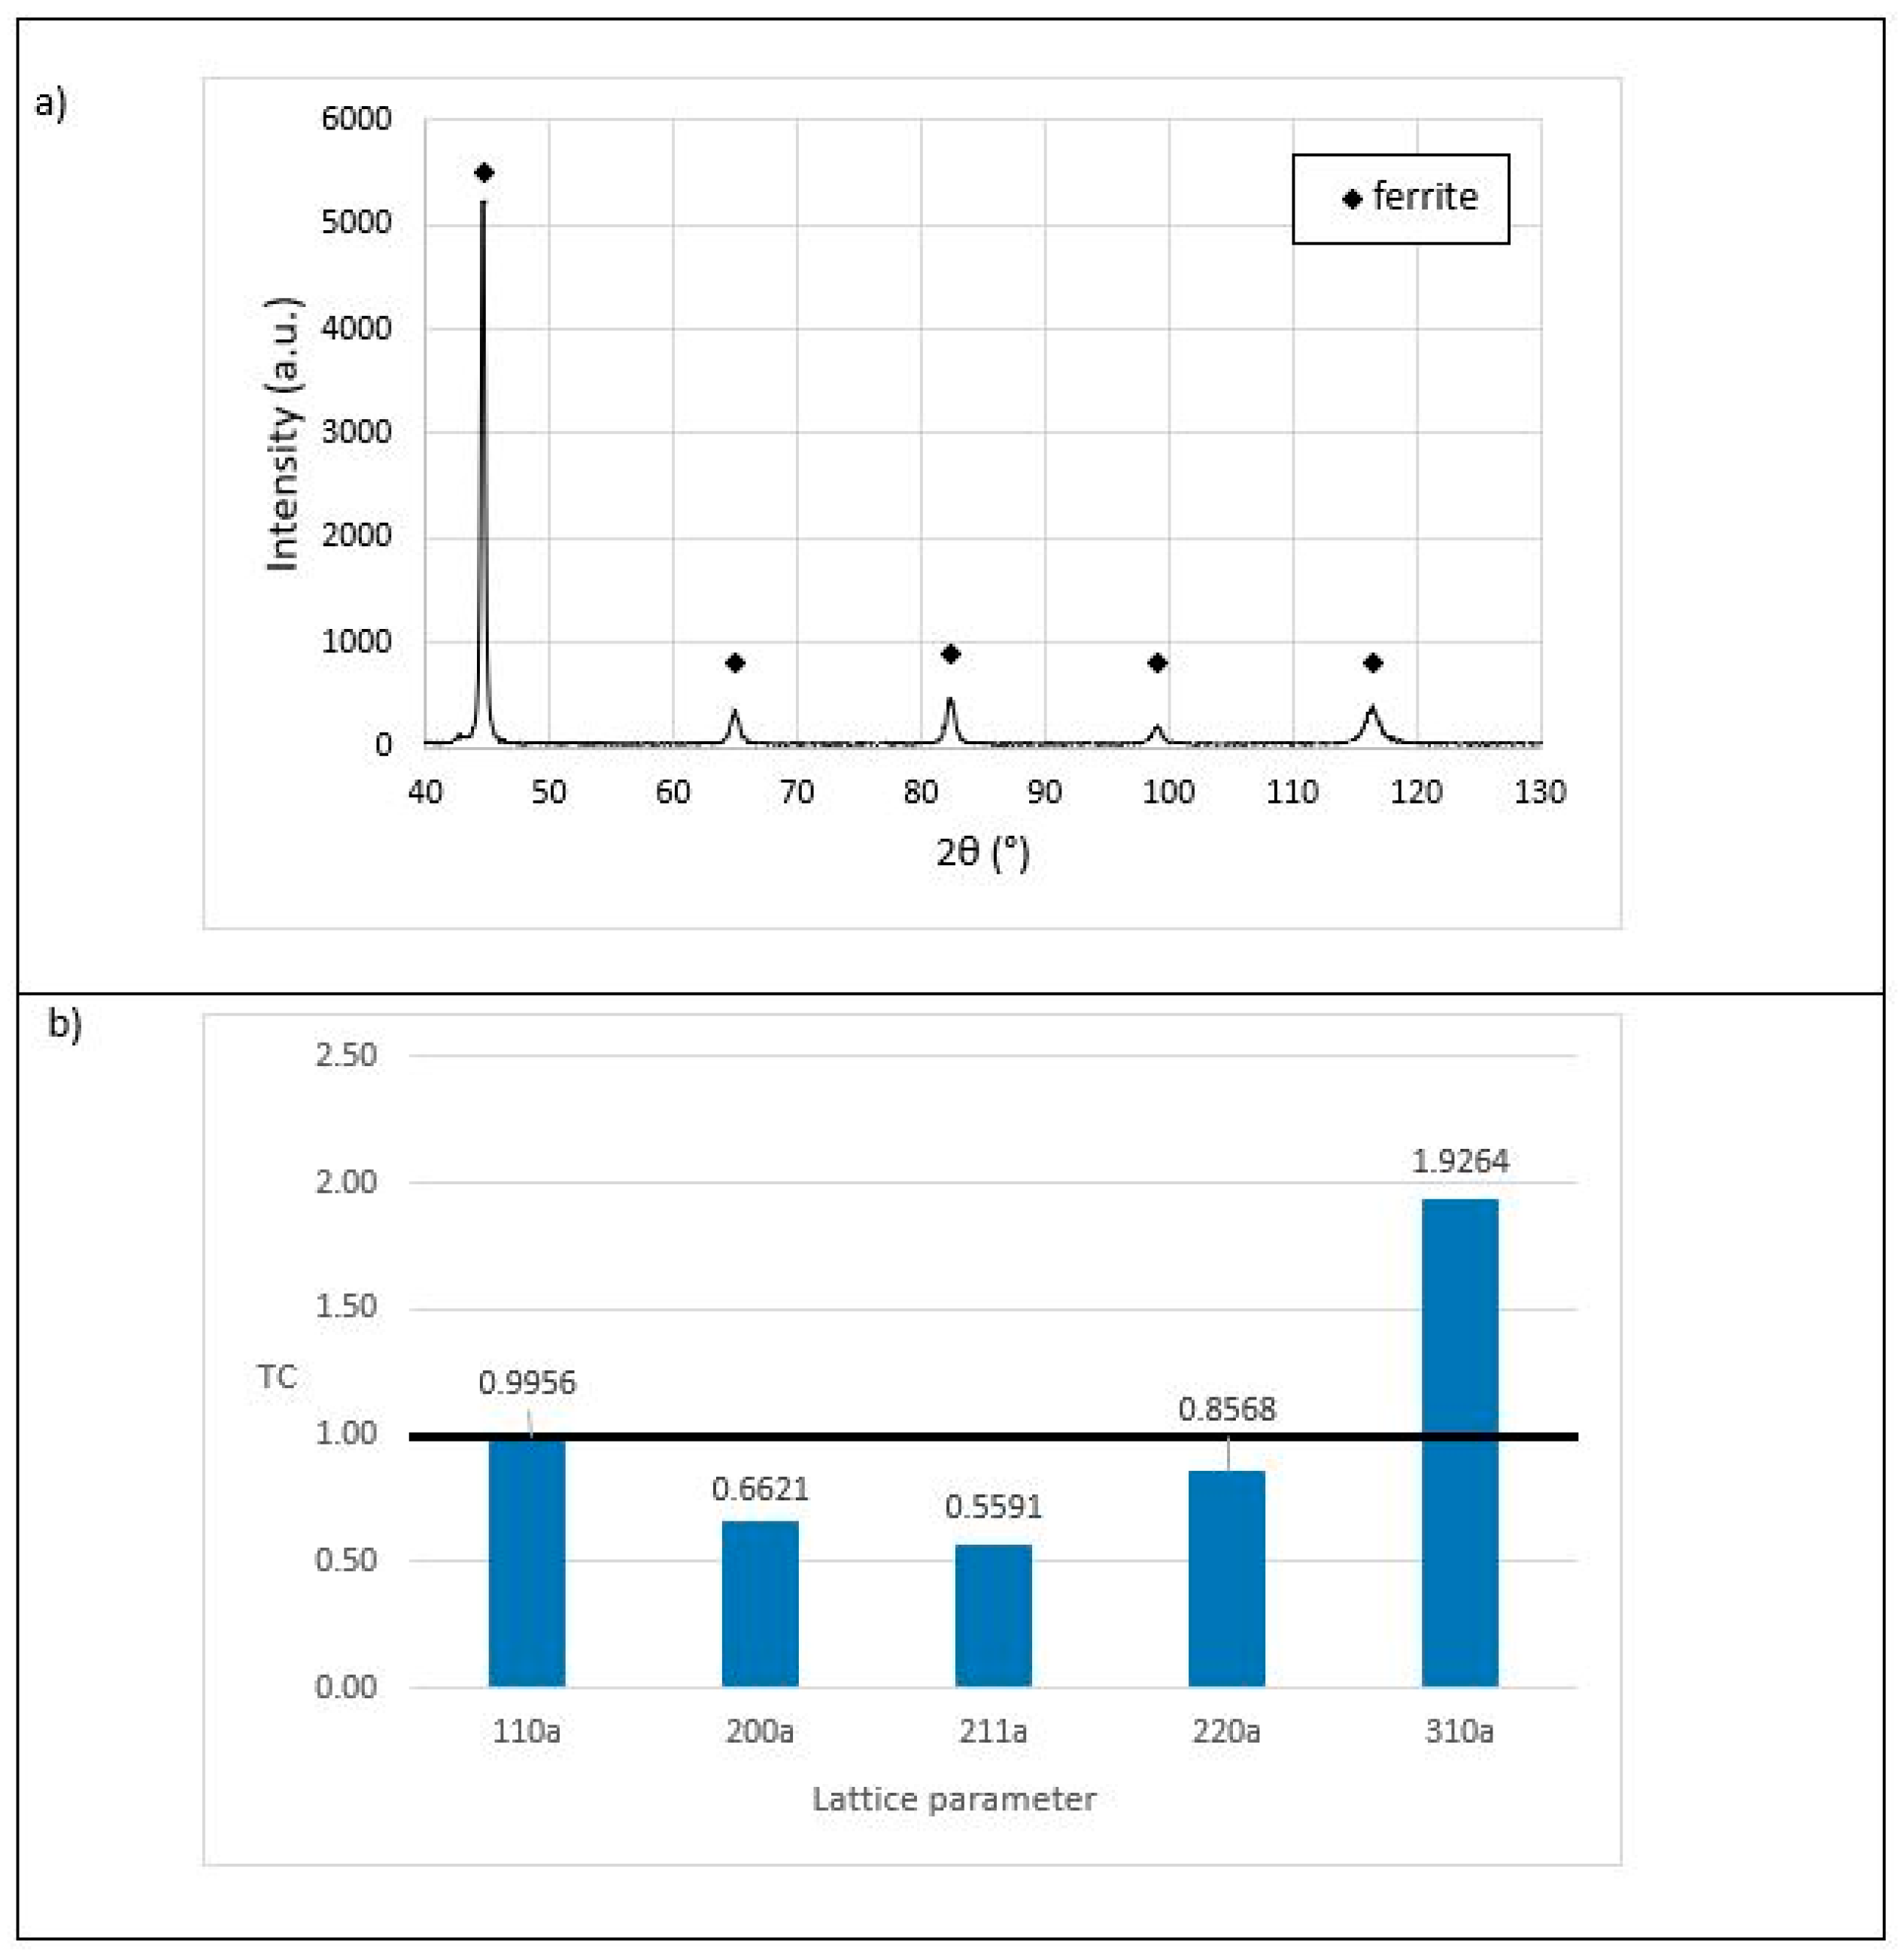
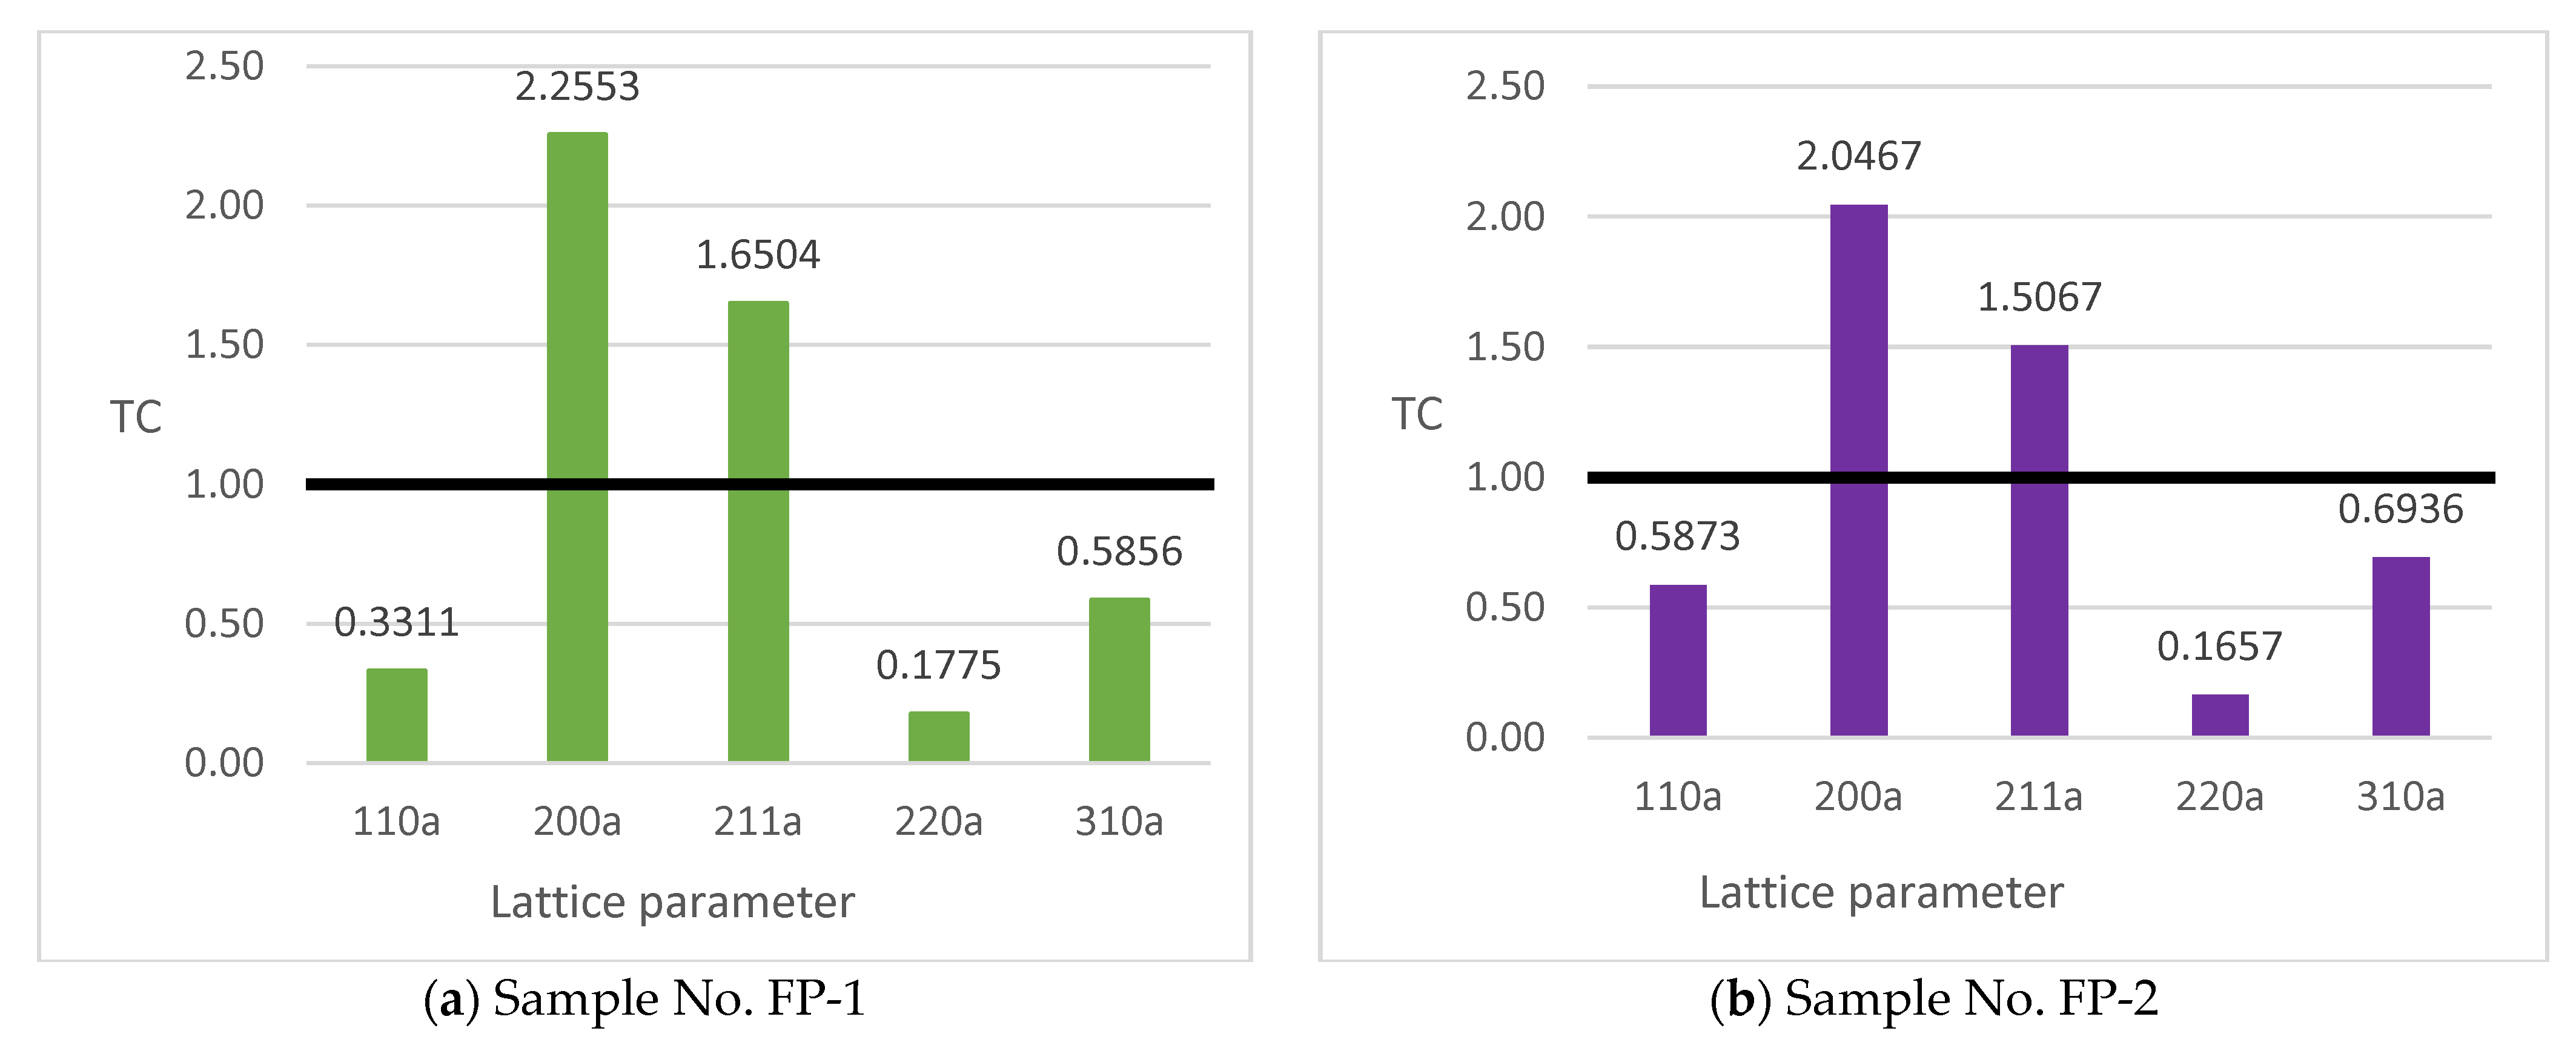
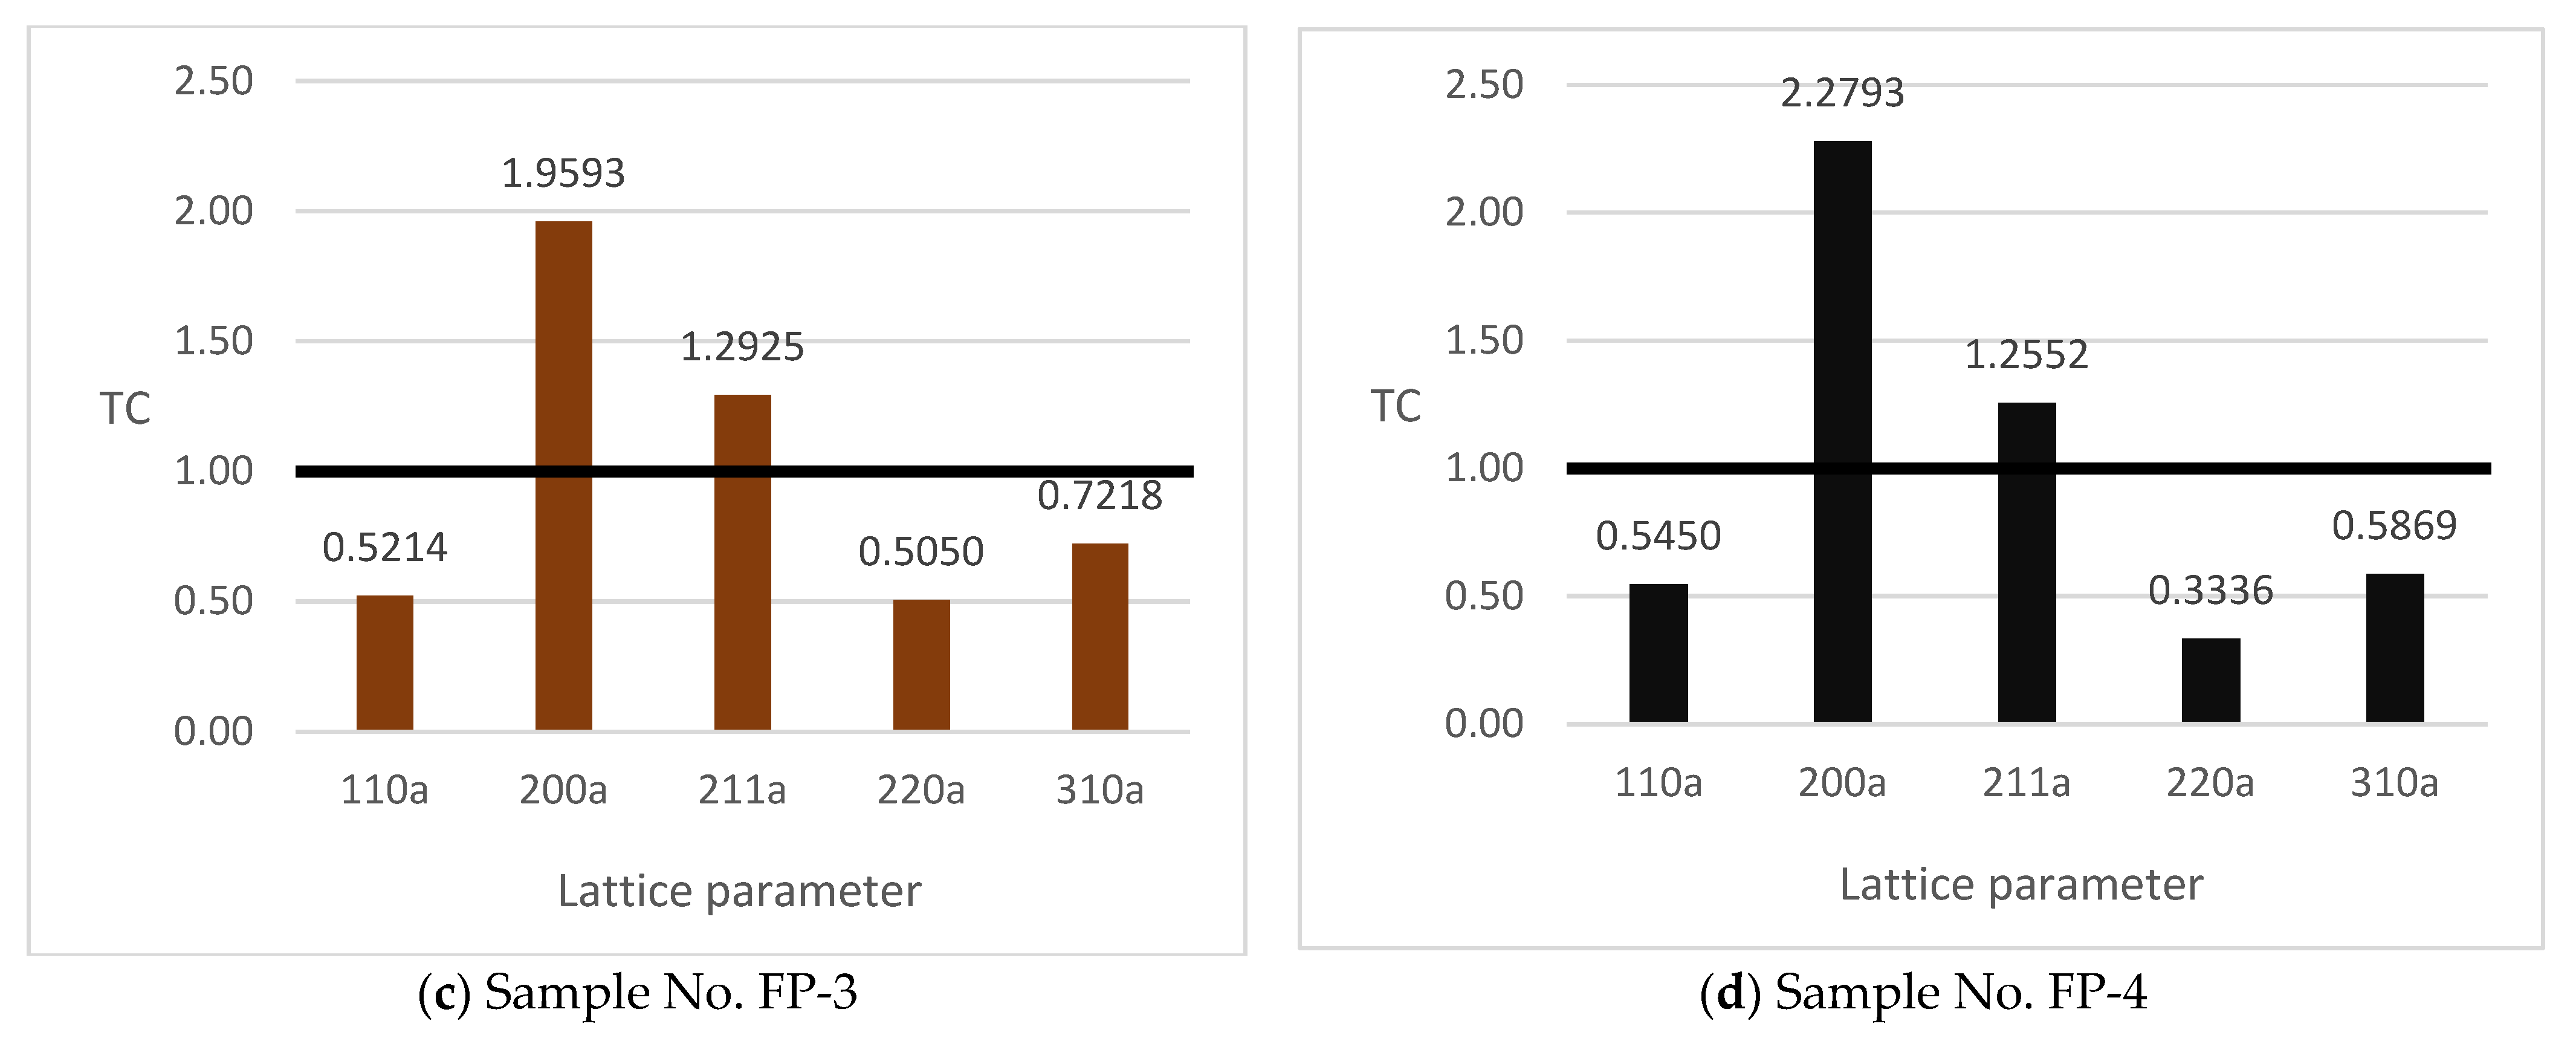
3.2. Analysis of Texture after Hot Rolling Process and Final Production of GOES

When initial columnar grains are rolled to 90% reduction, a strong α-fiber deformation texture takes place [33]. Rolling temperature has also an influence on the texture and microstructure evolution. The texture formed by hot rolling also affects the texture and microstructure evolution during the cold rolling process [34]. The hot rolling process was performed in two stages: initial rolling and finishing rolling realized in six finishing mills. Slabs were heated to 1280 °C–1290 °C and then rolled in the range of the temperature of 1100 °C–980 °C. The thickness of the slab was reduced from 220 mm to 1.8 mm. The hot rolling process brings technical challenges, such as very high rolling temperature and long rolling campaign for the same width of the sheet. Comprehensive measures were taken to solve these problems. Before the hot rolling of GOES steel, all rolls were exchanged; additionally, after rolling of a certain amount of the material, it was necessary to withdraw the rolls for reconditioning. Details of the hot rolling process are given in [35]. To investigate TC after the hot rolling process, five samples were investigated. The tested material was taken from the hot rolling process after coiling. The results of the TC calculation after X-Ray diffraction are shown in Figure 7 and Figure 8.
Samples 1, 3 and 4 show a higher intensity of texture than sample 2. Tests performed for the {211} and {310} planes reveal a weak texture. However, for the {110} group planes, this parameter fluctuates, which indicates the lack of clear texture in relation to the crystallographic planes. In the case of sample 2, it is clearly visible that values of TC do not differ from the black line on the graph, which indicates the lack of texture for a given crystallographic lattice. In these cases, for the {310} crystallographic plane, the TC coefficient was 1.36 and 1.61, which indicates a certain degree of textural intensity of the material. However, taking into account the remaining crystallographic planes, it can be concluded that there is no texture, especially in the direction of easy magnetization {200}. Song et al. [19] also reported that with increasing hot rolling reduction, α and γ fiber textures are enhanced at the expense of the initial solidification texture. At the hot rolling reduction of 5–30%, the Goss texture is very weak in the hot rolled strips, but significantly increases at the hot rolling reduction of 50%. For the grain-oriented silicon steel produced via the conventional route, it is generally understood that the primary Goss grain is inherited from the hot rolled grains via the, “texture memory” mechanism; nevertheless, in the present study, a very weak texture is exhibited in the hot rolled material. Lu et al. also concluded that the weak Goss texture exhibited in hot rolled bands cannot serve as “Goss seeds” [36].
The final product was obtained via performance of the following processes after hot rolling: initial annealing and sheet etching, cold rolling, decarburization annealing and secondary recrystallization high-temperature annealing. Initial annealing and etching of sheet metal is carried out in the temperature range of 900 °C–950 °C to form the microstructure of the material, which also affects the form of the carbide phase. During etching, an oxide layer is removed from the surface of the sheet using a mixture of sulfuric and hydrofluoric acid. Annealed and etched sheets are rolled in two stages of cold rolling. The first stage produces an intermediate thickness of the strip, and the second stage produces a final thickness in the range of 0.23 mm to 0.35 mm. Between the two stages of cold rolling, the sheets are subjected to recrystallization–decarburization annealing, where dislocations generated by plastic deformation during cold rolling are eliminated by primary recrystallization. The second stage of cold rolling again increases the energy of the deformed system, which plays an important role in the process of secondary recrystallization. During the next stage of production process, during recrystallization–decarburization annealing, the steel strip is annealed in a nitrogen–hydrogen atmosphere at a temperature of about 850 °C. In the first stage, the primary recrystallization of the deformed material takes place and the formation of the initial structure for the process of secondary recrystallization in the next stage, leading to the formation of the texture (110) [001]. In the second stage, decarburization of the steel takes place. However, concurrently with the decarburization reaction, there is an oxidation reaction of the silicon contained in the iron. At the end of this process the material is coated with MgO layer and coiled [37,38]. Then, coils are subjected to a high-temperature annealing process at a temperature of up to 1200 °C in a nitrogen–hydrogen atmosphere. During annealing, normal grain growth occurs with the formation of potential nuclei of secondary grains with a Goss texture. Further heating of the material should take place very slowly to allow further development of only those potential secondary grain nuclei that have an orientation closest to the ideal one, i.e., (110) [001], and thus a higher growth rate. After annealing, the texture is dominated by the Goss component [39]. In order to illustrate the texture of the final product that has gone through all processes of grain-oriented electrical steel sheet production, X-ray diffractometric tests for four samples marked FP (final product) was performed. The results of the TC evaluation are summarized in Figure 9. They reveal a strong texture, especially for the {110}, {220} planes, and the reverse for the {200} plane. This indicates that a strong Goss texture is obtained in the final product, which is necessary to achieve the required magnetic properties of grain-oriented electrical sheets. It can be concluded that the strongest Goss texture was obtained for the samples FP-1 and FP-4.

4. Conclusions

The study of X-ray diffraction and the analysis of texture coefficients which may by used to describe the texture intensity in GOES containing 3.1 wt.% of Si after different production steps (after continuous casting, after hot rolling and at the final product state) lead to the following conclusions:
  • The structure of the slab after the continuous casting process is composed of zones of frozen crystals, columnar crystals and equiaxed crystals in the center of the slab. The macrostructure of the slab at the side edges is devoid of an equiaxed crystals area. The crystallographic texture of the slab is strongest in the area of columnar crystals, while it is much weaker in the area of equiaxial crystals.
  • The anisotropy of the magnetic properties is particularly high in the columnar crystal region of the slab structure, while in the region of the equiaxial crystals and the side edges of the slab, the magnetic properties should be considered largely isotropic.
  • The hot-rolling process caused a strong weakening of the material’s crystallographic texture.
  • The process of the production of grain-oriented electrical steel resulted in a very strong texturing coefficient, corresponding to the crystallographic directions and planes for the Goss texture.

Author Contributions

Conceptualization, J.K. and K.Ś.; methodology, M.G. validation, T.Ś. and K.Ś.; formal analysis, J.K. and K.Ś.; investigation, M.G. and K.Ś.; writing—original draft preparation, J.K., K.Ś. and T.Ś.; writing—review and editing T.Ś. and J.K. All authors have read and agreed to the published version of the manuscript.

Funding

The Ministry of the Education and Science financed this work within the fifth edition of the Implementation PhD programme.

Data Availability Statement

The original contributions presented in the study are included in the article material, further inquiries can be directed to the corresponding authors.

Acknowledgments

The authors also thank Adrian Kumorkiewicz for his support in this research.

Conflicts of Interest

The authors declare no conflicts of interest.

References

  1. Liu, Z.; Wang, X.; Yang, P.; Ma, J. Different formation mechanisms of {210}<001> orientation in η fiber texture of ultra-thin grain-oriented silicon steel using quasi-in-situ analysis method. Mater. Chem. Phys. 2022, 278, 125726. [Google Scholar] [CrossRef]
  2. Fang, F.; Zhang, Y.; Lu, X.; Wang, Y.; Cao, G.; Yuan, C.; Xu, Y.; Wang, G.; Mistra, R.D.K. Inhibitor induced secondary recrystallization in thin-gauge grain oriented silicon steel with high permeability. Mater. Des. 2016, 105, 398–403. [Google Scholar] [CrossRef]
  3. Zhu, C.; Liu, Y.; Xiao, Y.; Yan, W.; Li, G. A New Review on Inclusion and Precipitate Control in Grain-Oriented Silicon Steels. Miner. Met. Mater. Soc. 2022, 74, 3141–3161. [Google Scholar] [CrossRef]
  4. Huh, Y.; Jung Hong, J.; Soo Han, M.; Kang, S. Formation mechanism and microstructure of a forsterite film in grain-oriented electrical steel. Thin Solid Film. 2022, 752, 139258. [Google Scholar] [CrossRef]
  5. Wang, Y.; Xu, Y.; Zhang, Y.; Xie, S.; Yu, Y. On abnormal growth of {210}<0 01> grain in grain-oriented silicon steel. Mater. Res. Bull. 2015, 69, 138–141. [Google Scholar] [CrossRef]
  6. Zhou, M.; Zhang, X. Regulating the recrystallized grain to induce strong cube texture in oriented silicon steel. J. Mater. Sci. Technol. 2022, 96, 126–139. [Google Scholar] [CrossRef]
  7. Birosca, S.; Nadoum, A.; Hawezy, D.; Robinson, F.; Kockelmann, W. Mechanistic approach of Goss abnormal grain growth in electrical steel: Theory and argument. Acta Mater. 2020, 185, 370–381. [Google Scholar] [CrossRef]
  8. Kumar Gupta, V.; Kumar Jha, P.; Kumar Jain, P. A novel approach to predict the inclusion removal in a billet caster mold with the use of electromagnetic stirrer. J. Manuf. Process. 2022, 83, 27–39. [Google Scholar] [CrossRef]
  9. Fang, F.; Yang, J.; Zhang, Y.; Wang, Y.; Zhang, X.; Yuan, G.; Misra, R.D.K.; Wang, G. Microstructure and magnetic properties of ultra-thin grain-oriented silicon steel: Conventional process versus strip casting. J. Magn. Magn. Mater. 2021, 535, 168087. [Google Scholar] [CrossRef]
  10. Wang, Y.; Xu, Y.B.; Zhang, Y.X.; Fang, F.; Lu, X.; Liu, H.T.; Wang, G.D. Development of microstructure and texture in strip casting grain oriented silicon steel. J. Magn. Magn. Mater. 2015, 379, 161–166. [Google Scholar] [CrossRef]
  11. Vipul, J.; Pranabananda, M.; Sudipta, P.; Abhijit, G. Origin of Goss texture in grain oriented electrical steel: Role of shear bands. Materialia 2022, 22, 101398. [Google Scholar] [CrossRef]
  12. Wang, Y.P.; An, L.Z.; Song, H.Y.; Wang, G.D.; Liu, H.T. Dependence of recrystallization behavior on initial Goss orientation in ultrathin grain-oriented silicon steels. J. Magn. Magn. Mater. 2020, 499, 166290. [Google Scholar] [CrossRef]
  13. Mishra, S.; Kumar, V. Co-precipitation of copper-manganese sulphide in Fe-3%Si steel. Mater. Sci. Eng. 1995, B32, 177–184. [Google Scholar] [CrossRef]
  14. Imafaku, M.; Suzuki, H.; Akita, K.; Iwata, K.; Fujikura, M. Effects of laser irradiation on iron loss reduction for Fe–3%Si grain-oriented silicon steel. Acta Mater. 2005, 54, 939–945. [Google Scholar] [CrossRef]
  15. Jahangiri, M.R.; Bayani, H.; Ardestani, M.; Mehdizadeh, M. Core loss reduction in grain oriented silicon steel sheets by two-sided laser scribing in the presence of a magnetic field. J. Alloys Compd. 2021, 891, 162080. [Google Scholar] [CrossRef]
  16. Li, H.; Frng, Y.; Song, M.; Liang, J.L.; Cang, D. Effect of normalizing cooling process on microstructure and precipitates in low-temperature silicon steel. Trans. Nonferrous Met. Soc. China 2014, 24, 770–776. [Google Scholar] [CrossRef]
  17. Alcantara, F.L.; Barbosa, R.; Cunha, M.A. Study of Aluminum Nitride Precipitation in Fe-3%Si Steel. Mater. Res. 2013, 16, 1039–1044. [Google Scholar] [CrossRef]
  18. Calvillo, P.R.; Salazar, N.; Schneider, J.; Houbaert, Y. Microstructure Characterization by EBSD of Hot Rolled High-Silicon Steel. In Defect and Diffusion Forum; Trans Tech Publications Ltd.: Bach, Switzerland, 2008; Volume 273, pp. 69–74. [Google Scholar] [CrossRef]
  19. Park, J.Y.; Oh, K.H.; Ra, H.Y. Microstructure and crystallographic texture of strip-cast 4.3wt%Si Steel sheet. Scr. Mater. 1999, 40, 881–885. [Google Scholar] [CrossRef]
  20. Song, H.Y.; Liu, H.T.; Lu, H.H.; Li, H.Z.; Liu, W.Q.; Zhang, Z.M. Effect of hot rolling reduction on microstructure, texture and ductility of strip-cast grain-oriented silicon steel with different solidification structures. Mater. Sci. Eng. A 2014, 606, 260–269. [Google Scholar] [CrossRef]
  21. Zaveryukha, A.; Davis, C. An investigation into the cause of inhomogeneous distributions of aluminium nitrides in silicon steels. Mater. Sci. Eng. 2003, A345, 23–27. [Google Scholar] [CrossRef]
  22. Han, C.H.; Kwon, S.J. Effect of Nitrogen on the size and Distribution of ALN precipitates in 3% Silicon Steel. Scr. Mater. 1996, 34, 543–549. [Google Scholar] [CrossRef]
  23. Hauk, V. Structural and Residual Stress Analysis by Nondestructive Methods: Evaluation-Application-Assessment; Elsevier: Amsterdam, The Netherlands, 1997. [Google Scholar]
  24. Wagner, J.N.; Hofmann, M.; Wimpory, R.; Krempaszky, C.; Stockinger, M. Microstructure and temperature dependence of intergranular strains on diffractometric macroscopic residual stress analysis. Mater. Sci. Eng. A 2014, 618, 271–279. [Google Scholar] [CrossRef]
  25. Stylianou, R.; Tkadles, M.; Schalk, N.; Penoy, M.; Czettl, C. Effects of reference materials on texture coefficients determined for a CVD α-Al2O3 coating. Surf. Coat. Technol. 2019, 359, 314–322. [Google Scholar] [CrossRef]
  26. Neslušan, M.; Minárik, P.; Čep, R.; Ondruš, J.; Pitoňák, M.; Zgútová, K. Measurement of bearing capacity of steel road barrier flange via Barkhausen noise emission. Eng. Fail. Anal. 2024, 156, 107804. [Google Scholar] [CrossRef]
  27. Dong, H.; Liu, X.; Song, Y.; Wang, B.; Chen, S.; He, C. Quantitative evaluation of residual stress and surface hardness in deep drawn parts based on magnetic Barkhausen noise technology. Measurement 2021, 168, 108473. [Google Scholar] [CrossRef]
  28. Pacyna, J.; Kokosza, A. Residual Stress Measurement in Steel Mill Rolls Using Magnetic Barkhausen Noise Analysis. J. Nondestruct. Test. Ultrason. 1999, 4, 8. [Google Scholar]
  29. Tavakoli, R.; Pourfathi, A. Thermal optimization of secondary cooling systems in the continuous steel casting process. Int. J. Therm. Sci. 2023, 183, 107860. [Google Scholar] [CrossRef]
  30. Shao, Y.Y.; Yang, P.; Fu, Y.J.; Mao, W.M. Texture evolution of columnar grains in electrical steel During Hot rolling. J. Iron Steel Res. Int. 2013, 20, 99–106. [Google Scholar] [CrossRef]
  31. Nadoum, A.; Robinson, F.; Birosca, S. On the correlation between magnetic domain and crystallographic grain orientation in grain oriented electrical steels. J. Magn. Magn. Mater. 2020, 494, 165772. [Google Scholar] [CrossRef]
  32. Szewczyk, R.; Nowicki, M.; Ostaszewska-Liżewska, A.; Bieńkowski, A.; Nowak, P.; Malinem, M. Accuracy of frame-shaped samples based measurements of magnetoelastic characteristics of soft magnetic materials. Measurement 2020, 162, 107899. [Google Scholar] [CrossRef]
  33. Zhang, N.; Yang, P.; Mao, W. {001}〈120〉−{113}〈361〉 recrystallization textures induced by initial {001} grains and related microstructure evolution in heavily rolled electrical steel. Mater. Charact. 2016, 119, 225–231. [Google Scholar] [CrossRef]
  34. Du, Y.; O’Malley, R.; Buchely, M. Review of Magnetic Properties and Texture Evolution in Non-Oriented Electrical Steels. Appl. Sci. 2023, 13, 6097. [Google Scholar] [CrossRef]
  35. Ścibisz, K.; Kaźmierski, T.; Krawczyk, J. A Roll’s wear during hot rolling of high-silicon steel and its impact on the quality of a strip’s profile. Tribologia 2023, 3, 95–102. [Google Scholar] [CrossRef]
  36. Lu, X.; Xu, Y.; Fang, F.; Zhang, Y.; Jiao, H.; Cao, G.; Li, C.; Yuan, G.; Wang, G. Microstructure, texture and precipitate of grain-oriented 4.5 wt %Si steel by strip casting. J. Magn. Magn. Mater. 2016, 404, 230–237. [Google Scholar] [CrossRef]
  37. Ramanathan, S. Study of Dislocations from Continuous Flattening Anneal and Its Effect on Magnetic Properties of Grain Oriented Electrical Steel; Cardiff University: Cardiff, UK, 2013. [Google Scholar]
  38. Wodzyński, A.; Suliga, M.; Chwastek, K. Grain-oriented steels for use in electrical engineering—Chosen issues. Pr. Inst. Elektrotechniki 2014, 267, 159–173. [Google Scholar]
  39. Wang, Y.; Xu, Y.B.; Zhang, Y.X.; Fang, F.; Lu, X.; Mistra, R.D.K.; Wang, G.D. Effect of annealing after strip casting on texture development in grain oriented silicon steel produced by twin roll casting. Mater. Charact. 2015, 107, 79–84. [Google Scholar] [CrossRef]
Figure 1. Sample of the slab after etching marked with a grid.
Crystals 14 00107 g001
Figure 2. Individual zones of steel crystals related to the crystallization of the slab.
Crystals 14 00107 g002
Figure 3. Analysis of texture for the sample No. 1 from LCCZ zone: (a) X-ray diffraction pattern (b) TC parameter calculation.
Crystals 14 00107 g003
Figure 4. Analysis of texture for the sample No. 2 from LCCZ zone: (a) X-ray diffraction pattern; (b) TC parameter calculation.
Crystals 14 00107 g004
Figure 5. Analysis of texture for the sample No. 3 from LCCZ zone: (a) X-ray diffraction pattern; (b) TC parameter calculation.
Crystals 14 00107 g005
Figure 6. Analysis of texture for the sample from ECZ zone: (a) X-ray diffraction pattern; (b) TC parameter calculation.
Crystals 14 00107 g006
Figure 7. TC calculation for the hot rolled specimens after polishing: (a) sample No. 1; (b) sample No. 2.
Crystals 14 00107 g007
Figure 8. TC calculation for the hot rolled specimens without polishing: (a) sample No. 3; (b) sample No. 4.
Crystals 14 00107 g008
Figure 9. TC calculation for the final product specimens: (a) sample No. FP-1 polished, (b) sample No. FP-2 polished, (c) sample No. 3 without polishing, (d) No. 4 without polishing.
Crystals 14 00107 g009aCrystals 14 00107 g009b
Table 1. Chemical composition of the investigated material.
ElementsCMnSiSCuFe
Nominal content0.028–0.0400.22–0.303.00–3.25max. 0.0070.048–0.55bal.
Table 2. Barkhausen noise measurements results (MP)—direction parallel to the slab cross-section side edge. Black lines reflect the contact of columnar crystals growing from the top and from the bottom of the continuous ingot.
Crystals 14 00107 i001
Table 3. Barkhausen noise measurements results (MP)—direction perpendicular to the slab cross-section side edge. Black lines reflect the contact of columnar crystals growing from the top and from the bottom of the continuous ingot.
Crystals 14 00107 i002
Disclaimer/Publisher’s Note: The statements, opinions and data contained in all publications are solely those of the individual author(s) and contributor(s) and not of MDPI and/or the editor(s). MDPI and/or the editor(s) disclaim responsibility for any injury to people or property resulting from any ideas, methods, instructions or products referred to in the content.

