Article

Relative Cooperative Effects of Non-Covalent Interactions on Hydrogen Bonds in Model Y…HCN/HNC…XF Trimers (Y = FB, OC, N2, CO, BF; XF = HF, LiF, BeF2, BF3, ClF, PH2F, SF2, SiH3F)

by
Sean A. C. McDowell
* and
Kodi A. Edwards
Department of Biological and Chemical Sciences, The University of the West Indies, Cave Hill Campus, Bridgetown BB11000, Barbados
*
Author to whom correspondence should be addressed.
Crystals 2024, 14(2), 111; https://doi.org/10.3390/cryst14020111
Submission received: 30 November 2023 / Revised: 16 January 2024 / Accepted: 21 January 2024 / Published: 24 January 2024
(This article belongs to the Section Inorganic Crystalline Materials)

Abstract

:
A computational study of model Y…HCN/HNC (Y = FB, OC, N2, CO, BF) dimers was undertaken to assess the effect on the Y…H hydrogen bond when the Lewis base Y is systematically varied, while another model study of HCN/HNC…XF (XF = HF, LiF, BeF2, BF3, ClF, PH2F, SF2, SiH3F) dimers was undertaken to compare the relative binding strengths of the various types of noncovalent interactions between HCN/HNC and the fluorinated Lewis acid XF. The X atoms represent elements that span Groups 1–2 and 13–17 of the periodic table. The optimized trimers Y…HCN/HNC…XF that result from the combined dimer pairs were then studied in order to assess the relative strengths of the cooperative effects of the noncovalent N…X or C…X interactions on the Y…H hydrogen bond. The properties computed for the dimers and trimers include interaction energies, intermolecular separations, bond length changes, vibrational frequencies and their infrared intensity enhancements.

1. Introduction

Noncovalent interactions, which span a wide range of bonding strengths, have been studied for many years, with the hydrogen bond being the most extensively studied of these important types of interactions [1,2,3,4]. Hydrogen bonds provide the attractive forces between electron-rich sites on a proton acceptor Y and a proton donor (HZ) in a generic Y…HZ interaction. Though hydrogen bonding has been studied now for more than a century, it continues to be a fascinating research topic and remains relevant as a focus of theoretical and experimental studies [5,6,7,8,9,10,11,12,13,14,15].
Other types of noncovalent bonds have been recognized and classified over the last few decades, including lithium, beryllium, and halogen bonds, the study of which have deepened our knowledge and understanding of an increasingly wide range of possible inter-, and intra-molecular modes of binding molecules together in new, and potentially useful, molecular frameworks and structures.
Halogen bonding was characterized and recognized about 15 years ago as an important noncovalent interaction and its extensive study since then has led to an explosion of interest in a wide range of similar interactions [16]. The replacement of the bridging H atom in Y…H-Z by a halogen (X), leads to an attractive Y…X-Z interaction between the Lewis base Y and the halogen similar, in some regards, to a hydrogen bond. This interaction is possible since the anisotropic charge distribution on the halogen atom gives rise to an electron-deficient region along the extension of the covalently-bonded X in X-Z and opposite to the Z atom or group. This positive region along the covalent bond extension, which results from the greater electron-withdrawing ability of Z relative to X, now commonly referred to as the σ-hole, is attracted to the electron-rich region(s) on the Lewis base Y [16,17].
Halogen bonds are now considered as a subset of the broader category of σ-hole bonds, where the bridging atom X is an atom from a particular group on the right side of the periodic table and gives rise to analogous noncovalent bonds; namely, tetrel (group 14), pnicogen (group 15), chalcogen (group 16) and halogen (group 17) bonds. The relative strengths of these various types of σ-hole bonds, relative to the hydrogen bond, have been reported before. For example, halogen bonding has been compared to hydrogen bonding [18,19,20,21,22,23]; pnicogen bonding to hydrogen bonding [18,24,25,26]; chalcogen and tetrel bonding to hydrogen bonding [18,24,25,27,28,29].
It appears, however, that not much has been reported concerning the relative strength of each bond solely in relation to each other. As far as we are aware, the first study to explore the relative strengths of the σ-hole bonded complexes involving the group 14–17 atoms of the periodic table was published in a 2018 paper [18]. This study investigated the interactions of period 4 elements (Ge, As, Se, Br) with ammonia and compared their energies and geometries. It was found that fluorinated Lewis acids (with F opposite to N) interacted with ammonia to give the following energetic stability trend: halogen > chalcogen > pnicogen > tetrel, with variations in charge transfer, molecular electrostatic potentials and atoms in molecules (AIM) parameters closely related to the energetic stability trend [18].
Another particularly interesting feature of hydrogen bonding, shared with other noncovalent interactions, is its cooperativity [4]. Usually, the bonds in a hydrogen-bonded chain grow stronger with the addition of new molecules, so there is a nonadditive enhancement (a positive cooperative effect) in the hydrogen bond due to a second hydrogen bond either with a proton donor or proton acceptor. A diminutive or negative cooperative effect is also possible if the central molecule of a chain of molecules acts as a double proton acceptor [4].
Cooperativity is important in studies on molecular recognition and supramolecular chemistry, given that such research will likely involve molecular systems with multiple noncovalent interactions acting together [30,31,32]. Cooperativity in hydrogen bonding has been extensively investigated for many years both experimentally and theoretically [4,6,32,33,34,35,36,37,38]. For example, Stone et al. showed that a good description of the nonadditive effects in linear HCN clusters can be obtained by an electrostatic treatment, taking induction forces into account [33].
In more recent years, the cooperativity between other types of noncovalent interactions has been documented [39,40]. For example, there have been reports of positive cooperativity in tetrel-bonded complexes [31], pnicogen-bonded complexes [41,42,43], as well as a recent paper on the cooperativity between hydrogen bonds and tetrel bonds, leading to the transformation of a noncovalent C…N tetrel bond to a covalent bond [29].
The three main objectives of the present work are:
(i)
to examine the relative changes in selected geometric and spectroscopic properties of model linear hydrogen-bonded Y…HCN/HNC dimers, where Y denotes the diatomic isomers BF, CO and N2. The strength of the Y…H hydrogen bond can be modulated by systematically varying the relative orientation of the Y dipole moment, from FB to OC to N2 (favorably aligned with the HCN/HNC dipole), to CO and BF (opposite direction to the HCN/HNC dipole),
(ii)
to compare the relative binding strengths and selected geometric and spectroscopic properties of model HCN…XF and HNC…XF dimers, where XF denotes a set of Lewis acids chosen such that each atom X represents a different group of the periodic table, and thus, a different type of noncovalent C…X or N…X intermolecular interaction. The intermolecular interactions can be broadly categorized as either (a) donor-acceptor, (b) H- or Li-bonded or (c) σ-hole bonded,
(iii)
to assess the cooperative effect of the Y…H and C/N…X noncovalent interactions in the Y…HCN…XF and Y…HNC…XF trimers, with HCN or HNC acting simultaneously as a Lewis acid (electron acceptor) and a Lewis base (electron donor).
We are especially interested in assessing the extent to which the different noncovalent interactions (due to XF) enhance the Y…H hydrogen bond in the trimer in relation to their relative strengths. In other words, which N…X or C…X interactions have the most significant cooperative effects on the Y…H hydrogen bond and which molecular parameters are most sensitive to these cooperative effects? Furthermore, do the cooperative effects scale with the relative strength of the particular N…X or C…X interactions? The present study aims to answer these questions.
The linear isomeric HCN and HNC triatomics were chosen for the present study because they can act simultaneously as Lewis acids and Lewis bases when sandwiched between the terminal Y and XF molecules, and since both triatomics are highly polar, they can form moderately strong noncovalent interactions. These molecules are ideal for exploring the cooperativity between the hydrogen bond and the other types of noncovalent interactions in the model Y…HCN/HNC…XF trimers, as well as in assessing, directly and indirectly, the relative strengths of the N/C…X noncovalent interactions. Though the findings from the present study relate to binary and ternary gas-phase structures, we nevertheless believe that they may possibly provide insight into the effect of noncovalent interactions in larger clusters, including crystal structures, where these types of noncovalent interactions are operative.
HCN is capable of forming long linear chains, involving numerous hydrogen bonds and both experimental and theoretical information are available about the monomer, dimer, trimer, and larger clusters, including crystalline HCN. For example, large linear clusters have been reported in superfluid helium [44] and infinitely long linear chains, with C…N separations of 3.18 Å, have been recorded for solid HCN [45]. The study of aggregates or clusters of HCN is particularly important as their well-defined structures have been considered as possible precursors to amino acids and nucleic acids [46], with implications in fields ranging from astrophysics to biology. Theoretical studies of clusters of HCN and HNC have been documented before, for example, computed properties of (HCN)n, up to n = 10, as well as of (HNC)n were reported in the literature [47,48,49].
The computational methodology employed in this study is outlined in the next section.

2. Computational Methodology

The Gaussian 09W suite of programs [50] was used to perform all calculations at the MP2/6-311++G(2d,2p) level of theory on the Y…HCN/HNC (Y = FB, OC, N2, CO, BF) and HCN/HNC…XF (XF = HF, LiF, BeF2, BF3, ClF, PH2F, SF2 AND SiH3F) dimers, the Y…HCN/HNC…XF trimers, and all the monomers. Density functional theory (DFT) computations using the M062x functional with the 6-311++G(2d,2p) basis set were also employed to compute the geometries and properties of the binary Y…HCN and Y…HNC complexes in order to compare this particular functional with MP2. All species were first optimized on their respective potential energy surfaces, without the need for stringent convergence parameters (e.g., opt = tight keyword in Gaussian) to achieve convergence to minima. Harmonic vibrational frequency calculations were then computed for these optimized structures, at the same level of theory, using the analytical second-derivatives procedure available in the Gaussian program in order to confirm that the optimized structures were indeed true minima, by the absence of any imaginary frequencies.
The interaction energy ∆E for the complexes was calculated as the difference between the total energy of the complex, whether dimer or trimer, and the sum of the energies of the individual monomers (at the geometries they adopt in the optimized complex). For example, ∆E(Y…HCN) = EY…HCN − (EY + EHCN) and ∆E(Y…HCN…XF) = EY…HCN…XF − (EY + EHCN + EXF), where EY…HCN and EY…HCN…XF represent, respectively, the total energies of the dimer and trimer, and EY, EHCN and EXF, represent the energies of the individual monomers computed at the geometries they adopt in the optimized complexes.
The other computed properties of the optimized complexes include the intermolecular separation (R), selected bond length changes (Δr = rcomplex − rmonomer), the harmonic frequency shift of selected vibrational modes (Δω = ωcomplex − ωmonomer) and the infrared intensity enhancement ratio (I/I0) of these vibrational modes, relative to the uncomplexed monomer, where I denotes the infrared intensity in the complex and I0 the infrared intensity in the monomer.
Table 1 compares the computed parameters for the Y…HCN and Y…HNC dimers at both MP2 and M062x levels of theory, while Table 2 compares the parameters for the HCN…XF and HNC…XF dimers, computed at MP2 only. Data for the Y…HNC…XF and Y…HCN…XF trimers with Y = FB or BF computed at MP2 are shown in Table 3 and Table 4, respectively, while Figure 1 shows the typical optimized geometries for selected trimers. It should be noted that all Y…HCN/HNC dimers are linear and the linear (non-linear) HCN/HNC…XF dimers also give rise to correspondingly linear (non-linear) Y…HCN/HNC…XF trimers.
Generally, the energetic cooperativity in a trimer a-b-c composed of monomers a, b and c may be assessed by computing the nonadditive energy (Enonadd) as Enonadd = ∆E − (∆Eab + ∆Ebc), where ∆E = Eabc − (∆Eab + ∆Ebc), ∆Eab = Eab − (Ea + Eb) and ∆Eac is assumed to be negligible; Eabc, Eab and Ea represent, respectively, the energies of trimer abc, dimer ab and monomer a. The nonadditive energies for the FB/BF…HNC…XF trimers, relative to the FB/BF…HNC and HNC…XF dimer pairs were computed using this scheme and the results are included in Table 3, with the corresponding nonadditive energies for the FB/BF…HCN…XF trimers in Table 4. We note a previous study of Y…HCN…HCN and NCH…Y…HCN trimers, involving the same isoelectronic Y set of diatomics, where a positive cooperative effect of the hydrogen bond was observed in the former and a negative cooperative (or diminutive) effect was observed in the latter [51]. For all of the trimers studied here, involving both HCN and HNC molecules, only positive cooperative effects are evident.

3. Discussion

3.1. Y…HCN and Y…HNC Dimers

Table 1 shows that the binding strength decreases from FB…HCN/HNC to BF…HCN/HNC, consistent with the decrease in the magnitude of the Y dipole going from FB (0.945 D) to OC (0.269 D), where the FB or OC dipoles are favorably aligned with the HCN (3.020 D) or HNC (3.280 D) dipoles, to the nonpolar N2, and then from CO to BF, where the dipoles now point in the opposite direction to the HCN/HNC dipoles. Hence, the dipole-dipole electrostatic contribution to the total interaction energy increases in the order BF < CO < N2 < OC < FB, which is also the order expected for the induction forces, which depend mainly on the increasing strength of the electric field arising from the Y dipole.
The intermolecular Y…H separation, on the other hand, does not decrease with increasing ∆E, but instead reflects the increasing Y atomic radius going up the table (i.e., Y = F < O < N < C < B). However, the increasing frequency shift, and corresponding amplification of the infrared intensity of the H-C or H-N stretching mode does reflect the increasing intermolecular interaction of the Y dipole. Generally, the H-C (H-N) frequency is increasingly red-shifted as the attractive forces between the monomers are strengthened going up the table, reaching a maximum of −79 cm−1 (FB…HCN) and −239 cm−1 (FB…HNC).
Consistent with the increasing red shift is the infrared intensity enhancement (I/I0) and the lengthening of the H-C/H-N bond, both of which increase monotonically with binding strength (due to the increasing magnitude of the Y dipole and its favorable orientation, relative to the HCN/HNC orientation). It should be noted that a small blue shift (3 cm−1 at MP2) is obtained for BF…HCN, reflecting the fact that the B F+ dipole opposes the HCN dipole (directionally), forcing the H atom away from F, more than in the other complexes, and thereby increases the H-C stretching frequency. This interaction also does not significantly change the H-C bond length of HCN in this dimer, according to the MP2 computation. The blue shift is not evident in the corresponding BF…HNC analog because the larger HNC dipole would produce a larger induced dipole in BF, offsetting the repulsive effect of the opposed BF and HNC dipoles—the corresponding H-N stretch is red-shifted by 11 cm−1 (at MP2).
HNC has a larger dipole moment than HCN, and therefore, yields more strongly bound complexes, as is evident from the data in Table 1. Though the M062x results are in fair agreement with the corresponding MP2 data for the Y…HNC dimers, M062x incorrectly predicts blue-shifted H-C stretching frequencies and contracted H-C bonds in the Y…HCN dimers, opposite to the MP2 results. The other computed parameters (∆E, R(Y…H) and I/I0), on the other hand, show similar trends to those predicted by MP2. The failure of this DFT functional to correctly predict the bond length change and frequency shift in the HCN dimers prompted us to restrict the subsequent computations to MP2 only (in Table 2, Table 3 and Table 4) for greater reliability.
Since the H-C bond length changes and the frequency shift of its vibration depends to a large extent on the net forces acting on the H-C bond due to complexation (both their direction and magnitude), it is perhaps likely that the M062x functional is incorrectly modeling this particular physical parameter. Interestingly, the I/I0 values for the two methods are in fair agreement, with the same trends evident with increasing interaction energy. Since the infrared intensity is proportional to the square of the dipole derivative with respect to H-C bond length change, then its enhancement is a sensitive indicator of electron density changes between the H and C atoms of this bond, due to the electric field of Y and/or its orbital interaction with HCN.

3.2. HCN…XF and HNC…XF Dimers

In Table 1, HCN and HNC act as Lewis acids when complexed with Y. In Table 2, these molecules now act as Lewis bases (via N in HCN…XF and C in HNC…XF), with the selected XF Lewis acids chosen such that a range of different noncovalent N…X or C…X interactions can be investigated and compared (using the common Lewis base). The X atoms of XF represent main-group elements from Groups 1 to 17 of the periodic table; namely, Group 1 (H, Li), Group 2 (Be), Group 13 (B), Group 14 (Si), Group 15 (P), Group 16 (S) and Group 17 (Cl).
The optimized HCN…XF and HNC…XF dimers in Table 2 are arranged with their interaction energies increasing going up the table (for a fixed Lewis base), with the ΔE values showing the relative magnitude of the N…X and C…X noncovalent interactions. These complexes may be conveniently grouped into three main categories: (a) H- or Li-bonded dimers, (b) donor-acceptor dimers (Be- and B-bonded) and (c) σ-hole bonded dimers. The σ-hole bonded dimers can be further subdivided into tetrel-bonded (X = Group 14 element), pnicogen-bonded (Group 15), chalcogen-bonded (Group 16) and halogen-bonded (Group 17).
Table 2 shows that the magnitude of the intermolecular binding strength for these three categories generally increases in the order: σ-hole bonded < H/Li-bonded < donor-acceptor, though halogen-bonded complexes from the latter category can sometimes be as strong as or even stronger than H- or Li-bonds (e.g., the HNC…ClF interaction energy is larger in magnitude than that of both HNC…HF and HNC…LiF). Also, the donor-acceptor complex HCN…BF3 has an anomalously small interaction energy (30 kJ/mol), which is comparable with those of the σ-hole category, but this particular complex only realizes its full donor-acceptor capability when it is in the solid, rather than the gas phase.
The HNC…XF dimers are more strongly bound than their HCN…XF analogs because HNC has a larger dipole moment than HCN. Interestingly, the smaller intermolecular N…X separation in the HCN complexes of HF, LiF, BeF2, SF2 and SiH3F, compared with their HNC counterparts would suggest otherwise. The shortest intermolecular separation for the HCN…XF dimers is in the complex of the electron-deficient BeF2 molecule, which allows the closest contact due to the reduced interatomic repulsion between the N and X atom, vis-à-vis the other dimers; BF3 is also electron-deficient, but its complex with HCN is anomalous, as mentioned before. The large deviation (by 19°) of the N…Be-F angle from 90° also indicates strong binding, as the undistorted linear BeF2 molecule would be perpendicular to the HCN molecular axis. The reduced electron density around the proton of HF allows it to approach the N atom in HCN…HF quite closely such that it has the second shortest separation, followed by the LiF species, whose intermolecular distance is restricted by the repulsion between the N lone pairs and the Li 1s core electrons, despite LiF being the most polar Lewis acid.
For the σ-hole bonded dimers, the N…X separation is much larger (2.5–3.0 Å), indicating relatively weaker binding, ranging between 17 and 25 kJ/mol in magnitude (compared with the other two categories). The intermolecular N…X-F angle is linear or close to linearity, except for HCN…PH2F, where the 17° deviation of the N…P-F angle from linearity allows the N and the P lone pairs to minimize their mutual intermolecular repulsion (see optimized structure in Figure 1).
The order of binding strength for these dimers is halogen > pnicogen > chalcogen > tetrel, which is in agreement with the energy ordering reported by Dong et al., at the upper and lower ends, but with the chalcogen found to be stronger than pnicogen binding [18]. The X-F bond extension generally scales with the binding strength and ranges between 0.010 and 0.034 Å, except in HCN…BF3, where the B-F bond is extended by only 0.004 Å.
The spectroscopic changes associated with the X-F and H-C stretching frequencies on complexation in HCN…XF are revealing. The H-C red shifts are largest for the most strongly bound complexes (BeF2 and LiF) and negligibly small for HF, BF3 and the σ-hole complexes, ranging in magnitude between 1.8 and 3 cm−1, which may make these complexes difficult to distinguish from each other on the basis of their frequency shifts. On the other hand, the infrared intensity enhancement ratio I/I0 appears to be strongly correlated with the interaction energy, especially for the σ-hole complexes (taken together). For example, Table 2 shows that I/I0 increases monotonically over a narrow range between 1.23 (SiH3F) and 1.36 (ClF) for the σ-hole bonded dimers; even though the difference between the I/I0 values over this range is small, and therefore, possibly difficult to distinguish between these intensities experimentally, our theoretical results, nevertheless, show a clear trend.
It should be noted that correlations between the binding strength and various hydrogen-bond parameters have been reported in the literature before; for example, between spectroscopic and crystallographic data on hydrogen bonds in solids [52] and, of more relevance to the present work, a study validating a relationship showing a direct proportionality between the enthalpy of formation of a hydrogen bond and the intensity enhancement of the infrared proton stretching vibration [53].
The variation in the X-F red shift is similar to that for the H-C red shift, except that HF has by far the largest red shift (269 cm−1) due to the hydrogen bonding of its relatively light proton. The X-F red shift in the σ-hole bonded dimers generally increases with interaction energy, though there is a decrease in the red shift going from HCN…SiH3F to HCN…SF2, but which increases as we progress to the more strongly bound representatives. I/I0 for the X-F stretching frequency also varies more erratically.
It thus appears, that for the H-CN…X-F dimer, the infrared intensity enhancement of the vibrational mode not directly involved in the intermolecular bonding (i.e., H-C) shows a clearer trend of increasing with binding strength than the corresponding trend for the intensity enhancement of the vibrational mode of the bond directly involved in the interaction (i.e., X-F).
The trends for the HNC…XF dimers are similar to those identified for the HCN…XF dimers, with the computed parameters generally larger in magnitude since the former is more strongly bound than the latter—we compare the corresponding values in Table 2. The intermolecular separation in these complexes is, however, not a good indicator of their binding strengths relative to their HCN counterparts since they are mostly larger in magnitude. On the other hand, the XF bond extensions, which range in magnitude between 0.013 and 0.217 Å, correlate well with the interaction energies, especially for the σ-hole bonded complexes.
Three pronounced differences between individual HNC and HCN dimers are notable:
(i)
The H-N and H-F stretching modes in HNC…HF are coupled, leading to an anomalously small red shift of the H-N stretching mode and a large diminution of its infrared intensity (I/I0 < < 1). No other complex shows coupling of the intramolecular H-N/H-C and X-F vibrational modes or a decrease in their infrared intensities;
(ii)
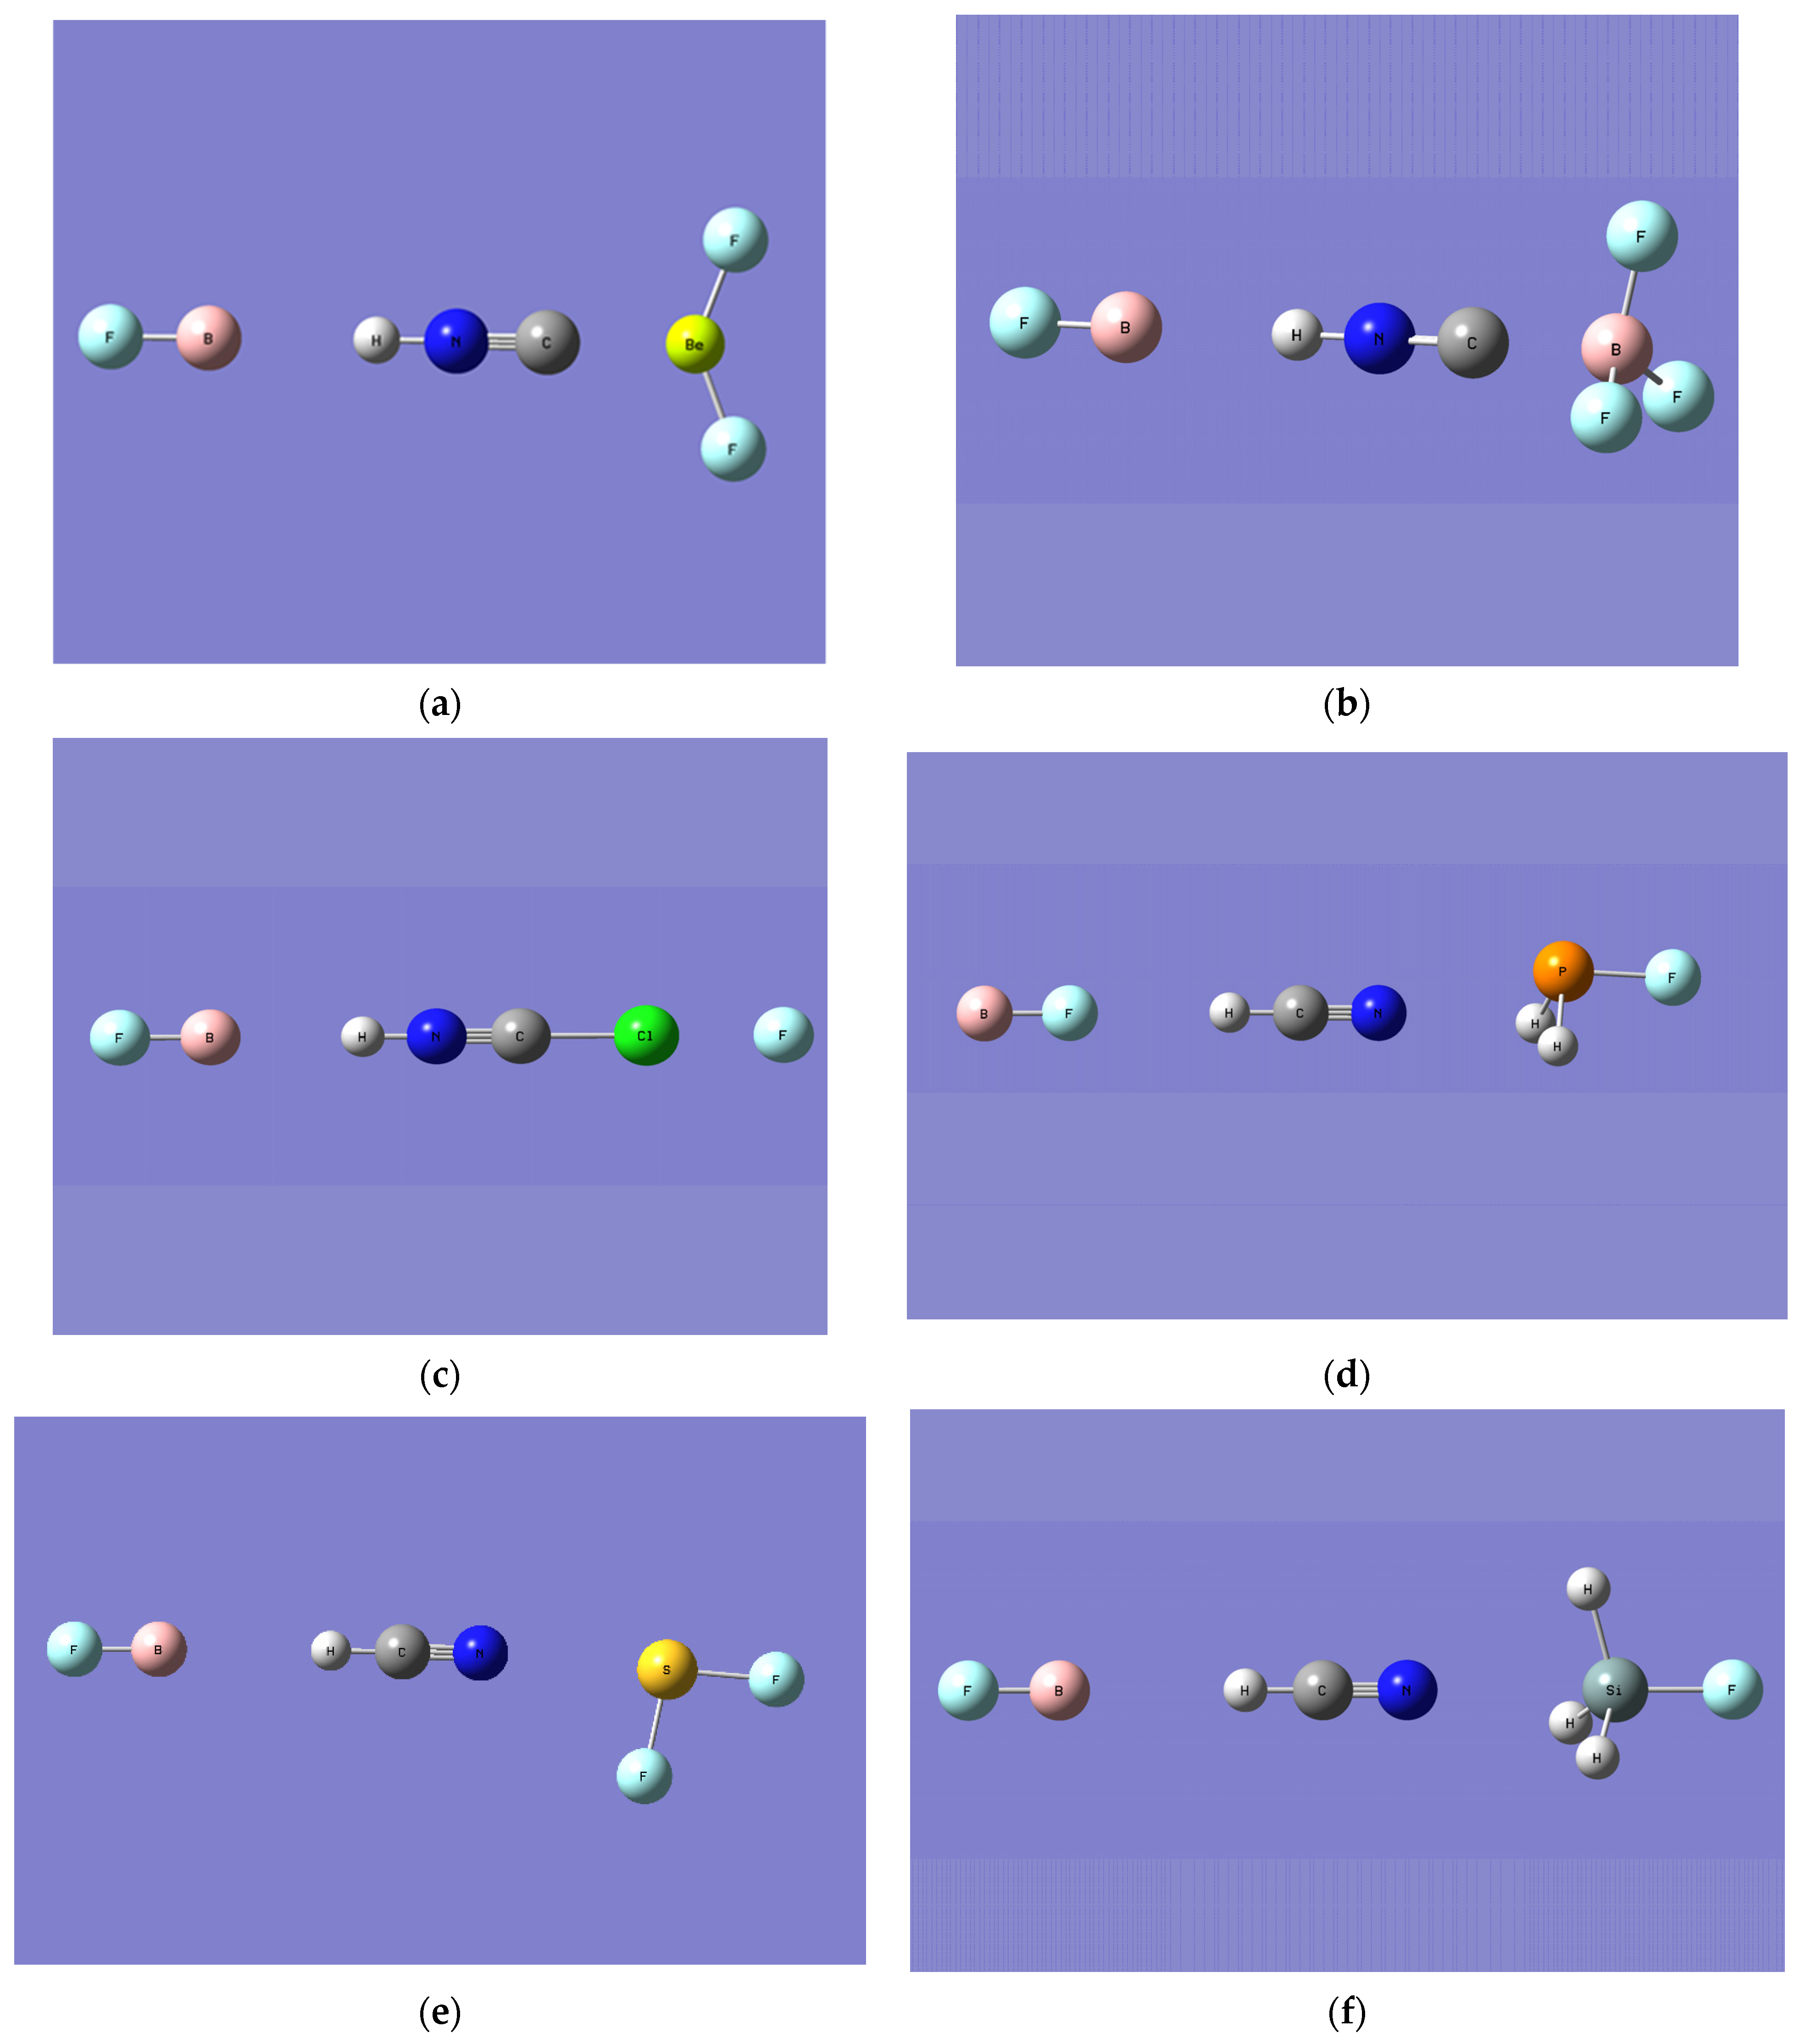
HNC…BF3 is the second most strongly bound complex, with a C…B-F angle of 102°, indicating a 12°deviation from the planarity of the BF3 subunit on complexation with HNC (see Figure 1). By comparison, HCN…BF3 is more than 70 kJ/mol less strongly bound and the corresponding N…B-F angle is 93°, indicating a BF3 deviation of only 3° from planarity.
(iii)
HNC…ClF is much more strongly bound than HCN…ClF (by 61 kJ/mol) and the significant Cl-F bond extension of 0.2 Å suggests that the halogen bond between the monomers facilitates the transfer of the Cl from ClF to HNC; by contrast, there is little evidence of corresponding Cl transfer in HCN…ClF, where the Cl-F bond is elongated by only 0.018 Å.
The H-N and X-F spectroscopic changes in HNC…XF are somewhat similar. The H-N and X-F frequency red shifts are larger in HNC than in the corresponding HCN complexes, with both the red shift and infrared intensity enhancement of the H-C stretching frequencies increasing monotonically with binding strength for the σ-hole bonded dimers. However, the variation in the red shift and infrared intensity enhancement of the X-F stretch for the σ-hole bonded dimers is less straightforward and both parameters vary erratically as the binding strength increases. As noted above for the H-CN…X-F complexes, the infrared intensity enhancement of the vibrational mode not directly involved in the intermolecular bonding in H-NC…X-F (i.e., H-N) is more closely correlated with increased intermolecular binding than the intensity enhancement of the X-F stretching mode.
As mentioned above, the pronounced changes in HNC…ClF are manifested in the significantly larger values for all four spectroscopic parameters shown in Table 2, compared to the other three σ-hole bonded complexes. The red shifts of the H-C stretches in the LiF, BeF2 and BF3 complexes of HNC are similar in magnitude (ranging between 27 and 30 cm−1), whereas the infrared intensity enhancements in the BeF2 and BF3 complexes are similar (1.45–1.55) but distinctly larger than the corresponding value for the LiF complex (1.29).

3.3. YZ…HNC…XF Trimers

Table 3 shows the values for the computed parameters of the optimized trimers formed by sandwiching HNC between FB/BF (the Lewis base) and XF (the Lewis acid). These trimers allow us to compare the effect of the different types of C…X noncovalent interactions introduced by XF on the interaction energies, geometrical and spectroscopic parameters of the FB/BF…HNC dimer subunits. Hence, the relative strengths and cooperative effects of these intermolecular interactions can be assessed.
One particularly interesting question is whether the cooperative effect on the B…H or F…H hydrogen bond correlates with the relative strengths of the respective interactions (as gleaned from the HNC…XF data in Table 2 and discussed in the preceding Section 3.2). It should be noted that the trends for the Y…HNC parameters with increasing binding strength going from Y = BF to CO to N2 to OC to BF also persist for the YZ…HNC…XF trimers. To limit the large amount of computational results for these trimers, but still capture the full energetic range of the changes in the trimers between the two extremes of FB bonded to HNC (the most strongly bound dimer subunits) and BF bonded to HNC (the least strongly bound dimer subunits), we included only computations for the FB…HNC…XF and BF…HNC…XF trimers in Table 3.
The interaction energies ∆E for the FB/BF…HNC…XF trimers have a similar energetic ordering as observed for the HNC…XF dimers, with the BF…HNC…XF complexes having relatively smaller energies (and smaller values for the other parameters) than the FB...HNC…XF analogs since in the former the BF and HNC dipoles are opposed, and therefore, reduce the net interaction energies, whereas in the latter, these dipoles reinforce each other.
The cooperative effect of XF on the interaction energies in these trimers can be assessed by considering the nonadditive energies Enonadd shown in Table 3, where ∆E = E(FB/BF…HNC…XF) − E(FB/BF) − E(HNC)– E(XF) and Enonadd =∆E − ∆E(FB/BF…HNC) − ∆E(HNC…XF), assuming that ∆E(FB/BF…XF) is negligible. The percentage contribution of the nonadditive energy to the total interaction energy of the trimer, i.e., (Enonadd/∆E) × 100, generally follows the energetic ordering of the three different categories for the HNC…XF dimers. For example, the percentage contributions of the nonadditive energies taken from the data in Table 3 for FB…HNC…XF are 9, 11, 12, 19, 18, 13, 9, 10%, respectively, for XF = HF, LiF, BeF2, BF3, ClF, PH2F, SF2 and SiH3F; the unusually high percentage contribution from ClF in the trimer is an indication of a more pronounced electron rearrangement due to complexation (as noted above for the parent HNC…ClF dimer). Similar percentage contributions are also evident in the BF…HNC…XF series, but with smaller values than their FB…HNC…XF counterparts.
A comparison of the ∆E trend for the FB/BF…HNC dimers (column 2, Table 2) with the ∆E trend (column 2, Table 3) and Enonadd trend (column 3, Table 3) for the FB/BF…HNC…XF trimers shows that the relative strengths of the C…X noncovalent interactions also persist in the trimers, and the mutual cooperative effects of the B/F…H and C…X noncovalent bonds in these trimers correlate well with the relative strengths of the C…X interactions.
Relative to FB…HNC, addition of XF to form FB…HNC…XF results in the strengthening of the B…H hydrogen bond for all complexes as manifested by decreases in the B…H distance, increases in the H-N bond extensions, red shifts of the H-N stretching frequency and enhancements of its infrared intensities, as shown in Table 3.
The changes in these parameters generally correlate well with the relative strengths of the different noncovalent C…X bonds (as manifested by the relative ∆E values of FB…HNC and BF…HNC in Table 2). For example, the B…H separation decreases in the order FX = BF3 < BeF2 < LiF < HF < PH2F < SF2 < SiH3F, while this order is reversed for Δr(H-N), ∆ω(H-N) and I/I0(H-N); ClF yields the shortest separation (2.115 Å), largest H-N bond extension (0.028 Å), red shift (526 cm−1) and infrared intensity enhancement (11.8) since, unlike the other intermolecular interactions, the X atom (Cl) is transferred to HNC.
The geometric and spectroscopic changes in XF also scale well with the energetic ordering of the different C…X noncovalent interactions in the trimer, with ClF again yielding the most significant changes. For example, Δr(X-F) most faithfully tracks the interaction energy hierarchy (see column 9 of Table 3), whereas the X-F red shift and intensity enhancement show the same general trend, though there is a decrease in the magnitude of these two parameters going from SiH3F to SF2, followed by an increase going from SF2 to PH2F (see last two columns of Table 3).
The intermolecular C…X distance also indicates the relative strengths of the C…X interaction, with ClF yielding the shortest separation (1.746 Å). HF produces a shorter separation (1.896 Å) than the more polar LiF (2.189 Å) in their respective trimers since the C…Li distance will be restricted by the repulsion between the Li 1s core electrons and the C lone pair. A comparison of the parameters for FB…HNC…XF in Table 3 with those for HNC…XF in Table 2 indicates that the C…X noncovalent interactions are also strengthened by complexation, i.e., C…X distances are smaller, while X-F bond extensions, red shifts and intensity enhancements are larger in the trimers.
Furthermore, it seems as though the weaker noncovalent interactions are strengthened more by the stronger ones. For example, if we consider the effect on hydrogen-bonded FB…HNC, the B…H distance decreases by 5% in FB…HNC…LiF (i.e., due to the relatively strong LiF interaction), compared with a 2.3% decrease in FB…HNC…SF2 (i.e., due to the relatively weaker SF2 interaction). On the other hand, the weaker interactions appear to strengthen the stronger interactions to a lesser extent than the other way around. For example, the relatively weaker B…H hydrogen bond causes a 0.8% decrease in the C…Li separation in the more strongly bound HNC…LiF when FB…HNC…LiF forms, whereas the same B…H hydrogen bond causes a larger 2.7% decrease in the C…S separation in the more weakly bound HNC…SF2 when FB…HNC…SF2 forms.
The BF…HNC…XF trimers show similar trends to those observed for their FB…HNC…XF analogs, with parameters for the corresponding complexes smaller for the former, since they are less strongly bound than the latter. The binding energy for BF…HNC…XF is dominated by the attractive HNC…XF subunit; recall that in the BF…HNC subunit, the dipoles of the interacting monomers are opposed. Consequently, much larger ΔE’s are obtained for BF…HNC…XF compared with the small ΔE of −4.3 kJ/mol for the parent BF…HNC subunit.
Nonetheless, the cooperativity is much smaller in BF…HNC…XF than in FB…HNC…XF; Enonadd spans a much narrower range (0.7–5 kJ/mol) and its contribution to ΔE is also relatively small, ranging between 1.7 and 4.2%. The cooperative effect in BF…HNC…XF is reflected in decreases in R(F…H) and increases in Δr(H-N), ∆ω(H-N) and I/I0(H-N), relative to BF…HNC. Interestingly, BF…HNC…HF shows an anomalous decrease in I/I0 for the H-N stretch, probably because of the previously mentioned coupling of this vibrational mode with the H-F vibrational mode—this is the only complex for which a diminution of infrared intensity is observed.
The spectroscopic parameters for the H-N stretch in BF…HNC…XF are well correlated with increasing binding strength, with the σ-hole bonded complexes, in particular, showing a monotonic increase for the H-N red shift and I/I0 (as was also observed for the FB…HNC…XF analogs).
With reference to the C…XF interaction, a comparison of BF…HNC…XF (Table 3) with HNC…XF (Table 2) reveals small decreases in the C…X distance, with almost no change in the XF bond extension or its red shift, except for an HF red shift increase of 14 cm−1 in BF…HNC…HF. The changes for I/I0 are also small.
Consequently, we conclude that the cooperativity between the noncovalent interactions in BF…HNC…XF is largely negligible due to the destabilizing effect of the BF…HNC subunit.
At this point, we wish to emphasize that the infrared intensity enhancement seems to be a particularly sensitive parameter for investigating trends in related complexes such as the ones presented in this study. For example, Table 1 shows that the H-N stretching mode intensification correlates well with the binding strength for the Y…HNC dimers for both MP2 and M062x theoretical methods. As mentioned above, Table 2 also shows this strong energetic correlation for the H-N stretching mode in the HNC…XF dimers, especially for the σ-hole bonded complexes, where it increases monotonically with ΔE; I/I0 for the X-F stretching mode varies more erratically.
Table 3 shows that I/I0 for the H-N and X-F stretching modes in the FB/BF…HNC…XF trimers is substantially increased (relative to the corresponding HNC…XF dimers) and its variation with respect to increasing binding strength is similar to that obtained for the corresponding dimers in Table 2.
This suggests that I/I0 may perhaps be potentially useful for distinguishing between complexes with similar spectroscopic or geometrical features. For example, the red shifts of the H-N stretch in FB…HNC…PH2F, FB…HNC…SF2 and FB…HNC…SiH3F are 304, 300 and 293 cm−1, respectively, which are somewhat similar—the corresponding values for I/I0 of 5.61, 5.41 and 5.18 are also similar but may be more (theoretically) distinguishable from each other. In any case, the trends for I/I0 of the H-N stretch with increased binding in the FB/BF…HNC…XF and HNC…XF complexes are more pronounced than the trends for the other parameters, including the frequency shifts.

3.4. Y…HCN…XF Trimers

The data for the Y…HCN…XF trimers in Table 4 are limited to Y = BF and FB, representing the upper and lower energetic limits for these series of complexes. The trends are similar to those identified above for Y…HNC…XF, except that the corresponding parameters are smaller in magnitude for Y…HCN…XF. For example, ΔE varies according to the order donor-acceptor > H- and Li-bonded > σ-hole bonded, except for the anomalous Y…HCN…BF3 trimer, where the planar structure of BF3 is hardly altered by the interaction, as is also the case in the parent dimer HCN…BF3.
The Enonadd values for Y…HCN…XF generally follows the same pattern as for Y…HNC…XF, with its percentage contribution to ∆E ranging between 7 and 13% for Y = FB and negligible (0.8–1.8%) for Y = BF; as a group, the σ-hole bonded dimers make the smallest percentage contributions for both Y = FB or BF. As noted for the Y…HNC…XF trimer set, the Y…H hydrogen bond is enhanced by the XF interactions in the Y…HCN…XF trimers, with the ∆E and Enonadd generally scaling with the strength of the XF interaction (compare Table 4 with Table 2).
For all FB…HCN…XF trimers (compared to FB…HCN), the B…H distance decreases, with the smallest separation (2.444 Å) obtained for the strongest interaction (BeF2 with an interaction energy of −129 kJ/mol) and the largest separation (2.568 Å) for the weakest interaction (SiH3F with an interaction energy of −33.8 kJ/mol). The H-C bond extension is confined to a narrow range of 0.007–0.011 Å, while the H-C red shift ranges between 95 and 157 cm−1. The increase in the H-C bond extension, red shift and infrared intensity enhancement generally scale upwards with increasing binding strength, especially for the σ-hole bonded trimers, where the latter two spectroscopic parameters show a monotonic increase.
The N…X distance in FB…HCN…XF steadily decreases with an increase in binding strength from XF = SiH3F to BeF2; the X-F bond extension also generally scales upwards. The spectroscopic properties associated with the XF molecule, i.e., ∆ω(X-F) and I/I0(X-F), also increase in magnitude as the N…X interaction strengthens, though the variation in both ∆ω(X-F) and I/I0(X-F) for the σ-hole bonded complexes is less straightforward—both properties decrease in magnitude going from SiH3F to SF2, then increase from SF2 to PH2F, followed by a further increase from PH2F to ClF.
The changes in BF…HCN…XF also mirror those for FB…HCN…XF, though with the expected reduced values in the corresponding parameters. For example, the Y…H distance decreases going from HCN…XF to BF…HCN…XF, with the closest distance (2.296 Å) obtained for XF = BeF2 and the longest distances (2.38–2.40 Å) obtained for the σ-hole bonded complexes. The H-C bond extensions are negligible (< 0.003 Å) and also the H-C red shifts (<1.5 cm−1), except in the two most strongly bound trimers: BF…HCN…LiF (11 cm−1) and BF…HCN…BeF2 (7 cm−1). Even though the I/I0 values for the H-C stretch in BF…HCN…XF span a narrow range (2.10–2.85), they nevertheless show a clear upward trend (with increasing interaction energy), especially for the σ-hole bonded species, where a monotonic increase is evident, going from 2.11 (SiH3F) to 2.33 (ClF).
The trends for the structural parameters associated with the X-F interaction also show a steady increase in the X-F bond extension and a decrease in the N…X distance with increasing binding strength going from XF = SiH3F to BeF2. By contrast, the trends for the spectroscopic parameters associated with XF are less straightforward, as noticed for the FB…HNC…XF series,

4. Conclusions

(a)
For the model Y…HCN/HNC dimers, the interaction energy increases systematically as the magnitude and orientation of the Y dipole, relative to the HCN/HNC molecular axis and dipole orientation were varied going from Y = BF to CO (opposite direction to the HCN or HNC dipole, thereby diminishing the intermolecular interaction), to the nonpolar N2, then to OC and FB (both in the same direction as the HCN or HNC dipole, thereby reinforcing the intermolecular interaction). The geometric and spectroscopic parameters also show a systematic trend with increased binding.We note the failure of the widely used M062x functional to correctly predict the H-C bond length change and frequency shift in the HCN complexes, which suggests that caution should be exercised in the use of this method for modeling complexes of HCN, and where feasible, validation by comparison with other methods, such as MP2, is advisable.
(b)
For the model HCN…XF and HNC…XF dimers, the interaction energy is generally in the order: donor-acceptor complexes (XF = BeF2, BF3) > H- or Li-bonded (HF, LiF) > σ-hole bonded complexes (ClF, PH2F, SF2, SiH3F). The energetic ordering for the σ-hole bonded complexes was found to be halogen > pnicogen > chalcogen > tetrel. The geometric and spectroscopic parameters for the H-C or H-N bonds in these complexes are well correlated with the binding strength, but the corresponding parameters for the X-F bond are less so. The infrared intensity enhancement ratio I/I0 for both uncomplexed and hydrogen-bonded H-N or H-C stretching modes in both dimers and trimers seems to be the most reliable molecular parameter for identifying trends with respect to the binding strength in both dimers and trimers containing HNC or HCN since it increases monotonically with increasing ΔE. For some of the systems studied here, this parameter may be relatively small, but nevertheless, usually shows a clear trend, especially for the σ-hole bonded complexes.
(c)
The FB/BF…HNC…XF trimers are more strongly bound than the FB/BF…HCN…XF trimers (as is the case for the corresponding HNC…XF and HCN…XF dimers) since HNC is more polar than HCN, but both series of complexes show similar trends for the corresponding geometric and spectroscopic parameters. Both sets of trimers also exhibit (positive) cooperative effects between the B/F…H hydrogen bond and the C/N…X noncovalent bond, with the nonadditive energies for FB…HCN/HNC…XF contributing between 7 and 19% to the total interaction energy, while the nonadditivity contribution to the total interaction energy in BF…HCN/HNC…XF is no greater than 5%, and so can be considered negligible.
(d)
The interaction energy and the nonadditive energy contribution to the trimer energetic stability correlate well with the relative strength of the noncovalent interactions due to XF, i.e., donor-acceptor > H- or Li-bonded > σ-hole bonded complexes. In other words, the B…H or F…H hydrogen bond is strengthened in the trimer by the XF interaction in accordance with the strength of the corresponding additional noncovalent bond. However, the N/C…X interaction is strengthened to a lesser extent by the B…H or F…H hydrogen bond, and has a more significant effect, on the relatively weaker XF noncovalent interactions.
(e)
As noted for the HCN/HNC…XF dimers, the infrared intensity enhancement of the H-N or H-C stretching mode appears to also be the molecular parameter that most closely correlates with the binding strength in the FB/BF…HCN/HNC…XF trimers, especially for the σ-hole bonded complexes. This parameter is probably most useful in distinguishing between closely related complexes, which may not be easily distinguishable by other spectroscopic approaches such as vibrational frequency shifts.

Author Contributions

Conceptualization, S.A.C.M.; methodology, S.A.C.M.; software, S.A.C.M.; validation, S.A.C.M. and K.A.E.; formal analysis, S.A.C.M.; investigation, K.A.E. and S.A.C.M.; resources, S.A.C.M.; data curation, S.A.C.M.; writing—original draft preparation, S.A.C.M.; writing—review and editing, S.A.C.M. and K.A.E.; visualization, S.A.C.M. and K.A.E.; supervision, S.A.C.M.; project administration, S.A.C.M. All authors have read and agreed to the published version of the manuscript.

Funding

This research received no external funding.

Data Availability Statement

The raw data supporting the conclusions of this article will be made available by the authors upon request.

Conflicts of Interest

The authors declare no conflicts of interest.

References

  1. Müller-Dethlefs, K.; Hobza, P. Noncovalent interactions: A challenge for experiment and theory. Chem. Rev. 2000, 100, 143–168. [Google Scholar] [CrossRef] [PubMed]
  2. Hobza, P.; Zahradník, R.; Müller-Dethlefs, K. The world of non-covalent interactions: 2006. Collect. Czechoslov. Chem. Commun. 2006, 71, 443–531. [Google Scholar] [CrossRef]
  3. Schneider, H.-J. Noncovalent interactions: A brief account of a long history. J. Phys. Org. Chem. 2022, 35, e4340. [Google Scholar] [CrossRef]
  4. Scheiner, S. Hydrogen Bonding: A Theoretical Perspective; Oxford University Press: New York, NY, USA, 1997. [Google Scholar]
  5. Scheiner, S. Understanding noncovalent bonds and their controlling forces. J. Chem. Phys. 2020, 153, 140901. [Google Scholar] [CrossRef]
  6. Jeffrey, G.A. An Introduction to Hydrogen Bonding; Oxford University Press: New York, NY, USA, 1997. [Google Scholar]
  7. Gilli, G.; Gilli, P. Towards an unified hydrogen-bond theory. J. Mol. Struct. 2000, 552, 1–15. [Google Scholar] [CrossRef]
  8. Gilli, G.; Gilli, P. The Nature of the Hydrogen Bond: Outline of a Comprehensive Hydrogen Bond Theory; Oxford University Press: New York, NY, USA, 2009. [Google Scholar]
  9. Pimentel, G.C.; McClellan, A.L. The Hydrogen Bond; WH Freeman: San Francisco, CA, USA, 1960. [Google Scholar]
  10. Joseph, J.; Jemmis, E.D. Red-, blue-, or no-shift in hydrogen bonds: A unified explanation. J. Am. Chem. Soc. 2007, 129, 4620–4632. [Google Scholar] [CrossRef]
  11. Wang, C.; Danovich, D.; Shaik, S.; Mo, Y. A unified theory for the blue-and red-shifting phenomena in hydrogen and halogen bonds. J. Chem. Theory Comput. 2017, 13, 1626–1637. [Google Scholar] [CrossRef]
  12. Grabowski, S.J. What is the covalency of hydrogen bonding? Chem. Rev. 2011, 111, 2597–2625. [Google Scholar] [CrossRef]
  13. Desiraju, G.R. Hydrogen bridges in crystal engineering: Interactions without borders. Acc. Chem. Res. 2002, 35, 565–573. [Google Scholar] [CrossRef]
  14. Jena, S.; Dutta, J.; Tulsiyan, K.D.; Sahu, A.K.; Choudhury, S.S.; Biswal, H.S. Noncovalent interactions in proteins and nucleic acids: Beyond hydrogen bonding and π-stacking. Chem. Soc. Rev. 2022, 51, 4261–4286. [Google Scholar] [CrossRef]
  15. Zhou, P.; Huang, J.; Tian, F. Specific noncovalent interactions at protein-ligand interface: Implications for rational drug design. Curr. Med. Chem. 2012, 19, 226–238. [Google Scholar] [CrossRef] [PubMed]
  16. Politzer, P.; Lane, P.; Concha, M.C.; Ma, Y.; Murray, J.S. An overview of halogen bonding. J. Mol. Model. 2007, 13, 305–311. [Google Scholar] [CrossRef] [PubMed]
  17. Brinck, T.; Murray, J.S.; Politzer, P. Surface electrostatic potentials of halogenated methanes as indicators of directional intermolecular interactions. Int. J. Quant. Chem. 1992, 44, 57–64. [Google Scholar] [CrossRef]
  18. Dong, W.; Li, Q.; Scheiner, S. Comparative Strengths of Tetrel, Pnicogen, Chalcogen, and Halogen Bonds and Contributing Factors. Molecules 2018, 23, 1681. [Google Scholar] [CrossRef] [PubMed]
  19. Aakeröy, C.B.; Fasulo, M.; Schultheiss, N.; Desper, J.; Moore, C. Structural competition between hydrogen bonds and halogen bonds. J. Am. Chem. Soc. 2007, 129, 13772–13773. [Google Scholar] [CrossRef] [PubMed]
  20. Solimannejad, M.; Malekani, M.; Alkorta, I. Cooperativity between the hydrogen bonding and halogen bonding in F3CX⋯NCH(CNH)⋯NCH(CNH) complexes (X=Cl, Br). Mol. Phys. 2011, 109, 1641–1648. [Google Scholar] [CrossRef]
  21. Scheiner, S. Sensitivity of noncovalent bonds to intermolecular separation: Hydrogen, halogen, chalcogen, and pnicogen bonds. CrystEngComm 2013, 15, 3119–3124. [Google Scholar] [CrossRef]
  22. Domagała, M.; Lutyńska, A.; Palusiak, M. Halogen bond versus hydrogen bond: The many-body interactions approach. Int. J. Quant. Chem. 2017, 117, e25348. [Google Scholar] [CrossRef]
  23. Robertson, C.C.; Wright, J.S.; Carrington, E.J.; Perutz, R.N.; Hunter, C.A.; Brammer, L. Hydrogen bonding vs. halogen bonding: The solvent decides. Chem. Sci. 2017, 8, 5392–5398. [Google Scholar] [CrossRef]
  24. Scheiner, S. The pnicogen bond: Its relation to hydrogen, halogen, and other noncovalent bonds. Acc. Chem. Res. 2013, 46, 280–288. [Google Scholar] [CrossRef]
  25. Scheiner, S. Detailed comparison of the pnicogen bond with chalcogen, halogen, and hydrogen bonds. Int. J. Quantum Chem. 2013, 113, 1609–1620. [Google Scholar] [CrossRef]
  26. Alkorta, I.; Del Bene, J.E.; Elguero, J. H2XP: OH2 Complexes: Hydrogen vs. pnicogen bonds. Crystals 2016, 6, 19. [Google Scholar] [CrossRef]
  27. Sethio, D.; Oliveira, V.; Kraka, E. Quantitative assessment of tetrel bonding utilizing vibrational spectroscopy. Molecules 2018, 23, 2763. [Google Scholar] [CrossRef] [PubMed]
  28. Tang, Q.; Li, Q. Interplay between tetrel bonding and hydrogen bonding interactions in complexes involving F2XO (X= C and Si) and HCN. Comput. Theor. Chem. 2014, 1050, 51–57. [Google Scholar] [CrossRef]
  29. Wang, X.; Li, Q.; Scheiner, S. Cooperativity between H-bonds and tetrel bonds. Transformation of a noncovalent C⋯N tetrel bond to a covalent bond. Phys. Chem. Chem. Phys. 2023, 25, 29738–29746. [Google Scholar] [CrossRef] [PubMed]
  30. Hunter, C.A.; Anderson, H.L. What is cooperativity? Angew. Chem. Int. Ed. Engl. 2009, 48, 7488. [Google Scholar] [CrossRef] [PubMed]
  31. Marin-Luna, M.; Alkorta, I.; Elguero, J. Cooperativity in tetrel bonds. J. Phys. Chem. A 2016, 120, 648–656. [Google Scholar] [CrossRef] [PubMed]
  32. Saha, S.; Sastry, G.N. Cooperative or anticooperative: How noncovalent interactions influence each other. J. Phys. Chem. B 2015, 119, 11121–11135. [Google Scholar] [CrossRef]
  33. Stone, A.J.; Buckingham, A.D.; Fowler, P.W. Comment on “Structure and spectroscopy of (HCN)n clusters: Cooperative and electronic delocalization effects in C–H⋯N hydrogen bonding” [J. Chem. Phys. 103, 333 (1995)]. J. Chem. Phys. 1997, 107, 1030–1031. [Google Scholar] [CrossRef]
  34. Li, Q.; Wang, X.; Cheng, J.; Li, W.; Gong, B.; Sun, J. Theoretical study on the interlay of hydrogen bonds in the trimers involving HCN and water. Int. J. Quantum Chem. 2009, 109, 1396–1402. [Google Scholar] [CrossRef]
  35. Kar, T.; Scheiner, S. Comparison of cooperativity in CH···O and OH···O hydrogen bonds. J. Phys. Chem. A 2004, 108, 9161–9168. [Google Scholar] [CrossRef]
  36. Esrafili, M.D.; Behzadi, H.; Hadipour, N.L. Theoretical study of N–H··· O hydrogen bonding properties and cooperativity effects in linear acetamide clusters. Theor. Chem. Acc. 2008, 121, 135–146. [Google Scholar] [CrossRef]
  37. Henkel, S.; Misuraca, M.C.; Ding, Y.; Guitet, M.; Hunter, C.A. Enhanced chelate cooperativity in polar solvents. J. Am. Chem. Soc. 2017, 139, 6675–6681. [Google Scholar] [CrossRef] [PubMed]
  38. Frank, H.S.; Wen, W.-Y. Discuss. Faraday Soc. 1957, 24, 133. [Google Scholar] [CrossRef]
  39. Zeng, Y.; Hao, J.; Zheng, S.; Meng, L. Cooperativity between S···π and Rg···π in the OCS···C6H6···Rg (Rg = He, Ne, Ar, and Kr) van der Waals Complexes. J. Phys. Chem. A 2011, 115, 11057–11066. [Google Scholar] [CrossRef] [PubMed]
  40. Solimannejad, M.; Ghafari, S.; Esrafili, M.D. Theoretical insight into cooperativity in lithium-bonded complexes: Linear clusters of LiCN and LiNC. Chem. Phys. Lett. 2013, 577, 6–10. [Google Scholar] [CrossRef]
  41. Krishnapriya, V.U.; Suresh, C.H. Unraveling pnicogen bonding cooperativity: Insights from molecular electrostatic potential analysis. J. Comput. Chem. 2023; Early View. [Google Scholar] [CrossRef]
  42. Esrafili, M.D.; Vakili, M.; Solimannejad, M. Cooperative effects in pnicogen bonding:(PH2F)2–7 and (PH2Cl)2–7 clusters. Chem. Phys. Lett. 2014, 609, 37–41. [Google Scholar] [CrossRef]
  43. Alkorta, I.; Elguero, J.; Solimannejad, M. Single electron pnicogen bonded complexes. J. Phys. Chem. A 2014, 118, 947–953. [Google Scholar] [CrossRef]
  44. Nauta, K.; Miller, R.E. Nonequilibrium self-assembly of long chains of polar molecules in superfluid helium. Science 1999, 283, 1895–1897. [Google Scholar] [CrossRef]
  45. Dulmage, W.J.; Lipscomb, W.N. The crystal structures of hydrogen cyanide, HCN. Acta Crystallogr. 1951, 4, 330. [Google Scholar] [CrossRef]
  46. Matthews, C.N. The HCN world: Establishing protein—Nucleic acid life via hydrogen cyanide polymers. In Origins: Genesis, Evolution and Diversity of Life, Cellular Origin and Life in Extreme Habitats and Astrobiology; Springer: Dordrecht, The Netherlands, 2005; Volume 6, pp. 121–135. [Google Scholar]
  47. Sanchez, M.; Provasi, P.F.; Aucar, G.A.; Alkorta, I.; Elguero, J. Theoretical study of HCN and HNC neutral and charged clusters. J. Phys. Chem. B 2005, 109, 18189. [Google Scholar] [CrossRef] [PubMed]
  48. Brandão, I.; Rivelino, R.; Fonseca, T.L.; Castro, M.A. An ab initio study of electric properties of linear (HCN)N and (HNC)N aggregates in gas phase. Chem. Phys. Lett. 2013, 580, 9–13. [Google Scholar] [CrossRef]
  49. Adrian-Scotto, M.; Vasilescu, D. Density functional theory study of (HCN)n clusters up to n = 10. J. Mol. Struct. THEOCHEM 2007, 803, 45. [Google Scholar] [CrossRef]
  50. Frisch, M.J.; Trucks, G.W.; Schlegel, H.B.; Scuseria, G.E.; Robb, M.A.; Cheeseman, J.R.; Scalmani, G.; Barone, V.; Mennucci, B.; Petersson, G.A.; et al. Uranyl Extraction by N, N-Dialkylamide Ligands Studied by Static and Dynamic DFT Simulations. In Gaussian 09; Gaussian, Inc.: Wallingford, CT, USA, 2009. [Google Scholar]
  51. McDowell, S.A.C.; Buckingham, A.D. Cooperative and diminutive hydrogen bonding in Y⋯ HCN⋯ HCN and NCH⋯ Y⋯ HCN trimers (Y= BF, CO, N2). J. Chem. Phys. 2010, 132, 064303. [Google Scholar] [CrossRef]
  52. Novak, A. Hydrogen bonding in solids correlation of spectroscopic and crystallographic data. In Large Molecules, Structure and Bonding; Springer: Berlin/Heidelberg, Germany, 2007; Volume 18, p. 177. [Google Scholar]
  53. Iogansen, A.V. Direct proportionality of the hydrogen bonding energy and the intensification of the stretching ν (XH) vibration in infrared spectra. Spectrochim. Acta Part A 1999, 55, 1585. [Google Scholar] [CrossRef]
Figure 1. Optimized structures for (a) FB…HNC…BeF2, (b) FB…HNC…BF3 (c) FB…HNC…ClF, (d) BF…HCN…PH2F (e) FB…HCN…SF2 and (f) FB…HCN…SiH3F.
Crystals 14 00111 g001
Table 1. MP2/6-311++G(2d,2p) and M062x/6-311++G(2d,2p) (in brackets) parameters for Y…HCN and Y…HNC dimers (Y = FB, OC, N2, CO, BF). These parameters are the interaction energy (∆E in kJ/mol), intermolecular separation (R in Å), bond length change (∆r in Å), the shift of the harmonic vibrational stretching frequency (∆ω in cm−1) and the ratio of its infrared intensity in the complex to its intensity in the monomer (I/I0).
Complex∆ER (Y…H)∆r(H-N) or ∆r(H-C)∆ω(H-N) or ∆ω(H-C)I/I0(H-N) or I/I0(H-C)
FB…H-CN−13.7 (−12.4)2.606 (2.597)0.005 (−0.005)−78.9 (15.2)3.65 (3.59)
OC…H-CN−9.4 (−6.4)2.506 (2.592)0.003 (−0.008)−38.8 (70.6)2.77 (2.33)
N2…H-CN−6.8 (−4.5)2.461 (2.554)0.002 (−0.009)−16.2 (92.4)2.25 (1.93)
CO…H-CN−4.8 (−4.6)2.430 (2.458)0.001 (−0.010)−3.7 (100.4)1.99 (1.82)
BF…H-CN−2.8 (−2.4)2.428 (2.488)0.0 (−0.010)3.0 (105.1)1.70 (1.57)
FB…H-NC−23.2 (−19.8)2.304 (2.322)0.012 (0.012)−238.6 (−256.7)3.98 (3.59)
OC…H-NC−15.2 (−10.8)2.220 (2.273)0.007 (0.006)−131.7 (−125.6)2.97 (2.57)
N2…H-NC−10.7 (−7.0)2.185 (2.258)0.003 (0.003)−69.1 (−63.2)2.38 (2.12)
CO…H-NC−7.8 (−6.5)2.173 (2.198)0.001 (0.002)−31.5 (−47.8)2.08 (1.95)
BF…H-NC−4.3 (−3.1)2.214 (2.217)0.0 (0.001)−11.0 (−24.8)1.73 (1.66)
Table 2. MP2/6-311++G(2d,2p) parameters for HCN…XF and HNC…XF (XF = HF, LiF, BeF2, BF3, SiH3F, PH2F, SF2 and ClF). These parameters are the interaction energy (∆E in kJ/mol), intermolecular separation (R in Å), bond length change (∆r in Å), the shift of the harmonic vibrational stretching frequency (∆ω in cm−1) and the ratio of its infrared intensity in the complex to its intensity in the monomer (I/I0).
Complex∆ER (N/C…X)<N/C…X-F∆r(X-F)∆ω(H-C/N)I/I0 (H-C/N))∆ω(X-F)I/I0 (X-F)
H-CN…BeF2−102.31.8241090.034−5.01.56
H-CN…LiF−67.82.0731800.021−10.71.39−5.51.35
H-CN…HF−33.21.8531800.012−2.01.36−269.36.91
H-CN…BF3−30.32.460930.004−2.01.24
H-CN…ClF−24.22.5751800.018−2.71.36−36.83.31
H-CN…PH2F−19.62.8311630.014−1.81.29−32.71.48
H-CN…SF2−18.82.8381780.014−2.51.24−14.6 c1.20
H-CN…SiH3F−17.62.9201800.011−2.51.23−24.11.76
H-NC…BeF2−112.91.9141100.037−29.81.46
H-NC…BF3−104.31.8431020.043−27.11.55
H-NC…ClF b−85.11.7601800.217−29.82.50−255.911.4
H-NC…LiF−68.92.2071800.022−28.31.29−11.01.28
H-NC…HF a−36.21.9251800.016−7.80.06−368.710.3
H-NC…PH2F−22.72.7621660.019−12.21.31−49.11.74
H-NC…SF2−20.22.8621780.018−11.31.25−22.4 c1.24
H-NC…SiH3F−18.42.9621800.013−10.71.22−29.91.94
a The H-N and H-F stretching modes are coupled in HNC…HF. b H-N=C…Cl-F → H-N=C-Cl…F (transfer of Cl from Cl-F to HNC). c SF2 symmetric stretch.
Table 3. MP2/6-311++G(2d,2p) parameters for Y…HNC and Y…HNC…XF (XF = HF, LiF, BeF2, BF3, SiH3F, PH2F, SF2 and ClF). These parameters are the interaction energy and non-additive energies (∆E, Enonadd in kJ/mol), intermolecular separation (R in Å), bond length change (∆r in Å), the shift of the harmonic vibrational stretching frequency (∆ω in cm−1) and the ratio of its infrared intensity in the complex to its intensity in the monomer (I/I0).
Complex∆EEnonaddR(Y…H)∆r(H-N)∆ω(H-N)I/I0(H-N)R(C…X)∆r(X-F)∆ω(X-F)I/I0(X-F)
FB…HNC−23.2 2.3040.012−238.63.98
FB…HNC…BF3−158.0−30.52.1290.027−489.97.551.7910.050
FB…HNC…BeF2−155.1−19.02.1500.025−459.16.881.8940.040
FB…HNC…ClF a−132.6−24.32.1150.028−526.511.81.7460.240−276.413.8
FB…HNC…LiF−104.0−11.92.1820.022−411.05.972.1890.026−15.41.35
FB…HNC…HF−65.4−6.02.2340.017−326.76.011.8960.019−423.68.00
FB…HNC…PH2F−52.9−7.02.2490.016−303.75.612.7060.024−63.11.99
FB…HNC…SF2−47.9−4.52.2510.015−300.45.412.7840.024−26.31.39
FB…HNC…SiH3F−46.1−4.52.2570.015−293.05.182.8960.016−38.72.27
BF…HNC−4.3 2.2140.0−11.01.73
BF…HNC…BeF2−120.0−2.82.0840.004−59.72.701.9100.037
BF…HNC…BF3−113.4−4.82.0740.004−59.12.891.8340.044
BF…HNC…ClF a−92.7−3.32.0720.004−64.54.461.7580.220−258.812.5
BF…HNC…LiF−74.9−1.72.1100.004−54.72.382.2050.022−11.11.34
BF…HNC…HF b−41.2−0.72.1580.002−18.90.271.9210.016−382.212.3
BF…HNC…PH2F−27.7−0.72.1710.002−26.42.302.7540.019−50.31.82
BF…HNC…SF2−25.2−0.72.1730.001−25.32.212.8490.018−23.01.26
BF…HNC…SiH3F−23.4−0.72.1760.001−24.22.142.9610.013−30.02.02
a H-N=C…Cl-F → H-N=C-Cl…F (transfer of Cl from Cl-F to HNC). b The H-N and H-F stretching modes are coupled.
Table 4. MP2/6-311++G(2d,2p) parameters for Y…HCN and Y…HCN…XF (XF = HF, LiF, BeF2, BF3, SiH3F, PH2F, SF2 and ClF). These parameters are the interaction energy and non-additive energies (∆E, Enonadd in kJ/mol), intermolecular separation (R in Å), bond length change (∆r in Å), the shift of the harmonic vibrational stretching frequency (∆ω in cm−1) and the ratio of its infrared intensity in the complex to its intensity in the monomer (I/I0).
Complex∆EEnonaddR(Y…H)∆r(H-C)∆ω(H-C)I/I0(H-C)R(N…X)∆r(X-F)∆ω(X-F)I/I0(X-F)
FB…HCN−13.7 2.6060.005−78.93.65
FB…HCN…BeF2−129.2−13.22.4440.011−156.76.891.8050.036
FB…HCN…LiF−89.6−8.12.4760.011−145.55.962.0590.024−8.61.43
FB…HCN…HF−50.8−3.92.5380.008−107.15.271.8280.014−307.97.97
FB…HCN…BF3−50.3−6.32.5430.007−104.94.952.3640.007
FB…HCN…ClF−41.2−3.32.5490.007−103.75.312.5310.022−44.14.01
FB…HCN…PH2F−35.8−2.52.5650.007−97.94.912.7940.016−37.81.59
FB…HCN…SF2−34.9−2.42.5660.007−97.14.782.8010.016−16.61.18
FB…HCN…SiH3F−33.8−2.52.5680.007−96.34.702.8780.013−29.21.95
BF…HCN−2.9 2.4280.03.01.70
BF…HCN…BeF2−106.6−1.42.2960.002−7.42.841.8220.034
BF…HCN…LiF−71.7−1.02.3180.002−11.42.522.0710.021−5.81.41
BF…HCN…HF−36.4−0.32.3750.001−0.92.341.8490.012−273.47.26
BF…HCN…BF3−33.8−0.62.3790.0010.12.162.4510.004
BF…HCN…ClF−27.4−0.32.3840.001−1.42.332.5670.019−37.33.51
BF…HCN…PH2F−22.7−0.22.3920.001−1.22.212.8220.014−32.11.52
BF…HCN…SF2−21.9−0.22.3820.001−1.42.172.8240.015−13.31.11
BF…HCN…SiH3F−20.7−0.22.3970.001−0.82.112.9160.011−24.31.82
Disclaimer/Publisher’s Note: The statements, opinions and data contained in all publications are solely those of the individual author(s) and contributor(s) and not of MDPI and/or the editor(s). MDPI and/or the editor(s) disclaim responsibility for any injury to people or property resulting from any ideas, methods, instructions or products referred to in the content.

