Article

RE0.01Sr0.99Co0.5Fe0.5O3 (RE = La, Pr, and Sm) Cathodes for SOFC

by
Selene Díaz-González
1,
Roberto Campana
2,*,
Rocío Andújar
2,
Adrián Pardo
2,
Beatriz Gil-Hernández
1,3 and
Antonio D. Lozano-Gorrín
1,*
1
Departamento de Química, U.D. Química Inorgánica, Universidad de La Laguna, 38200 La Laguna, Spain
2
Centro Nacional del Hidrógeno, 13500 Puertollano, Spain
3
Institute of Material Science and Nanotechnology, Universidad de La Laguna, 38200 La Laguna, Spain
*
Authors to whom correspondence should be addressed.
Crystals 2024, 14(2), 143; https://doi.org/10.3390/cryst14020143
Submission received: 4 December 2023 / Revised: 24 January 2024 / Accepted: 26 January 2024 / Published: 30 January 2024
(This article belongs to the Section Materials for Energy Applications)

Abstract

:
This study focuses on the synthesis, characterization, and study of new perovskite-type materials as cathodes in SOFC. The doped perovskites were successfully synthesized with high purity. The electrochemical performance of these materials was extensively examined through the characterization of I-V-P and EIS curves at the three temperatures, 750, 800, and 850 °C, where it reveals a substantial reduction in total resistances, accompanied by an impressive increase in power densities. The cell featuring La0.01Sr0.99Co0.5Fe0.5O3 exhibited the most commendable electrochemical properties at each temperature, following which were SrCo0.5Fe0.5O3, Pr0.01Sr0.99Co0.5Fe0.5O3, and Sm0.01Sr0.99Co0.5Fe0.5O3.

1. Introduction

Within the segment formed by renewable energies, new energy generation systems have become important over recent years, where solid oxide fuel cells (SOFC) stand out since they have the advantage of being able to directly convert chemical energy stored in fuels (hydrogen, natural gas, or biogas) into electrical energy with high efficiency. Electrode-supported fuel cells have operating temperatures of around 600–800 °C, while electrolyte-supported cells require higher temperatures, usually above 900 °C. Nevertheless, solid oxide systems need to improve their durability, as the high temperatures to which they are subjected induce diffusion processes of species through the component materials, which results in losses in their electrochemical performance and compromises their durability over long periods of operation. For this reason, it is necessary to look for new materials for electrodes with high catalytic activity and stability for SOFC [1,2].
Perovskite materials are crystalline compounds with a particular structure that have become very popular in scientific research in recent years due to their amazing electrical and optical properties [3,4,5,6,7,8,9]. The structure is characterized by a particular arrangement of the ions within it, which allows a great variety of possible chemical combinations and great potential for its application in electronic and photovoltaic devices. The general formula is ABO3, where A is a metal ion and B is a nonmetal ion [10].
Regarding the chemical characteristics, perovskites are stable at high temperatures and pressures and are resistant to corrosion [11,12,13]. However, some perovskites are sensitive to moisture and light. In terms of structural features, it has a cube-shaped crystal structure, with a large metal ion surrounded by a group of small ions. This structure is responsible for the excellent electronic and mechanical properties of perovskites. In addition, its structure is highly flexible, which allows its properties to be modified through changes in the chemical composition [14,15].
Perovskites have been shown to be promising materials due to their unique conductive and semiconducting properties. It has been shown that perovskites can act as active electrodes and catalysts in SOFCs [16,17,18,19,20], allowing for improved cell performance and stability. However, there are still significant challenges to overcome before perovskites can be used in SOFCs in a practical way. These challenges include the long-term stability of perovskites, the synthesis of high-quality perovskites, and the understanding of charge transport mechanisms in SOFC perovskites.
The vast majority of the literature has studied LSCF [21] and its simile with samarium [22] but these compounds have R3c as a space group. This group corresponds to a rhombohedral structure. Rhombohedral and cubic crystal structures represent three-dimensional arrangements of atoms in crystalline solids with significant differences. The rhombohedral structure, belonging to the trigonal crystal system, exhibits trigonal symmetry with a unit cell that can resemble a rhombus and contains more than one atom. In contrast, cubic structures, belonging to the cubic crystal system, present cubic symmetry with options such as body-centered, face-centered, or primitive. These structures have unit cells with cubic coordinates and are considered beneficial in various applications due to their greater symmetry and isotropic properties, making them preferable in many chemical and physical contexts [23]. Based on this and taking into account that similar perovskites with cubic symmetry are found in the literature [24,25,26,27,28,29], it was decided to dope the SrCoFeO matrix with only 1% of lanthanoid elements. Moreover, at present, the steady increase in technological evolution and geopolitical instability have led to growing concerns regarding the potential shortage of specific materials, known as critical raw materials, among which rare earths are included [30,31]. Given the supply shortages of these materials in European countries, various strategies are being implemented. These strategies range from the substitution of these elements by others with similar properties to, as addressed in the present study, the minimization of the amount used of such materials [32].
Starting from the fact that one of the best electrolytes used so far is YSZ due to its magnificent properties, the cathode used must have a high electronic and ionic conductivity, a high porosity to allow the flow of oxygen, and a catalytic activity to be able to reduce oxygen and generate oxide ions [33,34,35,36]. Although one might think that noble metals such as platinum could perform this function, they present a high cost and limitations in the reduction process. It is very common to use samarium doped ceria (SDC) or gadolinium doped ceria (GDC) as a protective layer between the electrolyte and the cathode in order to prevent the formation of poorly conducting secondary phases, which reduces the oxygen electrode performance [37].
The commercialization of SOFC technology depends largely on the improvement in the durability and cost reduction in the cells, where the manufacturing methods have great relevance. The selection of a suitable fabrication method for each component of planar SOFC usually depends on the cell structure and whether the SOFC is electrolyte-supported or electrode-supported, where fast, economical, and environmental methods are required [38].
To produce anode-supported SOFC, one of the most commonly used methods is tape casting, due to its low cost and the fact that expensive tools are not needed [39,40,41]. On the other hand, the deposition of the layers is usually made by different techniques such as chemical vapor deposition, screen printing, or dip coating. Wet powder spraying (WPS) is considered a promising alternative that allows the control of the morphologies and the layer thickness with the advantage of being a low-cost technique [37,42]. In our work, four anode-supported cells have been fabricated by a tape-casting method. The aim of this research is to study the influence of the use of different cathodes using self-made powders obtained by freeze-drying. The deposition of the different layers (yttria-stabilized zirconia, YSZ, as an electrolyte; gadolinium doped ceria, GDC, as a protective layer; and RE0.01Sr0.99Co0.5Fe0.5O3 (RE = Pr, La and, Sm) as a cathode) has been conducted by WPS, optimizing the deposition procedure. The samples were characterized by X-ray diffraction (XRD) and scanning electron microscopy (SEM). Electrochemical measurements were performed and analyzed. Although the perovskite skeleton under study is well known, our variation in its atomic proportions, its synthesis method, and its results led us to carry out this exhaustive study.

2. Materials and Methods

2.1. Experimental Materials

The following reagents were used without further purification: SrCO3 (Aldrich, St. Louis, MO, USA, 99.9%), Fe2O3 (Panreac, Darmstadt, Germany, 96%), CoCO3·H2O (Acros Organics, Antwerp, Belgium, 99%), Pr6O11 (Aldrich, 99.9%), La2O3 (Merck, Darmstadt, Germany, 99.9%), Sm(NO3)3·6H2O (Aldrich, 99.9%), YSZ (3%Y, Tosoh, Tokyo, Japan), Gd(NO3)3·6H2O, Ce(NO3)3·6H2O, and NiO (Chemlab, Petaling Jaya, Malaysia, 99%).

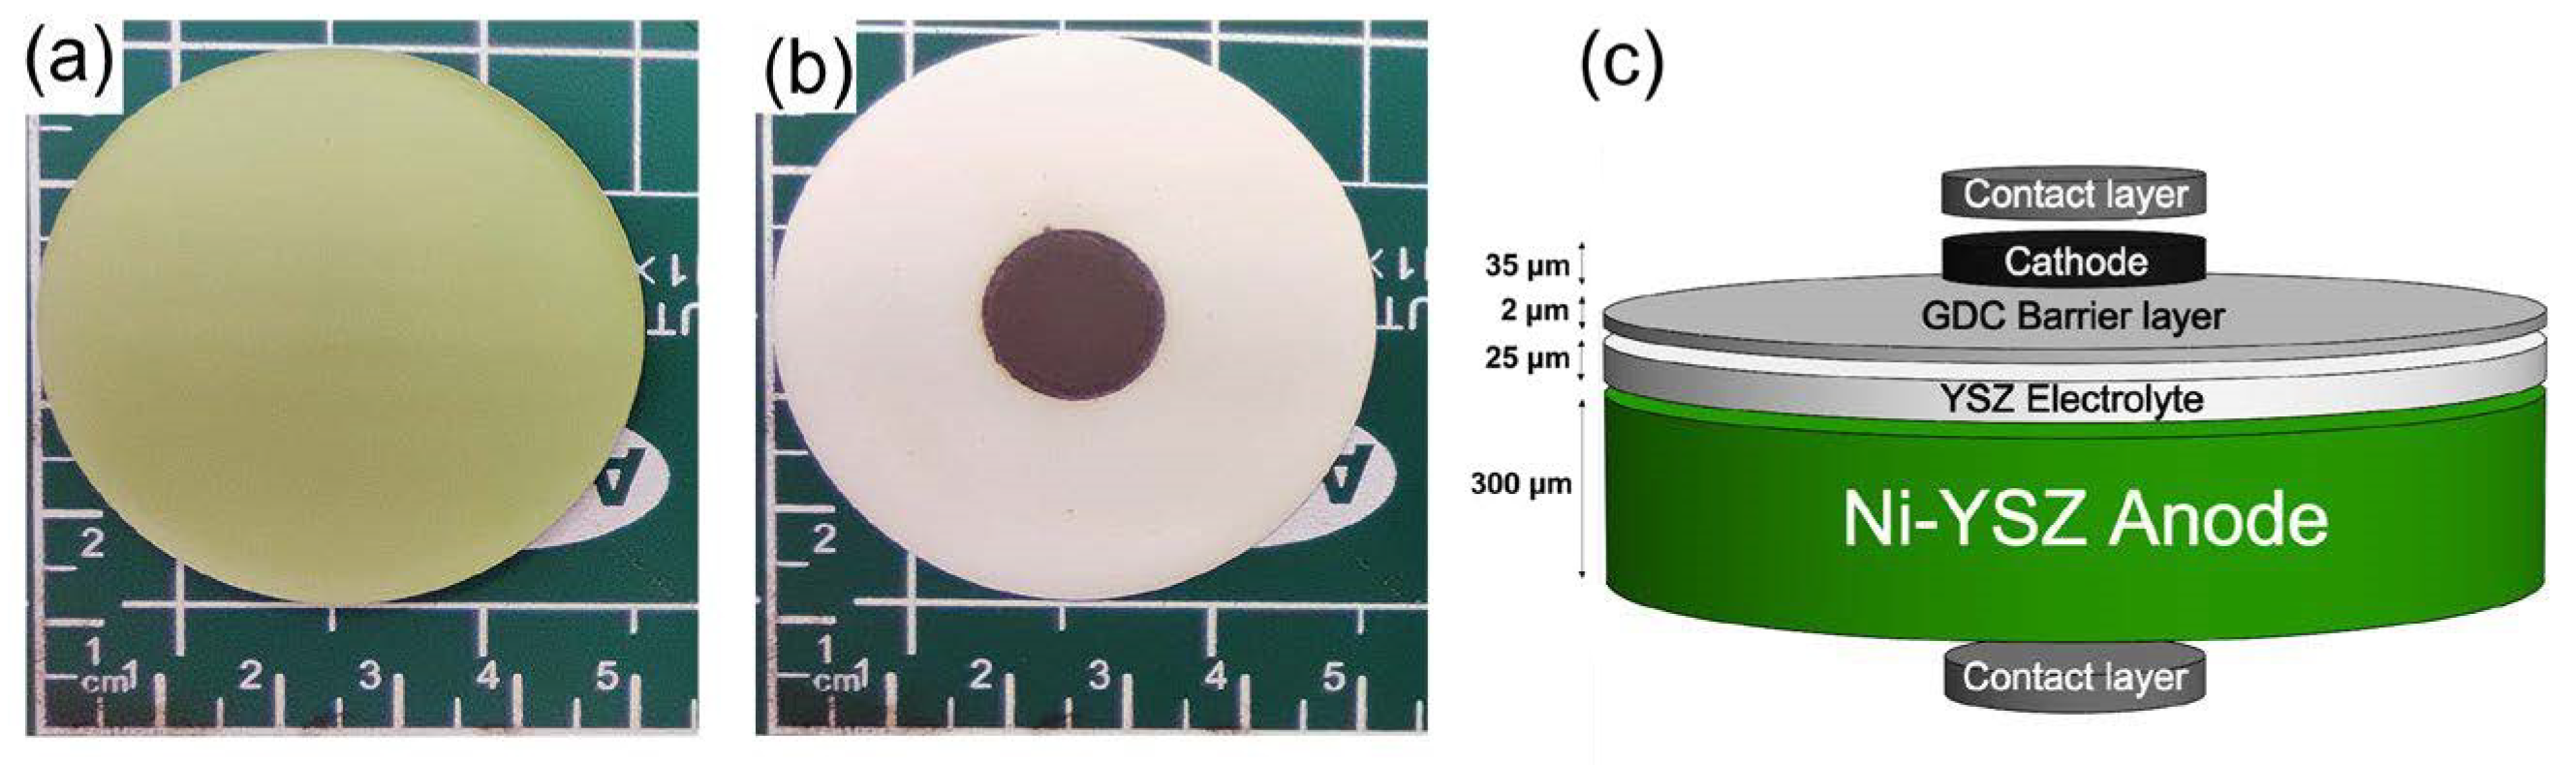
2.2. Material Synthesis and Cell Fabrication

In this study, we start from the premise of comparing synthesized SrCo0.5Fe0.5O3 with its analogs doped with La, Pr, and Sm at only at 1%. This decision is made because greater doping would imply the collapse of the cubic symmetry of the structure. The method used was freeze-drying where cation solutions must be at a basic pH by adding nitric acid. The solutions of the metals are made from the corresponding carbonates and added 0.5:1 ratio of EDTA with respect to metal, according to what was described by Marrero et al. [43]. Once removed from the lyophilizer, the samples were calcined immediately at 850 °C for 4 h and subsequently heated at 1050 °C for 24 h.
For the fabrication of the different cells, a tape casting process was used, obtaining a NiO (Sigma Aldrich)-YSZ (Tosoh) anode support of 300 µm thick, a Ni:YSZ ratio of 37:63% by volume, and 40% porosity after the sintering and reduction process. For the manufacture of the supports, 4 tapes with a diameter of 66 mm and 90 μm thickness were cut and they were later assembled using a Collin model P200E hot plate press, which is programmable in terms of pressure, temperature, and time. Then, the supports were pre-sintered in air at 1050 °C for 1 h before being used for YSZ spraying. The deposition of the electrolyte layers (YSZ) and of the barrier layers GDC (Fuel Cell Materials) were performed by ultrasonic wet powder spraying (WPS) with a Cheersonic UAM4000L equipment, adjusting the layer thicknesses by 25 μm for the electrolyte layers and by 2 μm for the diffusion barrier layer. The different porous cathodic layers were deposited by manual WPS using an Iwata Eclipse HP-BCS airbrush, obtaining layers of 35 μm thickness and an approximate porosity of 25%. In all cases, for the thin film deposition process, the different starting powders used were milled using a ball mill with a dispersant for 24 h, adding 2-propanol as a solvent. The sintering of the thin and fully dense YSZ electrolyte layers were carried out at 1400 °C for 2 h, while the remaining layers were sintered separately, the GDC layers were sintered at 1150 °C for 2 h, and the cathode layers were sintered at 1050 °C for 2 h.
Figure 1 shows the thickness distribution and dimensions of the cells: 50 mm exter-nal diameter with a cathode active area of 1.54 cm2.
Additionally, in order to evaluate the effect on the performance of the manufactured cells, equivalent cells were prepared in which the only difference lies in the elimination of the functional layers of the different cathodes, which, in this case, is the platinum paint used as a current collector that also acts as a functional cathode.

2.3. Characterization

The diffractograms were performed with an Empyrean PANalytical X-ray diffractometer with Cu Kα1 radiation (α = 1.54056 Å) in a range of 2Ɵ from 10° to 80°. The phase identification was performed using the X’Pert HighScore Plus program using the PDF-4 database.
The microstructure and the observation of the thickness of the different layers were examined at CNH2 (Centro Nacional del Hidrógeno, Ciudad Real, Spain) using scanning electron microscopy (SEM) (EOL 6010PLUS/LA. X-ray dispersive energy (EDX) analysis was carried out at SEGAI (Servicio General de Apoyo a la Investigación) with ZEISS EVO 15 (2 nm resolution with 50 mm2 Oxford X-MAX Microanalyzer).
Thermogravimetric measurements were carried out with a TA instrument (New Castle, DE, USA), SDT Q600.
In order to perform the electrochemical test, Pt paste was added into the cathode and anode of each sample to improve the contact between the cells and Ni and Au collectors. The platinum deposition, a few microns thick, is carried out using a fine brush as in most of the cases where this type of electrochemical characterization is performed. The cells were mounted on an Open FlangesTM Test Set (Fiaxell) attached by a spring-loaded mechanism. Then, in order to separate the anode and cathode chambers, mica phlogopite paper was used as a sealant. Electrochemical measurements were collected using a Potentiostat/Galvanostat VSP (Biologic) coupled to a Booster VMP3 (Biologic), using H2 (3 vol% H2O) as fuel gas on the anodic side and air on the cathodic one at temperatures of 750, 800, and 850 °C. The flow rates were set at 2 L/h for H2 and 6 L/h for air and the polarization applied to the impedance test was 30 mA·cm−2.

3. Results and Discussions

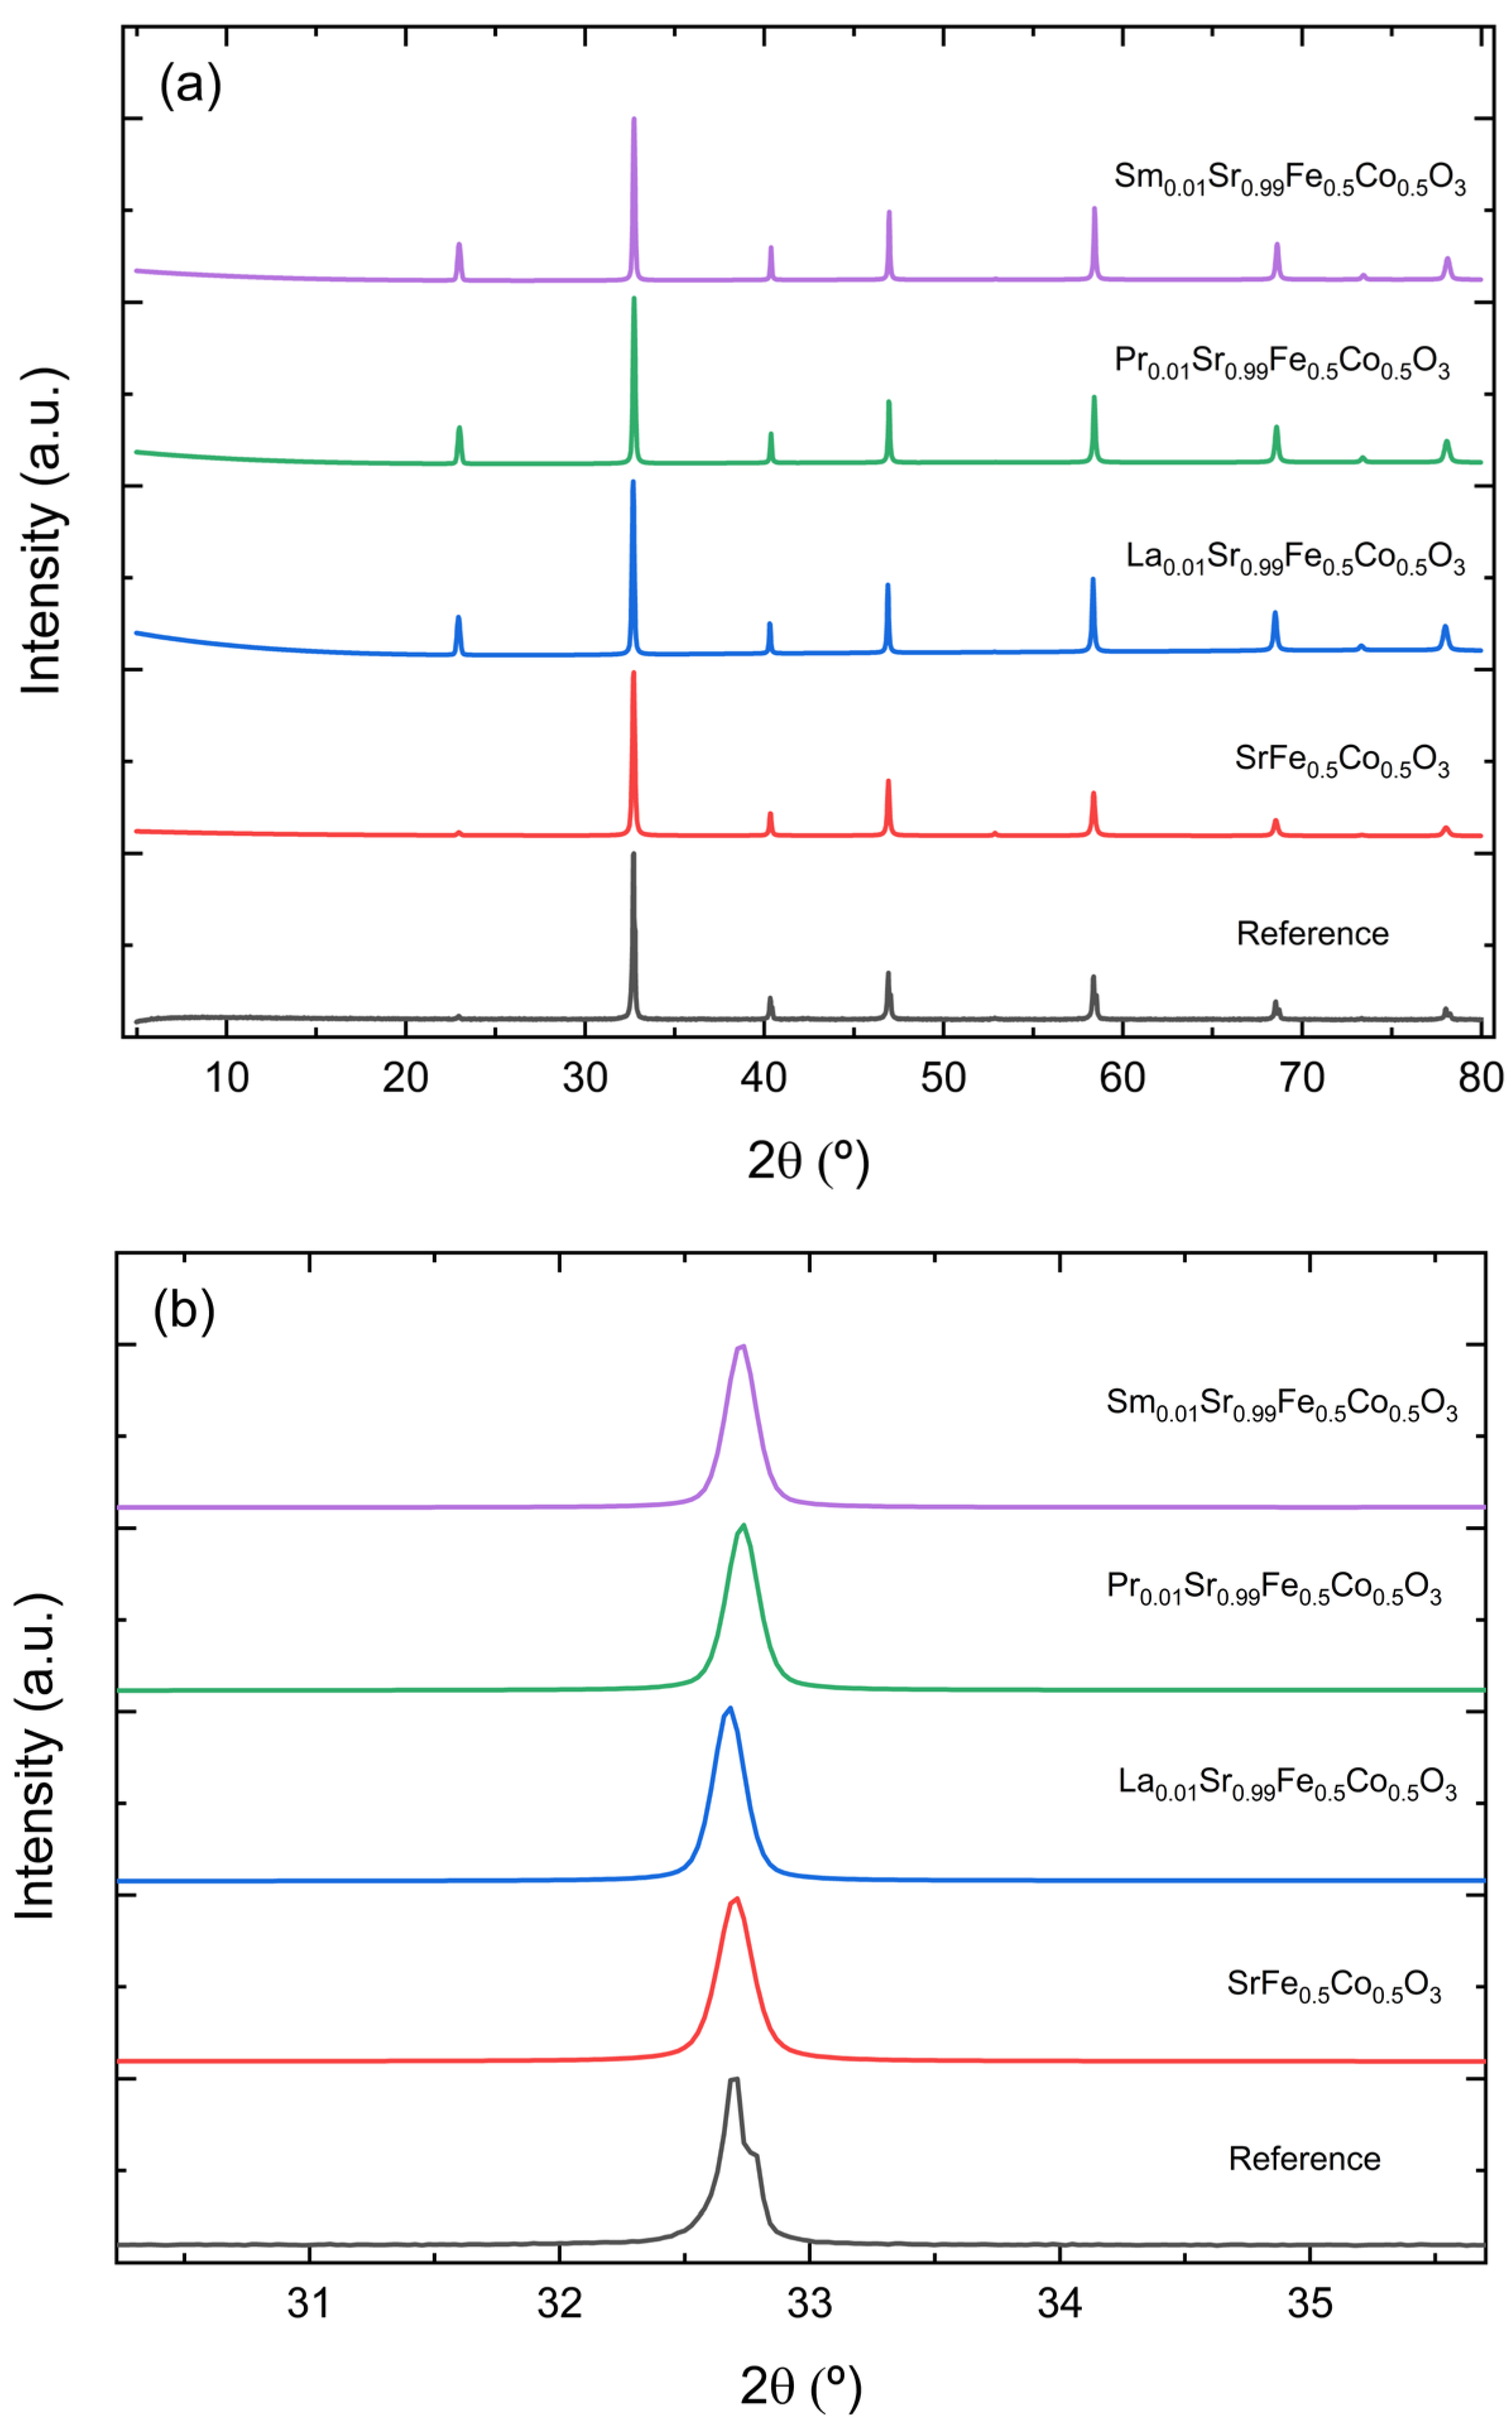
3.1. X-ray Powder Patterns

The XRD patterns are shown in Figure 2. These data presented are consistent with the cubic phase and the space group Pm 3 ¯ m with hkl positions illustrated in Table 1. As can be seen, when the proportions of the atoms are changed, the peaks shift slightly to larger angles. This phenomenon is due to the difference in ionic radius of the atoms in the structure and how they are introduced into it due to the atomic dispersion factor. This fact cannot be seen with the naked eye and that is why Figure 2b shows a zoom of the peaks in the angle with the most intensity. If we look closely, the center of the peaks shifts slightly, which confirms that the structure is being distorted. This distortion is due to the change in the dopant and its introduction into the matrix structure.
Rietveld refinement is a powerful tool for obtaining detailed information about the structure. What was conducted was a comparison of the observed diffraction patterns with those calculated from the proposed structural model. Refinement adjusts these parameters to minimize the difference between the observed and calculated diffraction patterns, using a least square fitting approach. The cell parameters and reliability factors obtained from Rietveld refinements are shown in Table 2. The differences in cell volume are explained by the fact that iron atoms have a larger radius in the case of the first three samples; while in the doped samples, the difference is due to the atoms that share a hole with strontium. The factors obtained from the Rietveld refinement are comparable to the bibliography consulted for this type of phase, so it is considered an optimal refinement for all samples.

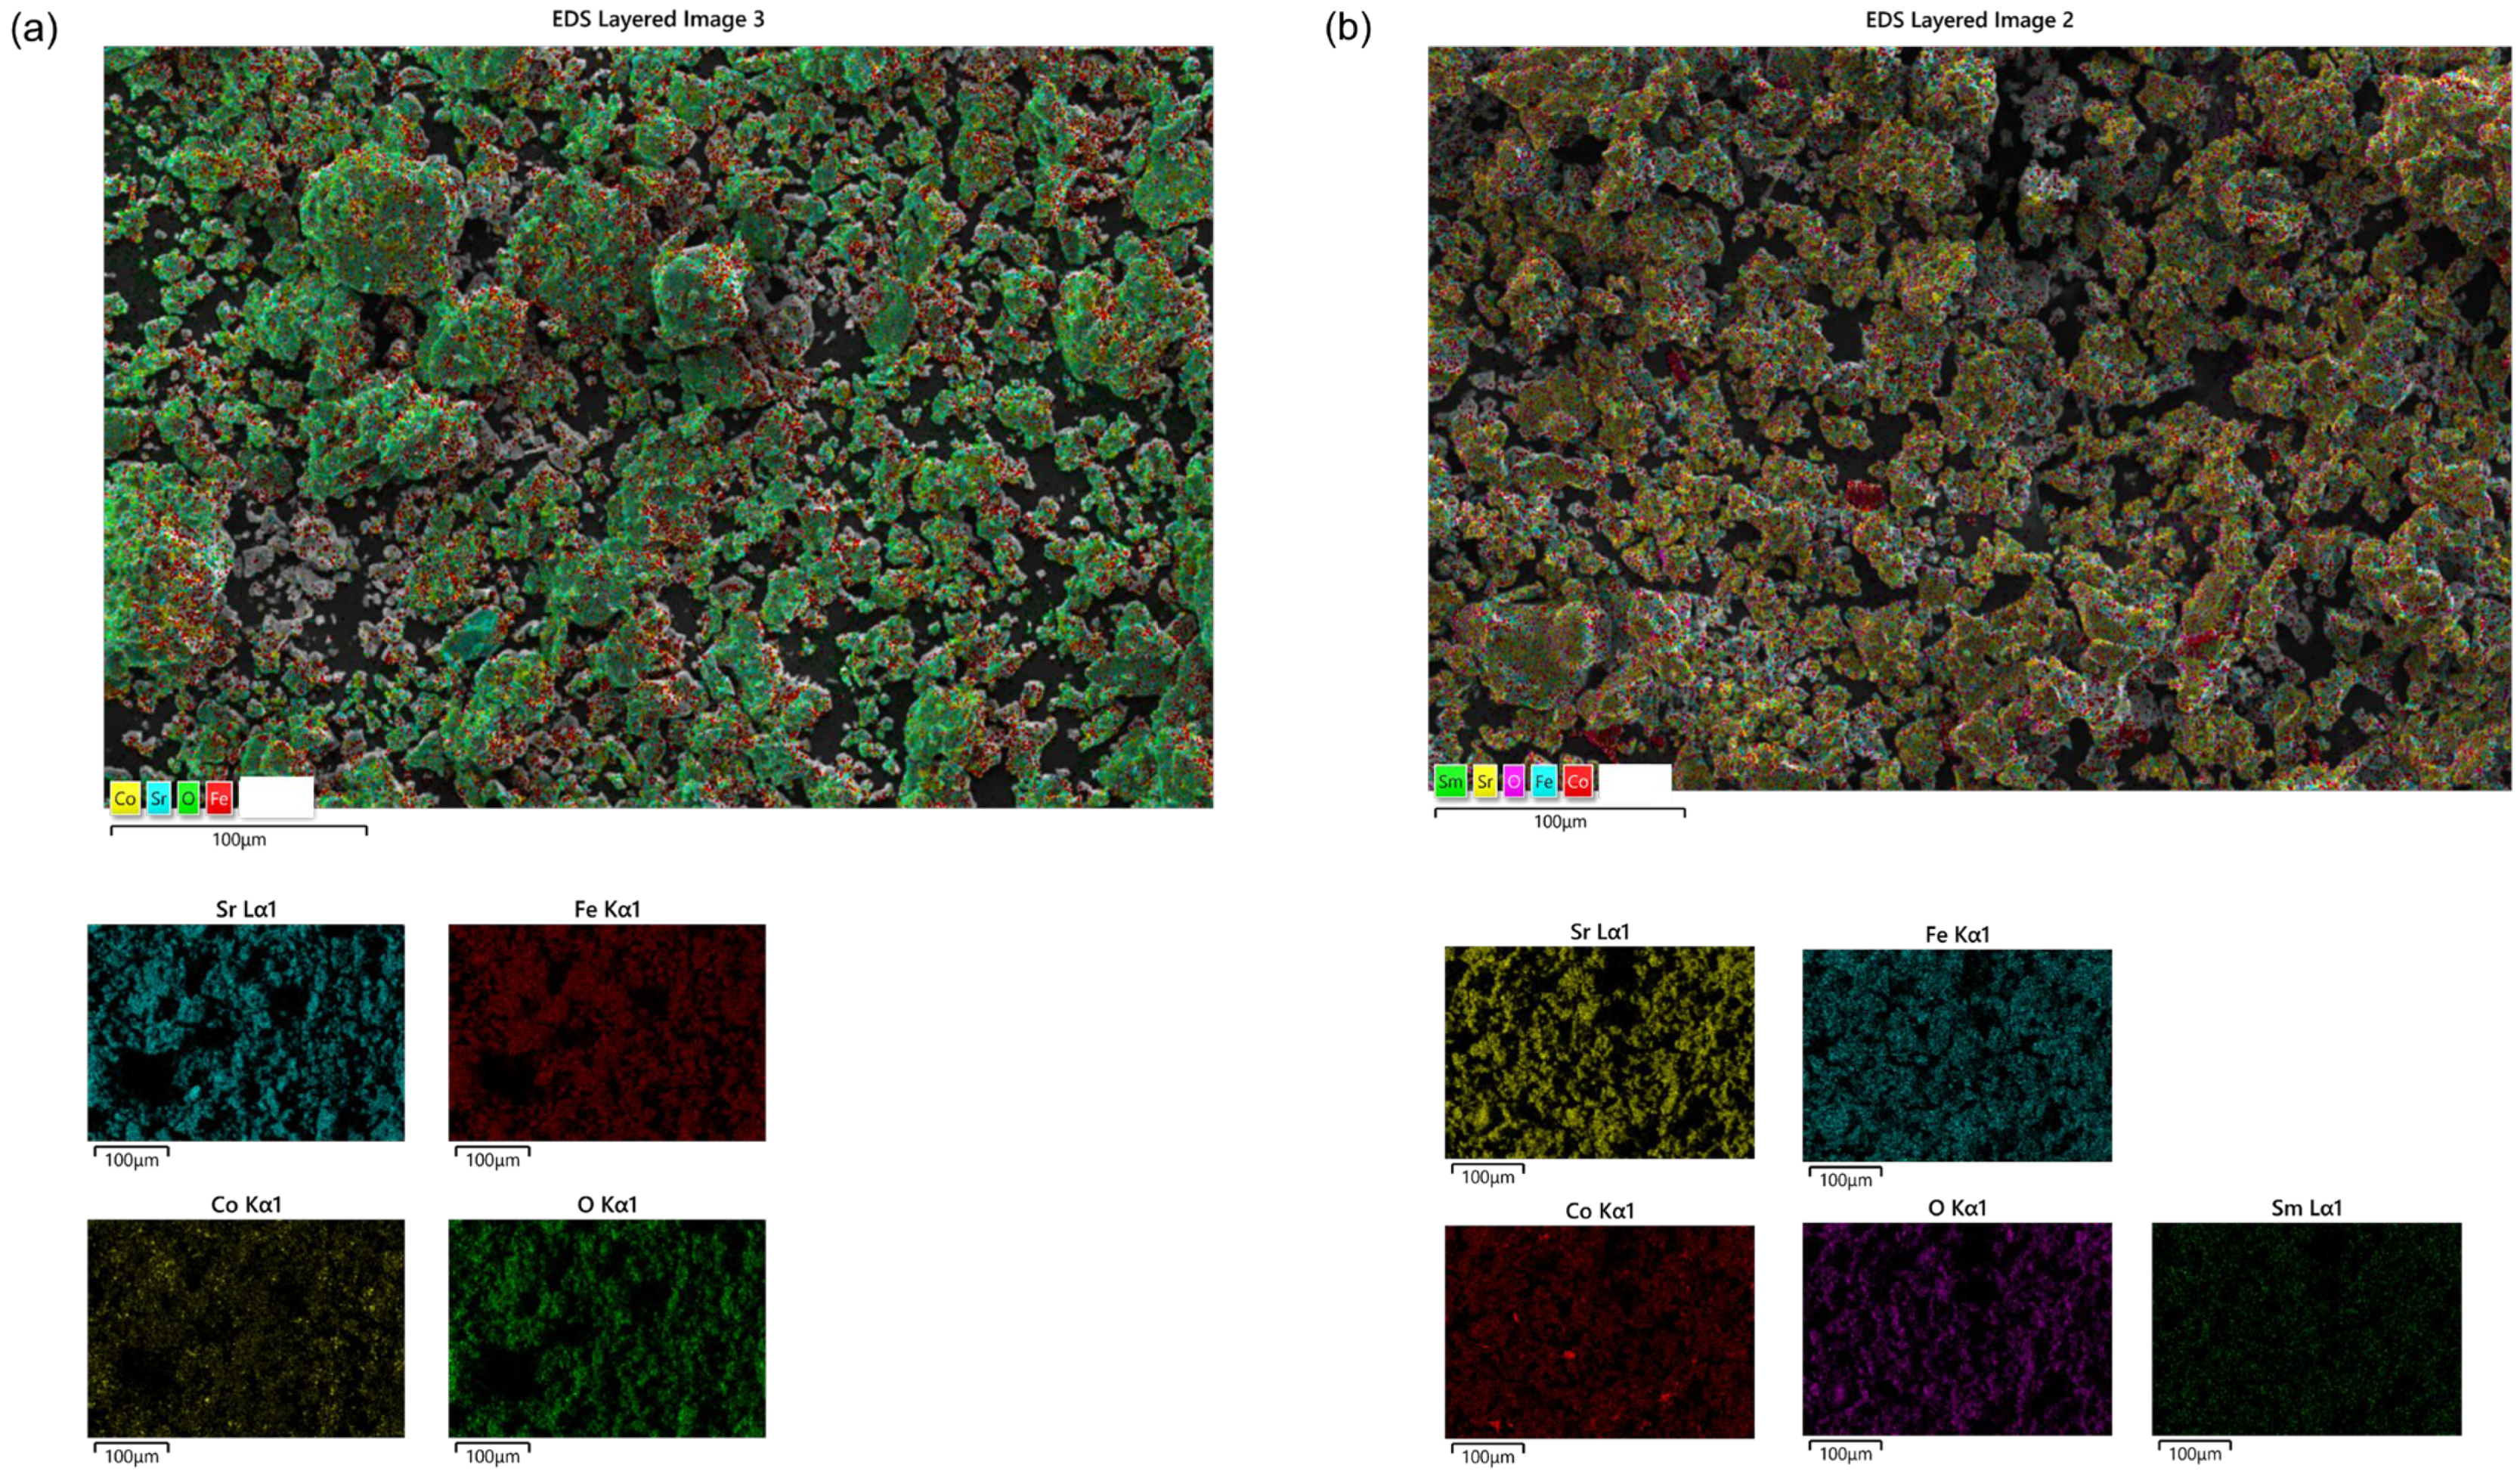
3.2. Morphological Analysis

The morphology of the prepared materials was characterized by SEM. A mapping is also carried out to observe the distribution of atoms in the samples. To see it in a better way, each atom has been colored with a different color (Figure 3). A homogeneous surface is observed in all samples and Table 3 shows the EDX analyzes in which the proportions of the atoms are confirmed. Although the percentage of rare earths is quite precise around 1%, the rest of the atoms differ a little more. Fe and Co differ very little in ionic size and are very easily exchanged, which leads to this difference.
Finally, SEM images of the produced fuel cells have been obtained, in which all the layers can be perfectly observed (Figure 4). It should be noted that these images were after the measurements, so one can ensure that they have not undergone degradation.
The cross sections of the fabricated cells show the microstructure, thickness, homogeneity, and degree of adhesion of the different layers. From the images it can be stated that the 25 μm thick gas tight YSZ electrolyte layers show optimal adhesion to the porous Ni-YSZ substrates, while the barrier layers and functional cathodes show the desired microstructure, homogeneity, thickness, and adhesion even after electrochemical characterization of the systems.

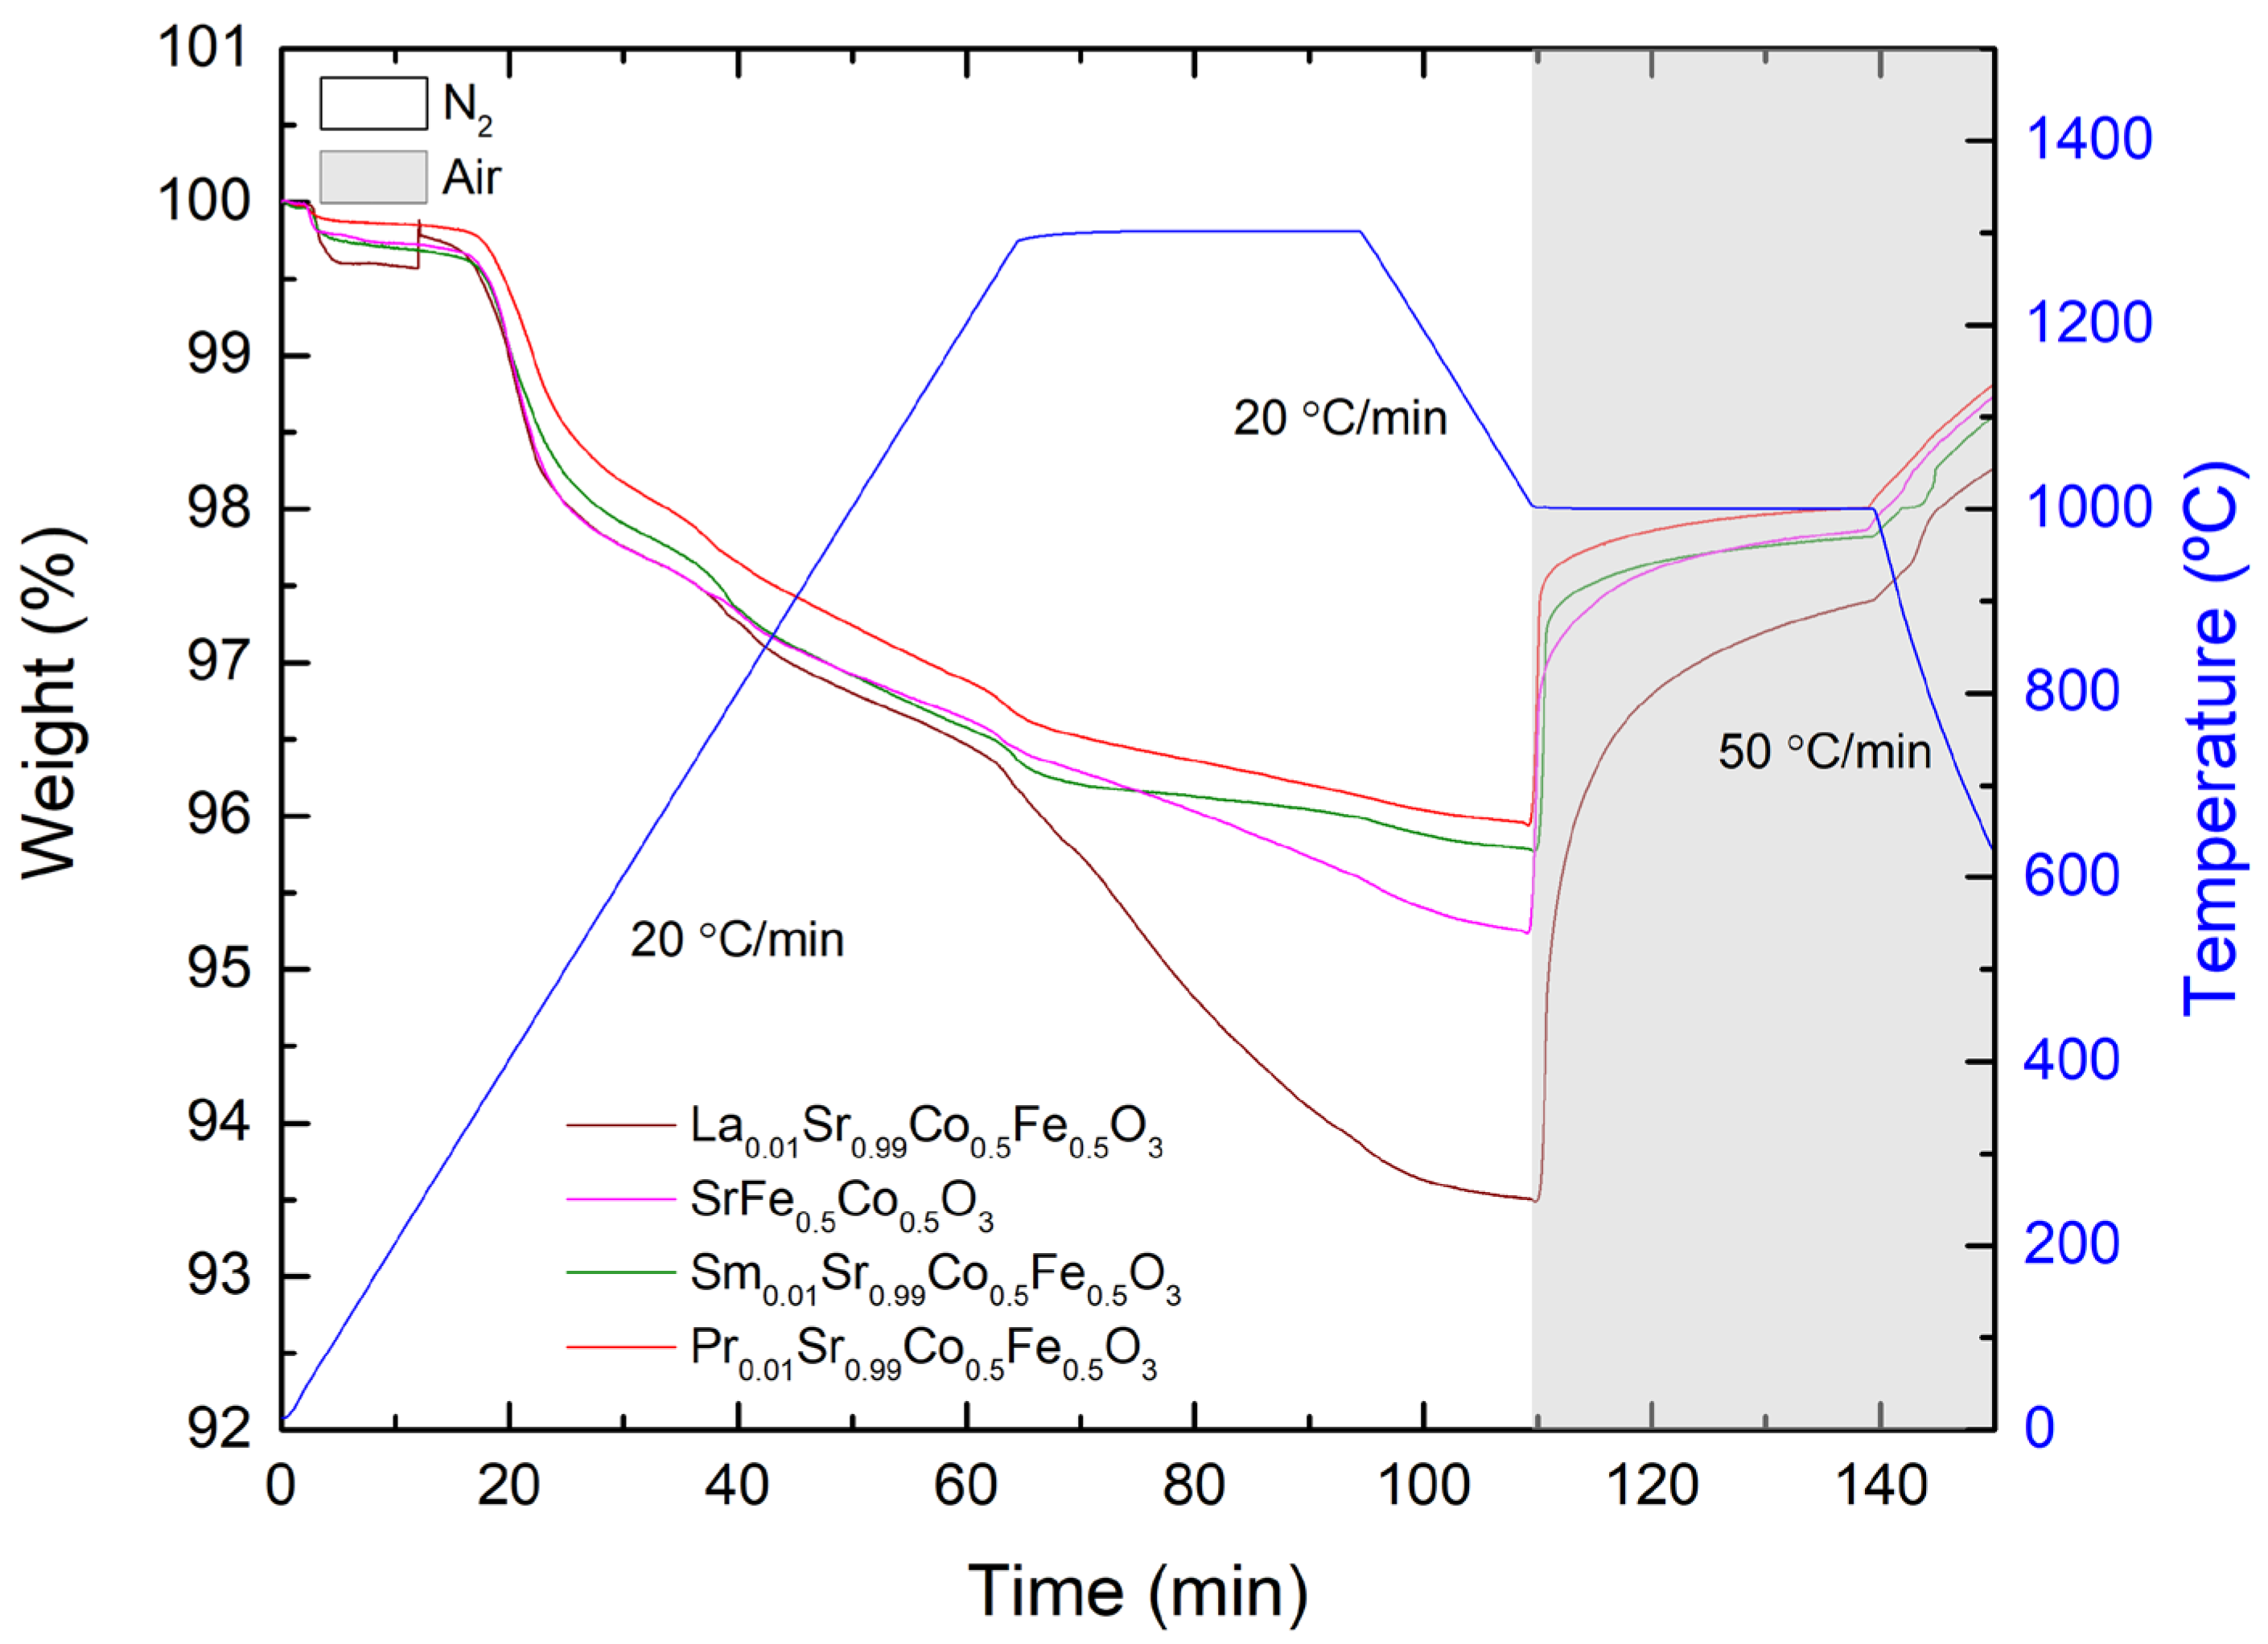
3.3. Thermogravimetric Analysis

The thermal behavior of the samples was studied by thermogravimetric analysis in a temperature range from 20 to 1300 °C, at a heating rate of 20 °C/min, in a reducing and oxidizing atmosphere with a flow rate of 100 mL/min. For this purpose, the samples are heated to 1300 °C in N2 for 30 min. Subsequently, the samples are cooled to 1000 °C, switched to air, and held for 30 min to oxidize the samples. The analyses were performed on a 10 mg sample in platinum crucibles.
Figure 5 shows the results obtained in the thermogravimetric analysis. During the first minutes of the test, up to temperatures of approximately 350 °C, a mass loss associated with the elimination of water and possible carbonates from the synthesis process is observed. After 30 min at 1300 °C in an air atmosphere, the mass loss of each of the synthesized compounds is evaluated. The La doped compound shows the highest mass loss, followed by the undoped compound, followed by the Pr doped compound, and finally the Sm doped compound. This mass loss is associated with the loss of oxygen in each of the materials, which translates into a greater generation of oxygen vacancies, an increase in the ionic conduction of the material, and presumably a better electrochemical response of the compound for the oxygen reduction reaction.

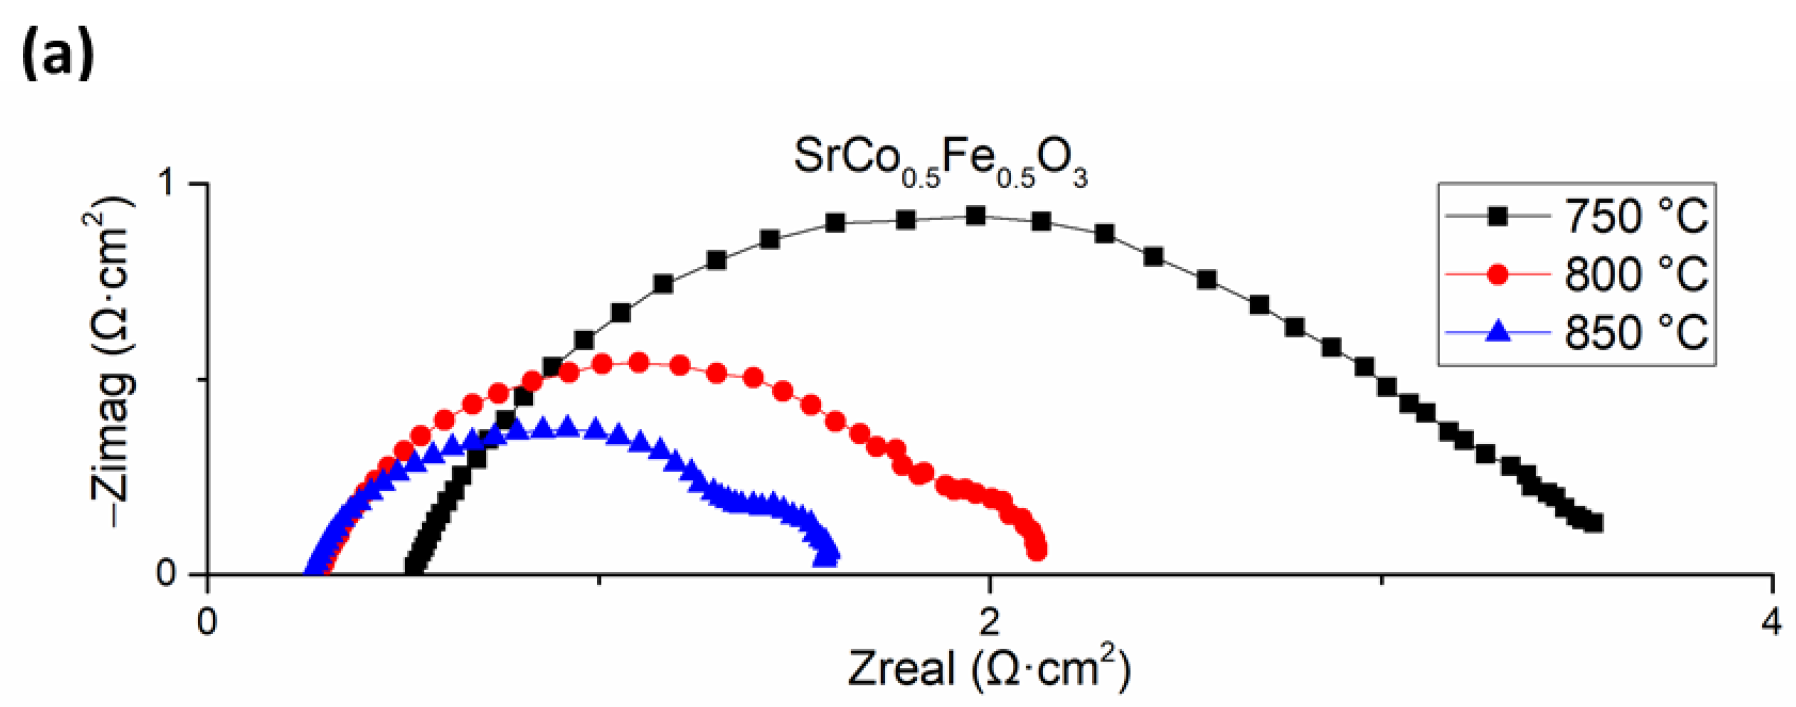
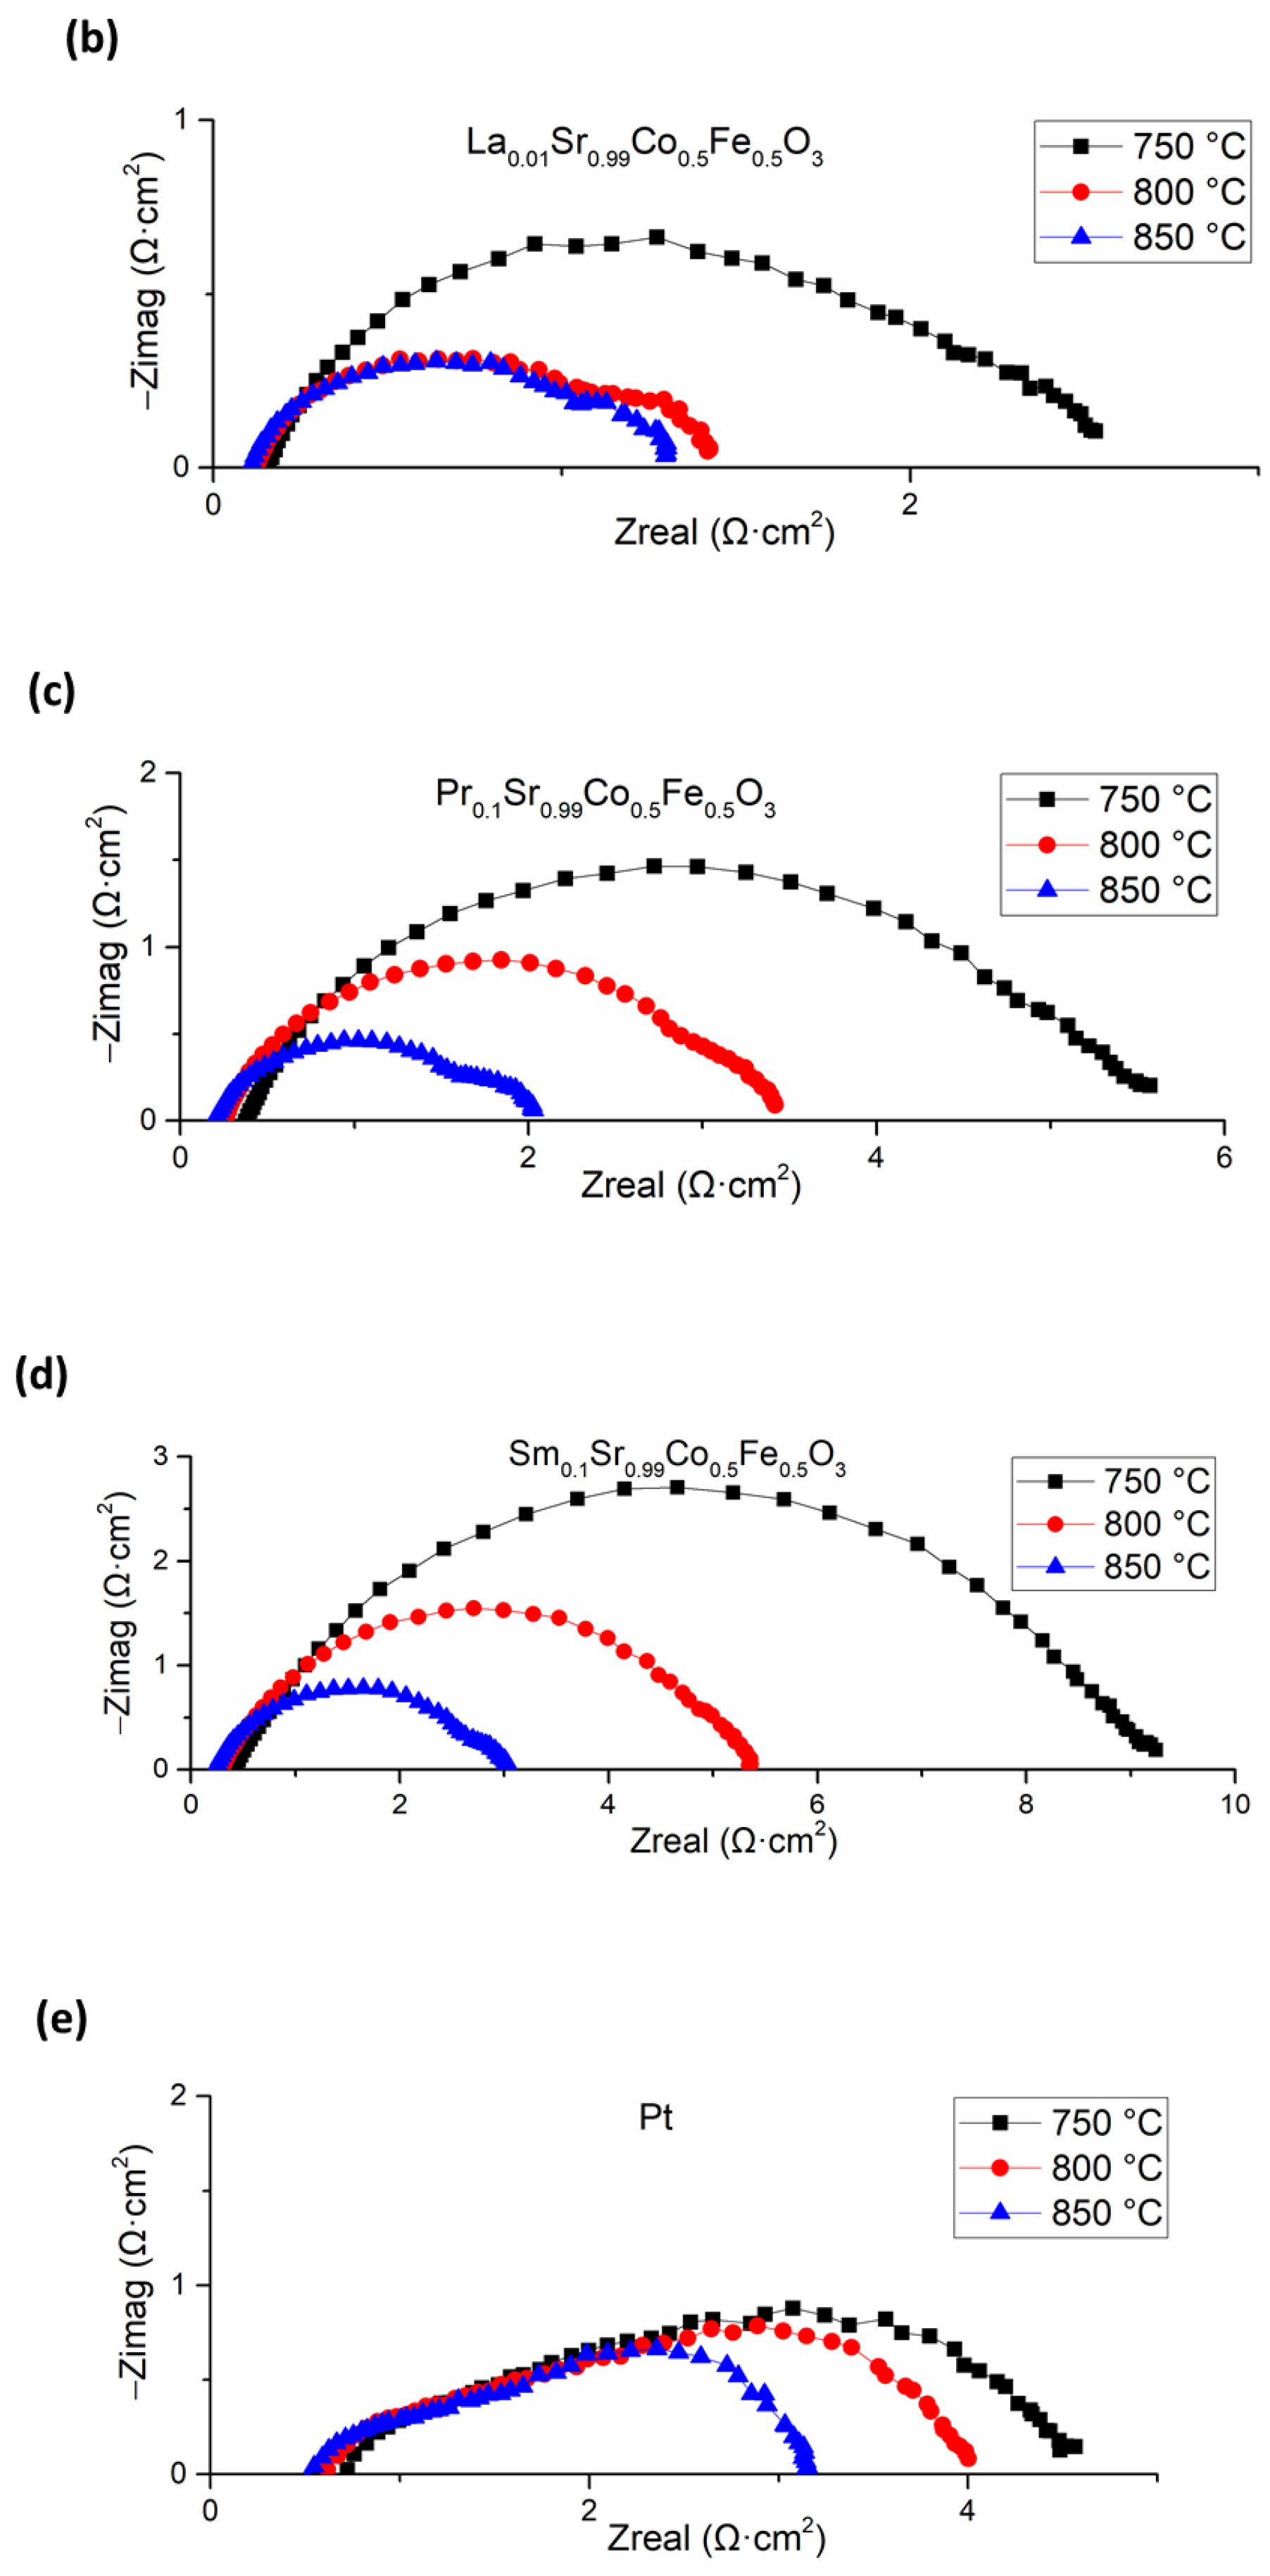
3.4. Cell Electrochemical Characterization

Polarization curves and EIS experiments were carried out at 750, 800, and 850 °C using hydrogen and air as reactant gases in anode and cathode, respectively. The impedance measurements were performed at 50 mA with decreasing frequency from 100 kHz to 1 Hz, with a polarization amplitude of 10 mA.
The current–voltage and current–power characteristics of the cells at these temperatures are given in Figure 6. In all cases, the open circuit voltage (OCV) obtained is approximately 1.1 V, very close to that predicted by the Nernst equation, so we can ensure that the system is adequately sealed and the electrolyte is gas-tight, as can be seen in the images of the cross sections previously shown. In the polarization curves, it is observed that the increase in working temperature significantly affects the electrochemical response of the manufactured cells, decreasing the total resistance of the system and therefore increasing the output power density.
Figure 6a shows the polarization curves for the cell with SrCo0.5Fe0.5O3 as a cathode, where it can be seen that the maximum power densities obtained were 66, 110, and 150 mW∙cm−2 at 750, 800, and 850 °C, respectively. In the case of the cell presenting the La0.01Sr0.99Co0.5Fe0.5O3 cathode (Figure 6b), it can be seen that the maximum power densities obtained were 90, 160, and 185 mW∙cm−2 at 750, 800, and 850 °C, respectively. When the cell is composed of Pr0.01Sr0.99Co0.5Fe0.5O3 cathode (Figure 6c), the maximum power densities obtained were 45, 82, and 135 mW∙cm−2 at 750, 800, and 850 °C, respectively. In the cell presenting the Sm0.01Sr0.99Co0.5Fe0.5O3 cathode (Figure 6d), the maximum power densities obtained were 31, 64, and 118 mW∙cm−2 at 750, 800, and 850 °C, respectively. Finally, in the case presenting the platinum as a cathode (Figure 6e), the maximum power densities obtained were 55, 95, and 150 mW∙cm−2 at 750, 800, and 850 °C, respectively.
From the results shown for the polarization curves, we can conclude that the effect of doping with 1% La increases the power densities with respect to the platinum and un-doped compound in the range of 20–50% in the measured temperature range, while in the case of Pr and Sm, the effect of doping results in a decrease in the values of power densities with respect to the undoped compound in the range of 30–100% and 50–200% in the case of Pr and Sm, respectively. This fact agrees with the thermogravimetric analyses where the loss of oxygen associated with the generation of vacancies has been determined. Whereas, in the case of Pt, this fact could be explained by the mixed conductivity of the material as opposed to the purely electronic conductivity of platinum.
Figure 7 shows the EIS diagrams as a function of temperature for each of the manufactured cells. In all cases, it is observed that as the temperature increases the total resistance values obtained from the intersection of the diagram with the real Z axis in the low frequency zone decrease. From the EIS spectra, it is possible to obtain the ohmic resistance using the real Z-axis intersection values at high frequencies. As expected, the ohmic resistance, mainly associated with the YSZ electrolyte, decreases with increasing temperature and presents equivalent values for each of the cells (same electrolyte thickness in all cells). In the case of the polarization resistance, obtained from the difference between the values of total resistance and ohmic resistance, it can be concluded that as in the previous case, the polarization resistances decrease with increasing temperature.
In general, we can conclude that at the ohmic drop, the activation of the electrodes as well as the diffusion processes are thermally activated. Furthermore, the results obtained for the impedance tests agree perfectly with those shown in the case of the polarization curves and thermogravimetric analyses. The values of each of the resistances obtained at different temperatures for the manufactured cells are shown in Table 4 and are in accordance with the I-V-P curves. However, it is important to note that the measurements have been carried out at 30 mAcm−2 bias current, which corresponds to a region of the curve where activation polarization prevails and, at this point, platinum has the highest total resistance presumably due to its lower mixed conductivity compared to the undoped sample.
Compared with other bibliographic studies such as the Ba0.09Co0.7Fe0.2Nb0.1O3 system [44], the Sr0.4La0.6Fe0.8Cu0.2O3 system [45], and other similar works such as the Sr0.6La0.4Ni0.2Fe0.8O3 compound [46] and Sr0.5Ba0.5Zn0.2Fe0.8O3 sample [47], the results obtained show slightly lower electrochemical performances; however, we can assure the literature of the fact that although the synthesized materials still need microstructural optimization to improve the electrochemical response as a SOFC cathode, the synthesized materials are very promising since they present acceptable electrochemical performances, reducing the rare-earth content to 1%.

4. Conclusions

In the present work, the effect of doping the SrCo0.5Fe0.5O3 system with minimal amounts of rare earths on the electrochemical response of solid oxide fuel cells that have these compounds as cathodes has been evaluated. The obtained doped perovskites have been successfully synthesized with high purity. In addition, the results of I-V-P and EIS curve characterization verified the very good electrochemical performance of these materials at the three temperatures studied. It has been demonstrated that in all cases when the temperature was increased from 750 to 800 and 850 °C, we obtained reduced total resistances and power densities. From the electrochemical tests, we can conclude that the effect of doping with 1% La increases the power densities with respect to the undoped compound in the range of 20–50% in the measured temperature range, while in the case of Pr and Sm, the effect of doping results in a decrease in the values of power densities with respect to the undoped compound in the range of 30–100% and 50–200% in the case of Pr and Sm, respectively. It is important to highlight that currently, there is enormous interest in reducing the rare-earth content in solid oxide fuel cell systems and, with this study, the viability of the use of the La0.01Sr0.99Co0.5Fe0.5O3 system has been demonstrated.

Author Contributions

Conceptualization, R.C., S.D.-G., A.D.L.-G. and B.G.-H.; methodology, S.D.-G., R.C., R.A. and A.P.; software, S.D.-G., R.A. and A.P.; validation, S.D.-G. and A.D.L.-G.; formal analysis, S.D.-G. and A.D.L.-G.; investigations, R.C., R.A. and A.P.; resources, R.C.; data curation, R.C., R.A. and A.P.; writing—original draft preparation, S.D.-G., R.C. and R.A.; writing—review and editing, R.C., S.D.-G., A.D.L.-G., B.G.-H. and R.A.; visualization, R.C., R.A. and A.P.; supervision, R.C., A.D.L.-G. and B.G.-H.; project administration, A.D.L.-G. and R.C.; funding acquisition, R.C. All authors have read and agreed to the published version of the manuscript.

Funding

This research was funded by Complementary Renewable Energy and Hydrogen Plan of the Recovery, Transformation and Resilience Plan funded by the European Union-Next Generation-EU, grant number C17.I01.P01 & State Research Agency, Ministry of Science, Innovation and Universities (Spain), grant number PID2020 115935RA C44.

Data Availability Statement

Data are contained within the article.

Conflicts of Interest

The authors declare no conflicts of interest.

References

  1. Choudhury, A.; Chandra, H.; Arora, A. Application of Solid Oxide Fuel Cell Technology for Power Generation—A Review. Renew. Sustain. Energy Rev. 2013, 20, 430–442. [Google Scholar] [CrossRef]
  2. Esposito, V.; Garbayo, I.; Linderoth, S.; Pryds, N. Solid-Oxide Fuel Cells. In Epitaxial Growth of Complex Metal Oxides; Elsevier: Amsterdam, The Netherlands, 2015; pp. 443–478. [Google Scholar]
  3. Chen, D.; Chen, X. Luminescent Perovskite Quantum Dots: Synthesis, Microstructures, Optical Properties and Applications. J. Mater. Chem. C Mater. 2019, 7, 1413–1446. [Google Scholar] [CrossRef]
  4. Shamsi, J.; Urban, A.S.; Imran, M.; De Trizio, L.; Manna, L. Metal Halide Perovskite Nanocrystals: Synthesis, Post-Synthesis Modifications, and Their Optical Properties. Chem. Rev. 2019, 119, 3296–3348. [Google Scholar] [CrossRef]
  5. Bera, S.; Pradhan, N. Perovskite Nanocrystal Heterostructures: Synthesis, Optical Properties, and Applications. ACS Energy Lett. 2020, 5, 2858–2872. [Google Scholar] [CrossRef]
  6. Rodríguez-Romero, J.; Clasen Hames, B.; Galar, P.; Fakharuddin, A.; Suarez, I.; Schmidt-Mende, L.; Martínez-Pastor, J.P.; Douhal, A.; Mora-Seró, I.; Barea, E.M. Tuning Optical/Electrical Properties of 2D/3D Perovskite by the Inclusion of Aromatic Cation. Phys. Chem. Chem. Phys. 2018, 20, 30189–30199. [Google Scholar] [CrossRef]
  7. Yang, F.; Li, M.; Li, L.; Wu, P.; Pradal-Velázquez, E.; Sinclair, D.C. Defect Chemistry and Electrical Properties of Sodium Bismuth Titanate Perovskite. J. Mater. Chem. A Mater. 2018, 6, 5243–5254. [Google Scholar] [CrossRef]
  8. Schade, L.; Wright, A.D.; Johnson, R.D.; Dollmann, M.; Wenger, B.; Nayak, P.K.; Prabhakaran, D.; Herz, L.M.; Nicholas, R.; Snaith, H.J.; et al. Structural and Optical Properties of Cs2AgBiBr6 Double Perovskite. ACS Energy Lett. 2019, 4, 299–305. [Google Scholar] [CrossRef]
  9. Świerczek, K.; Yoshikura, N.; Zheng, K.; Klimkowicz, A. Correlation between Crystal and Transport Properties in LnBa0.5Sr0.5Co1.5Fe0.5O5+δ (Ln—Selected Lanthanides, Y). Solid. State Ion. 2014, 262, 645–649. [Google Scholar] [CrossRef]
  10. Smith, A.J.; Welch, A.J.E. Some Mixed Metal Oxides of Perovskite Structure. Acta Crystallogr. 1960, 13, 653–656. [Google Scholar] [CrossRef]
  11. Luo, P.; Liu, Z.; Xia, W.; Yuan, C.; Cheng, J.; Lu, Y. Uniform, Stable, and Efficient Planar-Heterojunction Perovskite Solar Cells by Facile Low-Pressure Chemical Vapor Deposition under Fully Open-Air Conditions. ACS Appl. Mater. Interfaces 2015, 7, 2708–2714. [Google Scholar] [CrossRef] [PubMed]
  12. Sunarso, J.; Hashim, S.S.; Zhu, N.; Zhou, W. Perovskite Oxides Applications in High Temperature Oxygen Separation, Solid Oxide Fuel Cell and Membrane Reactor: A Review. Prog. Energy Combust. Sci. 2017, 61, 57–77. [Google Scholar] [CrossRef]
  13. Kaus, I.; Wiik, K.; Krogh, B.; Dahle, M.; Hofstad, K.H.; Aasland, S. Stability of SrFeO3-Based Materials in H2O/CO2-Containing Atmospheres at High Temperatures and Pressures. J. Am. Ceram. Soc. 2007, 90, 2226–2230. [Google Scholar] [CrossRef]
  14. Klug, M.T.; Osherov, A.; Haghighirad, A.A.; Stranks, S.D.; Brown, P.R.; Bai, S.; Wang, J.T.W.; Dang, X.; Bulović, V.; Snaith, H.J.; et al. Tailoring Metal Halide Perovskites through Metal Substitution: Influence on Photovoltaic and Material Properties. Energy Environ. Sci. 2017, 10, 236–246. [Google Scholar] [CrossRef]
  15. Giorgi, G.; Fujisawa, J.I.; Segawa, H.; Yamashita, K. Cation Role in Structural and Electronic Properties of 3D Organic-Inorganic Halide Perovskites: A DFT Analysis. J. Phys. Chem. C 2014, 118, 12176–12183. [Google Scholar] [CrossRef]
  16. Troncoso, L.; Gardey, M.C.; Fernández-Díaz, M.T.; Alonso, J.A. New Rhenium-Doped SrCo1-XRexO3-δ Perovskites Performing as Cathodes in Solid Oxide Fuel Cells. Materials 2016, 9, 717. [Google Scholar] [CrossRef]
  17. Wain-Martin, A.; Campana, R.; Morán-Ruiz, A.; Larrañaga, A.; Arriortua, M.I. Synthesis and Processing of SOFC Components for the Fabrication and Characterization of Anode Supported Cells. Bol. Soc. Esp. Ceram. Vidr. 2022, 61, 264–274. [Google Scholar] [CrossRef]
  18. Marcucci, A.; Zurlo, F.; Sora, I.N.; Placidi, E.; Casciardi, S.; Licoccia, S.; Di Bartolomeo, E. A Redox Stable Pd-Doped Perovskite for SOFC Applications. J. Mater. Chem. A Mater. 2019, 7, 5344–5352. [Google Scholar] [CrossRef]
  19. Grunbaum, N.; Mogni, L.; Prado, F.; Caneiro, A. Phase Equilibrium and Electrical Conductivity of SrCo0.8Fe0.2O3-δ. J. Solid. State Chem. 2004, 177, 2350–2357. [Google Scholar] [CrossRef]
  20. Wang, Z.; Zhao, H.; Xu, N.; Shen, Y.; Ding, W.; Lu, X.; Li, F. Electrical Conductivity and Structural Stability of SrCo1-XFexO3-δ. J. Phys. Chem. Solids 2011, 72, 50–55. [Google Scholar] [CrossRef]
  21. Guo, W.; Cui, L.; Xu, H.; Gong, C. Selective Dissolution of A-Site Cations of La0.6Sr0.4Co0.8Fe0.2O3 Perovskite Catalysts to Enhance the Oxygen Evolution Reaction. Appl. Surf. Sci. 2020, 529, 147165. [Google Scholar] [CrossRef]
  22. Li, L.; Song, J.; Lu, Q.; Tan, X. Synthesis of Nano-Crystalline Sm0.5Sr0.5Co(Fe)O3-δ Perovskite Oxides by a Microwave-Assisted Sol-Gel Combustion Process. Ceram. Int. 2014, 40, 1189–1194. [Google Scholar] [CrossRef]
  23. Callister, W.D.; Rethwisch, D.G.; Molera, P.; Salán Ballesteros, M.N. Ciencia e Ingeniería de Los Materiales; Callister, W.D., Translator; Reverté, S.A., Ed.; Cengage: Barcelona, Spain, 2016; ISBN 9788429172515. [Google Scholar]
  24. Skakle, J.M.S.; West, A.R. Superconducting La1.5-xBa1.5+x-yCayCu3Oz Solid Solutions I. Phase Diagram, Cation Stoichiometry and Tc Data. Phys. C 1994, 220, 187–194. [Google Scholar] [CrossRef]
  25. Barón-González, A.J.; Frontera, C.; García-Muñoz, J.L.; Blasco, J.; Ritter, C.; Valencia, S.; Feyerhermd, R.; Dudzik, E. Exploration of Magnetic Order in Pr0.5Ca0.5CoO3-δ (δ=0) below the Metal-Insulator Transition. Phys. Procedia 2010, 8, 73–77. [Google Scholar] [CrossRef]
  26. Webber, K.G.; Vögler, M.; Khansur, N.H.; Kaeswurm, B.; Daniels, J.E.; Schader, F.H. Review of the Mechanical and Fracture Behavior of Perovskite Lead-Free Ferroelectrics for Actuator Applications. Smart Mater. Struct. 2017, 26, 063001. [Google Scholar] [CrossRef]
  27. Misra, R.K.; Cohen, B.A.-E.; Etgar, L. Low-Dimensional Organic-Inorganic Halide Perovskite: Structure, Properties, and Applications. Chem. Sus. Chem. 2017, 10, 3712–3721. [Google Scholar] [CrossRef] [PubMed]
  28. Tokura, Y.; Tomioka, Y. Colossal Magnetoresistive Manganites. J. Magn. Magn. Mater. 1999, 200, 1–23. [Google Scholar] [CrossRef]
  29. Atta, N.F.; Galal, A.; El-Ads, E.H. Perovskite Nanomaterials—Synthesis, Characterization, and Applications. In Perovskite Materials—Synthesis, Characterisation, Properties, and Applications; InTech: London, UK, 2016. [Google Scholar]
  30. Pavel, C.C.; Lacal-Arántegui, R.; Marmier, A.; Schüler, D.; Tzimas, E.; Buchert, M.; Jenseit, W.; Blagoeva, D. Substitution Strategies for Reducing the Use of Rare Earths in Wind Turbines. Resour. Policy 2017, 52, 349–357. [Google Scholar] [CrossRef]
  31. Fan, J.H.; Omura, A.; Roca, E. Geopolitics and Rare Earth Metals. Eur. J. Polit. Econ. 2023, 78, 102356. [Google Scholar] [CrossRef]
  32. Massari, S.; Ruberti, M. Rare Earth Elements as Critical Raw Materials: Focus on International Markets and Future Strategies. Resour. Policy 2013, 38, 36–43. [Google Scholar] [CrossRef]
  33. Mogensen, M.; Jensen, K.V.; Jørgensen, J.; Primdahl, S. Progress in Understanding SOFC Electrodes. Solid. State Ion. 2002, 150, 123–129. [Google Scholar] [CrossRef]
  34. Simner, S.P.; Anderson, M.D.; Pederson, L.R.; Stevenson, J.W. Performance Variability of La(Sr)FeO3 SOFC Cathode with Pt, Ag, and Au Current Collectors. J. Electrochem. Soc. 2005, 152, A1851. [Google Scholar] [CrossRef]
  35. Mogensen, M.S.S. Kinetic and Geometric Aspects of Solid Oxide Fuel Cell Electrodes. Solid. State Ion. 1996, 86–88, 1151–1160. [Google Scholar] [CrossRef]
  36. Nielsen, J.; Hjelm, J. Impedance of SOFC Electrodes: A Review and a Comprehensive Case Study on the Impedance of LSM:YSZ Cathodes. Electrochim. Acta 2014, 115, 31–45. [Google Scholar] [CrossRef]
  37. Pan, Z.; Liu, Q.; Ni, M.; Lyu, R.; Li, P.; Chan, S.H. Activation and Failure Mechanism of La0.6Sr0.4Co0.2Fe0.8O3−δ Air Electrode in Solid Oxide Electrolyzer Cells under High-Current Electrolysis. Int. J. Hydrogen Energy 2018, 43, 5437–5450. [Google Scholar] [CrossRef]
  38. Wain-Martin, A.; Morán-Ruiz, A.; Laguna-Bercero, M.A.; Campana, R.; Larrañaga, A.; Slater, P.R.; Arriortua, M.I. SOFC Cathodic Layers Using Wet Powder Spraying Technique with Self Synthesized Nanopowders. Int. J. Hydrogen Energy 2019, 44, 7555–7563. [Google Scholar] [CrossRef]
  39. Jabbari, M.; Bulatova, R.; Tok, A.I.Y.; Bahl, C.R.H.; Mitsoulis, E.; Hattel, J.H. Ceramic Tape Casting: A Review of Current Methods and Trends with Emphasis on Rheological Behaviour and Flow Analysis. Mater. Sci. Eng. B 2016, 212, 39–61. [Google Scholar] [CrossRef]
  40. Wang, Z.; Qian, J.; Cao, J.; Wang, S.; Wen, T. A Study of Multilayer Tape Casting Method for Anode-Supported Planar Type Solid Oxide Fuel Cells (SOFCs). J. Alloys Compd. 2007, 437, 264–268. [Google Scholar] [CrossRef]
  41. Song, J.H.; Park, S.I.; Lee, J.H.; Kim, H.S. Fabrication Characteristics of an Anode-Supported Thin-Film Electrolyte Fabricated by the Tape Casting Method for IT-SOFC. J. Mater. Process Technol. 2008, 198, 414–418. [Google Scholar] [CrossRef]
  42. Carpanese, M.P.; Barbucci, A.; Canu, G.; Viviani, M. BaCe0.85Y0.15O2.925 Dense Layer by Wet Powder Spraying as Electrolyte for SOFC/SOEC Applications. Solid. State Ion. 2015, 269, 80–85. [Google Scholar] [CrossRef]
  43. Marrero López, D. Síntesis y Caracterización de Nuevos Conductores Iónicos Basados En La2Mo2O9; Servicio de Publicaciones de la Universisdad de La Laguna: San Cristóbal de La Laguna, Spain, 2006; ISBN 84-7756-710-7. [Google Scholar]
  44. Yang, Z.; Yang, C.; Jin, C.; Han, M.; Chen, F. Ba0.9Co0.7Fe0.2Nb0.1O3−δ as Cathode Material for Intermediate Temperature Solid Oxide Fuel Cells. Electrochem. Commun. 2011, 13, 882–885. [Google Scholar] [CrossRef]
  45. Zhou, Q.; Xu, L.; Guo, Y.; Jia, D.; Li, Y.; Wei, W.C.J. La0.6Sr0.4Fe0.8Cu0.2O3−δ Perovskite Oxide as Cathode for IT-SOFC. Int. J. Hydrog. Energy 2012, 37, 11963–11968. [Google Scholar] [CrossRef]
  46. Zhu, G.; Fang, X.; Xia, C.; Liu, X. Preparation and Electrical Properties of La0.4Sr0.6Ni0.2Fe0.8O3 Using a Glycine Nitrate Process. Ceram. Int. 2005, 31, 115–119. [Google Scholar] [CrossRef]
  47. Qiu, P.; Li, J.; Jia, L.; Chi, B.; Pu, J.; Li, J.; Chen, F. LaCoO3−δ Coated Ba0.5Sr0.5Co0.8Fe0.2O3-δ Cathode for Intermediate Temperature Solid Oxide Fuel Cells. Electrochim. Acta 2019, 319, 981–989. [Google Scholar] [CrossRef]
Figure 1. (a) Photograph of NiO-YSZ anode support; (b) cathode layer; and (c) layer distribution diagram in cross-section.
Crystals 14 00143 g001
Figure 2. (a) X-ray diffraction patterns of samples (in colors) and their comparison with database ICSD 145868 (in black). (b) Increase in the area around 30° for visualization of the shift of the peaks due to the change in dopant element.
Crystals 14 00143 g002
Figure 3. SEM images of (a) SrCo0.5Fe0.5O3; (b) Sm0.01Sr0.99Co0.5Fe0.5O3; (c) Pr0.01Sr0.99Co0.5Fe0.5O3; and (d) La0.01Sr0.99Co0.5Fe0.5O3.
Crystals 14 00143 g003aCrystals 14 00143 g003b
Figure 4. SEM images of the different samples with the support of Ni-YSZ and the layers of YSZ, GDC, and the cathode. (a) SrCo0.5Fe0.5O3; (b) La0.01Sr0.99Co0.5Fe0.5O3; (c) Pr0.01Sr0.99Co0.5Fe0.5O3; (d) Sm0.01Sr0.99Co0.5Fe0.5O3.
Crystals 14 00143 g004
Figure 5. Thermogravimetric measurements of a redox cycle of the different samples.
Crystals 14 00143 g005
Figure 6. (I-V-P) curves of the cells at 750, 800, and 850 °C using (a) SrCo0.5Fe0.5O3; (b) La0.01Sr0.99Co0.5Fe0.5O3; (c) Pr0.01Sr0.99Co0.5Fe0.5O3; (d) Sm0.01Sr0.99Co0.5Fe0.5O3; and (e) Pt as cathode.
Crystals 14 00143 g006aCrystals 14 00143 g006b
Figure 7. Nyquist diagrams at 750, 800, and 850 °C using (a) SrCo0.5Fe0.5O3; (b) La0.01 Sr0.99Co0.5Fe0.5O3; (c) Pr0.01Sr0.99Co0.5Fe0.5O3; (d) Sm0.01Sr0.99Co0.5Fe0.5O3; and (e) Pt as a cathode.
Crystals 14 00143 g007aCrystals 14 00143 g007b
Table 1. Hkl positions for space group Pm 3 ¯ m by ICSD 145868.
Hkl Positions
h1112222322
k0110112021
l0010010010
22.932.740.346.952.858.368.573.373.378.0
Table 2. Cell parameters and reliability factors.
Samplea (Å)V(Å3)RBraggRpRwpRexpΧ2
SrCo0.5Fe0.5O33.86257.6352.2733.120.87.308.12
La0.01Sr0.99 Co0.5Fe0.5O33.87057.9791.8582.839.427.082.12
Pr0.01Sr0.99Co0.5Fe0.5O33.86857.9150.03637.625.77.5011.7
Sm0.01Sr0.99Co0.5Fe0.5O33.86557.7650.014160.337.111.0711.2
Table 3. EDX analysis in weight percent.
Sample%Sr%Fe%Co%O%Rare Earth
SrCo0.5Fe0.5O335.4330.939.6324.01-
La0.01Sr0.99Co0.5Fe0.5O331.5927.7116.9716.971.07
Pr0.01Sr0.99Co0.5Fe0.5O335.6327.3513.5722.480.97
Sm0.01Sr0.99Co0.5Fe0.5O321.1117.0238.0122.201.06
Table 4. Ohmic and polarization resistances obtained from the EIS of the cells at 750, 800, and 850 °C.
T (°C) SrCo0.5Fe0.5O3La0.01Sr0.99Co0.5Fe0.5O3Pr0.01Sr0.99Co0.5Fe0.5O3Sm0.01Sr0.99Co0.5Fe0.5O3Pt
750Rohm (Ω∙cm2)0.530.160.370.430.72
750Rpol (Ω∙cm2)3.012.375.28.813.84
750Rtotal (Ω∙cm2)3.542.535.579.244.56
800Rohm (Ω∙cm2)0.280.120.260.300.62
800Rpol (Ω∙cm2)1.841.303.165.043.38
800Rtotal (Ω∙cm2)2.121.423.425.344.01
850Rohm (Ω∙cm2)0.260.100.210.240.51
850Rpol (Ω∙cm2)1.321.201.822.802.63
850Rtotal (Ω∙cm2)1.581.302.033.043.14
Disclaimer/Publisher’s Note: The statements, opinions and data contained in all publications are solely those of the individual author(s) and contributor(s) and not of MDPI and/or the editor(s). MDPI and/or the editor(s) disclaim responsibility for any injury to people or property resulting from any ideas, methods, instructions or products referred to in the content.

