Article

Ab Initio Study on the Vibrational and Electronic Properties of Radiation-Induced Defects in Potassium Bromide

by
Alexander Platonenko
1,
Vladimir Pankratov
1,*,
Eugene A. Kotomin
1,
Alma Dauletbekova
2 and
Anatoli I. Popov
1
1
Institute of Solid State Physics, University of Latvia, 8 Kengaraga Street, LV1063 Riga, Latvia
2
L.N. Gumilyov Eurasian National University, Astana 010008, Kazakhstan
*
Author to whom correspondence should be addressed.
Crystals 2024, 14(2), 161; https://doi.org/10.3390/cryst14020161
Submission received: 25 December 2023 / Revised: 29 January 2024 / Accepted: 30 January 2024 / Published: 2 February 2024
(This article belongs to the Section Inorganic Crystalline Materials)

Abstract

:
The vibrational and electronic properties of several basic radiation defects in potassium bromide are computed at the quantum mechanical level using a periodic supercell approach based on hybrid functionals, an all-electron Gaussian-type basis set, and the Crystalcomputer code. The exciton energy in alkali halides is sufficient to create lattice defects, such as F–H Frenkel defect pairs, resulting in a relatively high concentration of single defects and their complexes. Here, we consider eight defects: the electronic F + - and F-centers (bromine vacancy without and with trapped electrons) and their dimers; hole H-center (neutral bromine atom forming the dumbbell ion with a regular B r ion.); V K -center ( B r 2 molecular ion consisting of a hole and two regular ions); and two complex B r 3 defects, combinations of several simple defects. The local geometry and the charge- and spin-density distributions of all defects are analyzed. Every defect shows its characteristic features in Raman spectra, and their comparison with available experimental data is discussed.

1. Introduction

KBr crystals are used as carriers for samples in IR measurements [1] and as models in studies of radiation-induced processes [2,3,4,5,6]. Moreover, when KBr is doped with various impurities, it exhibits excellent radiation storage properties and has, therefore, been proposed as an X-ray and UV photostimulable storage phosphor [7], a thermoluminescent dosimeter [8], or a neutron storage phosphor [9].
As is well known, the irradiation of alkali halides leads to the formation of self-trapped holes ( V K -centers) and primary Frenkel defects: pairs of the F-center (halide vacancy with trapped electrons) and the H-center (interstitial halide atom forming the dumbbell ( H a l ) 2 configuration with a regular anion) [10,11,12]. The basic properties of these defects have been studied through optical and vibrational spectroscopy (Table 1).
The thermal stability of primary radiation defects in KBr has been discussed more than once [13,14,15]. Here, it is important to emphasize that secondary reactions and all changes that occur with points defects, of which there can be several types at the same time, are determined by the least stable defect, which begins to migrate and thus initiates the entire chain of secondary reactions. Furthermore, the release of a mobile defect from traps also often occurs, for example, in the case of H-centers captured on homologous cationic impurities [16] or during the thermal decomposition of a complex hole center ( V 2 -centers, which are ( H a l 3 )) into its simple components ( V k and H) [17,18].
Table 1. The basic optical and vibrational properties of the defects in KBr crystals.
DefectOptical Absorption (eV)Local Vibrational Modes ( cm 1 )
F1.97 [2], 2.0 [3]110, 121 [3]; 175 [4]
H3.2 [2]182, 209 [5]
V K 3.2 [2]144 [5]
V 2 ( Br 3 )4.7 [2], 4.5 [6], 4.6 [19]175 [4,6]
We would like to note that the problems considered in this work are especially important in the following cases. The first is when there are several overlapping optical absorption bands, making the accurate identification of point defects difficult. The second is when the sample receives such a large dose of radiation that the concentration of the created radiation defects is so high that it leads to the saturation of optical absorption and, accordingly, the impossibility of measuring the corresponding spectra. Defect-induced Raman modes were successfully identified in oriented single crystals of yttria-doped CeO 2 , induced by the defect space, including an O 2 vacancy [20]. Another example is the observation of defect-induced Raman spectra in cubic zirconia [21], which also implies oxygen vacancies. As for materials irradiated by radiation, it is essential to mention Ar + ion-irradiated MoS 2 [22], Xe ion-irradiated MgAl 2 O 4 single crystals [23], neutron-irradiated graphite [24], transparent polycrystalline chemical vapor deposition (CVD) diamond films [25], 6H-SiC single crystals [26], Gd 3 Ga 5 O 12 [27], and many others. Theoretically, these issues were recently considered for anion vacancy-containing Al 2 O 3 [28], as well as BaTiO 3 and SrTiO 3 [29].
In alkali halides, Raman spectroscopy measurements are widely used for the identification of the F-centers, but much less information is available on the hole centers. In this paper, using the first principles of quantum chemical methods, we study the properties of basic radiation defects and their complexes in potassium bromide crystals, providing insight into their structural, electronic, and vibrational features.

2. Computational Methods

Calculations were performed using the B3LYP global hybrid functional [30,31], as implemented in the Crystal17 computer code [32]. An all-electron Gaussian-type basis set of double-zeta valence with polarization quality (pob-DZVP-rev2) was used for both K and Br, following the publication by Oliveira et al. [33]. The truncation of the Coulomb and exchange infinite lattice series is controlled by five thresholds for T i (see Crystal manual, Ref. [34], for more details), which were set to 7 ( T 1 T 4 ) and 14 ( T 5 ). The convergence thresholds for the energy in the self-consistent field (SCF) procedure were set to 10 8 and 10 10 E h for the structural and frequency calculations, respectively. Geometry optimization was performed for pristine crystal and every defect prior to the frequency calculations. The calculations were performed on a CINECA MARCONI supercomputer A3 partition with Xeon 8160 (SkyLake) processors, using up to 960 cores for a single calculation.
Two periodic supercell models of extended primitive cells were used: a 250-atom supercell ( S 250 ) for bromine vacancy defects, and a 128-atom supercell S 128 for hole-type defects. The sizes of the selected supercells proved to be sufficient for a proper description of the point defects in alkali halides [35]. Due to the higher symmetry of the F-center defects, it was possible to obtain a solution for the larger model using nearly the same number of resources as for hole-type defects. Overall, the sizes of the basis set (number of AOs) were about 3264 in S 128 and 6343 in S 250 . The reciprocal space was sampled using a regular sub-lattice with a shrinking factor of 4 for S 128 and 2 for S 250 ; this corresponds to a number of k-points ranging from 4 to 18, according to the point symmetry of the defective system. The F + , V K , and Br 3 defects were calculated with an applied neutralizing background charge. The structural files and details of the vibrational calculations can be found in the Supplementary Materials.
The frequencies at the Γ point were obtained within the harmonic approximation by diagonalizing the mass-weighted Hessian matrix, W, whose elements are defined as [36,37,38,39]
W α i , β j Γ = H α i , β j 0 M α M β with H α i , β j 0 = 2 E u α i 0 u β j 0 ,
where M α and M β are the masses of atoms associated with the i and j atomic coordinates. Once the Hessian matrix, H α i , β j , has been calculated, the frequency shifts due to isotopic substitutions can be easily calculated at no additional computational cost by changing the masses in Equation (1). The energy-first derivatives with respect to the atomic positions are calculated analytically for all the coordinates, whereas the second derivatives are calculated numerically using a single displacement along each coordinate.
The relative Raman intensities of the peaks are computed analytically by employing the scheme illustrated in [40,41]. Both schemes are based on the solutions of first- and second-order coupled-perturbed Hartree–Fock/Kohn–Sham (CPHF/KS) equations [42,43,44,45]. The Raman spectrum is then computed by considering the transverse optical (TO) modes and adopting a pseudo-Voigt functional form: a linear combination of a Lorentzian and a Gaussian curve with an FWHM of 8 cm 1 .

3. Results and Discussion
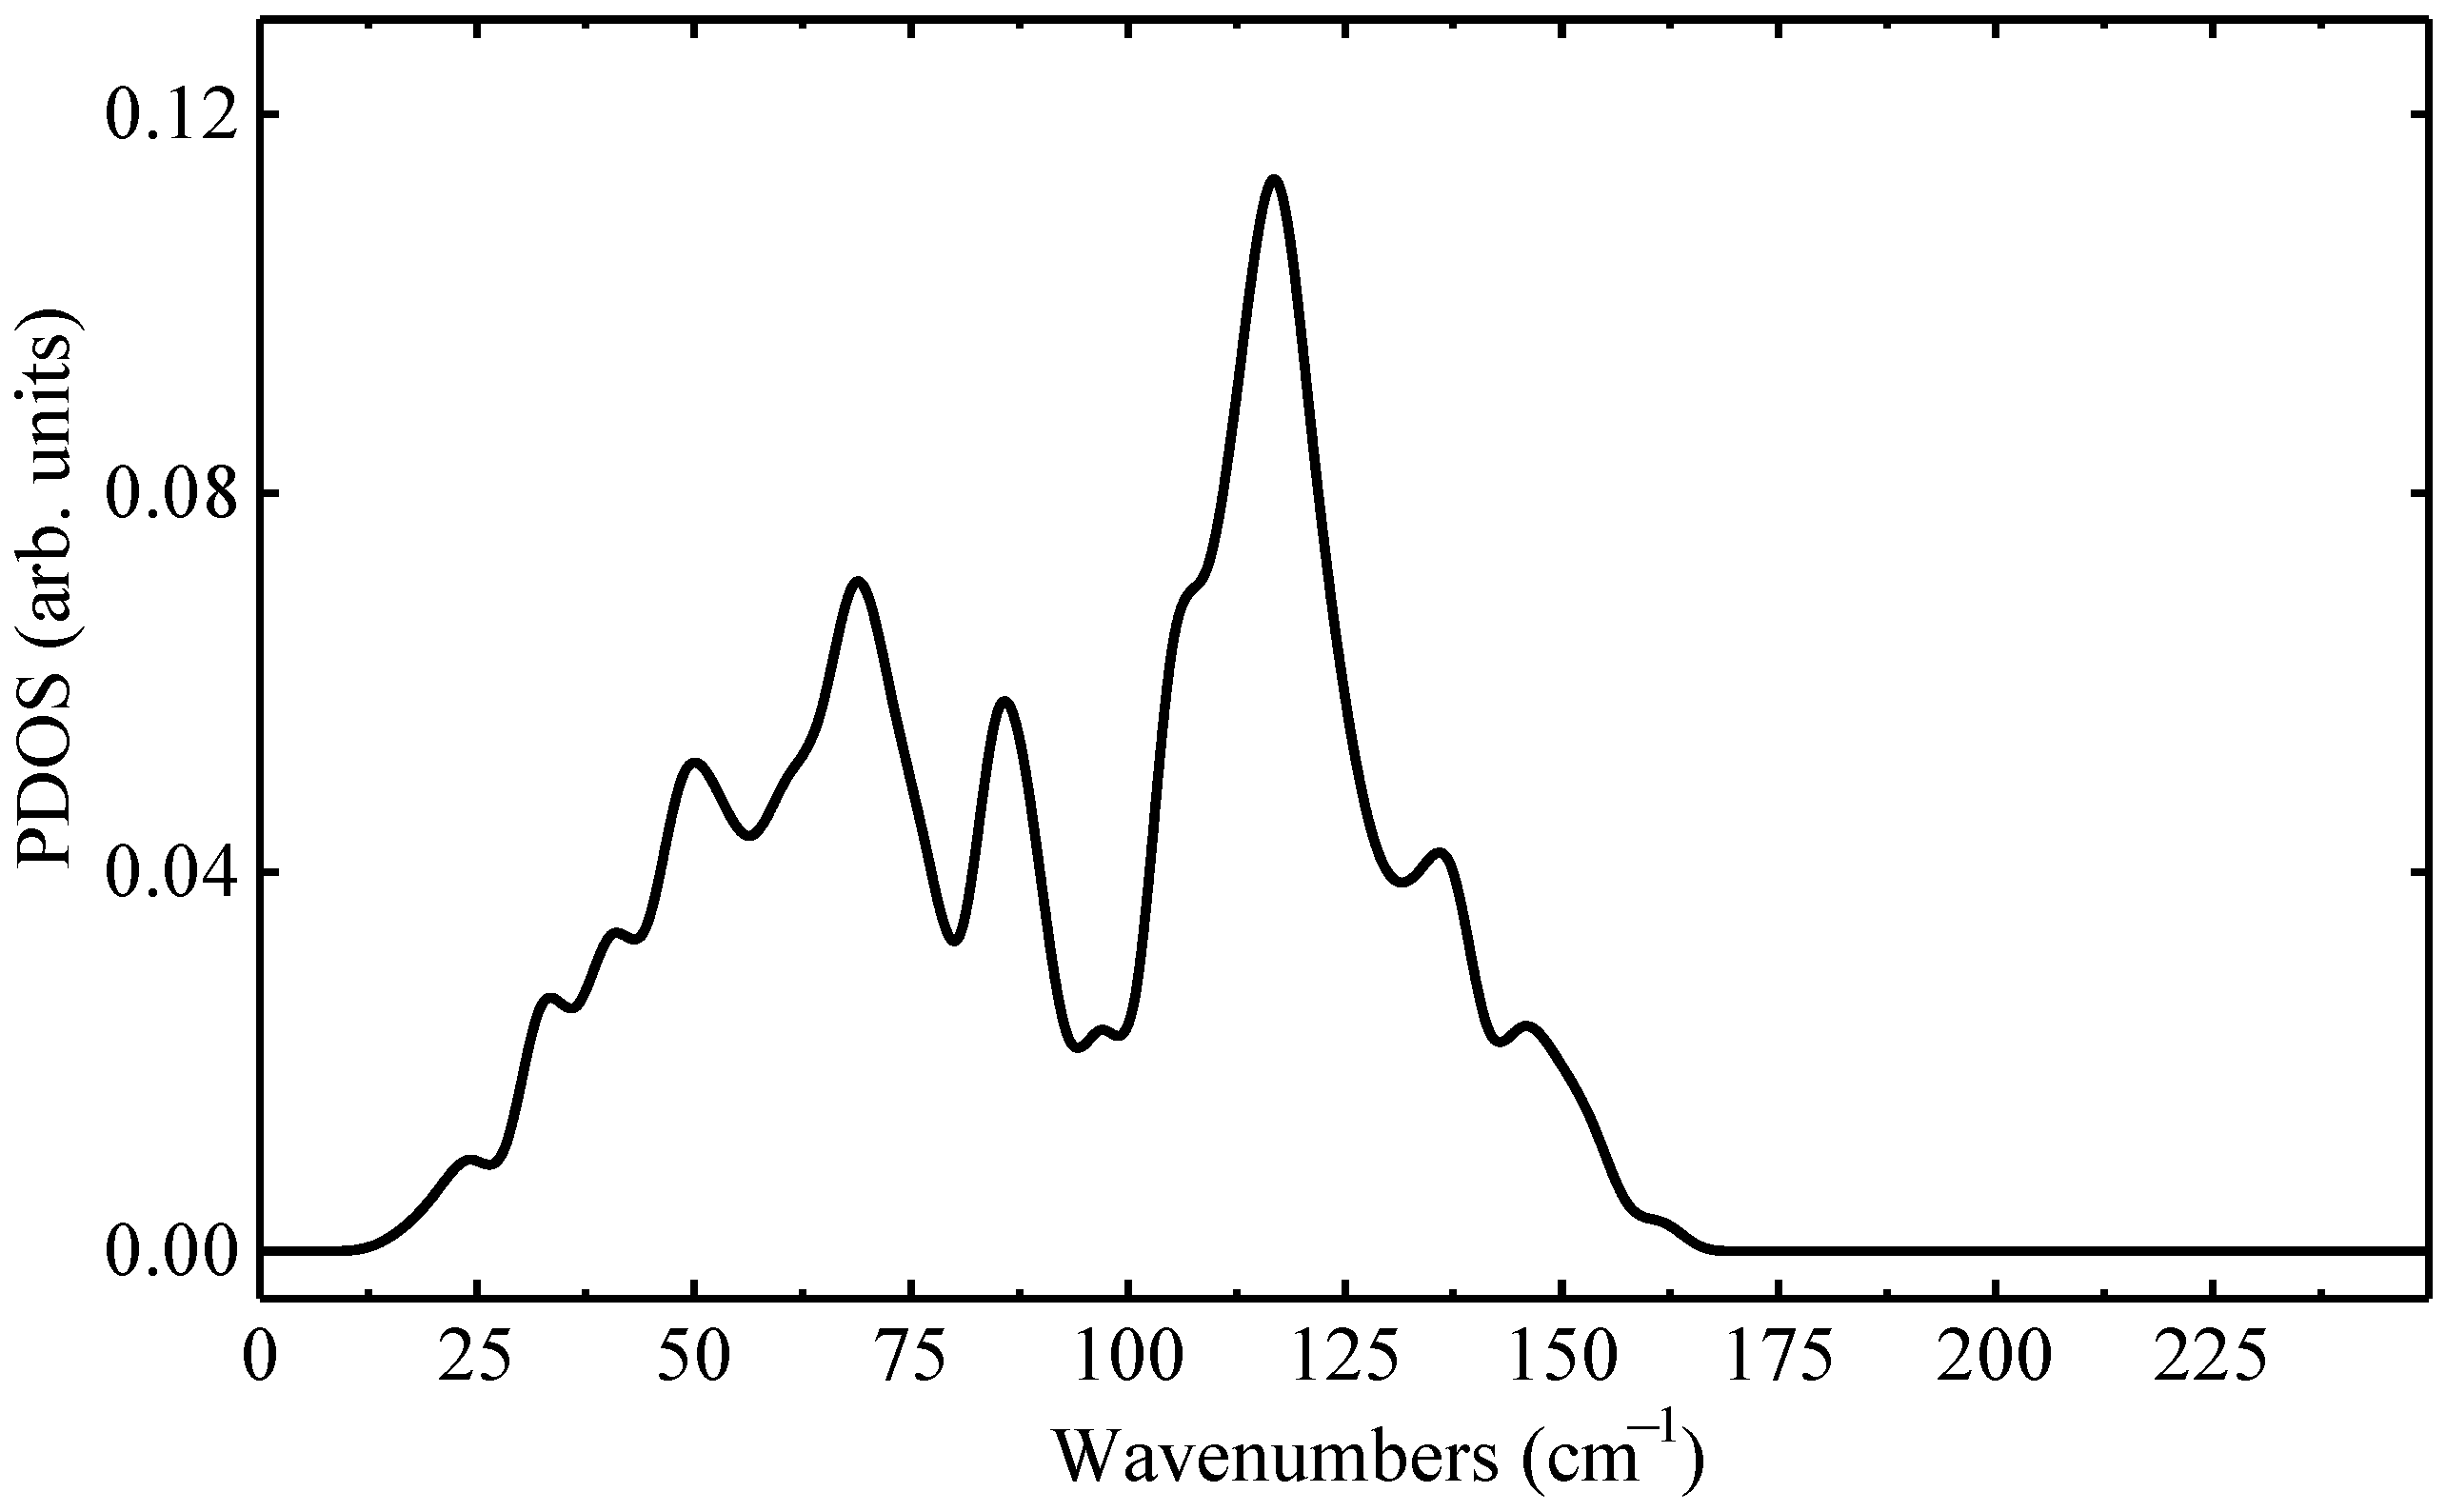
3.1. Perfect KBr

Perfect KBr is an alkali halide with a face-centered cubic lattice belonging to the F m 3 ¯ m (No.225) space group. The calculated lattice parameter (a = 6.606 Å vs. exp. 6.585 Å [46]), providing K-Br 3.303 Å, and the band gap (7.37 eV vs. exp. 7.55 eV [47]) are in good agreement with the experimental data. For a clearer understanding of the defect-induced vibrational modes, we also calculated the phonon density of states (Figure 1), spanning from 16 to 162 cm 1 with a maximum at 122 cm 1 . Experimentally, the LO phonon maximum was observed at 164 cm 1 [4]. The Raman spectra of pristine KBr were silent; however, the symmetry reduction due to the presence of defects in the supercell model may have resulted in modes not directly associated with a defect. Obviously, all modes higher than 162 cm 1 can be easily attributed to the defect, but for those falling in the PDOS region, careful mode analysis with the help of isotopic substitutions was performed.

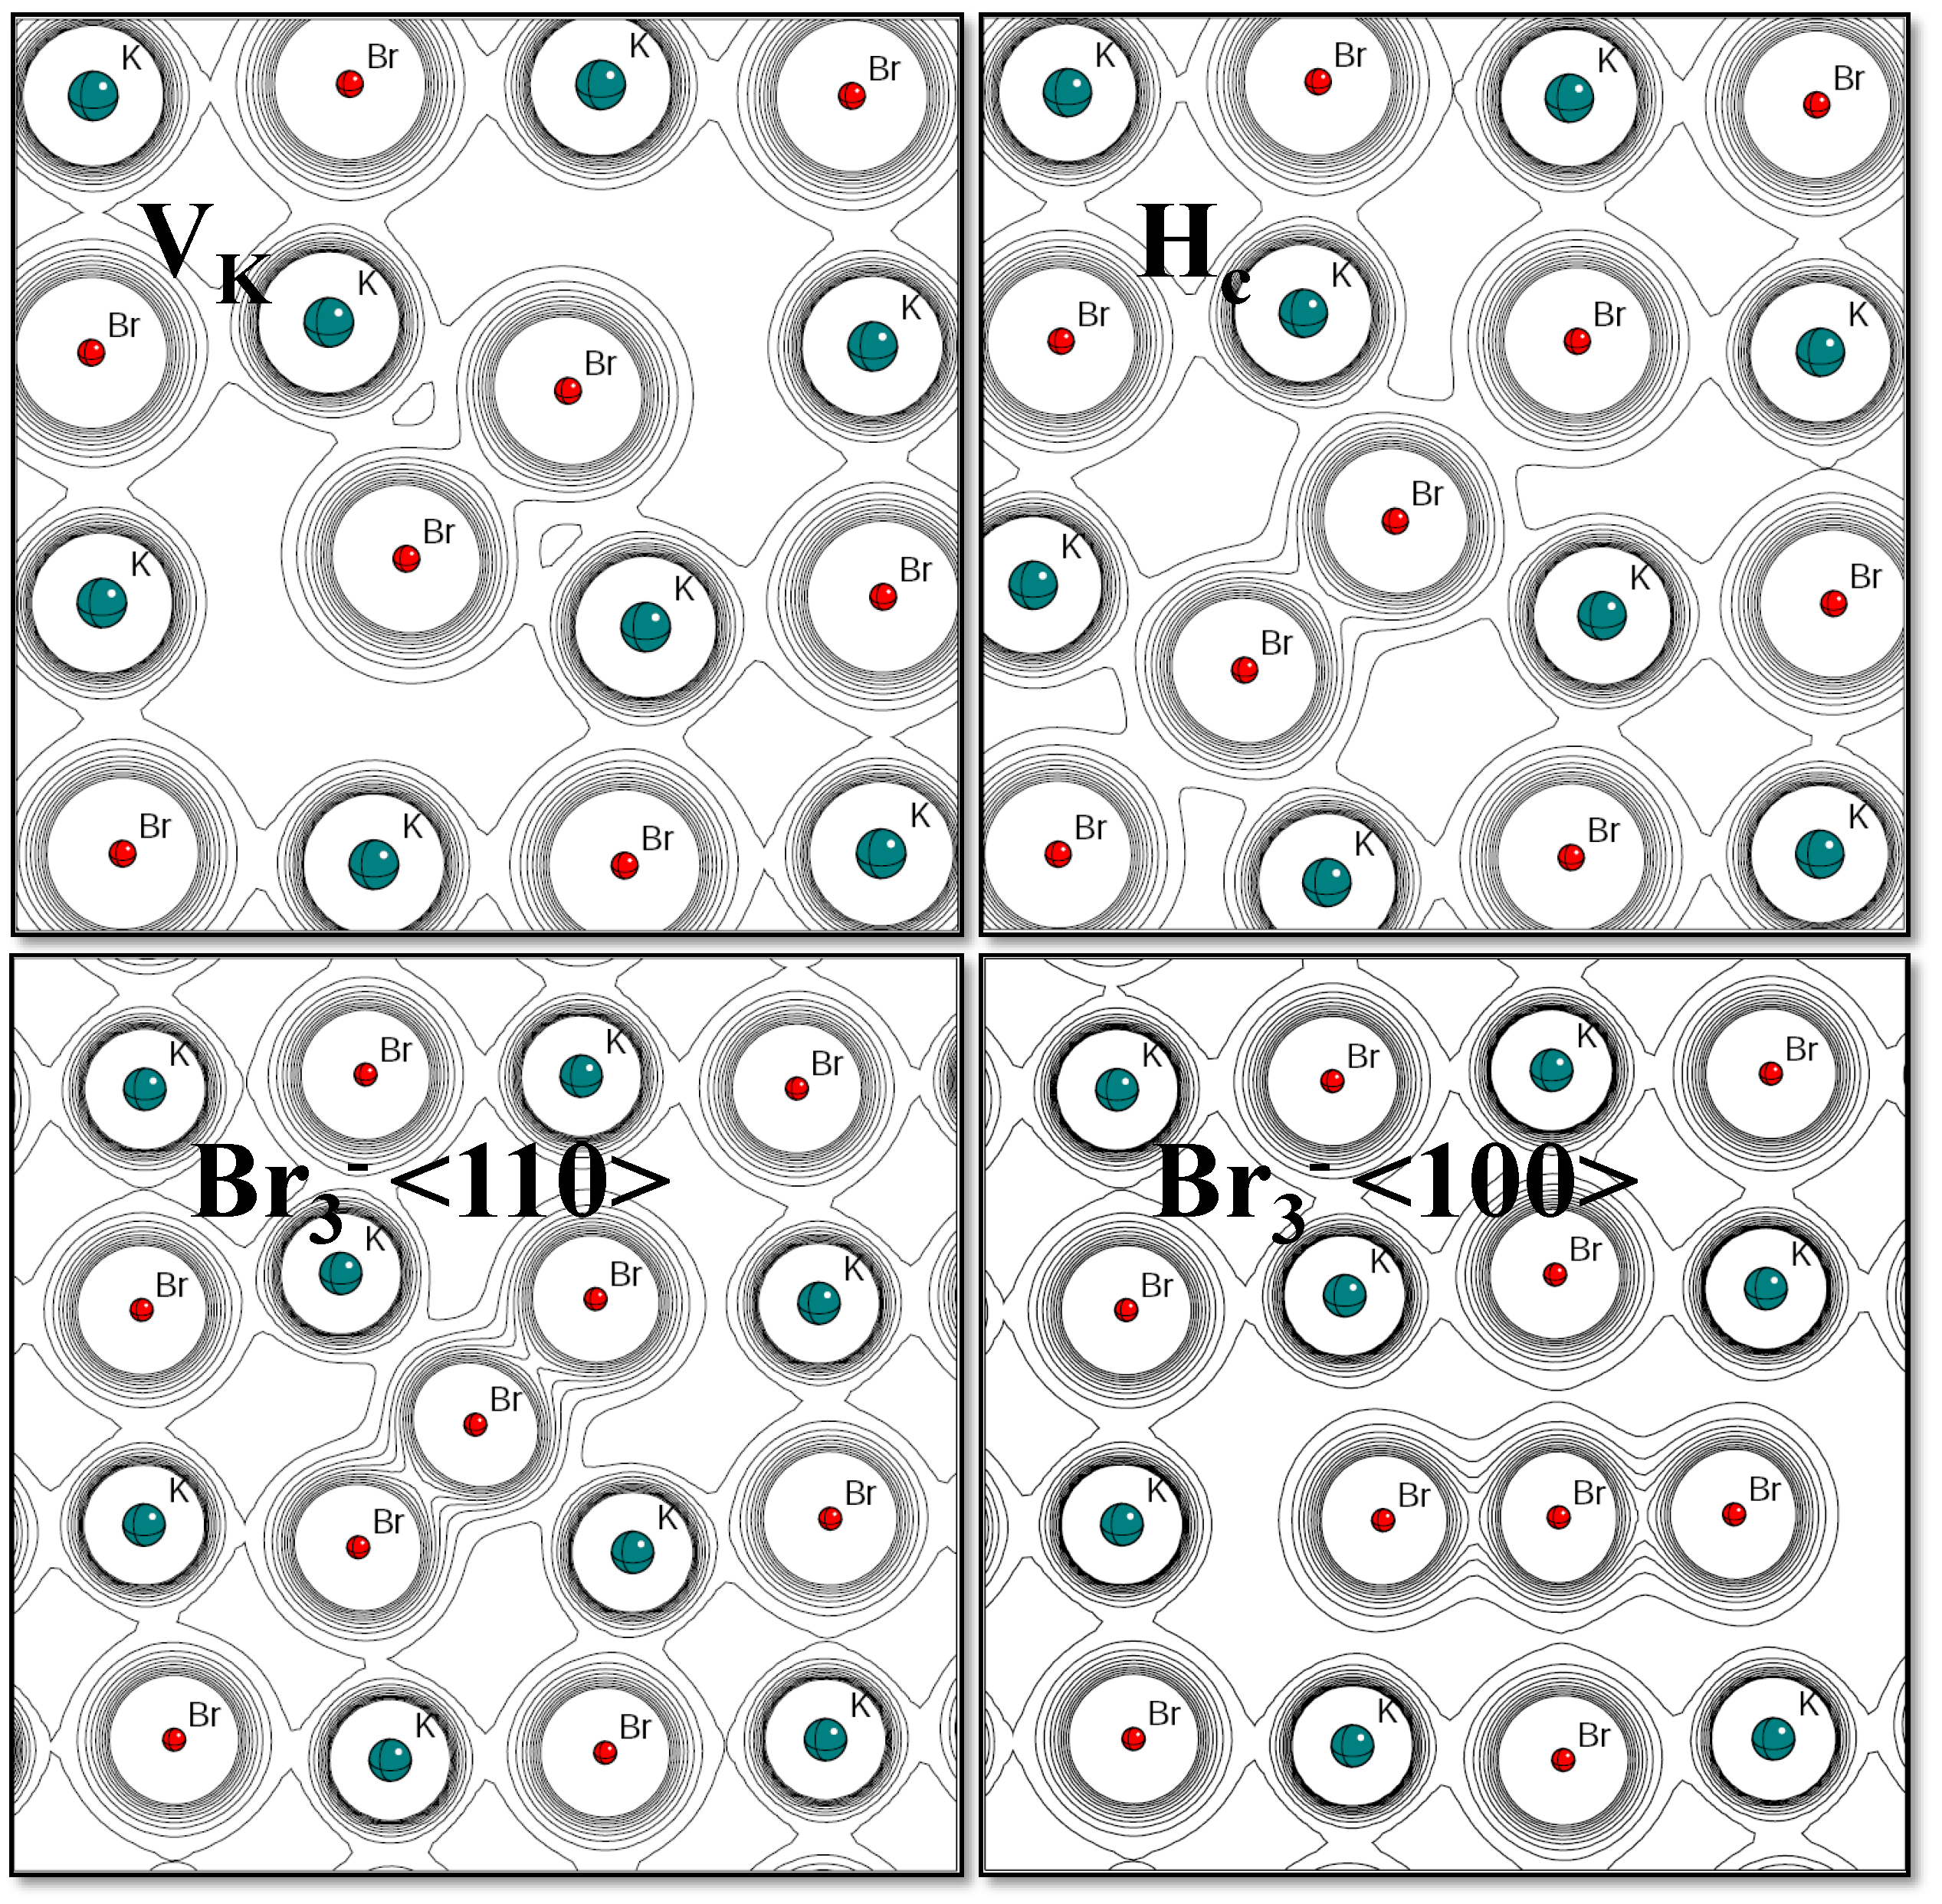
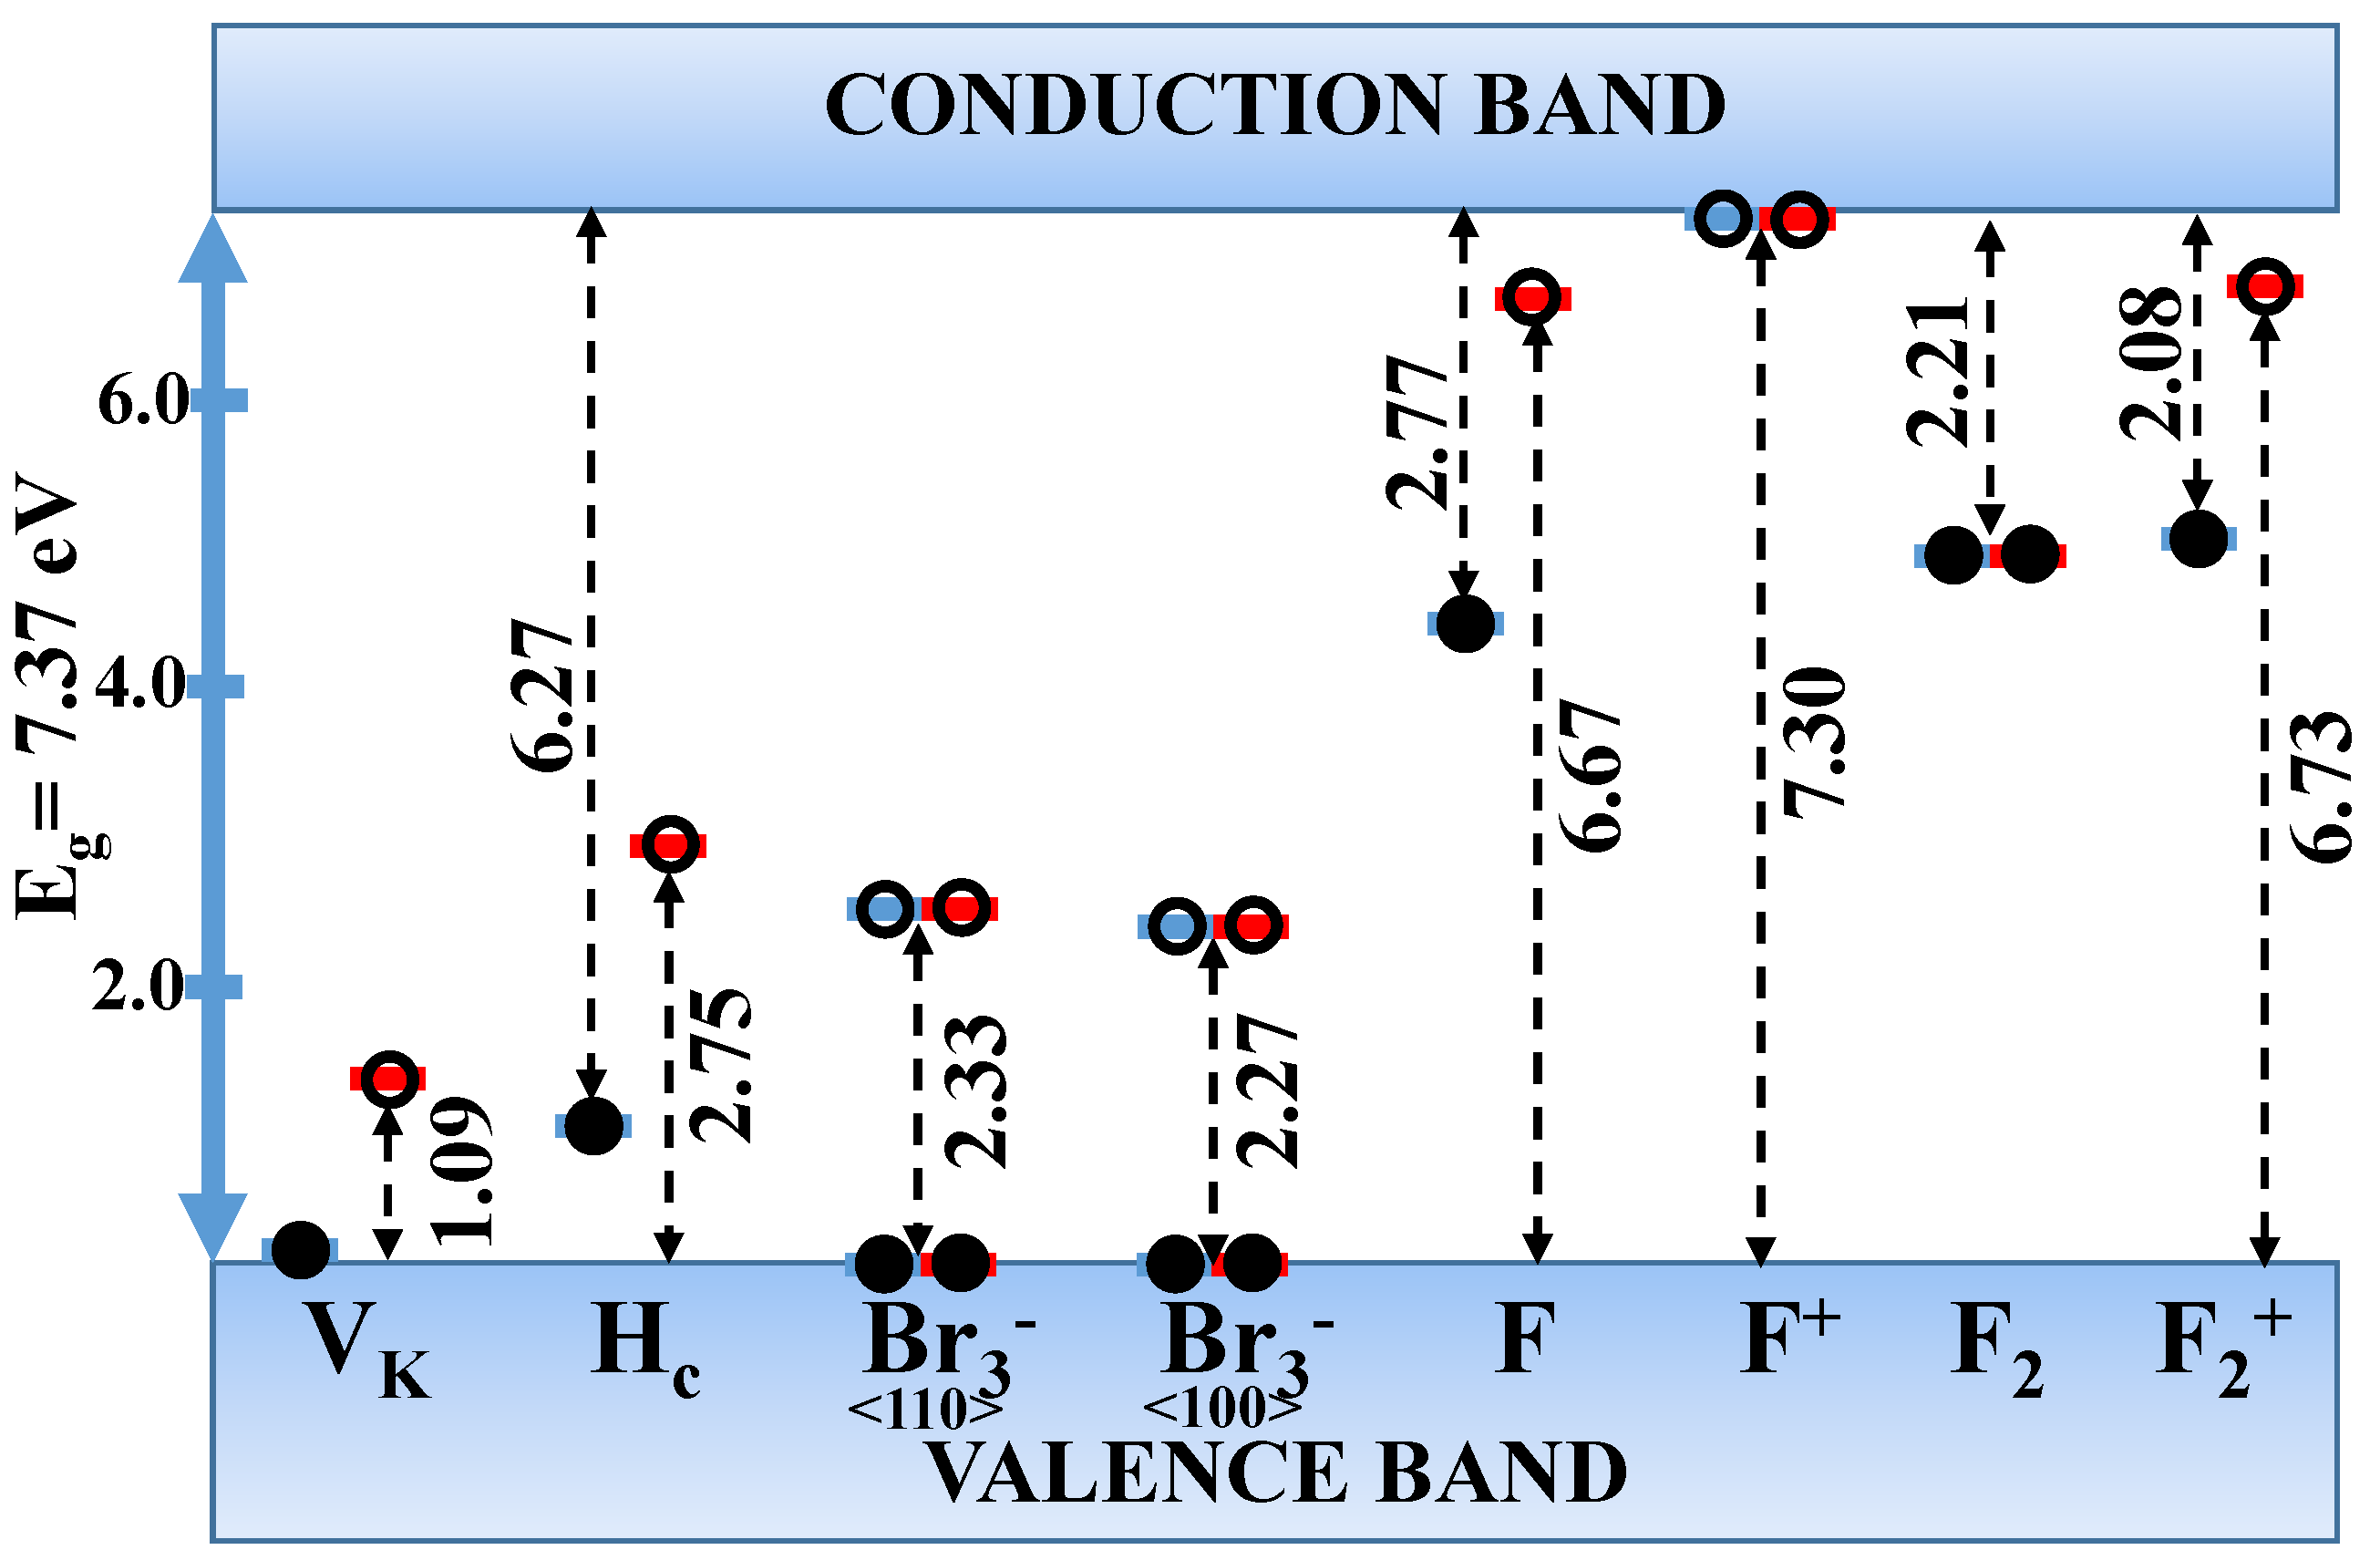
3.2. Hole-Type Defects

The electron-hole mechanism is considered one of the main processes leading to the creation of Frenkel pairs (F-center + interstitial) in alkali halides [12,48,49,50]. Holes are trapped at the anion sites, creating neutral halogen atoms that are reactive and can move through the lattice, forming the Br 2 dumbbell with regular Br ions. Here, we discuss four types of defects: the V K -center, where a single hole is trapped at two anion sites, resulting in a Br 2 molecular ion lying along the <110> direction; the H-center, representing a neutral bromine interstitial trapped at the occupied anion site, also resulting in a Br 2 molecular ion lying along the <110> direction, but in this case, it occupies a single anion site; the Br 3 <110> defect, a combination of the latter two, involving two holes and one interstitial halogen ion; and the Br 3 <100> defect—a bromine interstitial and a hole trapped at the cation vacancy site. Their electronic structures are shown in Figure 2. The calculated properties of all defects are presented in Table 2. For comparison purposes, we also calculated the free Br 2 molecule and Br 3 molecular ion.
The calculated vibrational frequency of free molecular bromine is 302 cm 1 , which is in good agreement with both 306 cm 1 for liquid Br 2 [51] and 301 cm 1 [52] for crystal. All hole-type defects act as shallow acceptors, as seen in Figure 3. The V K -center reveals an unoccupied level in the gap just 1.09 eV above the top of the valence band. The H-center shows an occupied spin-up level in the gap, whereas the spin-down unoccupied level lies 2.75 eV above the valence band maximum. Br 3 is a closed-shell defect, and its occupied states lie within the valence bands, with the unoccupied levels at 2.27–2.33 eV above the valence band maximum. The optical absorption of the hole centers arises due to electron transitions between local levels in the valence band and unoccupied levels in the gap (Figure 3). The V K -center occupies an interstitial position, where two bromine ions left their regular sites, leaving behind several K ions low-coordinated and located very close to two K ions. The V K -center is quite similar to the free Br 2 ion in terms of both the bond length and spin localization. As we can see from the mode analysis, the three highest vibrational modes (Figure 4 and Table 2) are associated with symmetric and anti-symmetric stretching of these two K ions. The peak at around 145 cm 1 is composed of multiple modes associated with the motion of low-coordinated K cations, which is in good agreement with the observed value of 144 cm 1 [5]. The most intense peak in the spectra, as expected, is due to Br-Br stretching at 121 cm 1 .
We expected the next defect, the H-center, to exhibit similar behavior to the previous defect, but as we can see in Table 2, they are very different. The bond length is shorter than that in free Br 2 , the charge and spin densities are slightly asymmetric, and the induced vibrational modes fall between molecular and ionized Br 2 . Here, two atoms are occupying a single anion site, possibly leading to bond shortening due to the close-packed surroundings. The two intense peaks in the calculated spectra (Figure 4) are composed of several modes: the peak at around 204 cm 1 contains asymmetric and symmetric K-Br-K stretching (K ions that are seen in Figure 2 around the H c defect), and the peak at 181 cm 1 is from Br-Br stretching modes. The other peak at 114 cm 1 is due to the K-Br stretching of potassium ions that have a strong interaction with both bromine atoms involved in defect formation.
The last hole-type defect is Br 3 , which can appear in two very different forms. A linear free Br 3 molecular ion has three vibrational modes: bending, symmetric stretching, and asymmetric stretching (in ascending order). All of them also appear in crystal defects. The first is a combination of two previous defects: V K and H c . In this case, the Br 3 molecular ion is oriented in the <110> direction, occupying two anion sites. As expected, the highest mode at 227 cm 1 belongs to the asymmetric stretching of Br-Br-Br. The mode at 206 cm 1 is similar to the H c mode at 114 cm 1 , but in this case, such K-Br-K stretching does not give rise to the peak in the Raman spectrum. The most intense peak at around 172 cm 1 is composed of two modes: Br-Br-Br symmetric stretching and K-Br-K bending. The mode at 95 cm 1 is Br-Br-Br bending, but it also does not give rise to the Raman peak. The second Br 3 defect, oriented in the <100> direction, occupies two anion sites and one vacant cation site. Despite the electronic structures of both defects being very similar (see Table 2), the modes and resulting Raman spectra are very different. The asymmetric Br-Br-Br stretching mode is now at 186 cm 1 with almost zero intensity. As in the previous case, the most intense peak is due to Br-Br-Br symmetric stretching at around 149 cm 1 . The bending mode is found at 116 cm 1 , while a series of low-intensity peaks at 45–65 cm 1 is associated with the rotational motion of molecular ions. From the spectra, we can see that only a few modes produce high intensity, likely due to the specific surroundings of the cation vacancy. Comparing the two spectra, we can see that Br 3 <110> has Raman peaks associated with modes that are not listed in Table 2 and are thus not affected by the isotopic substitution of bromine ions. These are mostly associated with potassium ion vibrations around the defect. Since the defect is positively charged with respect to the regular lattice, the surrounding ions experience a less attractive force. In the case of Br 3 <100>, there is also potassium vacancy involved (negatively charged with respect to the regular lattice), so the defect complex might be considered a net-zero charge.
Our findings are in good agreement with the experimentally observed values of 182 and 209 cm 1 [4,5], which can be attributed both to H c and Br 3 <110>. Samples with excess bromine in experiments show multiple peaks above 200 cm 1 , which are associated with molecular bromine and large molecular ions, such as Br 5 . The experimental peak at around 125 cm 1 can be easily confused with the V K -center, but the peak at the same position is also produced by the F-center, which is way more stable and more likely to be present in the sample [4].

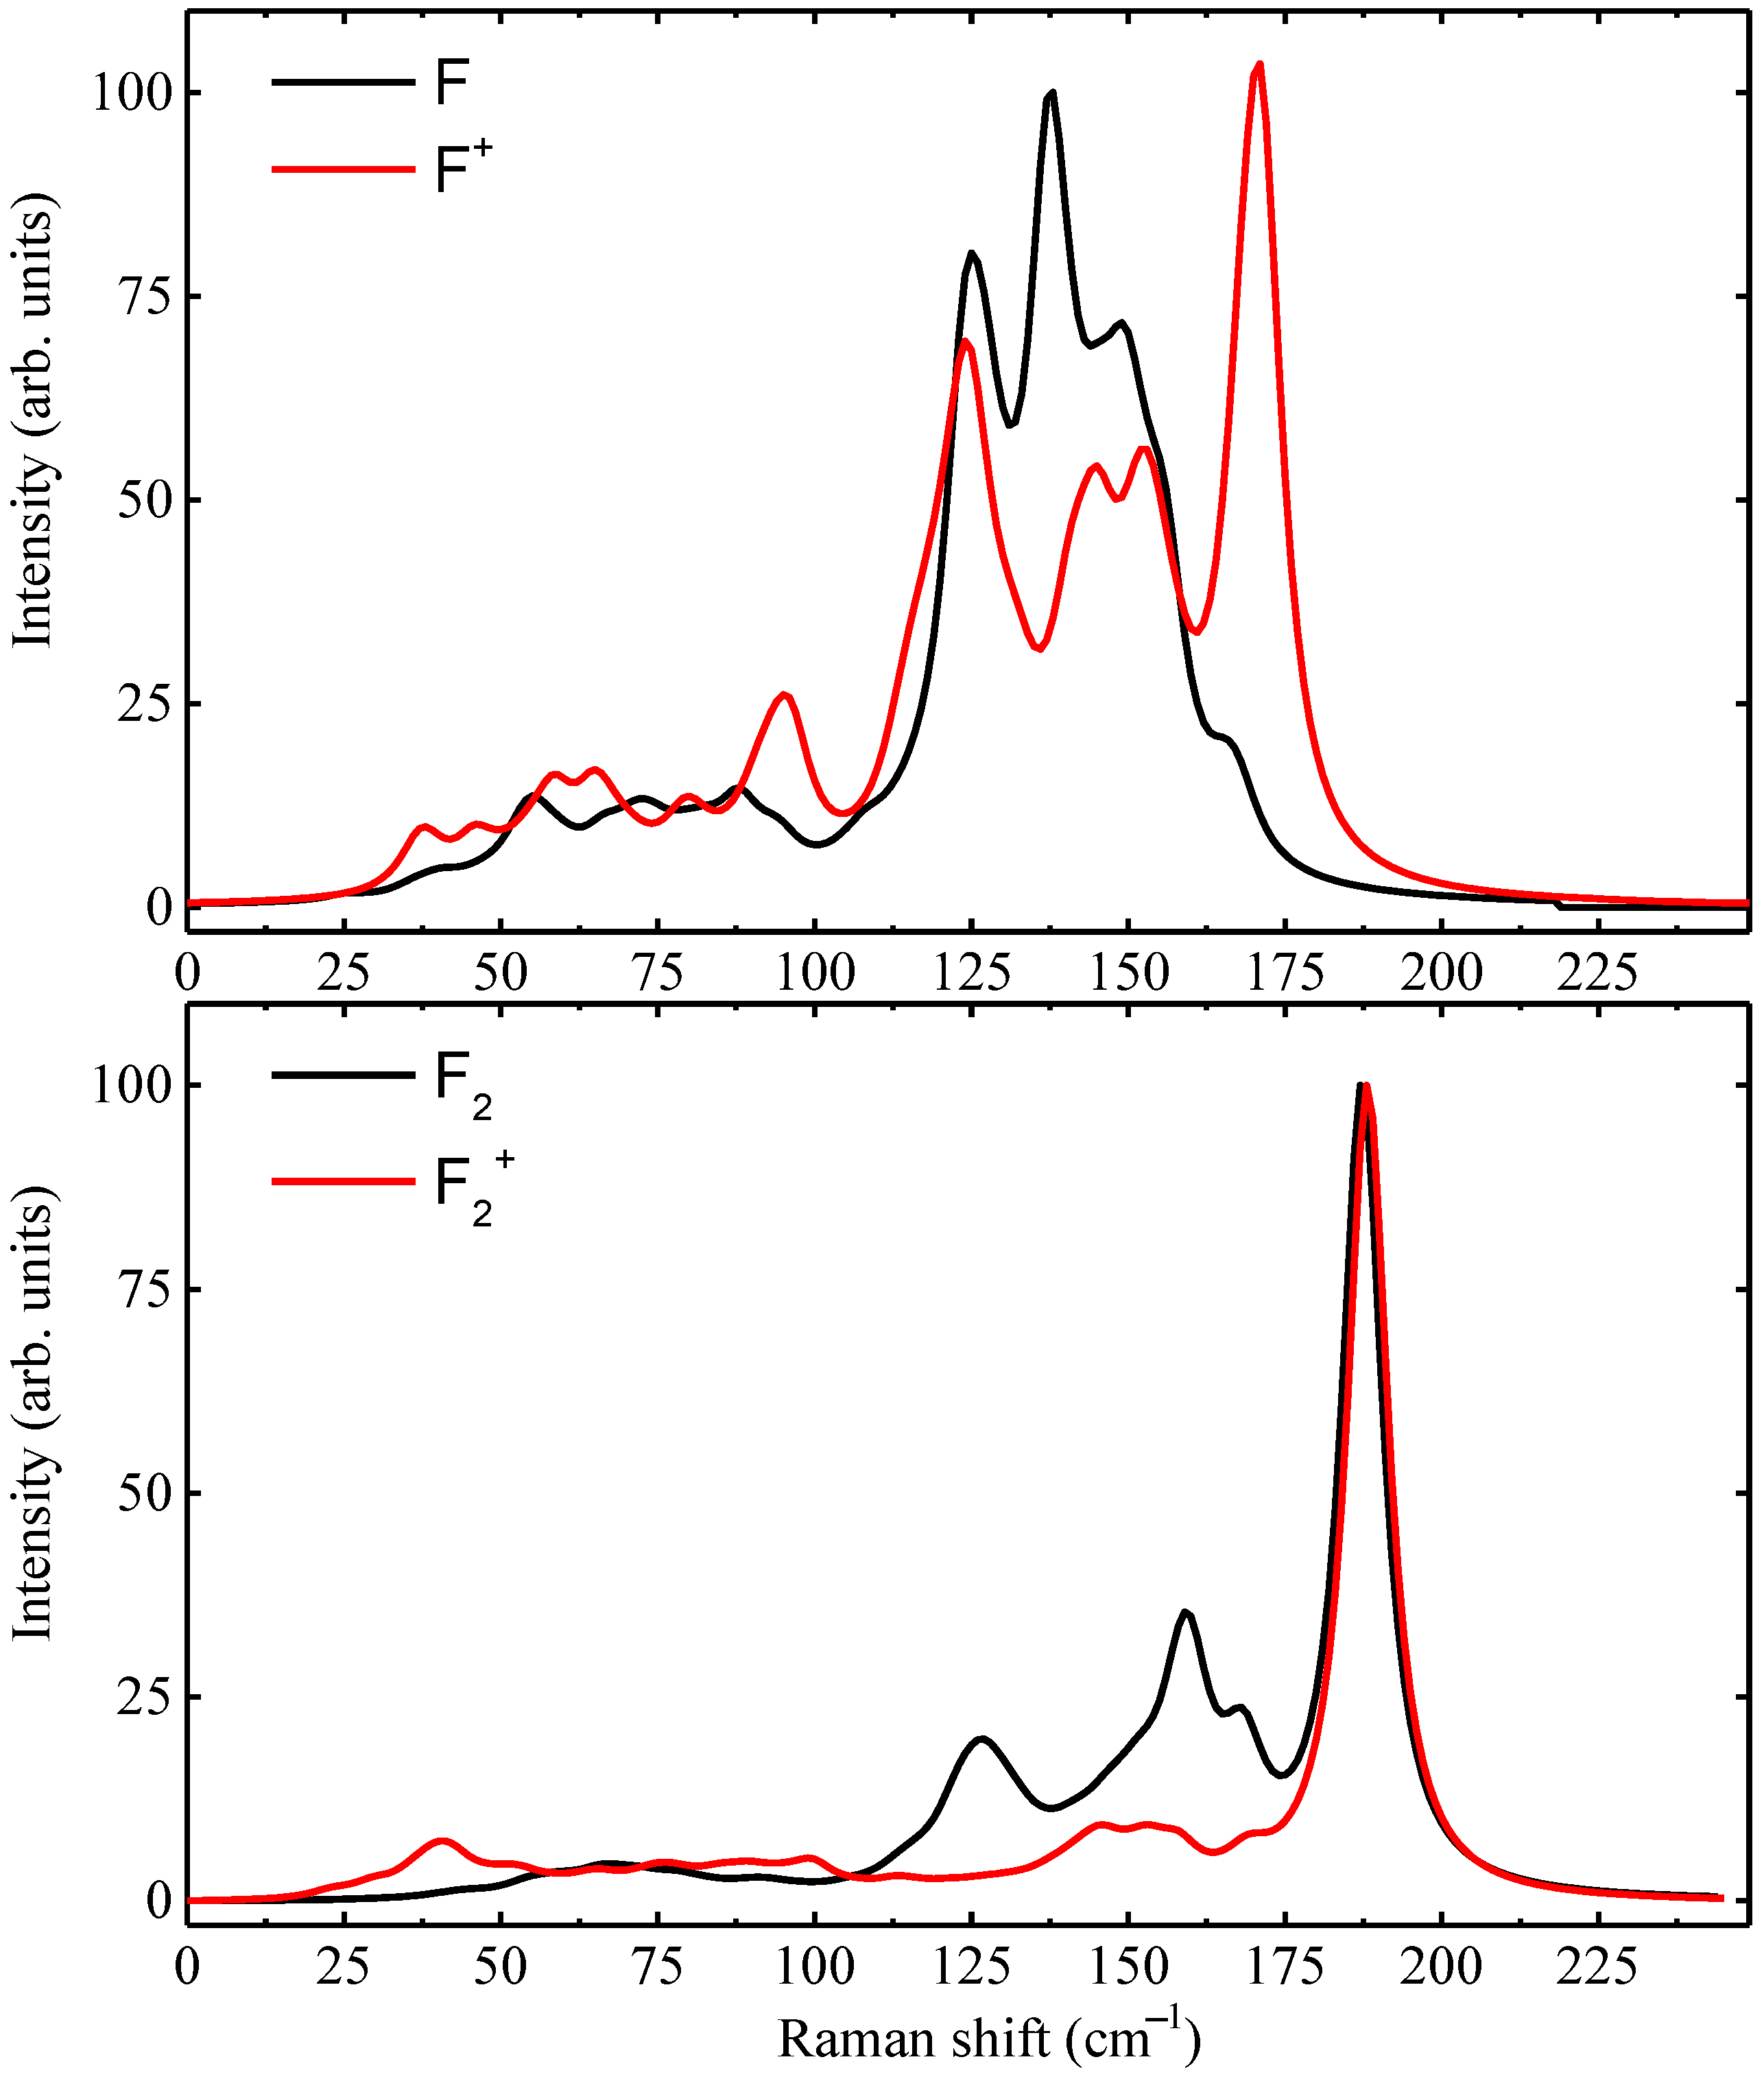
3.3. Vacancy Defects

In contrast to hole-type defects, vacancy defects do not produce new bonds in the crystal so they are more challenging to identify with vibrational spectroscopy methods. Usually, F-centers can be explicitly studied using optical methods, but at high doses of irradiation when samples become opaque, such methods are no longer useful. The experimentally observed optical absorption region for the single F-center is around 2 eV (see Table 1). The filled defect level for the F-center, as shown in Figure 3, is located slightly below the bottom of the conduction band (CBM), in agreement with the mentioned experiments. Obviously, this is not the case for empty vacancies ( F + ), which produce additional levels very close to the CBM.
We start the description of the vibrational properties of vacancy defects with a simple example, which preserves the full symmetry of the crystal- F + defect. All peaks seen in Figure 5 are formed by modes that involve six K cations around the vacancy site. The most intense peak at 171 cm 1 is formed by the single-degenerate A 1 g mode; all other modes (see Table 3) are triple-degenerate F 2 g modes. The modes below 100 cm 1 are almost unaffected by isotopic substitution, but an analysis of the modes reveals that they are mostly E g modes, associated with Br-K stretching around the vacancy site. In the experiment [4]. the mode at 175 cm 1 was assigned to the anion vacancy defect since its intensity drastically decreased in samples with excess bromine.
Taking a closer look at the calculated F-center modes, we find out that they are very similar to the F + ones, with two exceptions: first, in the neutral F defect, the single-degenerate mode had a negative value, which required the scanning of the geometry along the selected mode (SCANMODE option in Ref. [34]) to obtain the ground-state solution. And second, Raman intensities for the same modes turned out to be different. Due to symmetry reduction, the triple-degenerate F 2 g modes split into E + A 1 modes, with a difference that did not exceed 1 cm 1 . Despite having similar modes, differences in polarizability played a crucial role in distinguishing the two defects in Raman spectra. In the presence of the F + defect, the peak at 175 cm 1 dominated the spectra [4], but when the sample contained only neutral defects, a peak at 156 cm 1 was observed without overlapping with others. In general, the obtained results for the single vacancy defects are in good agreement with the experimental data in terms of both the positions of mode and their relative intensities.
We also studied anion divacancies in two charge states: neutral ( F 2 ) and singly charged ( F 2 + ). These defects were not observed in previously mentioned experimental papers, but they can be created under stress and irradiation [53]. Mode analysis revealed that for both defects, the most intense peak at 188 cm 1 was due to 4-coordinated potassium ion motion. For charged divacancy, all other modes exhibited relatively low intensities, while in the neutral case, an additional three modes with considerable intensities appeared. Similar to single vacancies, all of them involved K cations around the vacancy sites.

4. Conclusions

We have presented the vibrational modes and Raman spectra, which are in good agreement with the experimental data, as well as the local geometry and the charge and spin (when applied) distributions, for radiation-induced defects in potassium bromide. We investigated a series of hole-type defects, resulting in the formation of molecular ions within the defect sites. Our results showed a clear distinction between two very similar Br 3 defects that occupied different sites in the crystal, where Br 3 <110> showed several additional peaks between 125 cm 1 and 225 cm 1 compared to the <100> configuration. It was also demonstrated that the charges of the single (F-type) and dimer ( F 2 -type) electron centers considerably affected their Raman spectra, which could be used for defect identification. The obtained results could be used for the identification of radiation defects under huge radiation fluences and extended to the defect analysis in similar halide compounds.

Supplementary Materials

The following are available online at https://www.mdpi.com/article/10.3390/cryst14020161/s1, containing structural files and raw calculation outputs.

Author Contributions

Conceptualization, A.D., A.I.P. and E.A.K.; investigation and formal analysis, A.P., V.P., A.D., E.A.K. and A.I.P.; methodology, resources, data curation, and writing—original draft preparation, A.P. and V.P.; writing—review and editing, A.P., V.P., A.D., E.A.K. and A.I.P.; visualization, A.P.; project administration, E.A.K. and A.I.P.; funding acquisition, A.I.P. All authors have read and agreed to the published version of the manuscript.

Funding

A.I.P. and A.P. are thankful for the financial support provided by the Latvian Research Council, Grant No. LZP-2018/1-0214. The work of EK was performed in the framework of EUROfusion Consortium, funded by the European Union via the Euratom Research and Training Programme (Grant Agreement No 101052200—EUROfusion). Views and opinions expressed are however those of the author (s) only and do not necessarily reflect those of the European Union or the European Commission. Neither the European Union nor the European Commission can be held responsible for them. This research was conducted at the Center of Excellence of the Institute of Solid State Physics, University of Latvia, and supported through the Framework Program for European Union Horizon 2020, H2020-WIDESPREAD-01-2016-2017-TeamingPhase2 under Grant Agreement No. 739508, CAMART2 project.

Data Availability Statement

Data are contained within the article.

Acknowledgments

A.I.P. and A.P. are thankful for the support of COST Action CA20129—Multiscale Irradiation and Chemistry Driven Processes and Related Technologies (MultIChem)—supported by COST (European Cooperation in Science and Technology).

Conflicts of Interest

The authors declare no conflicts of interest.

References

  1. Kirkland, J. Quantitative application of potassium bromide disk technique in infrared spectroscopy. Anal. Chem. 1955, 27, 1537–1541. [Google Scholar] [CrossRef]
  2. Radhakrishna, S.; Chowdari, B.V. Radiation damage products in ionic crystals. Impurity doped alkali halides. Fortschr. Phys. 1977, 25, 511–578. [Google Scholar] [CrossRef]
  3. Ghomi, M.; Buisson, J. Study of Raman spectra of KBr doped with F-centres by excitation in the F and K bands. J. Phys. C Solid State Phys. 1979, 12, 4631. [Google Scholar] [CrossRef]
  4. Rzepka, E.; Doualan, J.L.; Lefrant, S.; Taurel, L. Raman scattering induced by V centres in KBr. J. Phys. C Solid State Phys. 1982, 15, L119–L123. [Google Scholar] [CrossRef]
  5. Suzuki, T.; Tanimura, K.; Itoh, N. Resonance-Raman-scattering spectroscopy for the halogen-molecular-ion centers in alkali halides. Phys. Rev. B 1993, 48, 9298–9305. [Google Scholar] [CrossRef] [PubMed]
  6. Taurel, L.; Rzepka, E.; Lefrant, S. Raman scattering induced by V centers and their aggregates in alkali halides. Radiat. Eff. 1983, 72, 115–121. [Google Scholar] [CrossRef]
  7. Popov, A.; Plavina, I. Photostimulated emission of KBr—In previously exposed to UV-or X-radiation. Nucl. Instrum. Methods Phys. Res. Sect. B Beam Interact. Mater. Atoms 1995, 101, 252–254. [Google Scholar] [CrossRef]
  8. Rogulis, U.; Tale, I.; Hangleiter, T.; Spaeth, J.M. The photostimulation process in the X-ray storage phosphor KBr: In. J. Phys. Condens. Matter 1995, 7, 3129. [Google Scholar] [CrossRef]
  9. Okada, G.; Fujimoto, Y.; Tanaka, H.; Kasap, S.; Yanagida, T. Dynamics of radio-photoluminescence and thermally-stimulated luminescence in KBr: Sm. J. Mater. Sci. Mater. Electron. 2017, 28, 15980–15986. [Google Scholar] [CrossRef]
  10. Bridges, F.; Davies, G.; Robertson, J.; Stoneham, A. The spectroscopy of crystal defects: A compendium of defect nomenclature. J. Phys. Condens. Matter 1990, 2, 2875. [Google Scholar] [CrossRef]
  11. Itoh, N.; Tanimura, K. Formation of interstitial-vacancy pairs by electronic excitation in pure ionic crystals. J. Phys. Chem. Solids 1990, 51, 717–735. [Google Scholar] [CrossRef]
  12. Song, K.S.; Williams, R.T.; Halides, A. Self-Trapped Excitons; Springer: Berlin/Heidelberg, Germany, 1993; pp. 123–219. [Google Scholar]
  13. Saidoh, M.; Townsend, P. Absorption bands induced in KBr by H+ and H2+ implantation. J. Phys. C Solid State Phys. 1977, 10, 1541. [Google Scholar] [CrossRef]
  14. Akilbekov, A.; Elango, A. Low-Temperature Pair Associates of H Centres in KBr. Phys. Status Solidi (b) 1984, 122, 715–723. [Google Scholar] [CrossRef]
  15. Kuzovkov, V.; Popov, A.; Kotomin, E.; Moskina, A.; Vasilchenko, E.; Lushchik, A. Theoretical analysis of the kinetics of low-temperature defect recombination in alkali halide crystals. Low Temp. Phys. 2016, 42, 588–593. [Google Scholar] [CrossRef]
  16. Dauletbekova, A.; Akilbekov, A.; Elango, A. Thermo-and Photostimulated Recombinations of F–HA and α–IA Centres in KBr with Large Na Concentration. Phys. Status Solidi (b) 1982, 112, 445–452. [Google Scholar] [CrossRef]
  17. Akilbekov, A.; Dauletbekova, A.; Elango, A. Photo-and Thermochemical Reactions with Participation of Br- Centres in X-Rayed KBr. Phys. Status Solidi (b) 1985, 127, 493–501. [Google Scholar] [CrossRef]
  18. Popov, A. Optical production and destruction of V2 centres in KBr-In and KBr-T1 crystals. Nucl. Instrum. Methods Phys. Res. Sect. B Beam Interact. Mater. Atoms 1992, 65, 521–524. [Google Scholar] [CrossRef]
  19. Lushchik, C.; Elango, A.; Gindina, R.; Pung, L.; Lushchik, A.; Maaroos, A.; Nurakhmetov, T.; Ploom, L.; Jaanson, N. Mechanisms of cation defects creation in alkali halides. Semicond. Insul. 1980, 5, 133–152. [Google Scholar]
  20. Nakajima, A.; Yoshihara, A.; Ishigame, M. Defect-induced Raman spectra in doped CeO2. Phys. Rev. B 1994, 50, 13297. [Google Scholar] [CrossRef]
  21. Ishigame, M.; Yoshida, E. Study of the defect-induced Raman spectra in cubic zirconia. Solid State Ionics 1987, 23, 211–218. [Google Scholar] [CrossRef]
  22. Bae, S.; Sugiyama, N.; Matsuo, T.; Raebiger, H.; Shudo, K.i.; Ohno, K. Defect-induced vibration modes of Ar+-irradiated MoS2. Phys. Rev. Appl. 2017, 7, 024001. [Google Scholar] [CrossRef]
  23. Akilbekov, A.; Kiryakov, A.; Baubekova, G.; Aralbayeva, G.; Dauletbekova, A.; Akylbekova, A.; Ospanova, Z.; Popov, A.I. Optical Characteristics of MgAl2O4 Single Crystals Irradiated by 220 MeV Xe Ions. Materials 2023, 16, 6414. [Google Scholar] [CrossRef]
  24. Wang, Y.; Pochet, P.; Jenkins, C.A.; Arenholz, E.; Bukalis, G.; Gemming, S.; Helm, M.; Zhou, S. Defect-induced magnetism in graphite through neutron irradiation. Phys. Rev. B 2014, 90, 214435. [Google Scholar] [CrossRef]
  25. Khomich, A.A.; Khmelnitsky, R.A.; Khomich, A.V. Probing the nanostructure of neutron-irradiated diamond using Raman spectroscopy. Nanomaterials 2020, 10, 1166. [Google Scholar] [CrossRef] [PubMed]
  26. Wang, P.; Huang, L.; Zhu, W.; Ruan, Y. Raman scattering of neutron irradiated 6H-SiC. Solid State Commun. 2012, 152, 887–890. [Google Scholar] [CrossRef]
  27. Mironova-Ulmane, N.; Sildos, I.; Vasil’chenko, E.; Chikvaidze, G.; Skvortsova, V.; Kareiva, A.; Muñoz-Santiuste, J.; Pareja, R.; Elsts, E.; Popov, A. Optical absorption and Raman studies of neutron-irradiated Gd3Ga5O12 single crystals. Nucl. Instrum. Methods Phys. Res. Sect. B Beam Interact. Mater. Atoms 2018, 435, 306–312. [Google Scholar] [CrossRef]
  28. Platonenko, A.; Gryaznov, D.; Popov, A.I.; Dovesi, R.; Kotomin, E.A. First principles calculations of the vibrational properties of single and dimer F-type centers in corundum crystals. J. Chem. Phys. 2020, 153, 134107. [Google Scholar] [CrossRef]
  29. Rusevich, L.; Kotomin, E.; Zvejnieks, G.; Popov, A. Ab initio calculations of structural, electronic and vibrational properties of BaTiO3 and SrTiO3 perovskite crystals with oxygen vacancies. Low Temp. Phys. 2020, 46, 1185–1195. [Google Scholar] [CrossRef]
  30. Becke, A.D. Density-Functional Thermochemistry. III. The Role of Exact Exchange. J. Chem. Phys. 1993, 98, 5648–5652. [Google Scholar] [CrossRef]
  31. Lee, C.; Yang, W.; Parr, R. Development of the Colle-Salvetti Correlation-Energy Formula Into a Functional of the Electron Density. Phys. Rev. B 1988, 37, 785–789. [Google Scholar] [CrossRef]
  32. Dovesi, R.; Erba, A.; Orlando, R.; Zicovich-Wilson, C.M.; Civalleri, B.; Maschio, L.; Rérat, M.; Casassa, S.; Baima, J.; Salustro, S.; et al. Quantum-mechanical condensed matter simulations with CRYSTAL. Wires Comput. Mol. Sci. 2018, 8, e1360. Available online: https://onlinelibrary.wiley.com/doi/pdf/10.1002/wcms.1360 (accessed on 29 January 2024). [CrossRef]
  33. Vilela Oliveira, D.; Laun, J.; Peintinger, M.F.; Bredow, T. BSSE-correction scheme for consistent gaussian basis sets of double-and triple-zeta valence with polarization quality for solid-state calculations. J. Comput. Chem. 2019, 40, 2364–2376. [Google Scholar] [CrossRef]
  34. Dovesi, R.; Saunders, V.R.; Roetti, C.; Orlando, R.; Zicovich-Wilson, C.M.; Pascale, F.; Civalleri, B.; Doll, K.; Harrison, N.M.; Bush, I.J.; et al. CRYSTAL 2017 User’s Manual; University of Torino: Torino, Italy, 2018. [Google Scholar]
  35. Mallia, G.; Orlando, R.; Roetti, C.; Ugliengo, P.; Dovesi, R. F center in LiF: A quantum mechanical ab initio investigation of the hyperfine interaction between the unpaired electron at the vacancy and its first seven neighbors. Phys. Rev. B 2001, 63, 235102. [Google Scholar] [CrossRef]
  36. Pascale, F.; Zicovich-Wilson, C.M.; Gejo, F.L.; Civalleri, B.; Orlando, R.; Dovesi, R. The Calculation of the Vibrational Frequencies of the Crystalline Compounds and its Implementation in the CRYSTAL Code. J. Comput. Chem. 2004, 25, 888–897. [Google Scholar] [CrossRef] [PubMed]
  37. Zicovich-Wilson, C.M.; Pascale, F.; Roetti, C.; Saunders, V.R.; Orlando, R.; Dovesi, R. Calculation of the Vibration Frequencies of α-Quartz: The Effect of Hamiltonian and Basis Set. J. Comput. Chem. 2004, 25, 1873–1881. [Google Scholar] [CrossRef] [PubMed]
  38. Erba, A.; Ferrabone, M.; Orlando, R.; Dovesi, R. Accurate Dynamical Structure Factors from Ab Initio Lattice Dynamics: The case of Crystalline Silicon. J. Comput. Chem. 2013, 34, 346–354. [Google Scholar] [CrossRef]
  39. Baima, J.; Ferrabone, M.; Orlando, R.; Erba, A.; Dovesi, R. Thermodynamics and Phonon Dispersion of Pyrope and Grossular Silicate Garnets from Ab Initio Simulations. Phys. Chem. Miner. 2016, 43, 137–149. [Google Scholar] [CrossRef]
  40. Maschio, L.; Kirtman, B.; Rérat, M.; Orlando, R.; Dovesi, R. Ab Initio Analytical Raman Intensities for Periodic Systems Through a Coupled Perturbed Hartree-Fock/Kohn-Sham Method in an Atomic Orbital Basis. I. Theory. J. Chem. Phys. 2013, 139, 164101. [Google Scholar] [CrossRef]
  41. Maschio, L.; Kirtman, B.; Rérat, M.; Orlando, R.; Dovesi, R. Ab Initio Analytical Raman Intensities for Periodic Systems Through a Coupled Perturbed Hartree-Fock/Kohn-Sham Method in an Atomic Orbital Basis. II. Validation and Comparison with Experiments. J. Chem. Phys. 2013, 139, 164102. [Google Scholar] [CrossRef]
  42. Pople, J.; Krishnan, R.; Schlegel, H.; Binkley, J.S. Derivative studies in hartree-fock and møller-plesset theories. Int. J. Quantum Chem. 1979, 16, 225–241. [Google Scholar] [CrossRef]
  43. Frisch, M.J.; Head-Gordon, M.; Pople, J.A. A direct MP2 gradient method. Chem. Phys. Lett. 1990, 166, 275–280. [Google Scholar] [CrossRef]
  44. Ferrero, M.; Rérat, M.; Orlando, R.; Dovesi, R. The Calculation of Static Polarizabilities of Periodic Compounds. The Implementation in the CRYSTAL Code for 1D, 2D and 3D Systems. J. Comput. Chem. 2008, 29, 1450–1459. [Google Scholar] [CrossRef]
  45. Ferrero, M.; Rérat, M.; Orlando, R.; Dovesi, R. Coupled Perturbed Hartree-Fock for Periodic Systems: The role of Symmetry and Related Computational Aspects. J. Chem. Phys. 2008, 128, 014110. [Google Scholar] [CrossRef] [PubMed]
  46. Zemann, J. Crystal structures, 2nd edition. Vol. 1 by R. W. G. Wyckoff. Acta Crystallogr. 1965, 18, 139. Available online: https://onlinelibrary.wiley.com/doi/pdf/10.1107/S0365110X65000361 (accessed on 29 January 2024). [CrossRef]
  47. Tomiki, T.; Miyata, T.; Tsukamoto, H. Temperature Dependence of the Fundamental Spectra of Potassium-Halides in the Schumann Ultraviolet Region (4.4 13.5 eV). J. Phys. Soc. Jpn. 1973, 35, 495–507. [Google Scholar] [CrossRef]
  48. Stoneham, A.M. Theory of Defects in Solids: Electronic Structure of Defects in Insulators and Semiconductors; Oxford University Press: Oxford, UK, 2001. [Google Scholar]
  49. Itoh, N.; Stoneham, M. Materials Modification by Electronic Excitation; Cambridge University Press: Cambridge, MA, USA, 2000. [Google Scholar] [CrossRef]
  50. Lushchik, A.; Kirm, M.; Lushchik, C.; Vasil’chenko, E. Excitonic and electron–hole mechanisms of the creation of Frenkel defect in alkali halides. Nucl. Instrum. Methods Phys. Res. Sect. B Beam Interact. Mater. Atoms 2000, 166–167, 529–537. [Google Scholar] [CrossRef]
  51. Stammreich, H.; Forneris, R. The Raman frequency of liquid bromine. J. Chem. Phys. 1954, 22, 1624. [Google Scholar] [CrossRef]
  52. Suzuki, M.; Yokoyama, T.; Ito, M. Raman spectrum of the bromine crystal. J. Chem. Phys. 1969, 51, 1929–1931. [Google Scholar] [CrossRef]
  53. Vasilchenko, E.; Sarmukhanov, E.; Shunkeev, K.; Elango, A. Electronic excitations localized in KBr and KI crystals near vacancy defects of different sizes. Phys. Status Solidi (b) 1992, 174, 155–163. [Google Scholar] [CrossRef]
Figure 1. Calculated total phonon density of states of KBr crystal. PDOS extends from 16 to 162 cm 1 .
Crystals 14 00161 g001
Figure 2. Total electron density maps of hole-type defects. View along the (100) plane. The isolines range from 0 to 0.1 a.u with a step of 0.01 a.u.
Crystals 14 00161 g002
Figure 3. Schematic representation of defect levels in the band gap. All indicated levels arise from atoms (in the case of bromine molecular ions) or orbitals (in the case of F-centers) involved in defect formation. Filled and empty circles correspond to occupied and unoccupied levels. Blue and red dashes correspond to spin-up and spin-down states, respectively.
Crystals 14 00161 g003
Figure 4. Simulated Raman spectra of four hole-type defects. All intensities were normalized to 100 arb. units.
Crystals 14 00161 g004
Figure 5. Simulated Raman spectra of F-type defects. All intensities were normalized to 100 arb. units.
Crystals 14 00161 g005
Table 2. Calculated structural and localized vibrational modes (LVMs) of hole defects in KBr crystal and free Br 2 , Br 2 , and Br 3 species. Distance between Br atoms ( d B r B r , Å) involved in defect formation, their charges ( q B r , e), and magnetic moments ( μ B r ) resulting from Mulliken analysis. LVMs (in cm 1 ) were assigned based on the highest mode shifts for Br 79 Br 81 isotopic substitution.
Defect d Br Br q Br μ Br LVM ( cm 1 )
V K -center3.04−0.43/−0.430.495/0.49590, 121, 165, 169, 179
H-center2.83−0.46/−0.480.462/0.441181, 190, 204, 207
Br 3 <110>2.59/2.65−0.36/−0.10/−0.43-95, 170, 173, 206, 227
Br 3 <100>2.66/2.66−0.46/+0.05/−0.45-68, 116, 141, 149, 186
Br 2 molecule2.380.0/0.0-302
Br 2 mol. ion2.97−0.5/−0.50.5/0.5140
Br 3 mol. ion2.65/2.66−0.45/−0.10/−0.45-84, 150, 203
Table 3. Calculated structural and localized vibrational modes (LVMs) of vacancy defects in KBr crystal. Distances from a vacancy site to the closest K atoms ( d V K , Å), K-Br bond length intervals for K atoms around the vacancy ( d K B r , Å), net charge ( | q | in e), and magnetic moment ( μ in μ B ) localized in the vacancy resulting from Mulliken analysis. LVMs were assigned based on the highest modes shifts for K 39 K 42 isotopic substitution of atoms around the vacancy site. For F 2 , d V K distances correspond to 5- and 4-coordinated K atoms.
Defect d V K d K Br q μ LVM (cm cm 1 )
F3.033.28-3.46−0.8160.948108, 124, 137, 149, 156, 167
F + 3.573.13–3.250.00.0125–135, 145, 154, 171
F 2 2.87 / 2.533.30–3.97−1.5980.0127, 160, 169, 187
F 2 + 3.53 / 3.323.15–3.35−0.8301.028153, 158, 188
Disclaimer/Publisher’s Note: The statements, opinions and data contained in all publications are solely those of the individual author(s) and contributor(s) and not of MDPI and/or the editor(s). MDPI and/or the editor(s) disclaim responsibility for any injury to people or property resulting from any ideas, methods, instructions or products referred to in the content.

