Article

Measurement of Reverse-Light-Induced Excited Spin State Trapping in Spin Crossover Systems: A Study Case with Zn1−xFex(6-mepy)3tren(PF6)2·CH3CN; x = 0.5%

Department of Physical Chemistry, University of Geneva, 1211 Geneva, Switzerland
*
Author to whom correspondence should be addressed.
Crystals 2024, 14(3), 210; https://doi.org/10.3390/cryst14030210
Submission received: 28 December 2023 / Revised: 8 February 2024 / Accepted: 15 February 2024 / Published: 23 February 2024

Abstract

:
In an attempt to better understand the physics governing the apparition of reverse-light-induced excited spin state trapping (LIESST) phenomena in spin crossover (SCO) compounds, we have studied the LIESST effect and the possibility of a reverse-LIESST effect in the SCO complex Zn1−xFex(6-mepy)3tren(PF6)2·CH3CN, x = 0.5%. ((6-mepy)3tren = tris{4-[(6-methyl)-2-pyridyl]-3-aza-butenyl}amine)). This complex was chosen as a good candidate to show reverse-LIESST by comparison with its unsolvated analogue, since the introduction of acetonitrile in the structure leads to the stabilisation of the high-spin state and both exhibit a very abrupt thermal spin transition. Indeed, the steep thermal spin transitions of two differently polarised crystals of Zn1−xFex(6-mepy)3tren(PF6)2·CH3CN, x = 0.5% have been characterised in detail in a first step using absorption spectroscopy and no influence of the polarisation was found. These were then fitted within the mean field model to obtain the variation in the enthalpy and entropy and the critical temperatures associated with the process, which are significantly lower with respect to the unsolvated compound due to the incorporation of acetonitrile. In a second step, the light-induced low-spin-to-high-spin transition at low temperatures based on LIESST and its subsequent high-spin-to-low-spin relaxation at different temperatures were characterised by time-resolved absorption spectroscopy, with exponential behaviour in both cases. The stabilisation of the high-spin state due to the presence of acetonitrile was evidenced. Finally, light-induced high-spin-to-low-spin state transition at low temperature based on reverse-LIESST was attempted by time-resolved absorption spectroscopy but the Fe(II) concentration was too low to observe the effect.

1. Introduction

Spin crossover (SCO) complexes based on transition metals with electronic configuration d4 to d7 can adopt a high-spin (HS) or low-spin (LS) state depending on the values of the ligand field strength and pairing energy, and a spin transition can be induced from one to another by changes in temperature, pressure, light, etc. [1,2,3,4,5,6]. Thermally, the LS state is favourable at a lower temperature, whereas, at a higher temperature, the higher electronic and vibrational entropy leads to an entropy-driven population of the HS state. The thermal spin transition moves from gradual to abrupt and vice versa, depending on the strength of the molecular interaction within the complex. Indeed, for neat crystals, the thermal transition is very steep, whereas, for diluted crystals in other cations, different from the SCO centres, the transitions are smoother. In the case of very strong cooperative interactions between the centres, the abrupt transitions are accompanied by a hysteretic behaviour, leading to bistability, which is essential for applications such as memory devices [7]. Other applications include sensing by magnetism [8,9], optical diffraction [10], luminescence [11,12], guest adsorption [13], or surfaces, thin films, and a patterned structure [14]. Alternatively, the UV-VIS/NIR excitation of the LS species at low temperatures leads to the population of the HS state. At low temperatures, the HS-to-LS relaxation slows down and it is possible to trap the compound in the HS state. This effect is called “light-induced excited spin state trapping” (LIESST) and takes place in both single crystals and polycrystalline structures [15,16,17]. In the case of Fe2+ complexes, a complete transformation is possible by irradiating the sample at 10 K, although much higher excitation temperatures have been found to lead to quantitative LIESST [18,19]. At lower temperatures, the HS-to-LS relaxation does not depend on the temperature and the process is based on pure tunnelling, whereas, at higher temperatures, a thermally activated process is observed [20]. After LIESST, the HS-to-LS relaxation rate constant (kHL) depends on the LS fraction (the mean field approximation). This dependence is sigmoidal for neat compounds [21] and the corresponding physical behaviour of the lattice is shown in Figure 1. In contrast, in diluted mixed systems, the cooperativity is weaker and the HS-to-LS relaxation after LIESST follows an exponential decay [21]. Likewise, the decrease in size to the nanoscale leads to HS-to-LS relaxations where the sigmoidal behaviour vanishes, leading to stretched exponential curves [22].
In the present article, we will focus on the thermal LS-to-HS transition (and vice versa) and the photo-induced LS-to-HS transition at low temperatures, as well as the characteristics of the HS-to-LS relaxation of Zn1−xFex(6-mepy)3tren(PF6)2·CH3CN ((6-mepy)3tren = tris{4-[(6-methyl)-2-pyridyl]-3-aza-butenyl}amine)). The SCO properties in the solid state of the neat compound [Fe(mepy)3tren](PF6)2 were studied for the first time by Hoselton et al. [24], who proved that the magnetic moment dependence on the temperature was different in solution and solid states, demonstrating that the spin transition was related to intermolecular changes in the solid state and the crystal lattice. In 1991, Hauser et al. studied the kHL of a series of mixed Fe(II) crystals diluted in Zn (II), among them Zn1−xFex(6-mepy)3tren(PF6)2·CH3CN; x = 0.05%, in order to experimentally prove nonadiabatic multiphonon relaxation theory in HS-to-LS intersystem crossing processes [25]. In 1998, Schenker et al. [26] studied the thermal spin transition in the corresponding diluted compound Zn1−xFex(6-mepy)3tren(PF6)2; x = 0.025%, obtaining a more gradual transition than was obtained for the neat one, although this was still steep for such a high dilution in Zn. In addition, the authors studied the temperature dependence of the HS-to-LS relaxation at 1 bar and 1kbar via pump-probe absorption experiments, demonstrating that the process did not depend on temperature below 50 K and that this tunnelling accelerates by almost nine orders of magnitude when applying an external pressure of 27 kbar. More recently, Chakraborty et al. [27] analysed the thermal spin transition and HS-to-LS relaxation after LIESST of the diluted compound Zn1−xFex(6-mepy)3tren(PF6)2; x = 31%. More importantly, the authors determined the structure of the short-lived photoexcited HS state in the neat and diluted compounds under continuous irradiation by analysing the structure at the steady state at different excitation intensities and by extrapolating the structural parameters of the 100% photoexcited HS state by using the mean field model. Just one year later, Tissot et al. [28] synthesised the solvated analogue [Fe(mepy)3tren](PF6)2·C7H8·CH3CN. In this case, the presence of the solvents stabilised the HS state and accounted for an increase in the cooperativity due to the strong intermolecular interactions and LIESST effect led to a quantitative conversion from the LS to the HS state at 10 K with sigmoidal relaxations at 45–60 K fitted within the mean field model. The structure of the photoinduced HS state was obtained and it was found that the cooperativity is greater than for the thermally populated HS structure. A detailed analysis of the structure was provided to explain why the stability of the photoinduced HS state is not related to the critical temperatures of the thermal transition.
Here, we present the synthesis and study of single crystals of the intermediate analogue Zn1−xFex(6-mepy)3tren(PF6)2·CH3CN, x = 0.5%. This complex is highly diluted in iron and presents a molecule of acetonitrile in the unit cell. The goal is twofold: first, the high cooperativity observed in the [Fe(mepy)3tren](PF6)2·C7H8·CH3CN analogue will be compared with our non-containing-C7H8 analogue and with the unsolvated neat and diluted in Zn compound Zn1−xFex(6-mepy)3tren(PF6)2. Second, the possibility of reverse-LIESST will be evaluated in Zn1−xFex(6-mepy)3tren(PF6)2·CH3CN.

2. Materials and Methods

Synthesis. The mixed crystals of Zn1−xFex(6-mepy)3tren(PF6)2·CH3CN; x = 0.5% were obtained by following the synthesis route established by Holselton et al. [24]. The mixed crystals are obtained by mixing solutions of Fe(6-mepy)3tren(PF6)2 in a mixture of ethanol/acetonitrile (1:1) and Zn(6-mepy)3tren(PF6)2 in the same mixture of solvents. Then, the final solution covered with perforated parafilm is placed in a desiccator with ether, allowing the slow growth of relatively big crystals. The obtained crystals show slightly different colours under the polariser light of the microscopy, changing from more reddish to orange–blue in the two different perpendicular positions. According to Schenker et al. [26], the dichroism observed in these crystals is due to the polarisation of the metal-to-ligand charge transfer (MLCT) transition towards the pyridine rings of the ligand.
Absorption spectroscopy. To carry out the experiments, the Zn1−xFex(6-mepy)3tren(PF6)2·CH3CN; x = 0.5% crystals were mounted and fixed with silver nanoparticle glue on a copper plate. For the low-temperature measurements, a Janis-Sumimoto closed cycle cryostat from Lake Shore Cryotronics (Westerville, OH, USA) coupled with a temperature controller from Lake Shore Cryotronics (Westerville, OH, USA) was used, whereas the absorption spectra were obtained with a Varian Cary double-beam spectrometer. A polariser was placed in front of the detector.
Light-Induced Excited Spin State Trapping. A home-built system was used consisting of a 0.28 Spex 280M monochromator, a Spex 280M CCD camera, a W-halogen lamp, and a shutter controller box, which was used to record the absorption spectra during HS-to-LS relaxations at low temperature. The excitation (LIESST) was performed with the sample inside the cryostat with a wavelength modulable NKT laser. A Hamamatsu photomultiplier, a Tektronix oscilloscope, and a green pulse laser at 532 nm were used to follow the relaxation and excite the sample, respectively, for temperatures above 60 K. In both cases, a polariser was placed in front of the detector.
Single-crystal X-ray diffraction. For these experiments, the diffraction patterns were obtained on a RIGAKU supernova diffractometer and an ATLAS CCD detector from Agilent (Santa Clara, CA, USA).

3. Results

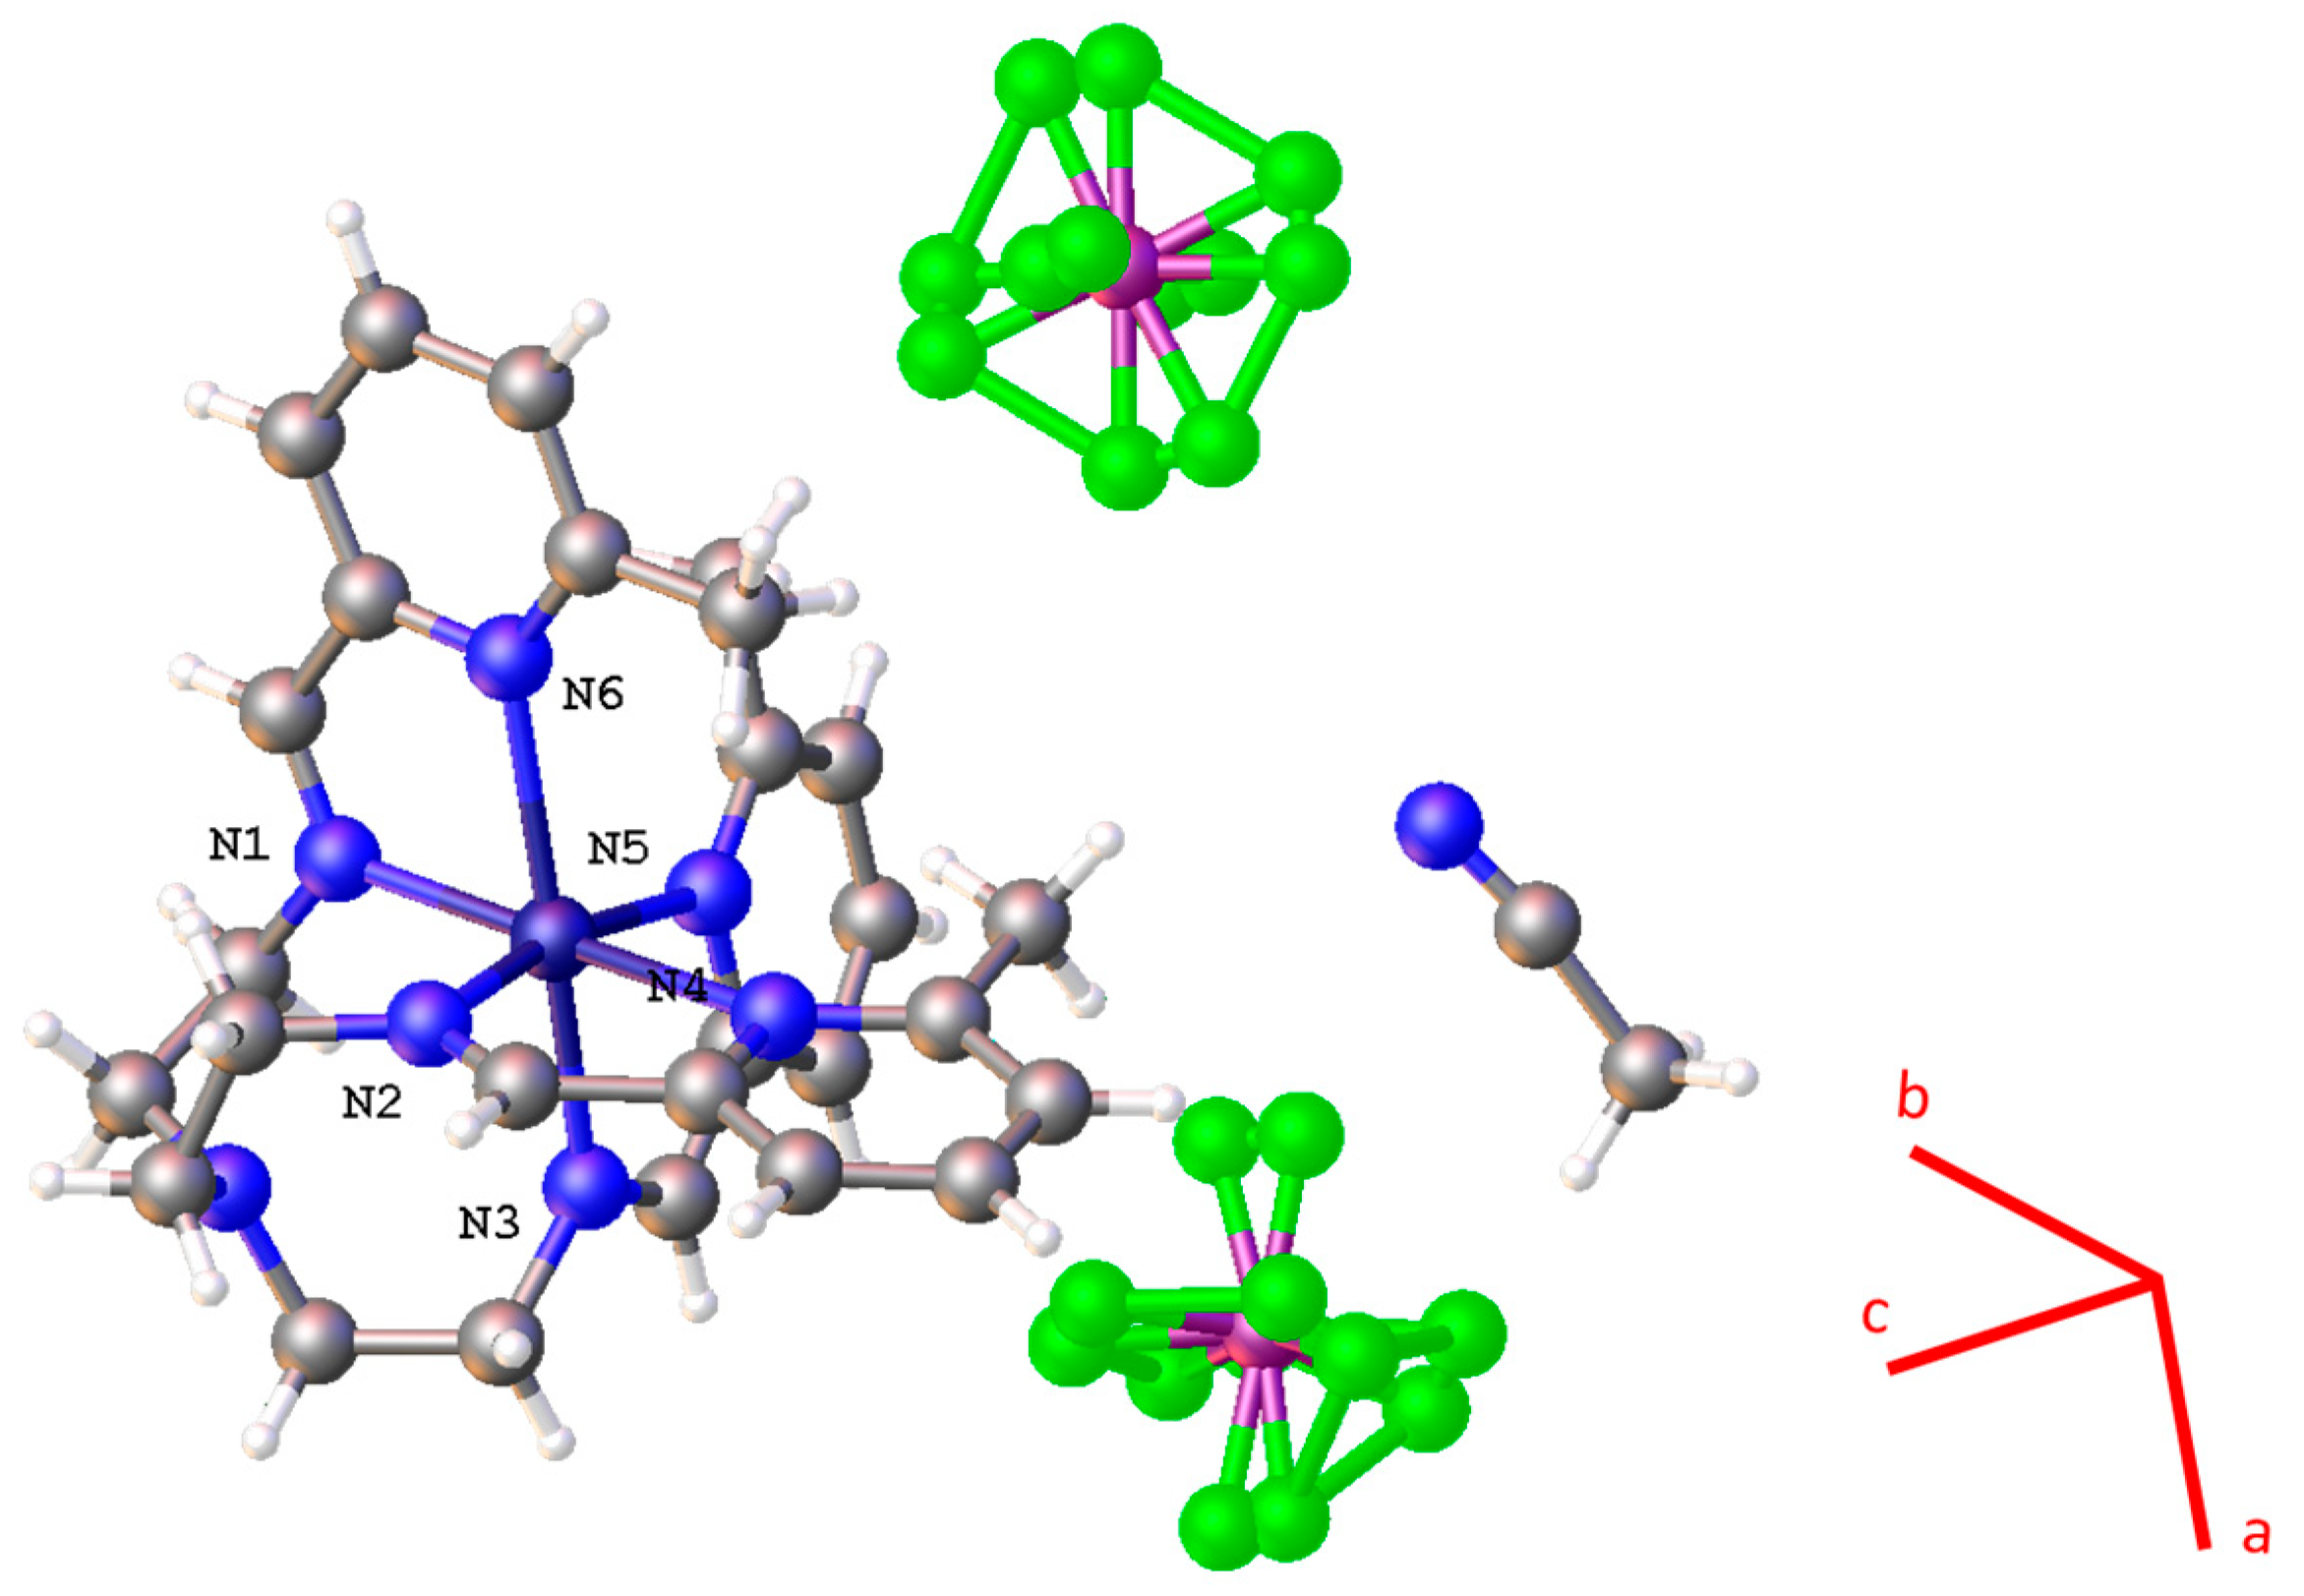
3.1. Crystallography

The structure of a Zn1−xFex(6-mepy)3tren(PF6)2·CH3CN, x = 0.5% crystal was analysed at room temperature. The corresponding schematised view of the structure is shown in Figure 2. The compound crystalises in the orthorhombic (α = β = γ = 90°) space group Pna21 with unit cell parameters a = 19.872 Å, b = 10.444 Å, and c = 17.274 Å and ensuing unit cell volume Vc = 3585.1 Å3, ~155 Å3 higher than the Vc value found for the unsolvated Zn1−xFex(6-mepy)3tren(PF6)2; x = 0.05%, around 3430 Å3. The latter has been estimated from the Vc difference between Fe(6-mepy)3tren(PF6)2. and Zn(6-mepy)3tren(PF6)2 at 10 K and the ΔVc between Fe(6-mepy)3tren(PF6)2. at 10 and 293 K [27]. The Vc of our Zn1−xFex(6-mepy)3tren(PF6)2·CH3CN, x = 0.5% is, in turn, ~623 Å3 lower than previously obtained for [Fe(mepy)3tren](PF6)2·C7H8·CH3CN [28]. The unit cell of our Zn1−xFex(6-mepy)3tren(PF6)2·CH3CN contains one molecule of acetonitrile, which influences the spin transition with respect to the solvent-free compound, as will be discussed hereafter. The Fe-N distances are also depicted in Figure 2 (d(Fe-N1) = 2.107 Å, d(Fe-N2) = 2.128 Å, d(Fe-N3) = 2.135 Å, d(Fe-N4) = 2.359 Å, d(Fe-N5) = 2.328 Å, and d(Fe-N6) = 2.324 Å) and their average value (d(Fe-Nav)) is 2.230 Å, that is, the molecule is in the HS.
In the LS state at 10 K, the unit cell parameters of Zn1−xFex(6-mepy)3tren(PF6)2·CH3CN, x = 0.5% are not experimentally available but Vc can be likewise estimated as 3325.5 Å3, considering that ΔVc with respect to the unsolvated Zn1−xFex(6-mepy)3tren(PF6)2, x = 0.05% in the LS state is still 155 Å3. Finally, in the LS state, d(Fe-Nav) is expected to be 2.030 Å as the metal−ligand (usually nitrogen atom) bond length increases by ΔrHL = rHSrLS = 0.2 Å [29].

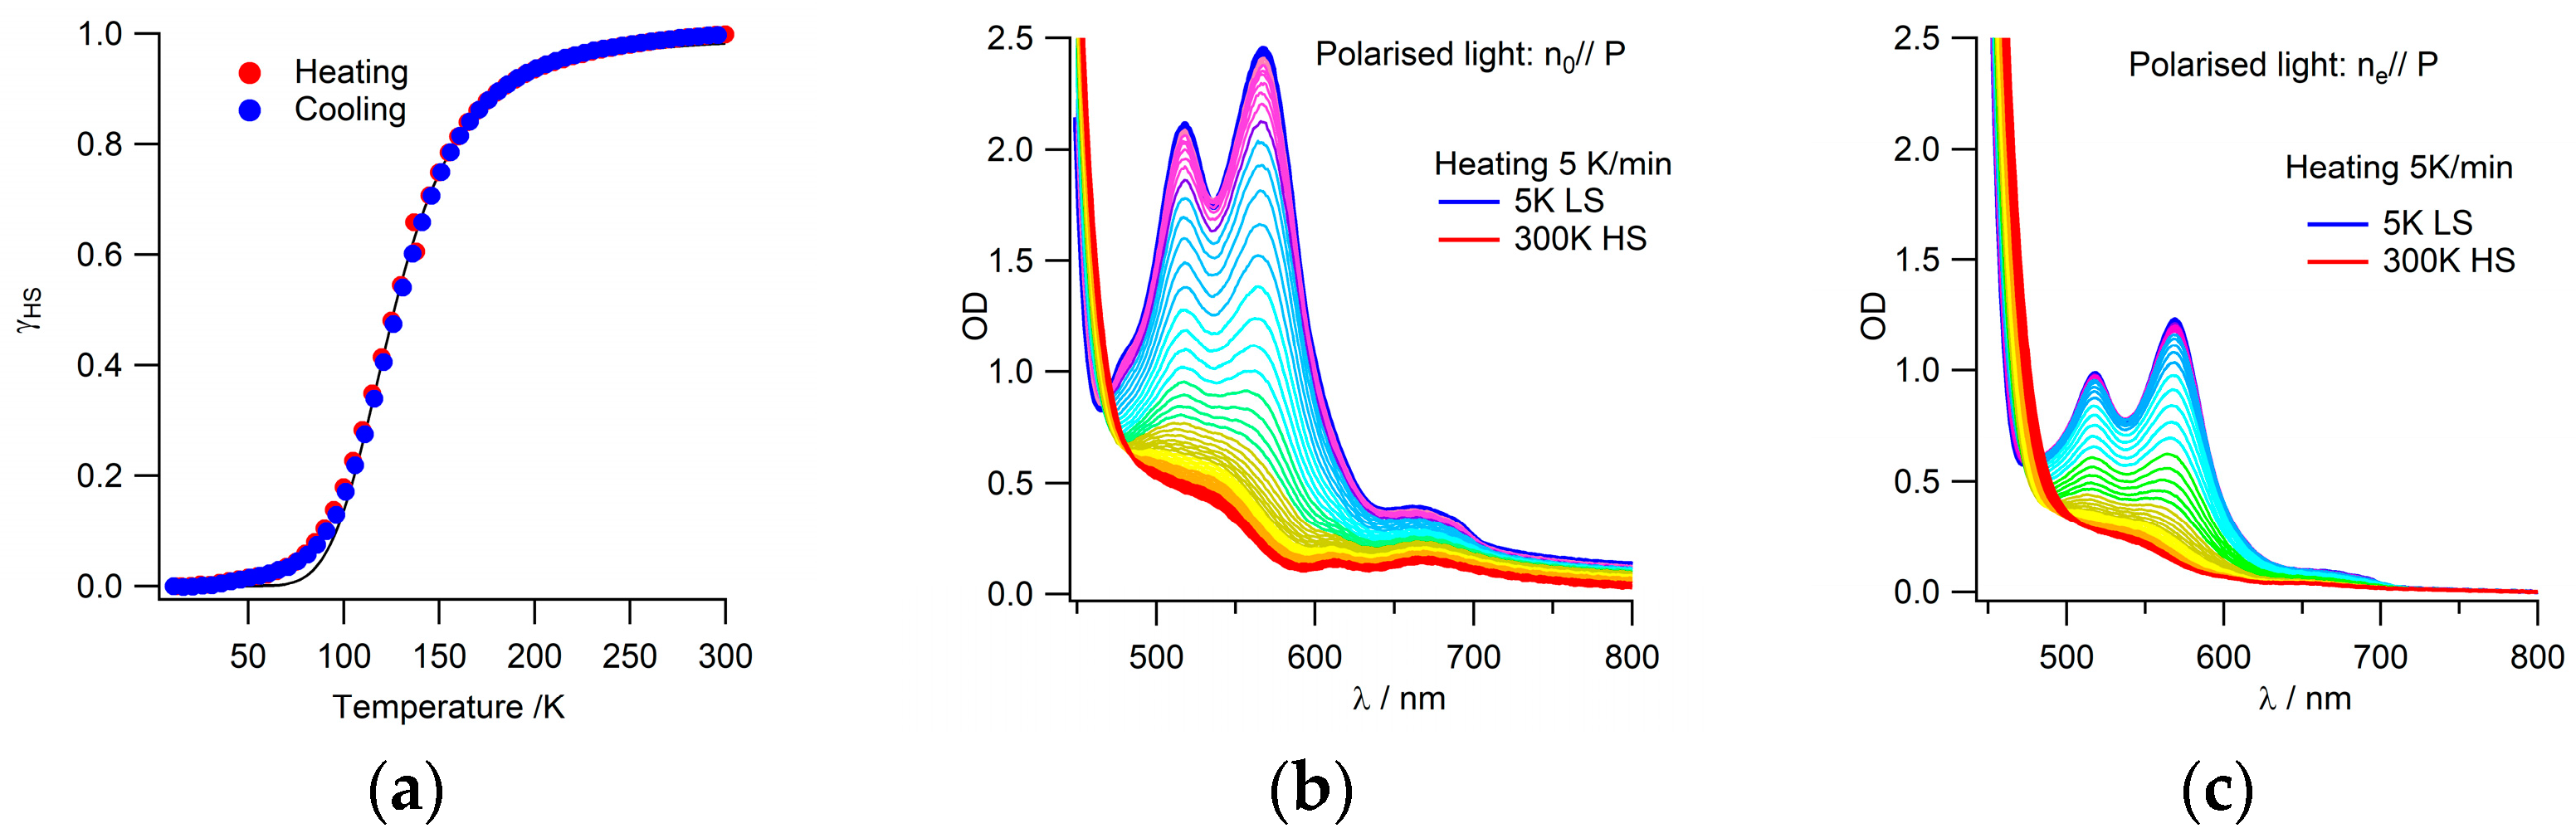
3.2. Thermal Spin Transition

The absorption spectrum of a crystal of Zn1−xFex(6-mepy)3tren(PF6)2·CH3CN, x = 0.5% with a thickness of 230 µm has been recorded at room temperature and 5 K for the polarisation axis parallel to the n0 index of the crystal (n0||P, a-axis) and for the perpendicular polarisation (ne||P, c-axis). As observed in Figure 3b,c, the MLCT band of the former is almost double in intensity of that of the latter one. Then, MLCT absorption bands (from 450 to 800 nm) of the sample in both polarisations during cooling and heating were recorded at 5 K/min in a temperature range of 300–5 K. The evolution of the HS fraction (γHS) was obtained with Equation (1) by following the LS absorption band at 568 nm:
γ H S = O D L S O D T O D L S O D H S ,
where ODLS, ODHS, and ODT are the optical densities of the LS state (10 K), the HS (300 K), and intermediate states at a given temperature, respectively. The dependence of γHS on the temperature in the case of n0||P is represented in Figure 3a. The transition, centred at 125 K (Tc), is completely reversible in the cooling and heating modes and it is relatively abrupt taking into account the high dilution of the crystal. The same thermal transition curve has been obtained for the other polarisation, ne||P, since the polarisation is not expected to have any influence on the characteristics of the spin change. If these results are compared with those obtained for the diluted unsolvated system Zn1−xFex(6-mepy)3tren(PF6)2, x = 0.05% with a Tc = 210 K [25], it is evident that the inclusion of acetonitrile in the system shifts the critical temperatures to lower values of temperature due to the stabilisation of the HS state upon expansion of the unit cell volume. The influence of acetonitrile in the SCO properties was already proven by Tissot et al. [28] in the neat compound Fe(6-mepy)3tren(PF6)2·C7H8·CH3CN, where the inclusion of toluene and acetonitrile shifts the spin transition temperatures towards much lower values, such as Tc ~ 88 K.
The transition curve of our mixed-crystal Zn1−xFex(6-mepy)3tren(PF6)2·CH3CN, x = 0.5% has been fitted with the equation of Gibbs free energy:
Δ G H L 0 = Δ H H L 0 Δ S H L 0 = k B T   l n   γ H S 1 γ H S ,
The following thermodynamic parameters were obtained: Δ H H L x 0 = 565.32 ± 10.5 K and Δ S H L x 0 = 4.66 ± 0.08 K. These are significantly lower than the values obtained for the acetonitrile-free compound Zn1−xFex(6-mepy)3tren(PF6)2, x = 0.31% ( Δ H H L x 0 = 2510 K and Δ S H L x 0 = 12 K) [27] and x = 0.05% ( Δ H H L x 0 = 1739 K and Δ S H L x 0 = 8.27K).

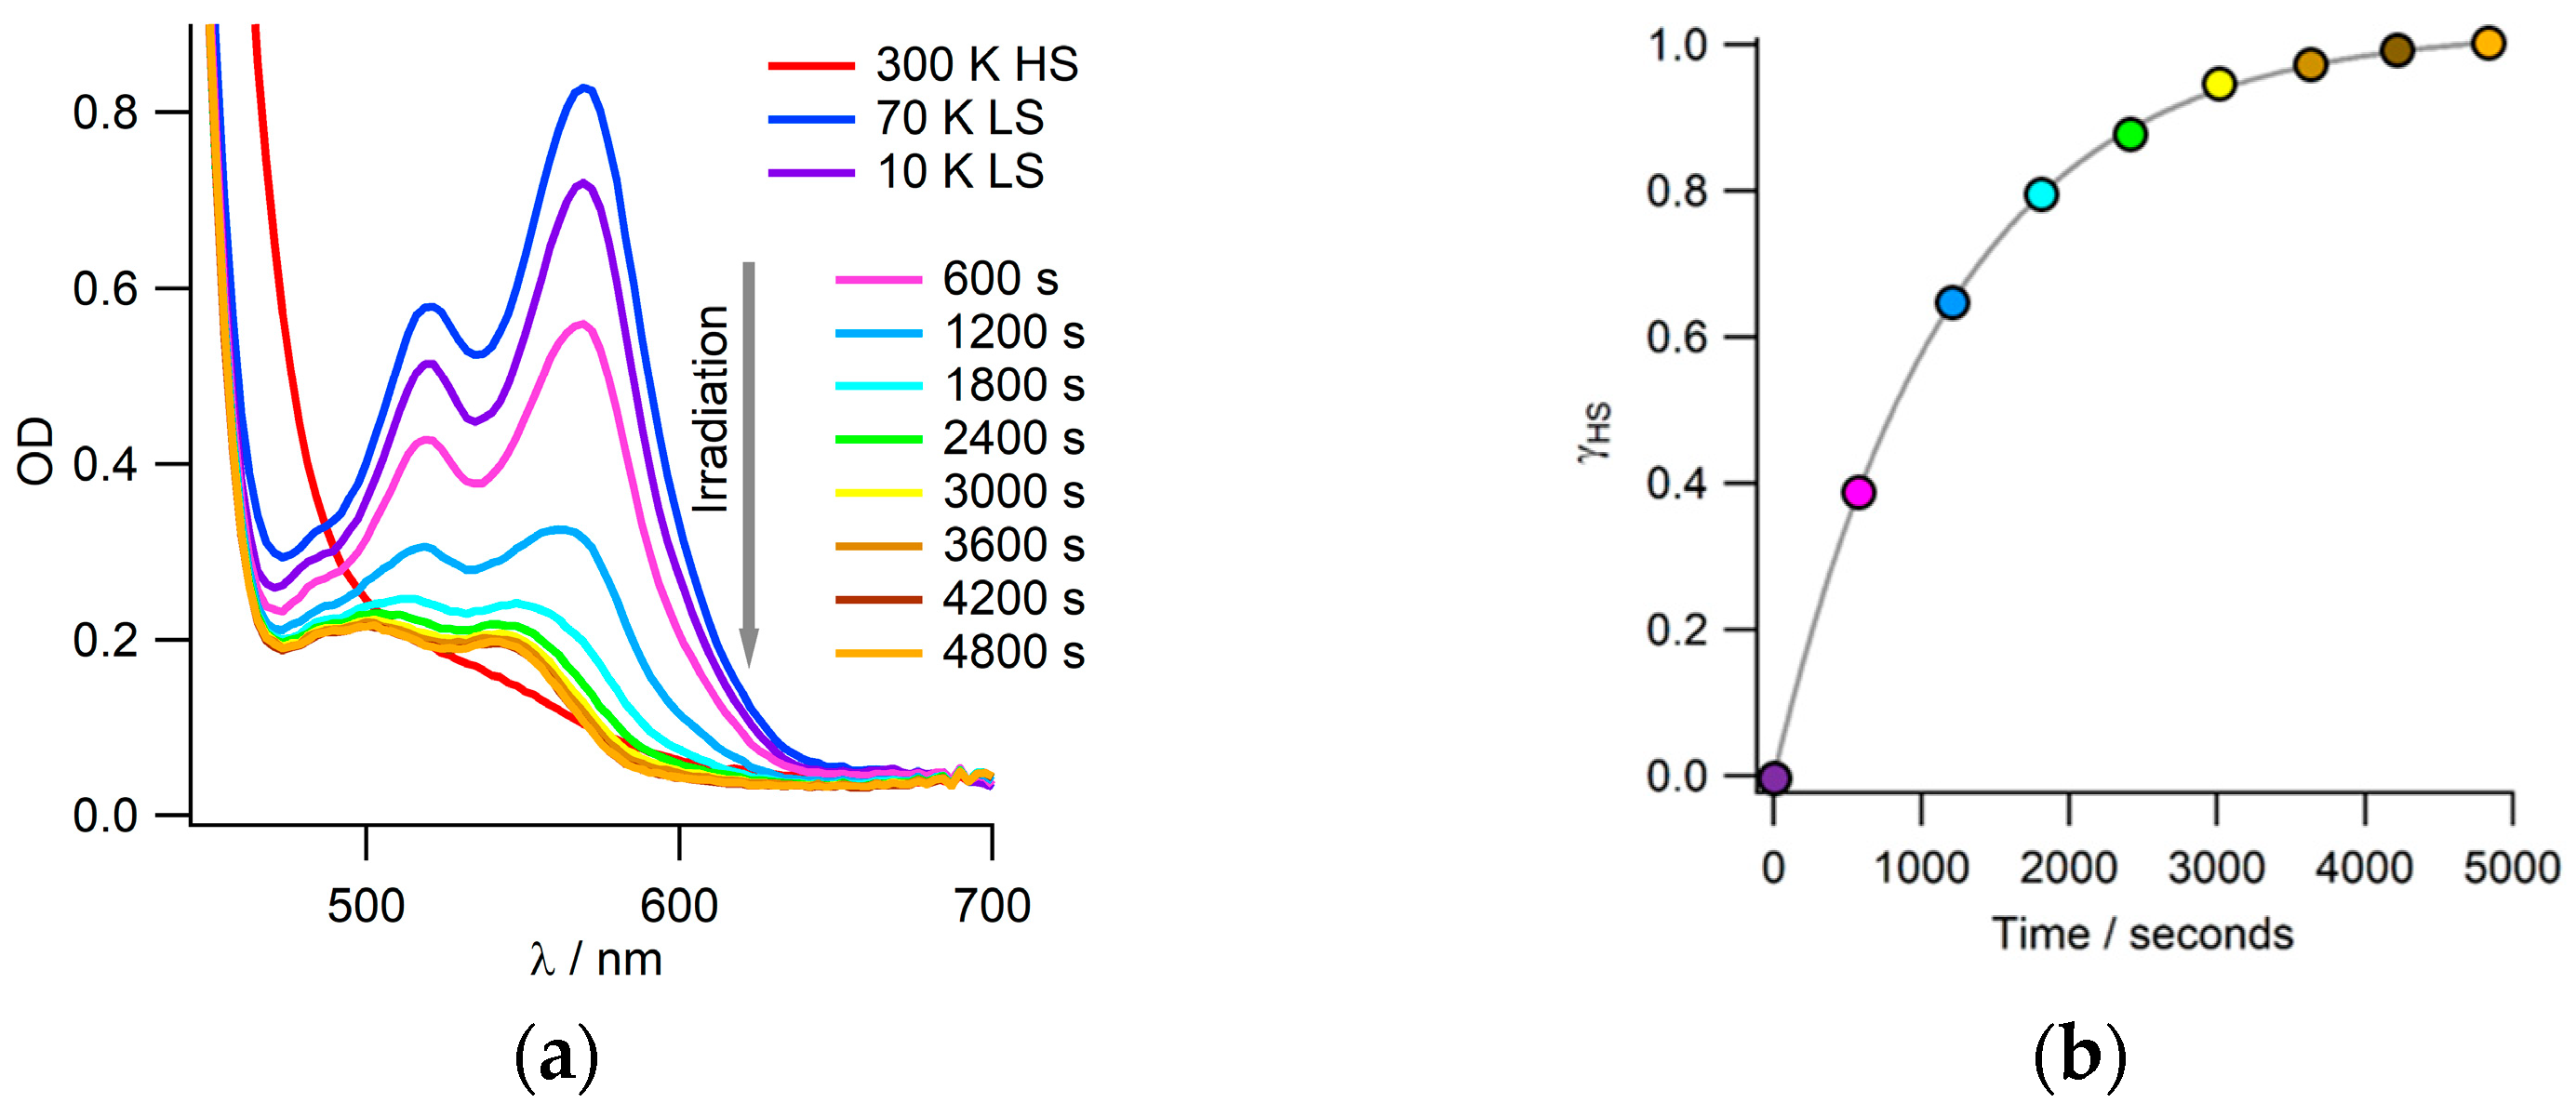
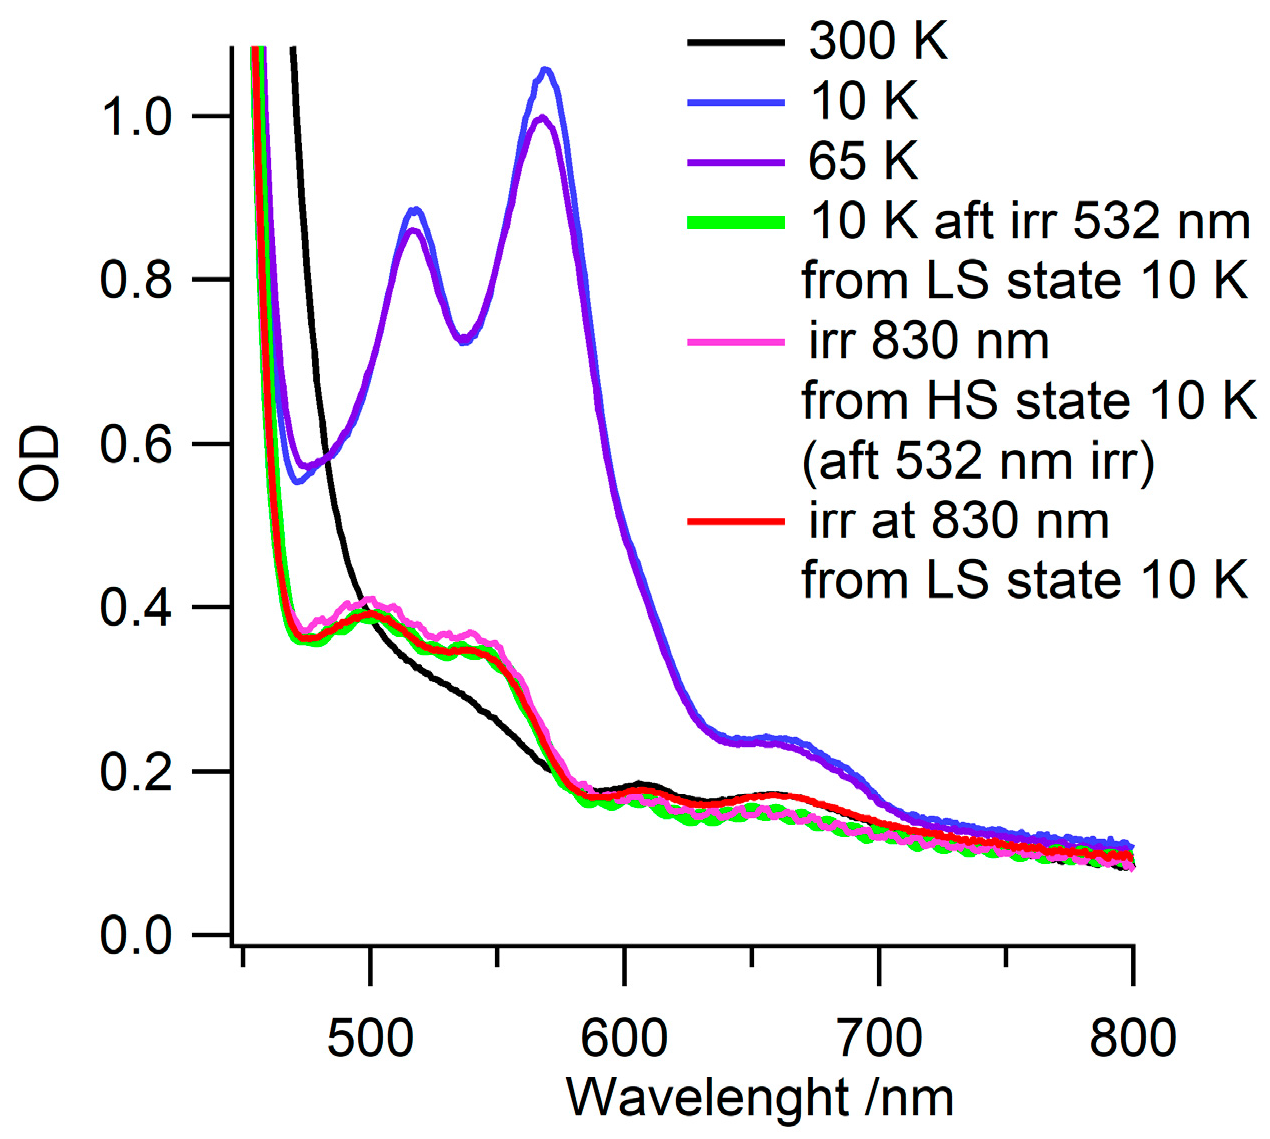
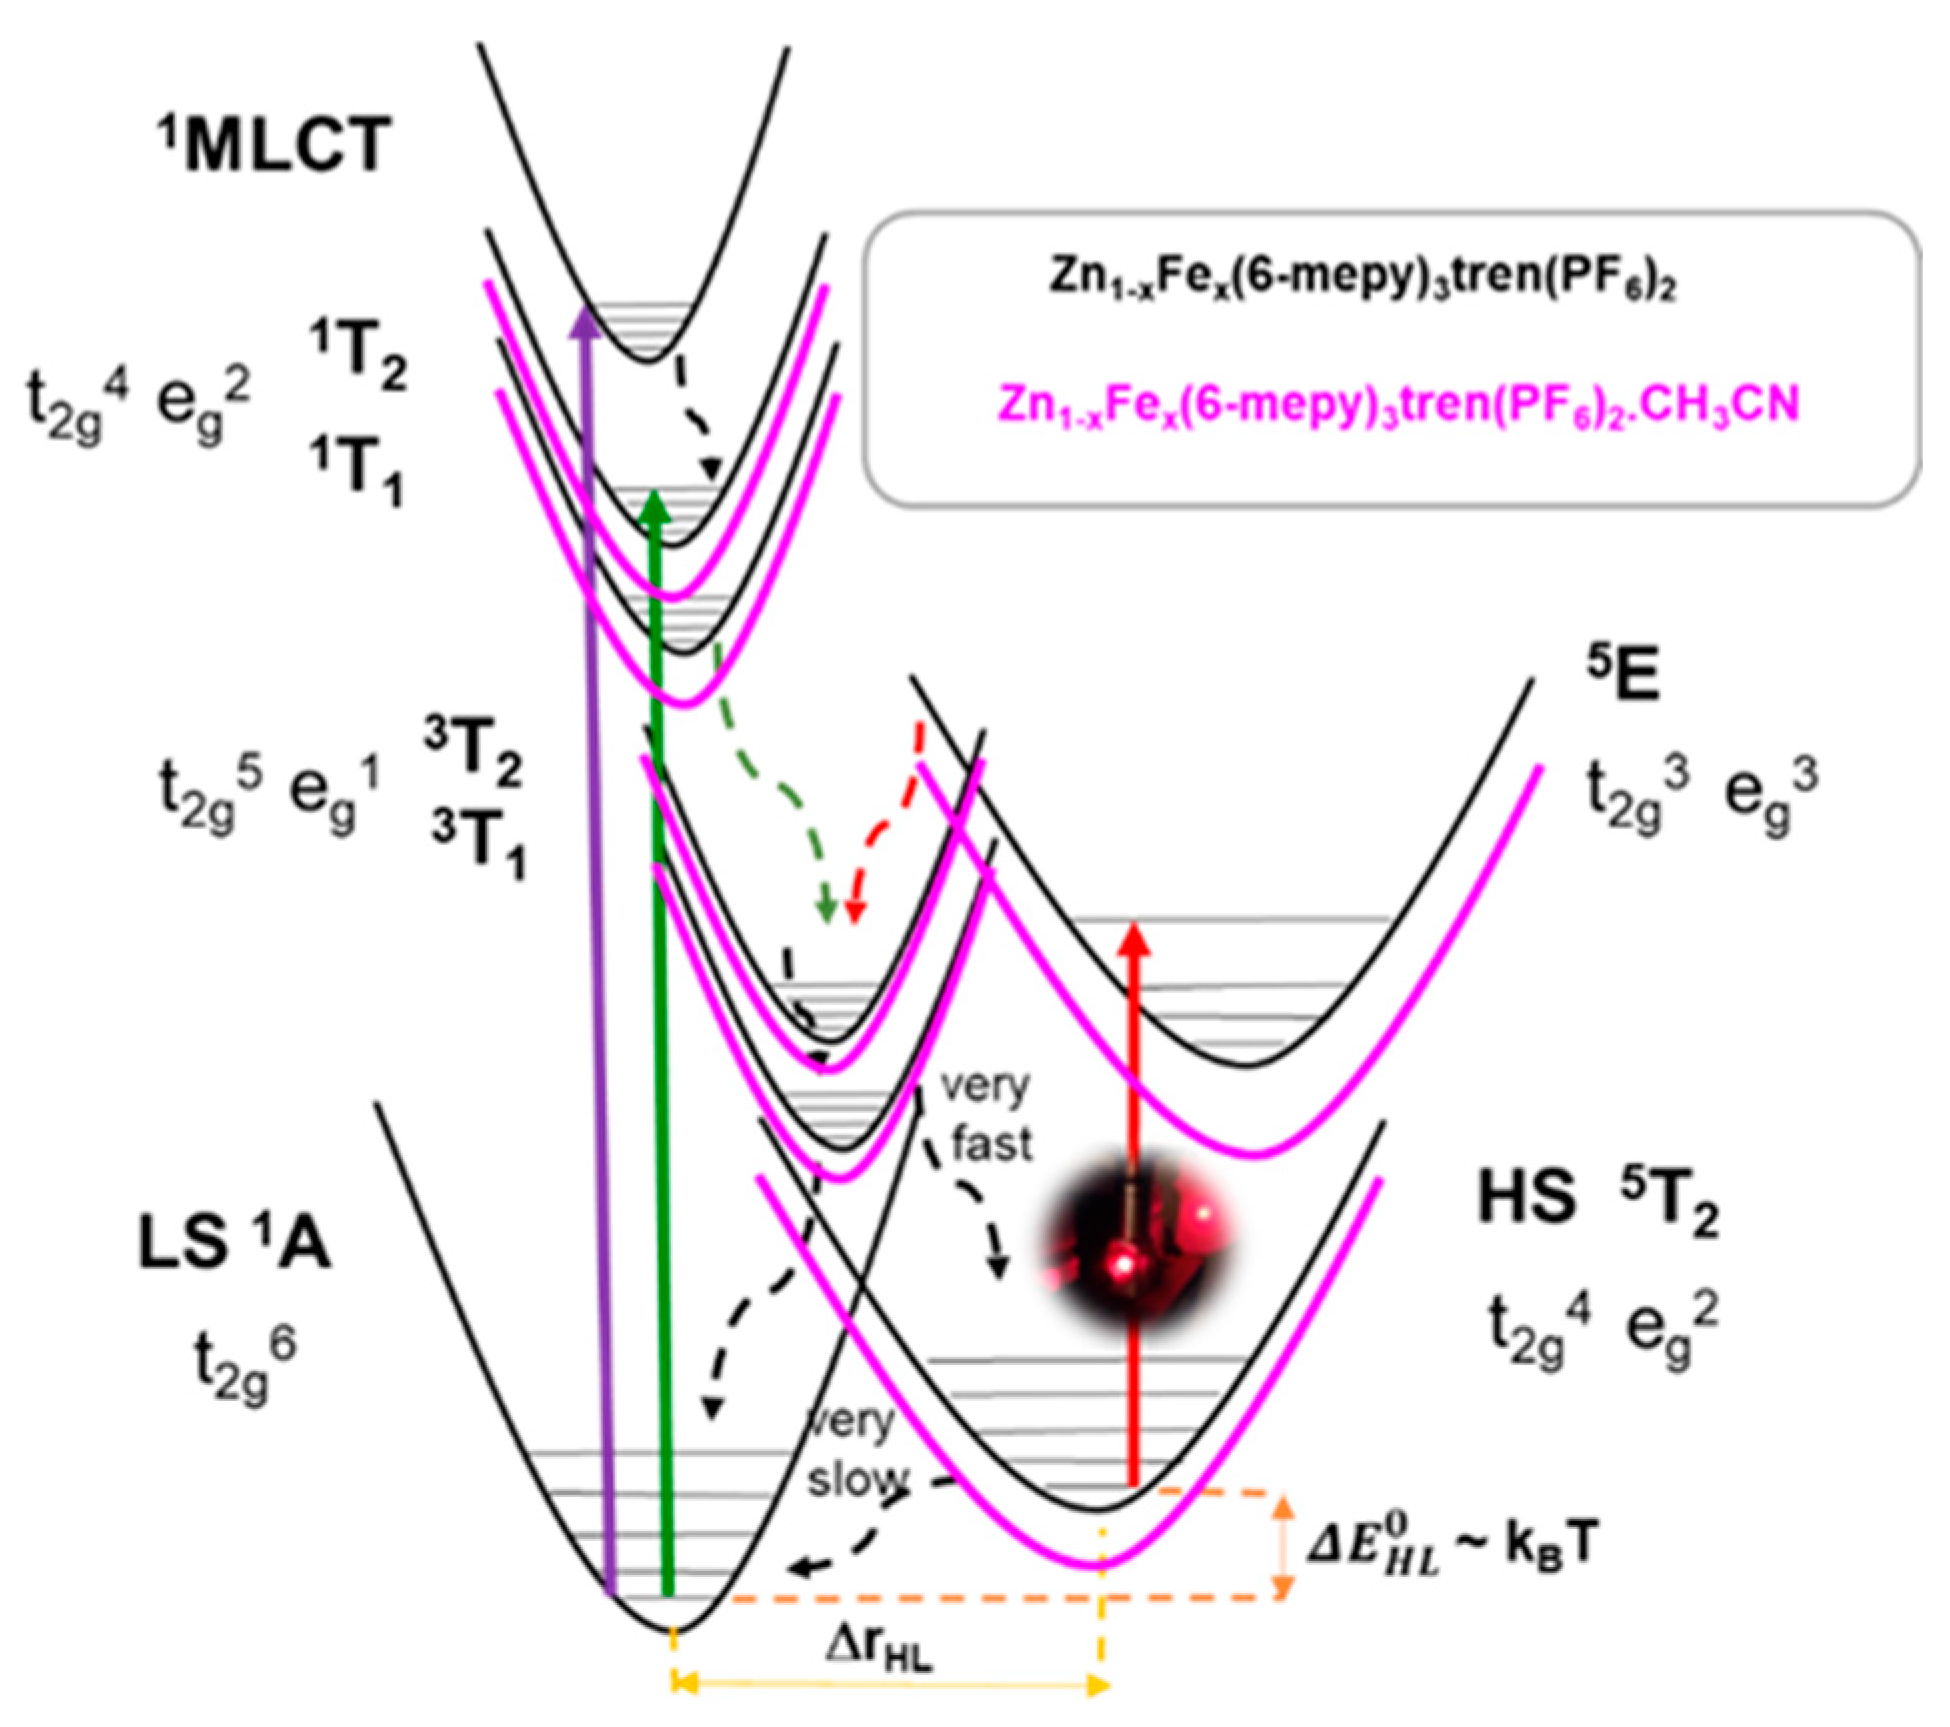
3.3. Photo-Induced LS-to-HS Spin Transition: LIESST Effect

The absorption spectrum of mixed-crystal Zn1−xFex(6-mepy)3tren(PF6)2·CH3CN, x = 0.5% of 390 µm thickness was recorded at 10 K to establish the optical density in the LS state (ODLS). However, during the cooling from RT to 10 K, it was noticed that the spectrum at 70 K was higher in intensity than the spectrum at 10 K (Figure 4a), indicating that the W-halogen lamp used to perform the absorption experiment was enough for LS-to-HS excitation to occur. Despite the use of strong filters in front of the lamp and the use of a shutter that only allows light to pass through the sample when recording the spectrum, the LIESST effect created by the lamp at very low temperatures was impossible to avoid. Indeed, the W-halogen lamp (8.3 A) was used to follow the absorption spectra during the LS HS photo-excitation at 10 K as a function of time (Figure 4a). As observed, after approximately 2 h of irradiation, the spectrum shows the same intensity as the spectrum at room temperature in the HS state. Therefore, a quantitative conversion into the metastable HS state at 10 K is achieved. The dependence of γHS on time was obtained using Equation (1) (Figure 4b). The LS HS conversion follows an exponential behaviour with a time needed to irradiate up to γHS = 0.5 of around 850 s and 1 h and 23 min for the total conversion.

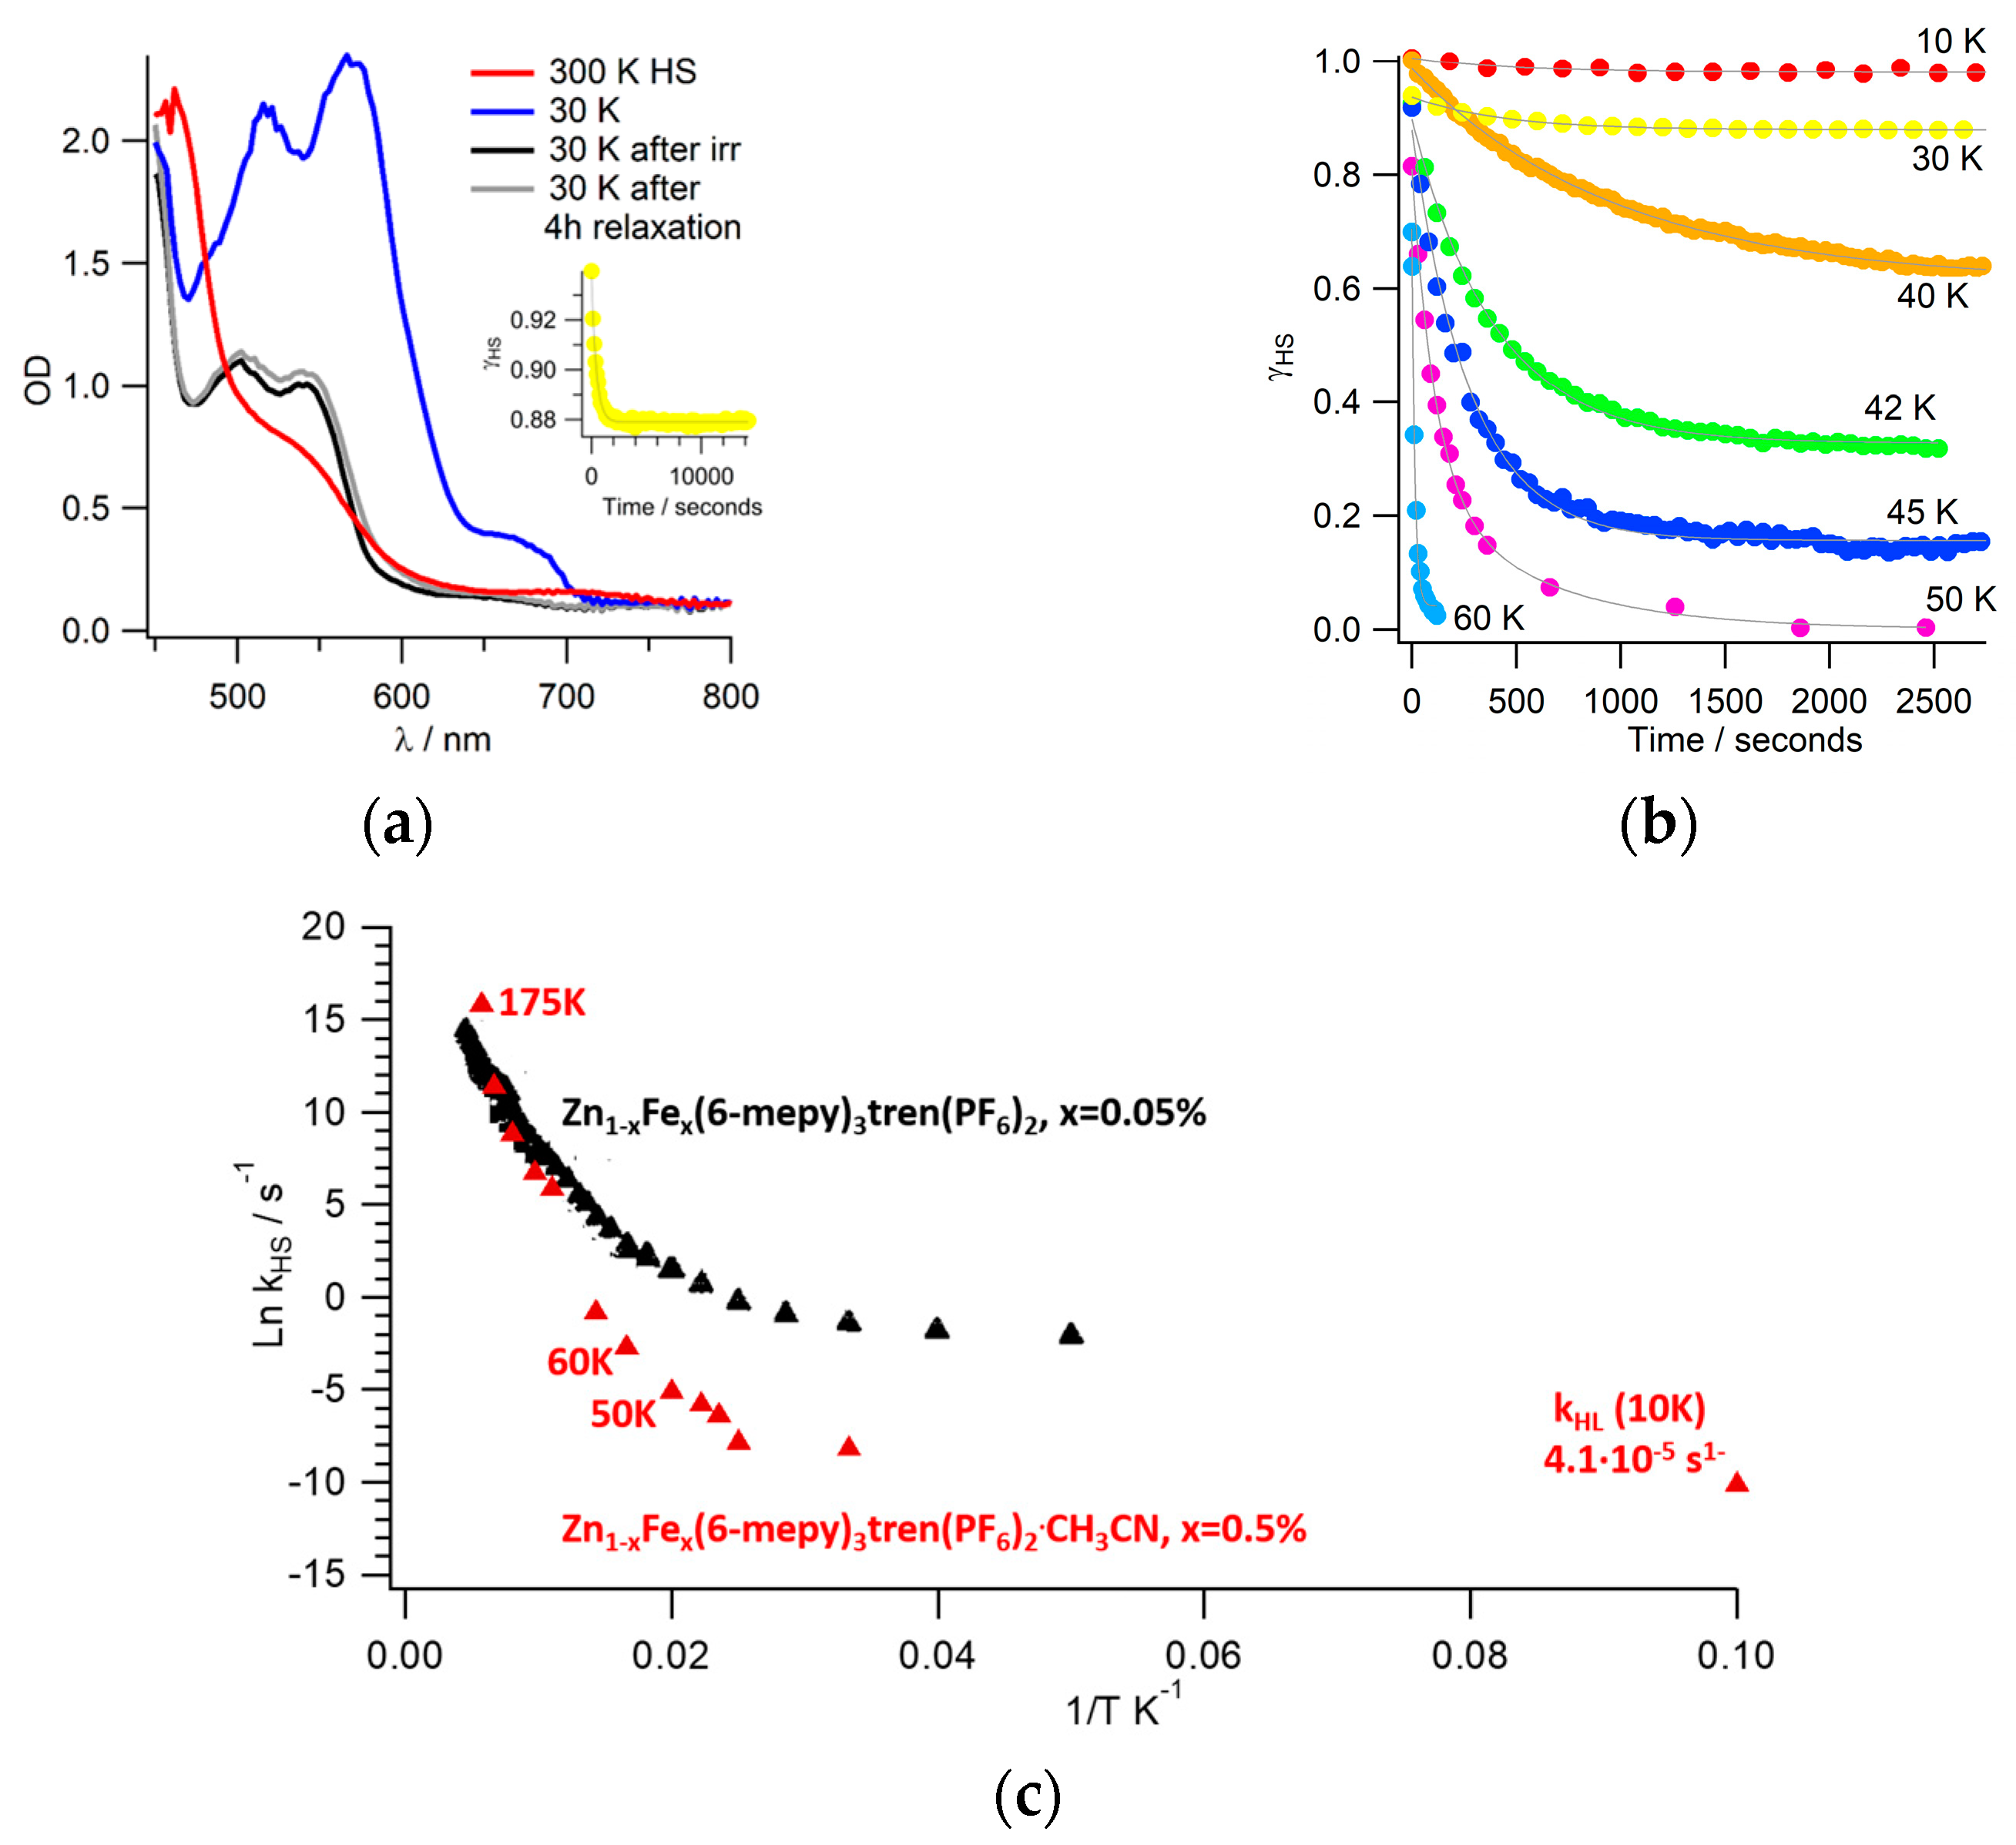
3.4. HS-to-LS Relaxation after LIESST

Different HS-to-LS relaxation curves have been obtained from 10 to 175 K by absorption spectroscopy after LIESST on a mixed crystal of Zn1−xFex(6-mepy)3tren(PF6)2·CH3CN, x = 0.5% (thickness = 280 µm). With this purpose, the sample was excited with an NKT laser at 570 nm and 8 mW until quantitative conversion into the HS state and then the laser was stopped while following the relaxation. The results are displayed in Figure 5. In Figure 5a, an example of the evolution of the spectra during LIESST and HS-to-LS relaxation at 30 K is shown. As observed, due to the very low temperature, the LIESST is very efficient, as the HS spectrum at 300 K and the photoinduced one overlap, and the relaxation is very slow, as, after 4 h, the photoinduced HS spectrum has almost not evolved towards the LS one. This translates into roughly 10% of the SCO centres relaxed back to the LS state at 30 K (Inset Figure 5a). Following the evolution of the spectra, all the relaxation curves at different temperatures have been extracted by using Equation (1). In Figure 5b, the relaxation curves from 10 to 60 K are displayed. At these temperatures, the slow speed of the relaxation makes still possible to record the whole spectra during the process. All the relaxation curves are close to a single exponential. In addition, as mentioned above, the source of light for the absorption measurement produces LIESST at low temperatures in such a way that, during the relaxation, a steady state is reached due to the competition between the HS-to-LS relaxation and the LS-to-HS excitation from the lamp. This situation leads to values of the HS fraction achieved in the stationary state ( γ HS s s ) being different from zero at the end of the relaxations, which will depend on the temperature and, thus, on the efficiency of the LIESST effect coming from the lamp. Therefore, the HS-to-LS relaxation rate constants kHL between 10 K and 60 K are calculated as follows.
For a steady state, the HS fraction is given by:
γ H S s s = k e x k e x + k H L ,
where kex is the LS-to-HS excitation rate constant, kHL is the real HS-to-LS relaxation rate constant, and γ H S s s is the HS fraction achieved in the stationary state.
The observable relaxation rate constant, k o b s , can be directly extracted from an exponential fitting of the curves:
k o b s = k e x k H L ,
The real relaxation rate constant, kHL, is:
k H L = ( 1 γ H S s s ) k o b s
On the other hand, in the range of temperatures 60–175 K, the LIESST effect from the lamp is negligible and, kHL, is obtained directly from the exponential fit. However, in this case, due to the high speed of the relaxation, it is not possible to record the whole spectra and, instead, the evolution of a given wavelength during relaxation, at 568 nm is selected. The corresponding values of kHL are represented in Figure 5c as l n   k H L v s . the inverse of the different temperatures. Above 50 K, the relaxation is a temperature-dependent process, whereas, below this temperature, the linear dependence of lnkHL with the temperature vanishes, showing the influence of the relaxation through quantum tunnelling [20]. At 10 K, kHL is around 4.1·10−5 s−1, that is, the HS→LS relaxation is much slower than in the analogue unsolvated compound Zn1−xFex(6-mepy)3tren(PF6)2, x = 0.05%, (kHL (T→0) = 1.4·10−1 s−1) [25] due to the stabilisation of the HS state upon incorporation of acetonitrile. For the same reason, the activation energy values obtained from the Arrhenius plot for the HS→LS relaxation between 60 and 175 K (Ea = 11.42 kJ/mol) and between 100 and 175 K (Ea = 17.90 kJ/mol) are significantly higher than those obtained for the analogue unsolvated compound Zn1−xFex(6-mepy)3tren(PF6)2, x = 0.05% above 100 K (Ea = 10.01 kJ/mol) [25].

3.5. Reverse-LIESST

A reverse-LIESST experiment at 10 K was performed on a mixed-crystal Zn1−xFex(6-mepy)3tren(PF6)2·CH3CN, x = 0.5% (thickness = 390 µm). In Figure 6, the absorption spectra of the sample at 300 K and after cooling down to 10 K are shown. In this setup configuration, there is no LIESST effect coming from the source of light, as evidenced by the fact that the spectrum at 10 K is higher in intensity than, for instance, at 65 K. For the reverse-LIESST experiment, the sample is first irradiated at 10 K with the 532 nm laser in the LS state with a power of 5 mW until the maximum value of γHS is achieved after 5 min (green line). Then, the sample is relaxed back to the LS state by heating until 70 K and cooled down to 10 K, to excite again at 830 nm with a power of 12 mW. The same maximum value of γHS as before is reached (red line). Secondly, the sample is relaxed back to the pure LS state as before and irradiated again at 532 nm at the same conditions arriving at the same steady state as before (green line). Then, the sample is irradiated at 830 nm (30 mW) for a long time. However, after even 1 h of irradiation, only around 5% of HS LS conversion is reached (pink line). The same results are obtained by irradiating the sample at 880 nm and 980 nm. These results demonstrated that the reverse-LIESST effect for this acetonitrile adduct is difficult to occur. This may be due to the fact that, upon the introduction of acetonitrile in the structure, the ensuing decrease of the ligand field splitting Δo around the Fe stabilises not only the 3T excite states of the LS but also and to a greater extent the ground and excited states of the HS state, as represented in Figure 7. If we compare the hypothetical behaviour of the unsolvated compound Zn1−xFex(6-mepy)3tren(PF6)2 with that of the compound under study, Zn1−xFex(6-mepy)3tren(PF6)2·CH3CN, x = 0.5%, the stabilisation of the excited LS states 3T2 and 3T1 occurs together with the stabilisation of the ground HS state 5T2 due to the presence of one and two electrons in the eg orbitals, respectively. This could lead, in principle, to a favourable environment for reverse-LIESST to take place. However, the HS excited state 5E stabilises as well to a greater extent in our acetonitrile adduct, since three electrons are situated in the eg orbital. Hence, globally, the deactivation path 5E → 5T2 is more favoured than in the unsolvated compound and the reverse-LIESST probability decreases.

4. Conclusions

The thermal spin transition of Zn1−xFe x(6-mepy)3tren(PF6)2·CH3CN, x = 0.5% shows significant stabilisation of the high-spin state due to volume expansion of the unit cell upon the incorporation of acetonitrile. As a first observation, the polarisation of the crystals has absolutely no influence on the thermal transition. On the one hand, the thermal transition is surprisingly abrupt for such a high dilution of iron in zinc as previously observed in the unsolvated compound. The values of the enthalpy and entropy change during the transition are both lower than those of the unsolvated compound regardless of the dilution of iron in zinc. This reflects the effect of acetonitrile in the critical transition temperature, shifting it to lower values and the ordering of the unit cell upon acetonitrile inclusion. On the other hand, the light-induced low-spin to high-spin excitation at 10 K is possible even with white light and follows an exponential behaviour due to the high dilution of iron in zinc. Likewise, the high-spin to low-spin relaxations also describe an exponential behaviour, which is thermal-dependent at relatively high relaxation temperatures and occurs through quantum tunnelling at very low temperatures, with values of HS→LS relaxation rate constant that evidence the higher stability of the HS state due to solvent presence. The reverse-LIESST effect, in contrast, does not take place in the complex, despite the high spin stabilisation provided by the acetonitrile molecule. More concentrated crystals in iron will be tested in the future to obtain a higher absorption of d-d HS bands for the process to take place.

Author Contributions

Conceptualisation, T.D. and A.-L.P.; methodology, T.D. and A.-L.P.; software, T.D.; validation, T.D.; formal analysis, T.D.; investigation, T.D.; data curation, T.D.; writing—original draft preparation, T.D. All authors have read and agreed to the published version of the manuscript.

Funding

This research received no external funding.

Data Availability Statement

The raw data supporting the conclusions of this article will be made available by the authors on request.

Conflicts of Interest

The authors declare no conflicts of interest.

References

  1. Gütlich, P.; Hauser, A.; Spiering, H. Thermal and Optical Switching of Iron(II) Complexes. Angew. Chem. Int. Ed. Engl. 1994, 33, 2024–2054. [Google Scholar] [CrossRef]
  2. Guetlich, P.; Ksenofontov, V.; Gaspar, A.B. Pressure effect studies on spin crossover systems. Coord. Chem. Rev. 2005, 249, 1811–1829. [Google Scholar] [CrossRef]
  3. Bousseksou, A.; Molnár, G.; Salmon, L.; Nicolazzi, W. Molecular Spin Crossover Phenomenon: Recent Achievements and Prospects. Chem. Soc. Rev. 2011, 40, 3313–3335. [Google Scholar] [CrossRef]
  4. Halcrow, M.A. (Ed.) Spin-Crossover Materials: Properties and Applications; Wiley-VCH: Weinheim, Germany, 2013. [Google Scholar]
  5. Delgado, T.; Villard, M. Spin Crossover Nanoparticles. J. Chem. Educ. 2022, 99, 1026–1035. [Google Scholar] [CrossRef]
  6. Amin, N.A.A.M.; Said, S.M.; Salleh, M.F.M.; Afifi, A.M.; Ibrahim, N.M.J.N.; Hasnan, M.M.I.M.; Tahir, M.; Hashim, N.Z.I. Review of Fe-based spin crossover metal complexes in multiscale device architectures. Inorg. Chim. Acta 2023, 544, 121168. [Google Scholar] [CrossRef]
  7. Sato, O. Dynamic Molecular Crystals with Switchable Physical Properties. Nat. Chem. 2016, 8, 644–656. [Google Scholar] [CrossRef] [PubMed]
  8. Ni, Z.-P.; Liu, J.-L.; Hoque, M.N.; Liu, W.; Li, J.-Y.; Chen, Y.-C.; Tong, M.-L. Recent Advances in Guest Effects on Spin-Crossover Behavior in Hofmann-Type Metal-Organic Frameworks. Coord. Chem. Rev. 2017, 335, 28–43. [Google Scholar] [CrossRef]
  9. Arcís-Castillo, Z.; Muñoz-Lara, F.J.; Muñoz, M.C.; Aravena, D.; Gaspar, A.B.; Sánchez-Royo, J.F.; Ruiz, E.; Ohba, M.; Matsuda, R.; Kitagawa, S.; et al. Reversible Chemisorption of Sulfur Dioxide in a Spin Crossover Porous Coordination Polymer. Inorg. Chem. 2013, 52, 12777–12783. [Google Scholar] [CrossRef]
  10. Bartual-Murgui, C.; Akou, A.; Thibault, C.; Molnár, G.; Vieu, C.; Salmon, L.; Bousseksou, A. Spin-Crossover Metal–Organic Frameworks: Promising Materials for Designing Gas Sensors. J. Mater. Chem. C 2015, 3, 1277–1285. [Google Scholar] [CrossRef]
  11. Turo-Cortés, R.; Meneses-Sánchez, M.; Delgado, T.; Bartual-Murgui, C.; Muñoz, M.C.; Real, J.A. Coexistence of luminescence and spin-crossover in 2D iron (II) Hofmann clathrates modulated through guest encapsulation. J. Mater. Chem. C 2022, 10, 10686–10698. [Google Scholar] [CrossRef]
  12. Yi, C.; Zhang, S.; Zhao, L.; Yao, N.; Zhao, G.; Meng, Y.; Liu, T. Constructing spin crossover-fluorescence bifunctional iron(ii) complexes based on tetraphenyl ethylene-decorated AIEgens. Dalton Trans. 2023, 52, 5169–5175. [Google Scholar] [CrossRef] [PubMed]
  13. Ohba, M.; Yoneda, K.; Agusti, G.; Munoz, M.C.; Gaspar, A.B.; Real, J.-A.; Yamasaki, M.; Ando, H.; Nakao, Y.; Sakaki, S.; et al. Bidirectional Chemo-Switching of Spin State in a Microporous Framework. Angew. Chem. 2009, 121, 4861. [Google Scholar] [CrossRef]
  14. Mallah, T.; Cavallini, M. Surfaces, thin films and patterning of spin crossover compounds. C. R. Chim. 2018, 21, 1270–1286. [Google Scholar] [CrossRef]
  15. Hauser, A. Intersystem Crossing in the [Fe(Ptz)6](BF4)2 Spin Crossover System (Ptz = 1-propyltetrazole). J. Chem. Phys. 1991, 94, 2741–2748. [Google Scholar] [CrossRef]
  16. Chastanet, G.; Lorenc, M.; Bertoni, R.; Desplanches, C. Light-Induced Spin Crossover—Solution and Solid-State Processes. Spin Crossover Phenom. Phénom. Transit. Spin 2018, 21, 1075–1094. [Google Scholar] [CrossRef]
  17. Hauser, A. Light-induced spin crossover and the high-spin→low-spin relaxation. Top. Curr. Chem. 2004, 234, 155–198. [Google Scholar]
  18. Ye, Y.S.; Chen, X.Q.; Cai, Y.D.; Fei, B.; Dechambenoit, P.; Rouzières, M.; Mathonière, C.; Clérac, R.; Bao, X. Slow Dynamics of the Spin-Crossover Process in an Apparent High-Spin Mononuclear Fe II Complex. Angew. Chem. Int. Ed. 2019, 58, 18888–18891. [Google Scholar] [CrossRef] [PubMed]
  19. Delgado, T.; Tissot, A.; Guénée, L.; Hauser, A.; Valverde-Muñoz, F.J.; Seredyuk, M.; Real, J.A.; Pillet, S.; Bendeif, E.-E.; Besnard, C. Very Long-Lived Photogenerated High-Spin Phase of a Multistable Spin-Crossover Molecular Material. J. Am. Chem. Soc. 2018, 140, 12870–12876. [Google Scholar] [CrossRef]
  20. Hauser, A.; Enachescu, C.; Daku, M.L.; Vargas, A.; Amstutz, N. Low-Temperature Lifetimes of Metastable High-Spin States in Spin-Crossover and in Low-Spin Iron(II) Compounds: The Rule and Exceptions to the Rule. Coord. Chem. Rev. 2006, 250, 1642–1652. [Google Scholar] [CrossRef]
  21. Hauser, A.; Jeftić, J.; Romstedt, H.; Hinek, R.; Spiering, H. Cooperative Phenomena and Light-Induced Bistability in Iron(II) Spin-Crossover Compounds. Coord. Chem. Rev. 1999, 190–192, 471–491. [Google Scholar] [CrossRef]
  22. Delgado, T.; Enachescu, C.; Tissot, A.; Hauser, A.; Guénée, L.; Besnard, C. Evidencing Size-Dependent Cooperative Effects on Spin Crossover Nanoparticles Following Their HS→LS Relaxation. J. Mater. Chem. C 2018, 6, 12698–12706. [Google Scholar] [CrossRef]
  23. Tchougrkeff, A.L. Lattice Relaxation and Cooperativity in the Low-Spin to High-Spin Transitions in Molecular Crystals. Mol. Cryst. Liq. Cryst. Sci. Technol. Sect. A Mol. Cryst. Liq. Cryst. 1995, 274, 17–23. [Google Scholar] [CrossRef]
  24. Hoselton, M.A.; Wilson, L.J.; Drago, R.S. Substituent Effects on the Spin Equilibrium Observed with Hexadentate Ligands on Iron(II). J. Am. Chem. Soc. 1975, 97, 1722–1729. [Google Scholar] [CrossRef]
  25. Hauser, A.; Vef, A.; Adler, P. Intersystem Crossing Dynamics in Fe(II) Coordination Compounds. J. Chem. Phys. 1991, 95, 8710–8717. [Google Scholar] [CrossRef]
  26. Schenker, S.; Hauser, A.; Wang, W.; Chan, I.Y. High-Spin→low-Spin Relaxation in [Zn1−xFex(6-Mepy)3−y(Py)Ytren](PF6)2. J. Chem. Phys. 1998, 109, 9870–9878. [Google Scholar] [CrossRef]
  27. Chakraborty, P.; Tissot, A.; Peterhans, L.; Guénée, L.; Besnard, C.; Pattison, P.; Hauser, A. Determination of the Molecular Structure of the Short-Lived Light-Induced High-Spin State in the Spin-Crossover Compound [Fe(6-Mepy)3tren](PF6)2. Phys. Rev. B 2013, 87, 214306. [Google Scholar] [CrossRef]
  28. Tissot, A.; Rivière, E.; Guillot, R.; Toupet, L.; Collet, E.; Boillot, M.-L. Light-Induced Excited Spin State Trapping Effect on [Fe(Mepy)3tren](PF6)2 Solvated Crystals. Dalton Trans. 2014, 43, 1063–1071. [Google Scholar] [CrossRef]
  29. Guionneau, P. Crystallography and Spin-Crossover. A View of Breathing Materials. Dalton Trans. 2014, 43, 382–393. [Google Scholar] [CrossRef]
  30. Atkins, P.; Overton, T.; Rourke, J.; Weller, M.; Armstrong, F.; Hagerman, M. Inorganic Chemistry; Oxford University Press: Oxford, UK, 2009. [Google Scholar]
Figure 1. Schematic view of the HS-to-LS relaxation. In the initial moments, the HS centres are located in a 100% HS lattice and the internal pressure is low. Once the relaxation takes place, the density of the lattice increases as well as the pressure. In other words, at the beginning, the activation energy is much higher, and it starts to decrease as the relaxation proceeds, increasing the speed of the process [23].
Crystals 14 00210 g001
Figure 2. Zn1−xFex(6-mepy)3tren(PF6)2·CH3CN structure. Legend: C (grey), H (white), F (green), Fe (dark blue), N (blue), and P (pink). Empirical formula C29H36F12FeN8P2.
Crystals 14 00210 g002
Figure 3. (a) Temperature evolution of the HS fraction (heating/cooling at 5 K/min) of a single crystal of Zn1−xFex(6-mepy)3tren(PF6)2·CH3CN, x = 0.5% and temperature-dependent absorption spectra under polarised light for (b) n0||P and (c) ne||P.
Crystals 14 00210 g003
Figure 4. (a) Absorption spectra of a single crystal of Zn1−xFex(6-mepy)3tren(PF6)2·CH3CN, x = 0.5% (thickness = 390 µm) and (b) corresponding γHS evolution with time during the irradiation at 10 K with a W-halogen lamp at 8.3 A.
Crystals 14 00210 g004
Figure 5. (a) Absorption spectra evolution during LIESST at 10 K and subsequent HS→LS relaxation at 30 K. Inset: Time γHS evolution during the HS→LS relaxation at 30 K after LIESST (b) Time γHS evolution during the HS→LS relaxation between 10 and 60 K after LIESST. (c) Arrhenius plot of kHL vs. 1/T from T = 10 K to T = 175 K and comparison with the data obtained for the unsolvated compound.
Crystals 14 00210 g005
Figure 6. Reverse-LIESST on a mixed-crystal Zn1−xFex(6-mepy)3tren(PF6)2·CH3CN, x = 0.5% (390 µm) at 10 K after irradiation during 5 min at 532 nm and 830 nm.
Crystals 14 00210 g006
Figure 7. Energy level diagram of the excited and ground HS and LS states involved in the LIESST and reverse-LIESST effects. The red, green, and purple arrows represent the excitation of the sample in the IR (830 nm), visible (532 nm), and UV region of the spectra (the latter was not performed in this experiment). The t2g and eg orbitals are, respectively, the lower energy triply degenerate set and higher energy doubly degenerate set in which the d orbitals of Fe are split in the presence of an octahedral crystal field [30].
Crystals 14 00210 g007
Disclaimer/Publisher’s Note: The statements, opinions and data contained in all publications are solely those of the individual author(s) and contributor(s) and not of MDPI and/or the editor(s). MDPI and/or the editor(s) disclaim responsibility for any injury to people or property resulting from any ideas, methods, instructions or products referred to in the content.

