
Pre-Polymer Chain Length: Influence on Permanent Memory Effect of PDLC Devices


Abstract
:1. Introduction
2. Materials and Methods
2.1. Preparation of PDLC
2.2. Electro-Optical Characterization
3. Results
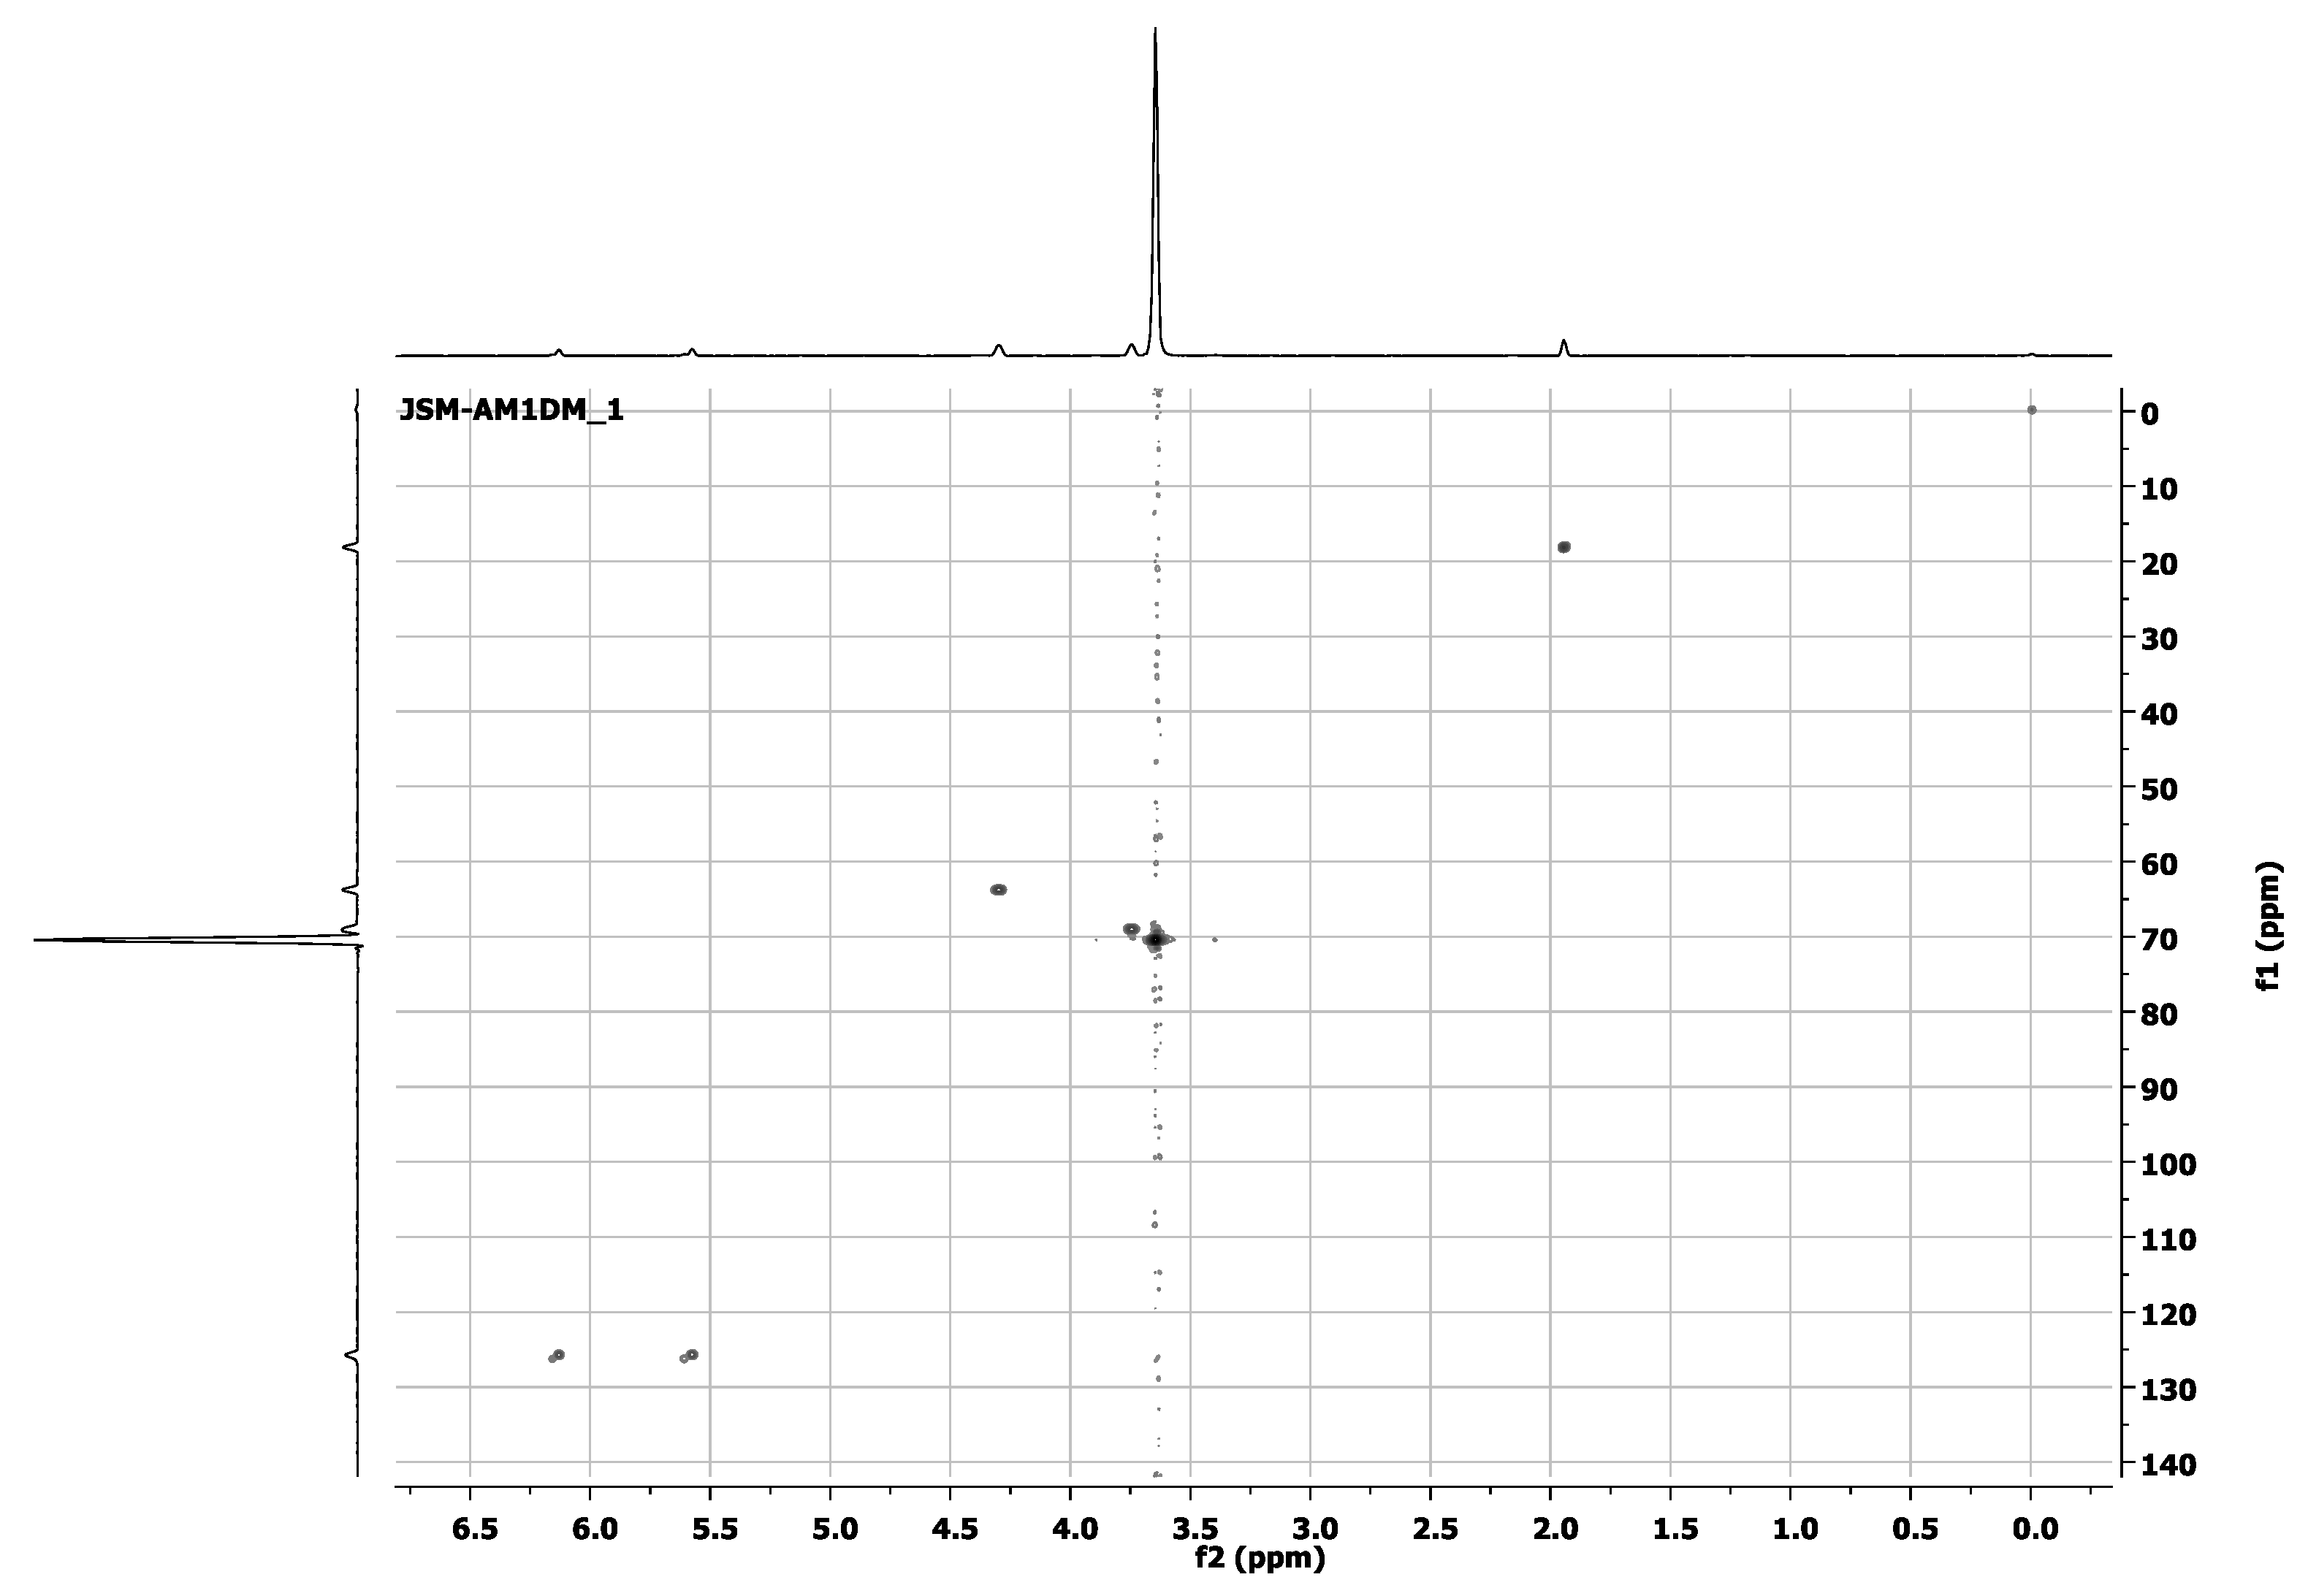
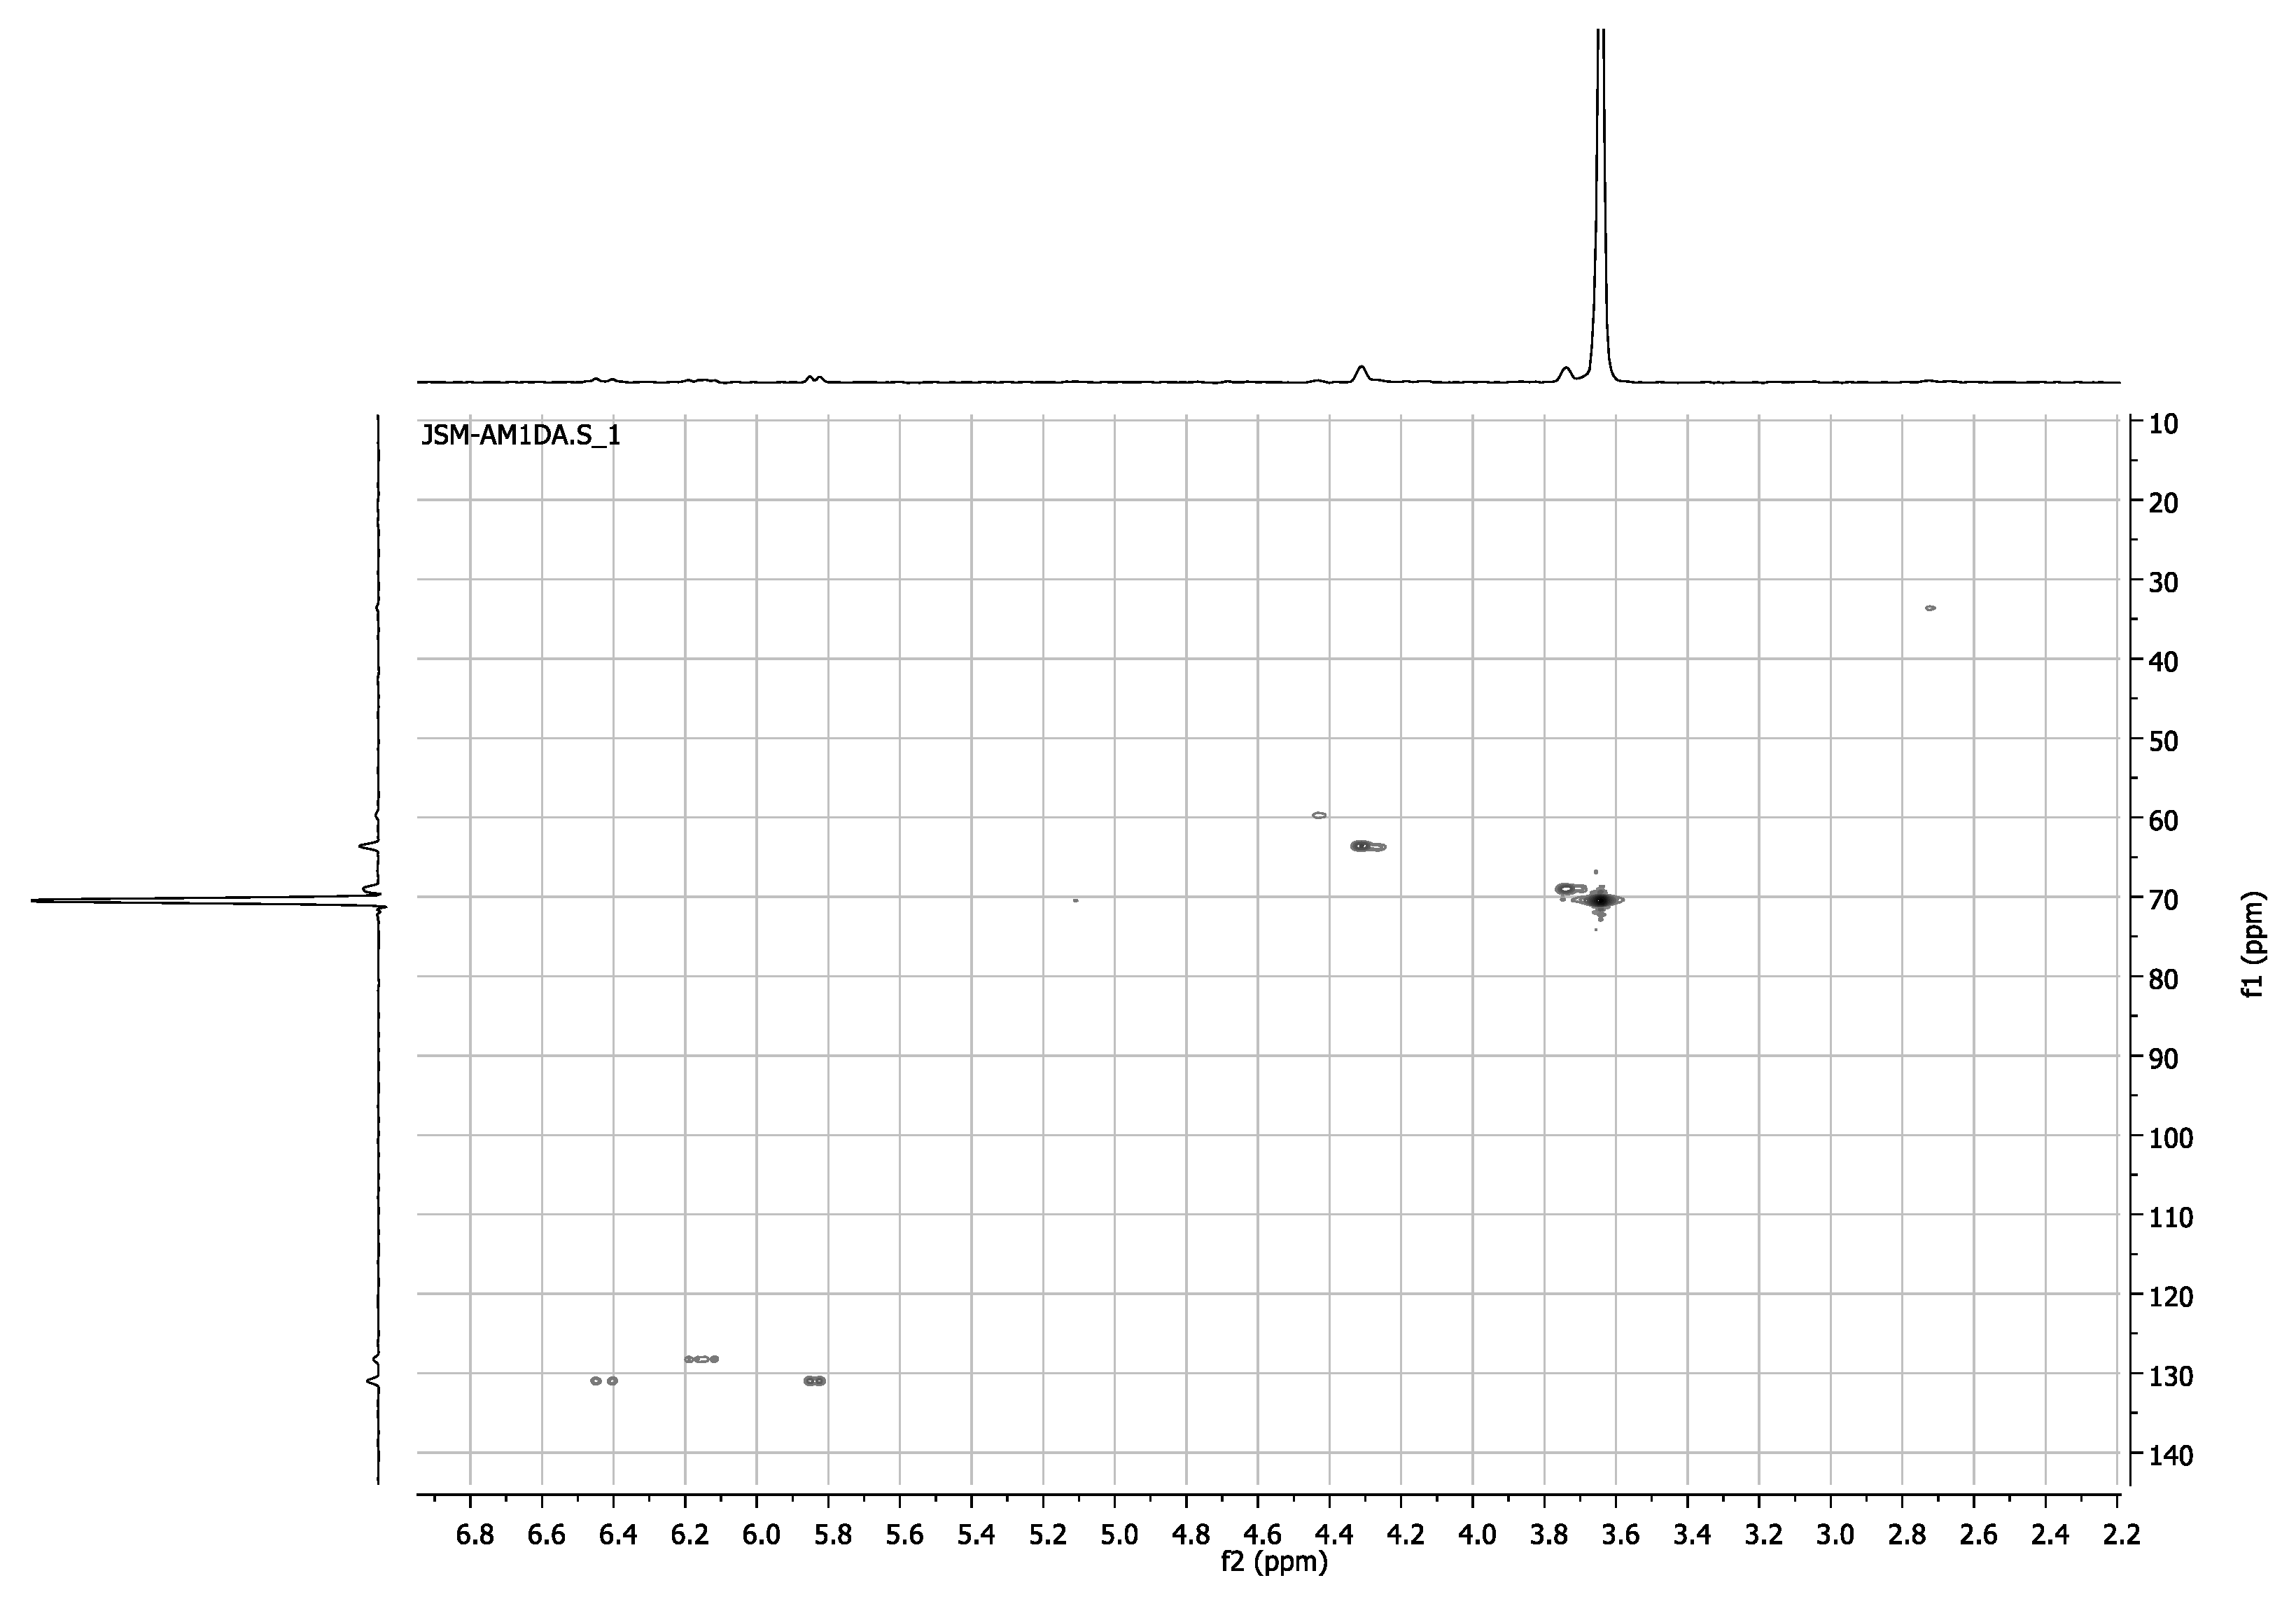
3.1. Synthesis, NMR, and MALDI-TOF Characterization of Poly(ethylene glycol) End-Functionalized
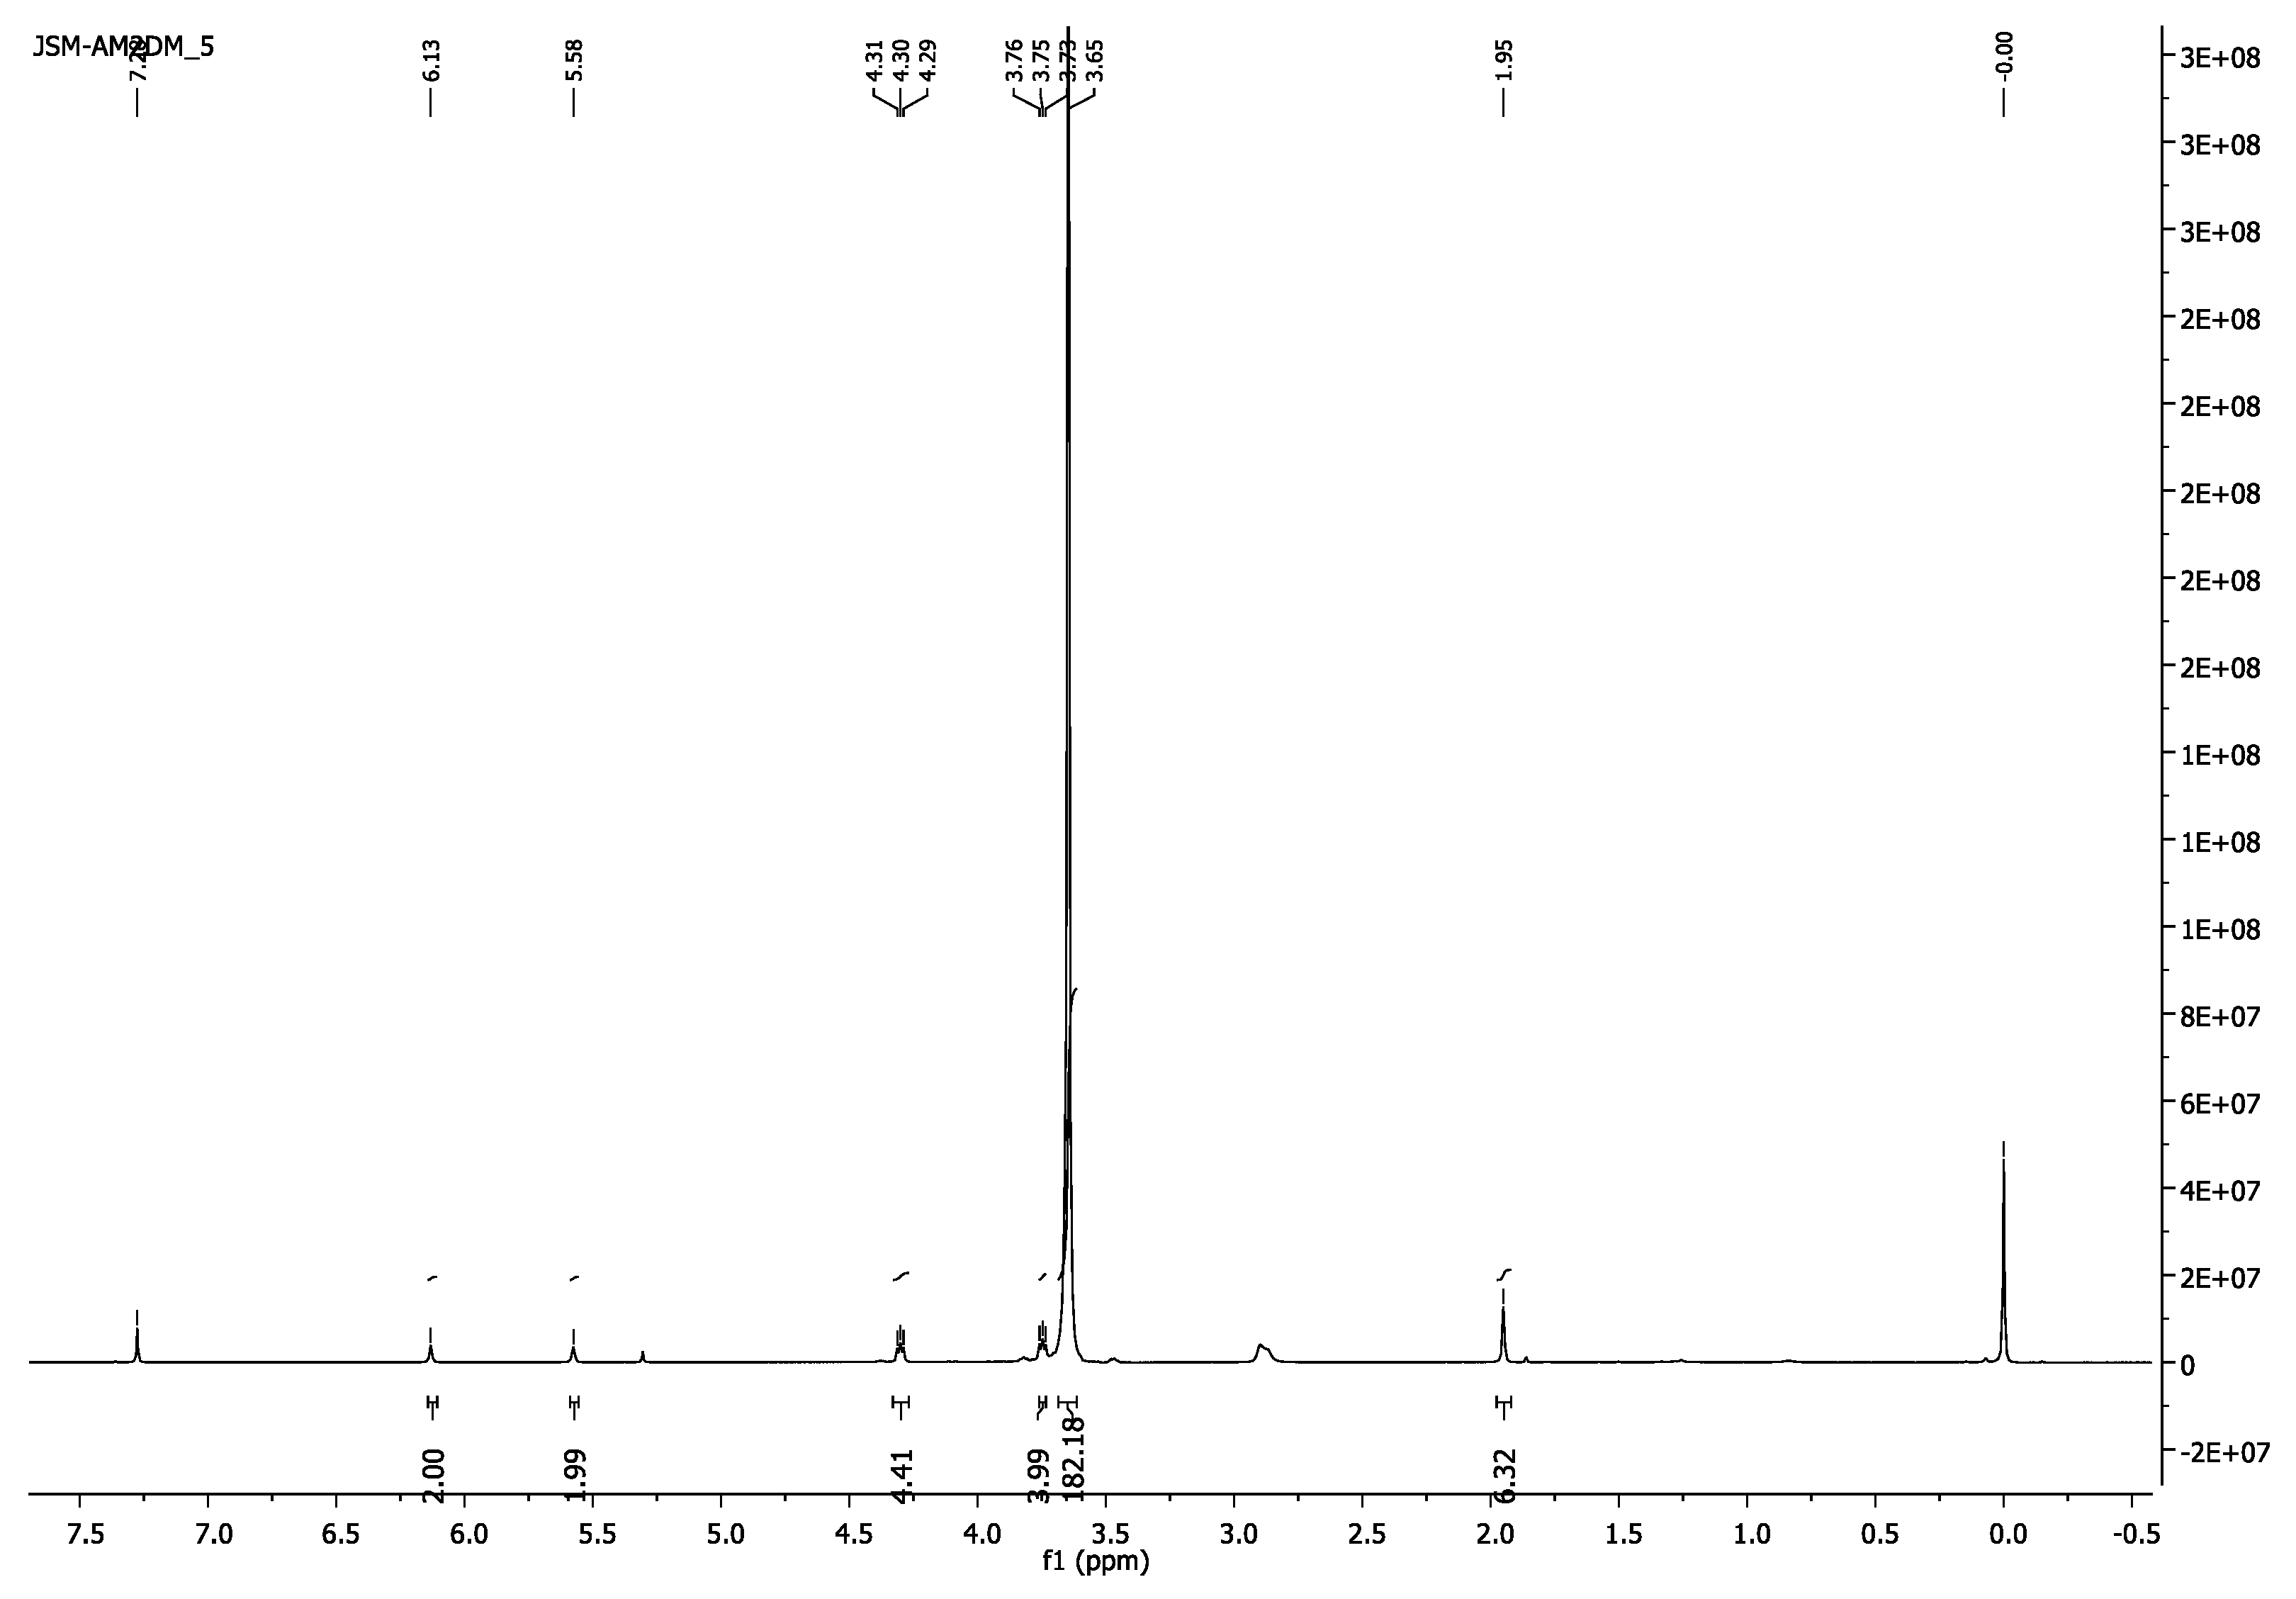
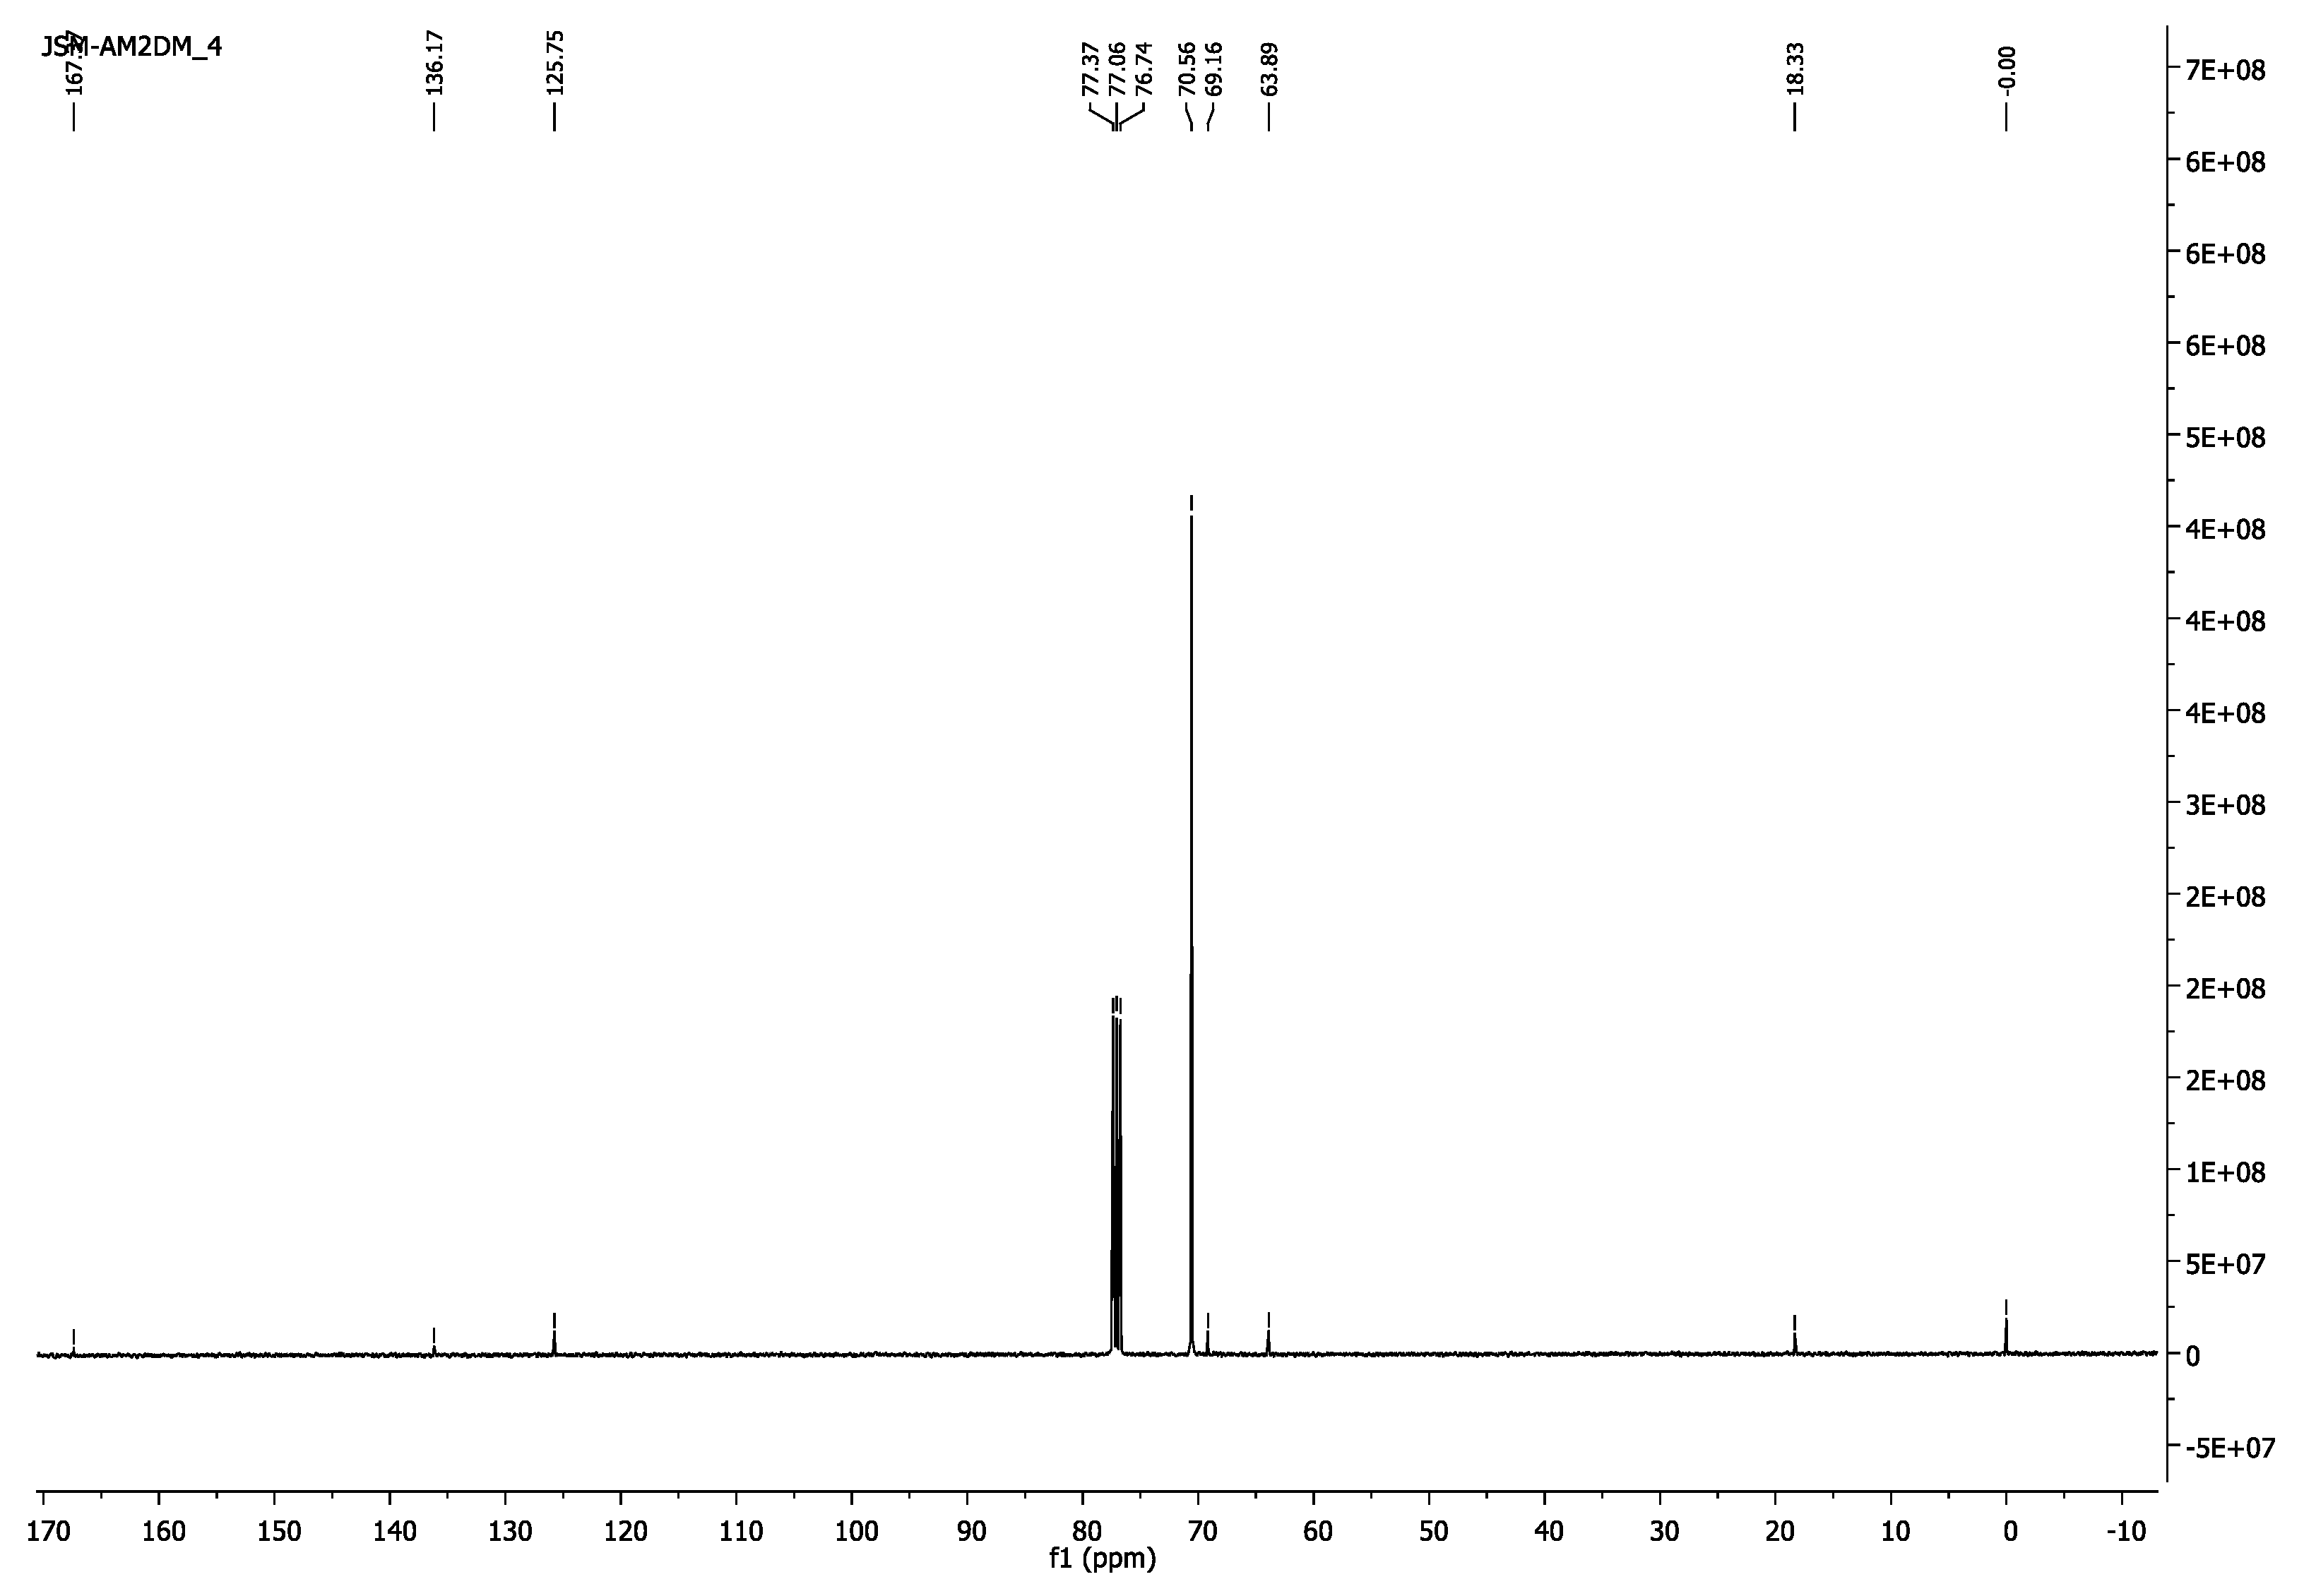
3.1.1. Poly(ethylene glycol) Dimethacrylate, PEG2000DM
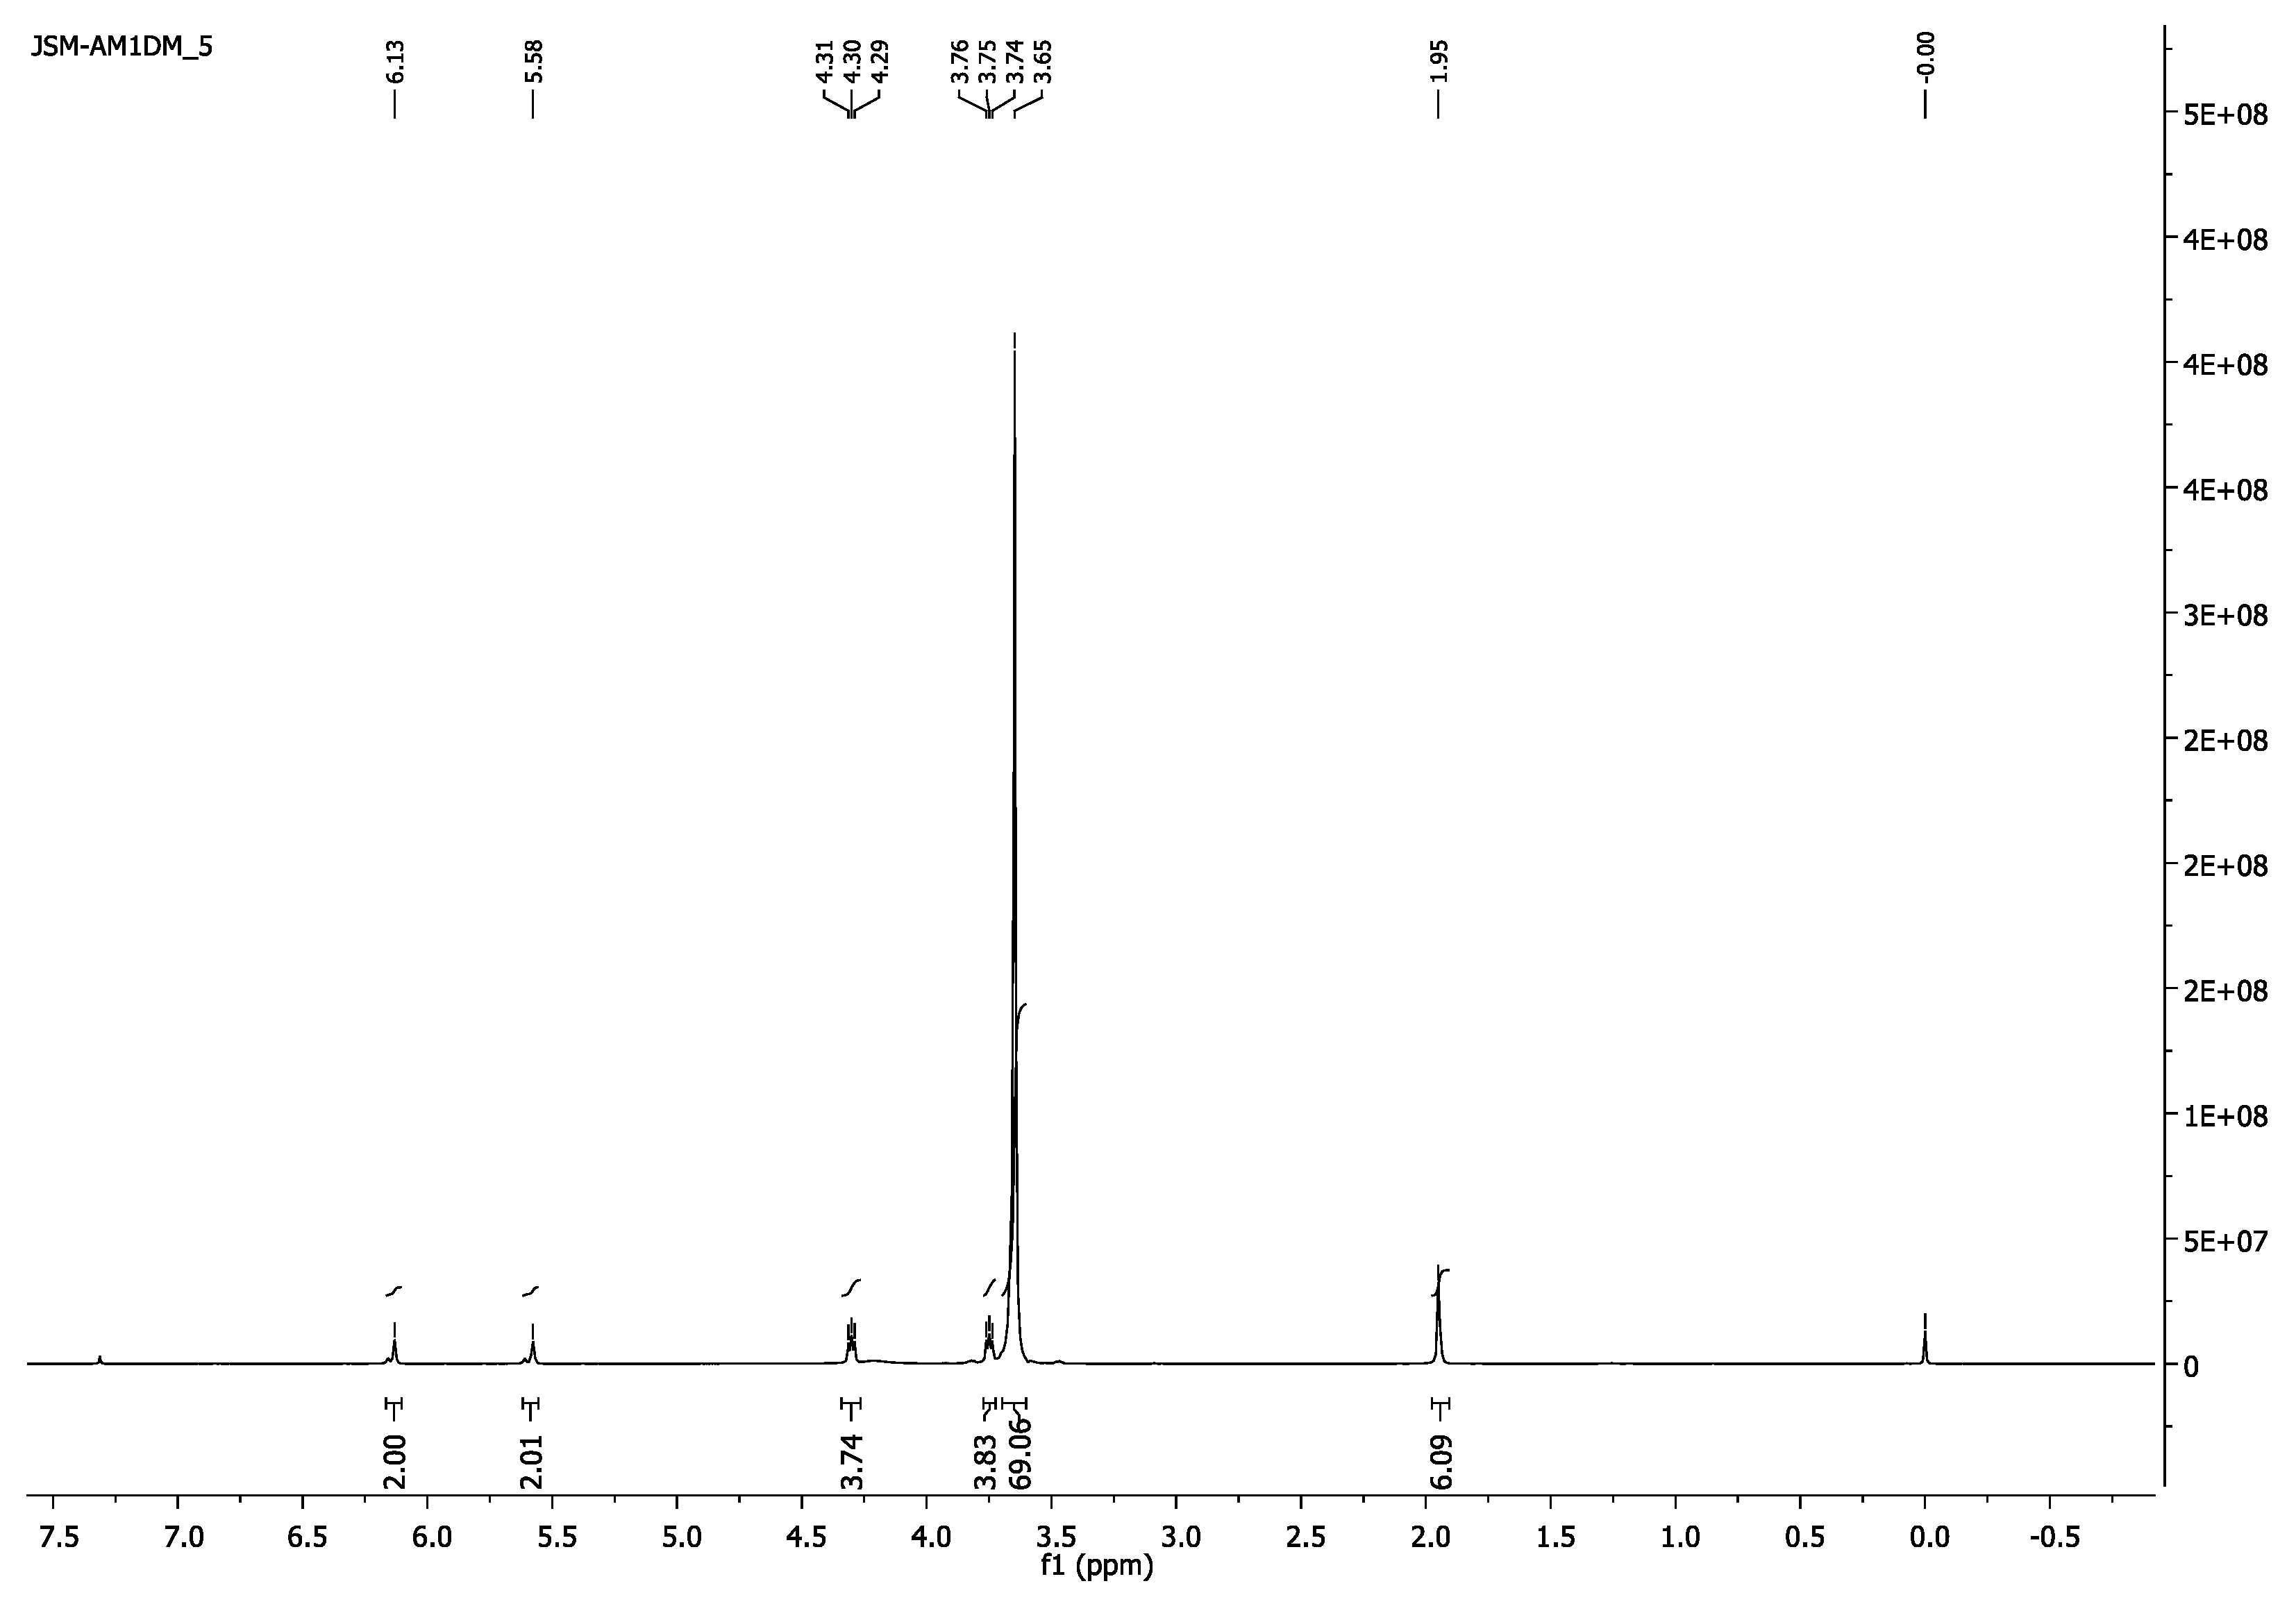
- 1H-NMR (400 MHz, CDCl3) δ 6.13 (s, 2H, =CH2), 5.58 (s, 2H, =CH2), 4.32–4.28 (m, 4H, CH2O-(C=O)), 3.76–3.72 (m, 4H, CH2CH2O-(C=O)), 3.65 (s, 182H, CH2CH2O), 1.95 (s, 6H, CH3).
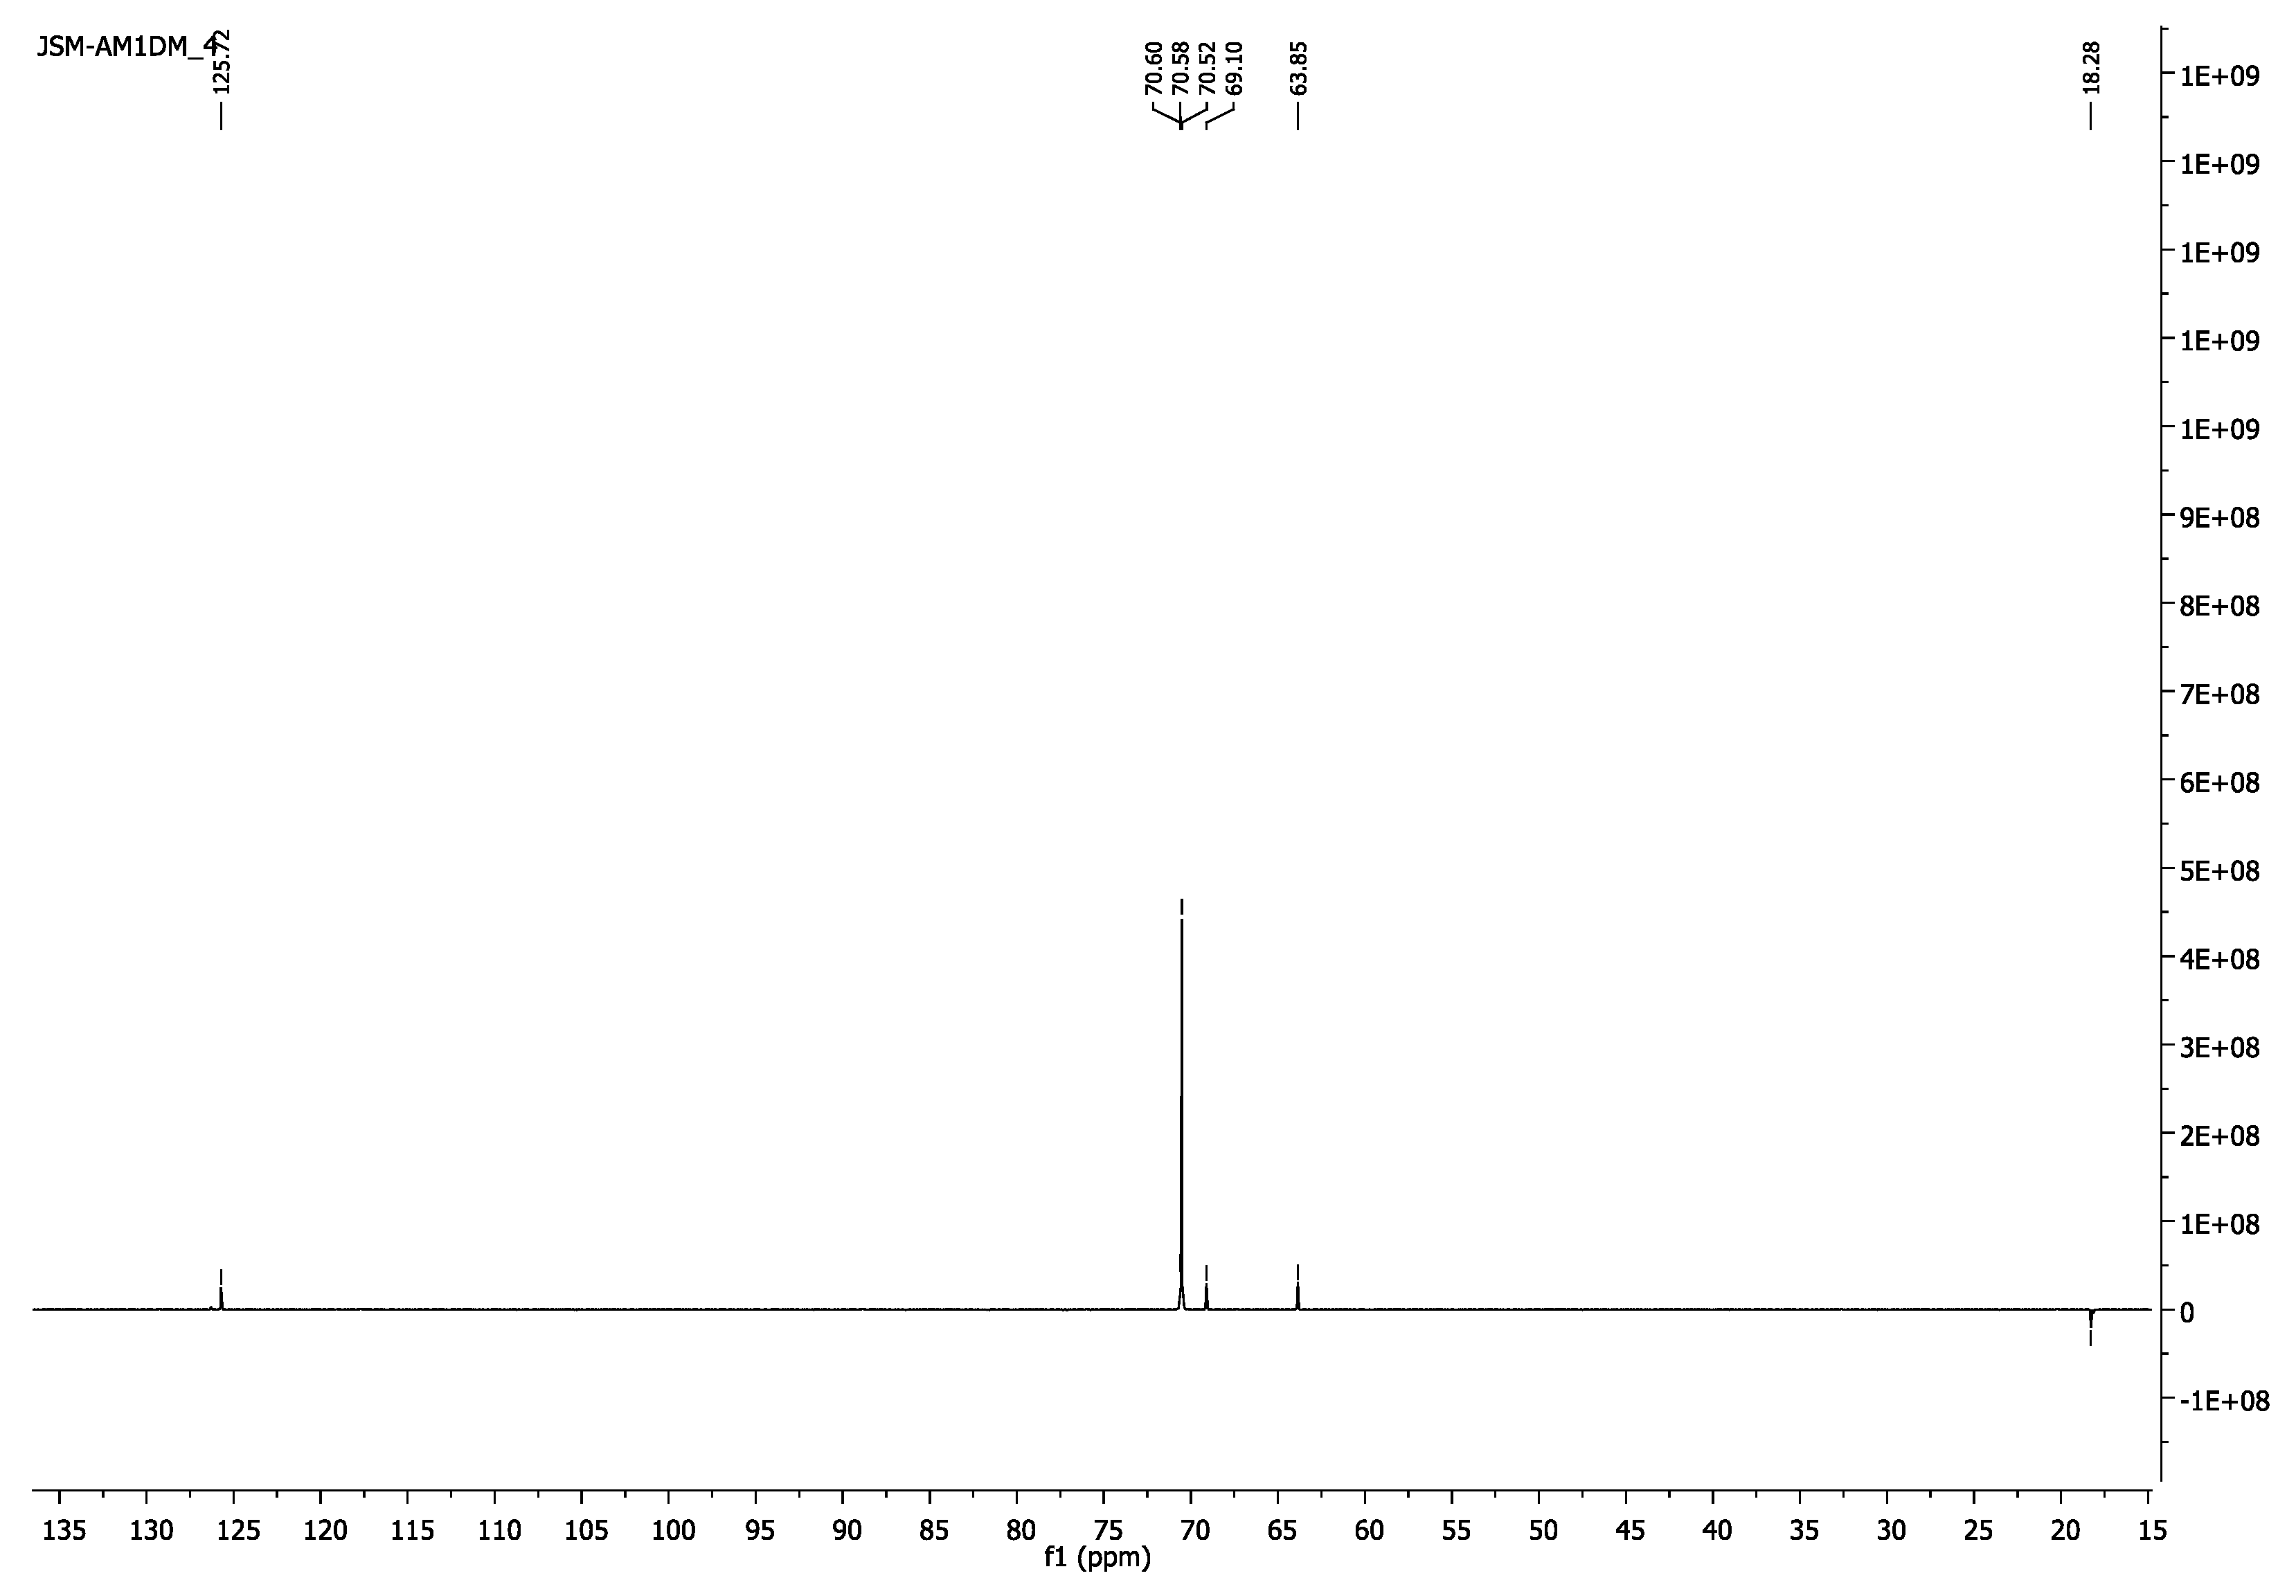
- 13C-NMR (100 MHz, CDCl3) δ 18.13 (CH3), 63.99 (CH2O-(C=O)), 69.16 (CH2CH2O-(C=O)), 70.56 (CH2CH2O), 125.75(=CH2), 136.17(H3C-C=), 167.33 (C=O).
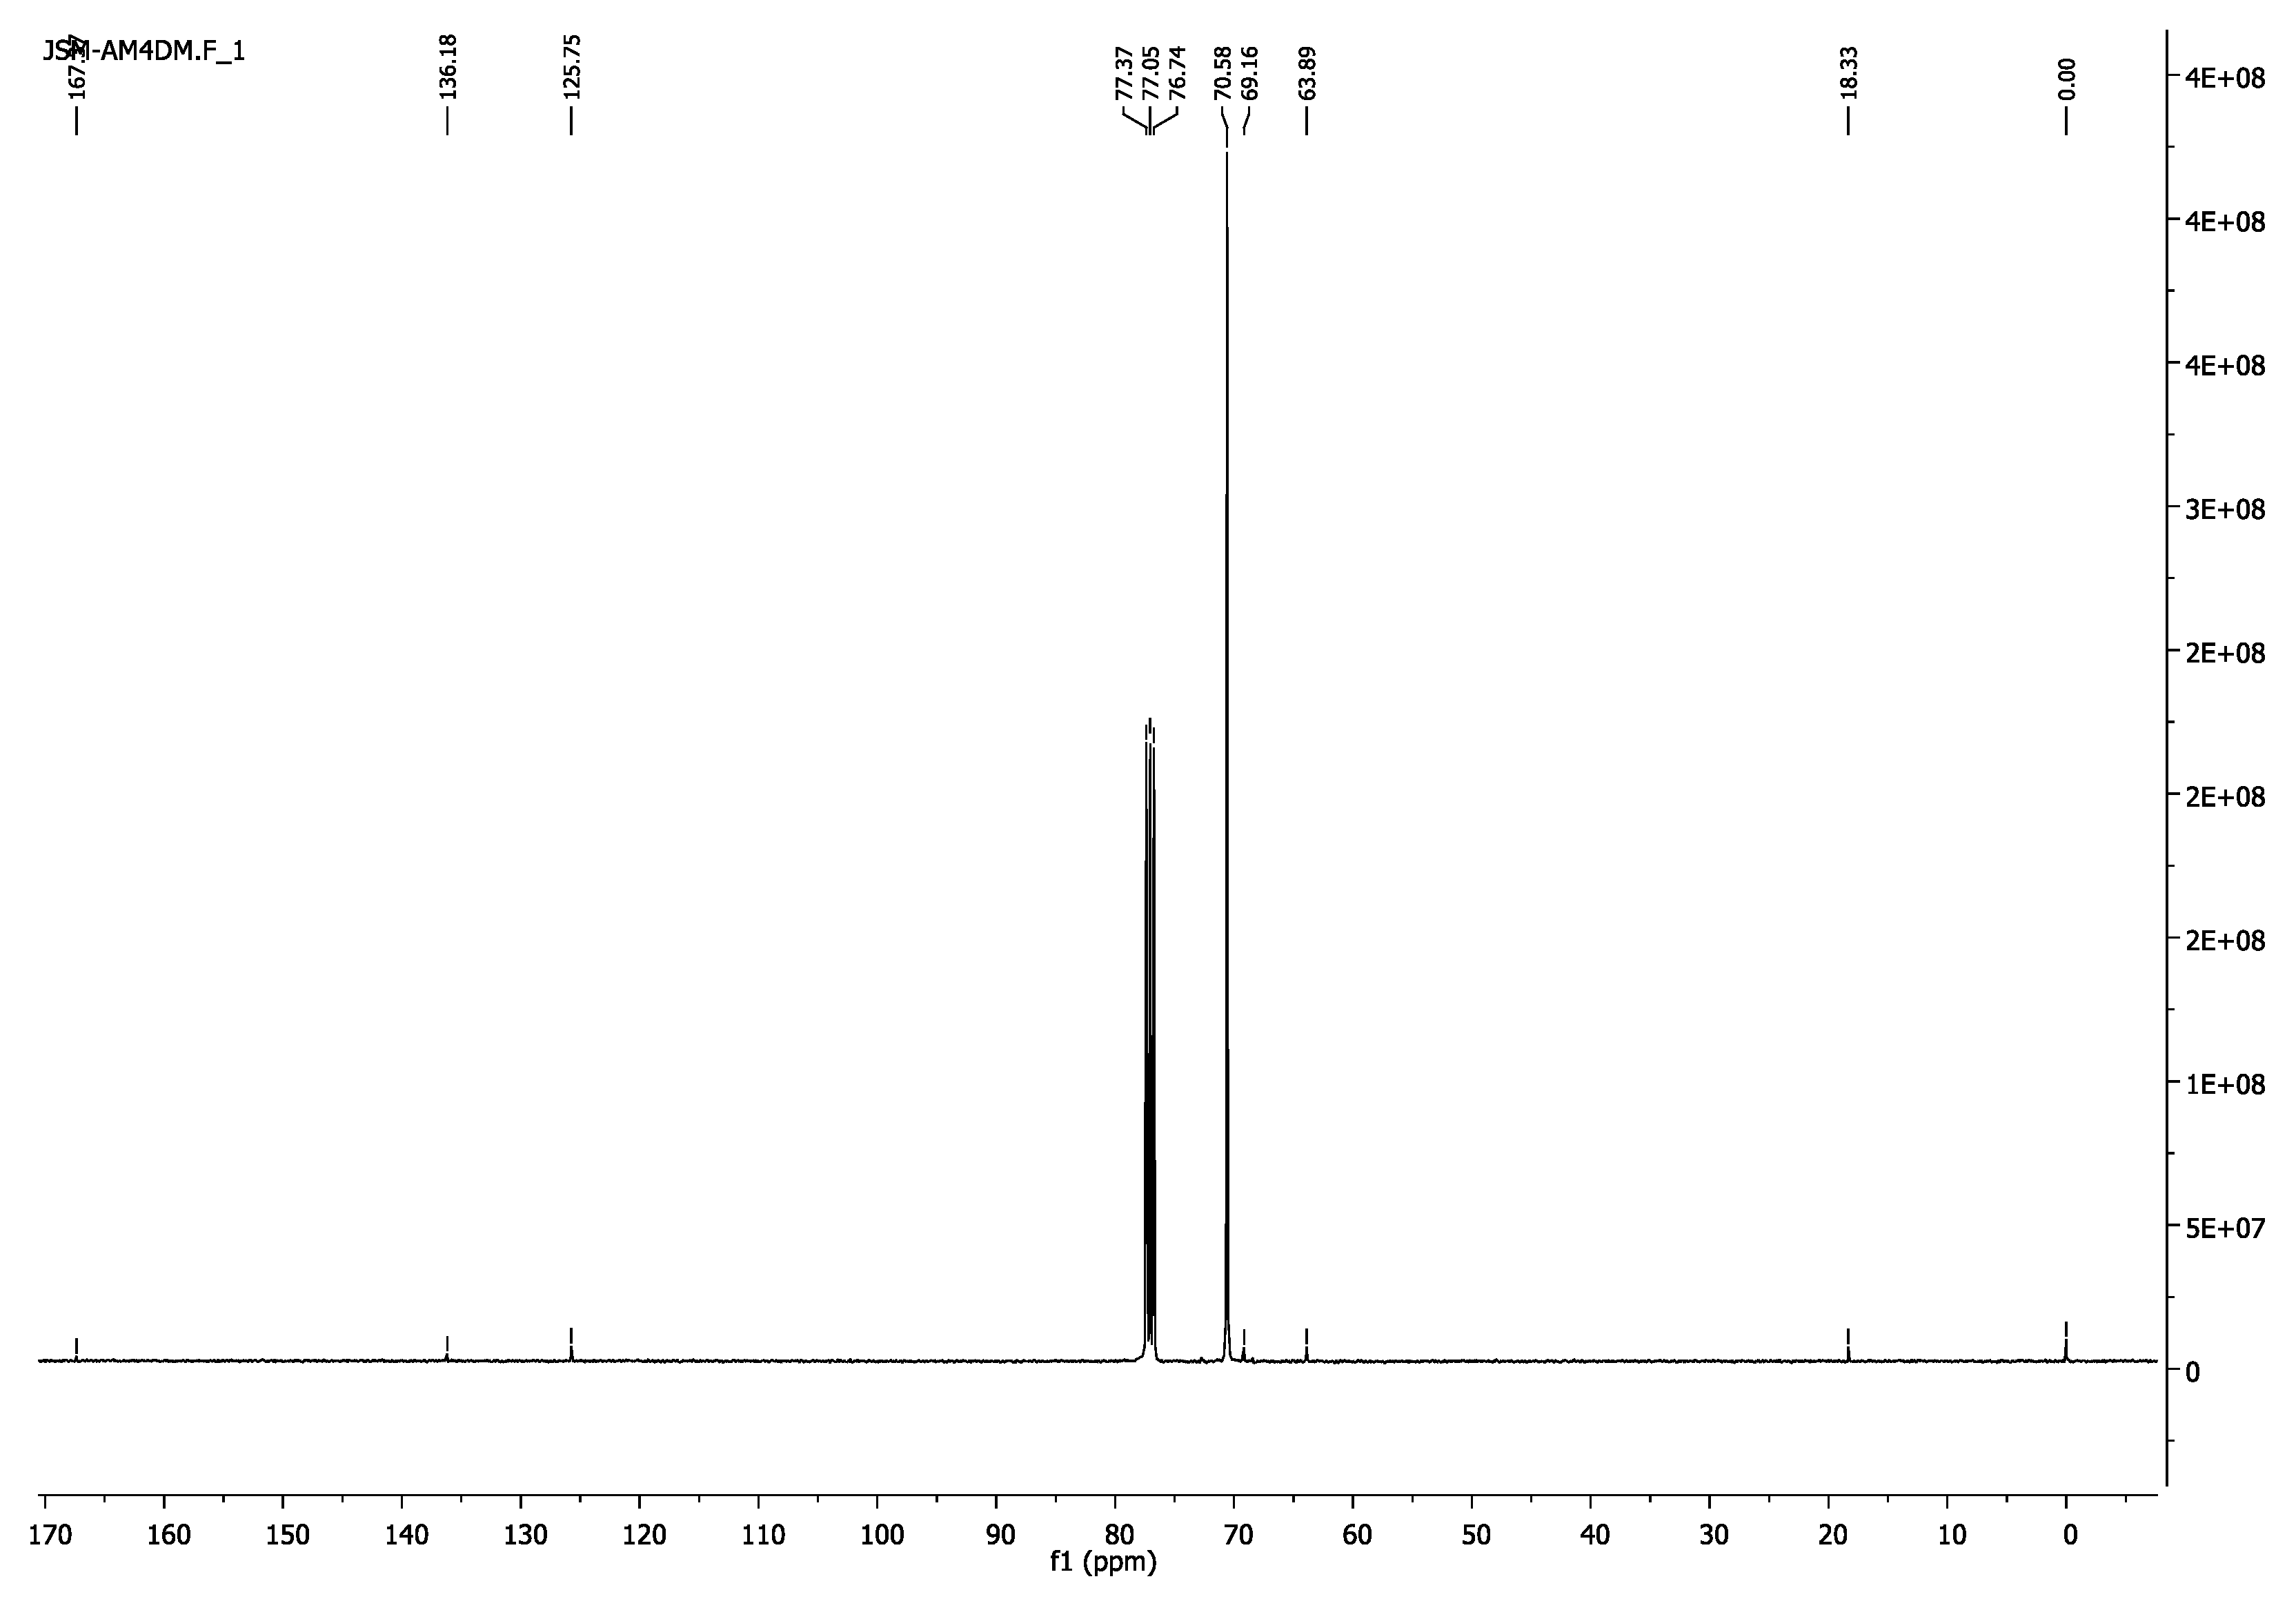
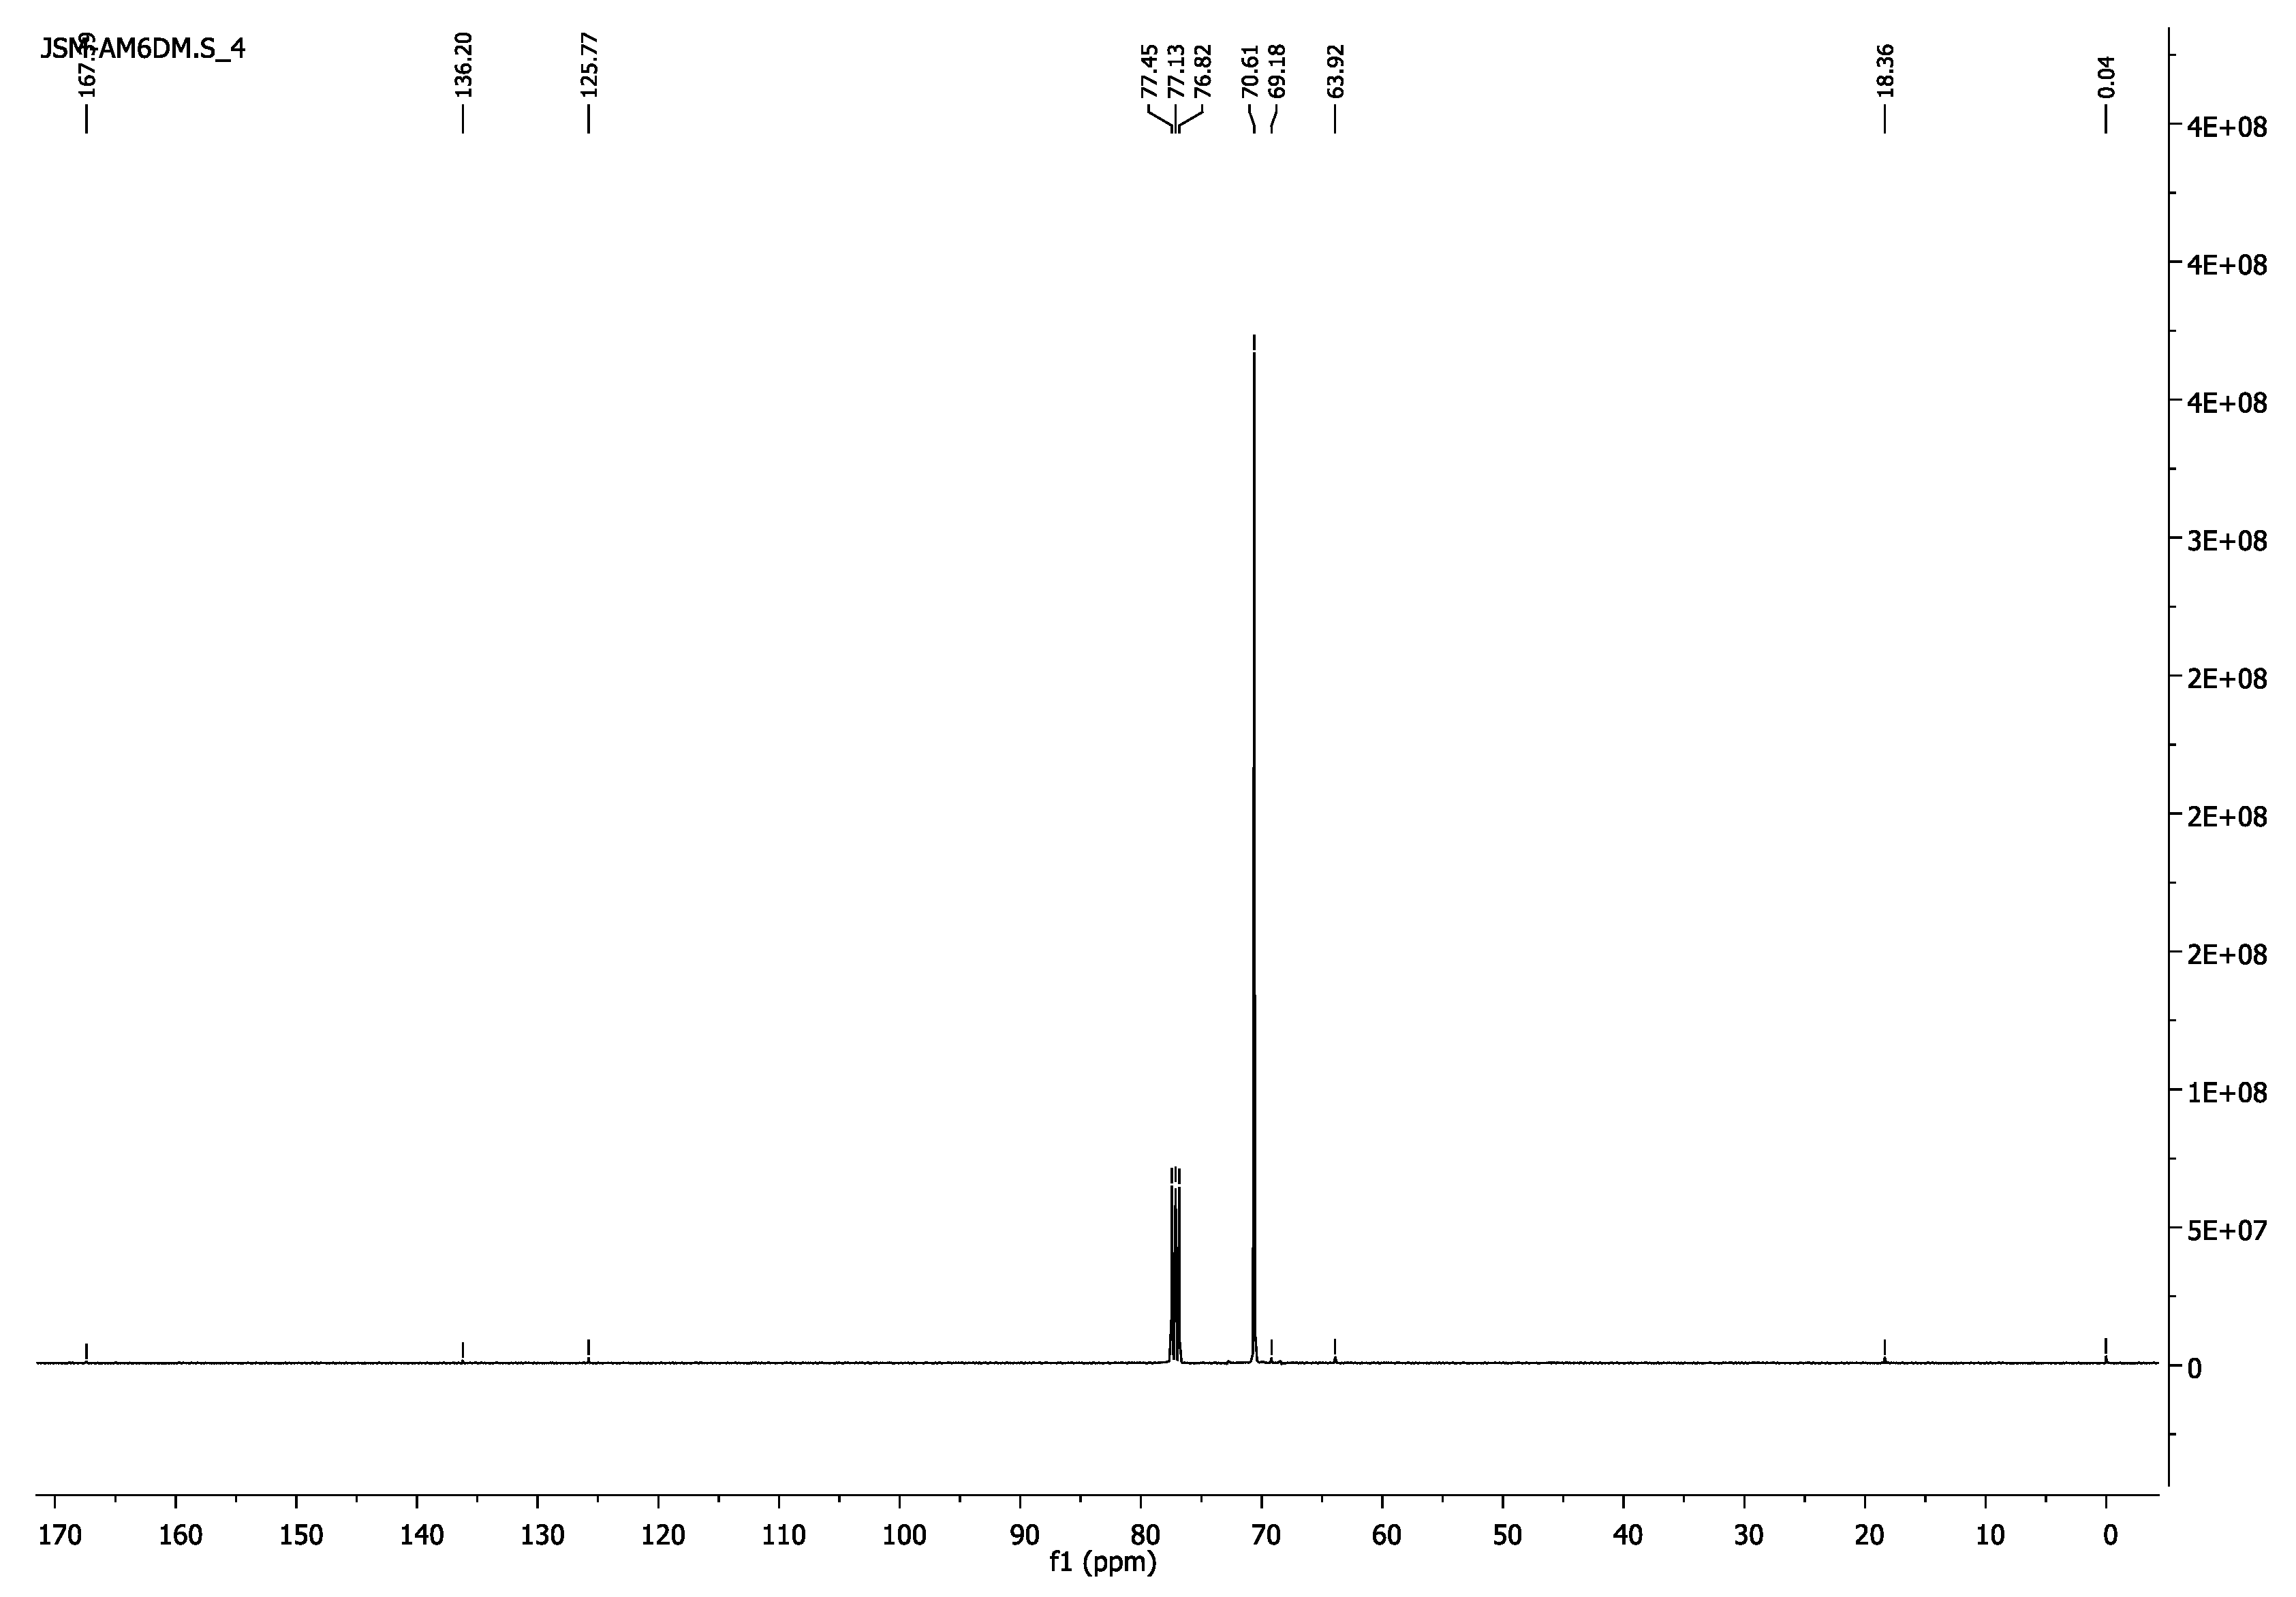
3.1.2. Poly(ethylene glycol) Dimethacrylate, PEG4000DM and PEG6000DM
- 1H-NMR (400 MHz, CDCl3) δ 6.13 (s, 2H, =CH2), 5.57 (s, 2H, =CH2), 4.31–4.28 (m, 4H, CH2O-(C=O))3.76–3.73 (m, 4H, CH2CH2O-(C=O)),3.65 (s, 69H, CH2CH2O),1.95 (s, 6H, CH3 ).
- 13C-NMR (100 MHz,CDCl3) δ 18.33 (CH3), 63.879 (CH2O-(C=O)), 69.16 (CH2CH2O-(C=O)), 70.58 (CH2CH2O), 125.75(=CH2), 136.18(H3C-C=), 167.37 (C=O).
- 1H-NMR (400 MHz, CDCl3) δ 6.12 (s, 2H, =CH2), 5.57 (s, 2H, =CH2), 4.31–4.28 (m, 4H, CH2O-(C=O)), 3.83–3.79 (m, 4H, CH2CH2O-(C=O)), 3.64 (s, 525H, CH2CH2O), 1.94 (s, 6H, CH3).
- 13C-NMR (100 MHz, CDCl3) δ 18.36 (CH3), 63.92 (CH2O-(C=O)), 69.18 (CH2CH2O-(C=O)), 70.61 (CH2CH2O), 125.77(=CH2), 136.20(H3C-C=), 167.39 (C=O).
3.1.3. Poly(ethylene glycol) Dimethacrylate, PEG1000DM
- 1H-NMR (400 MHz, CDCl3) δ 6.13 (s, 2H, =CH2), 5.58 (s, 2H, =CH2), 4.32–4.28 (m, 4H, CH2O-(C=O)), 3.77–3.72 (m, 4H, CH2CH2O-(C=O)), 3.65 (s, 69H, CH2CH2O), 1.95 (s, 6H, CH3).
- 13C-NMR (100 MHz, CDCl3) δ 18.31 (CH3), 63.87 (CH2O-(C=O)), 69.12 (CH2CH2O-(C=O)), 70.54 (CH2CH2O), 125.74(=CH2), 136.14(H3C-C=), 167.34 (C=O).
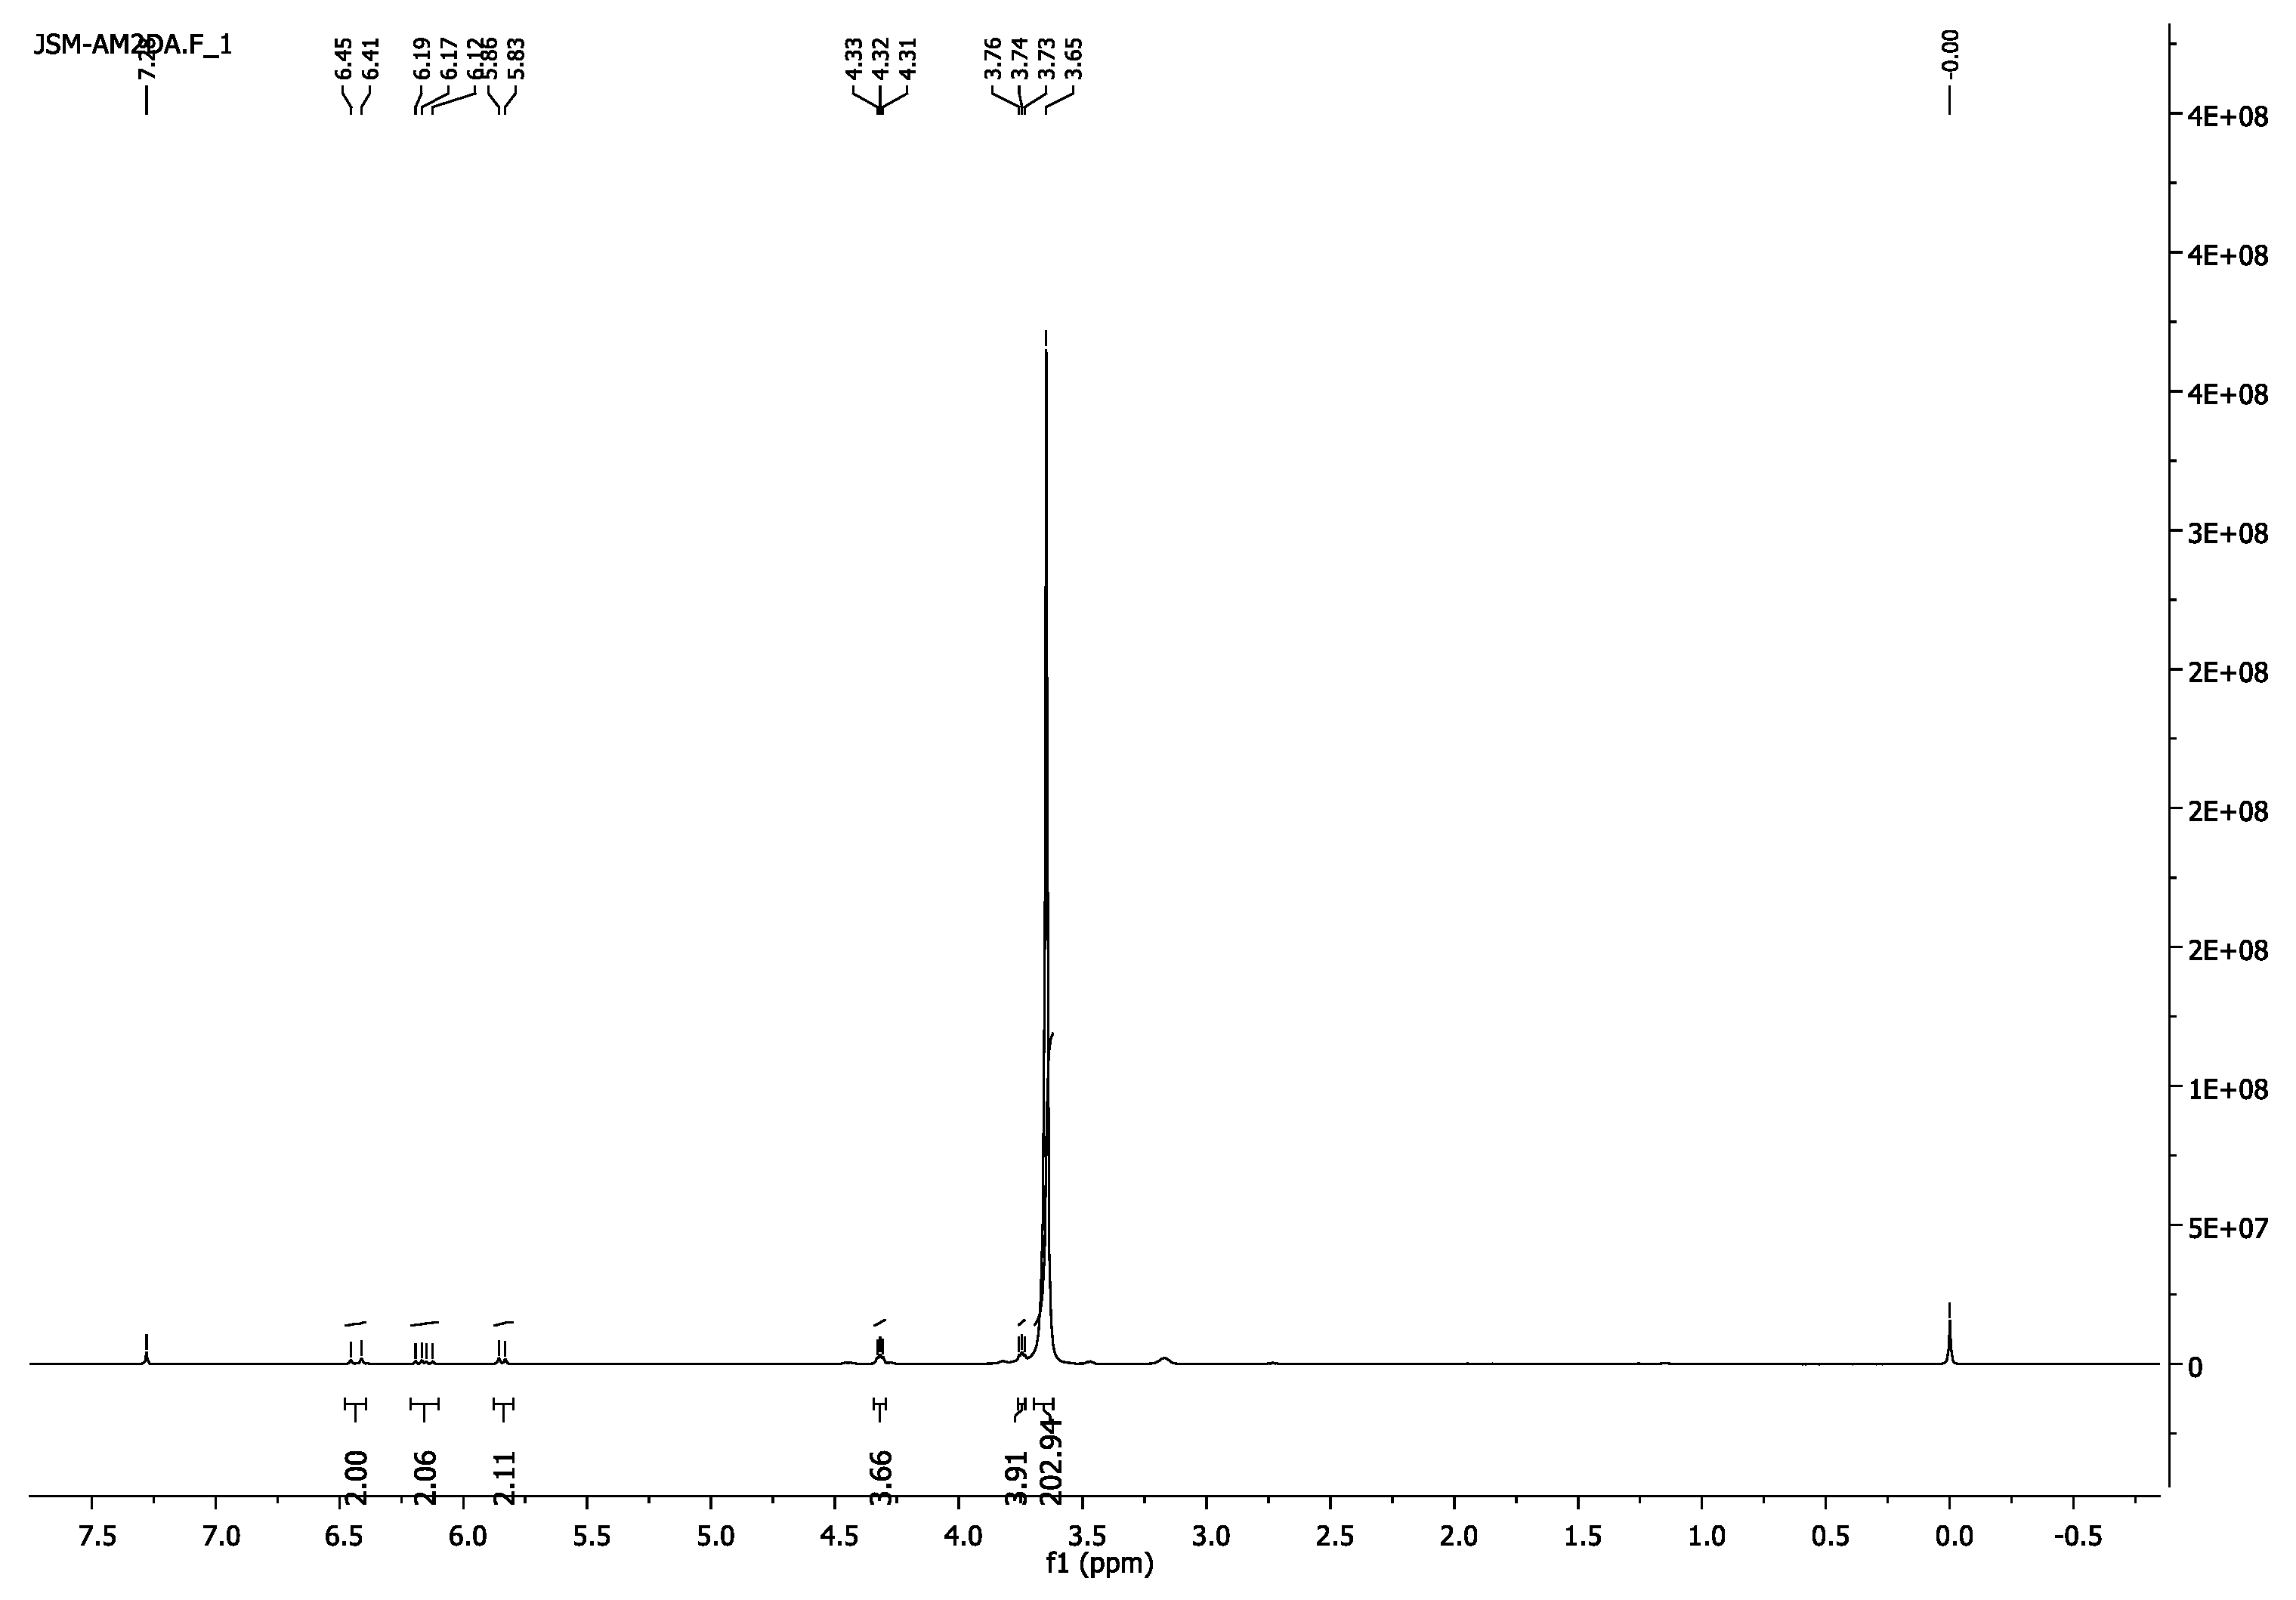
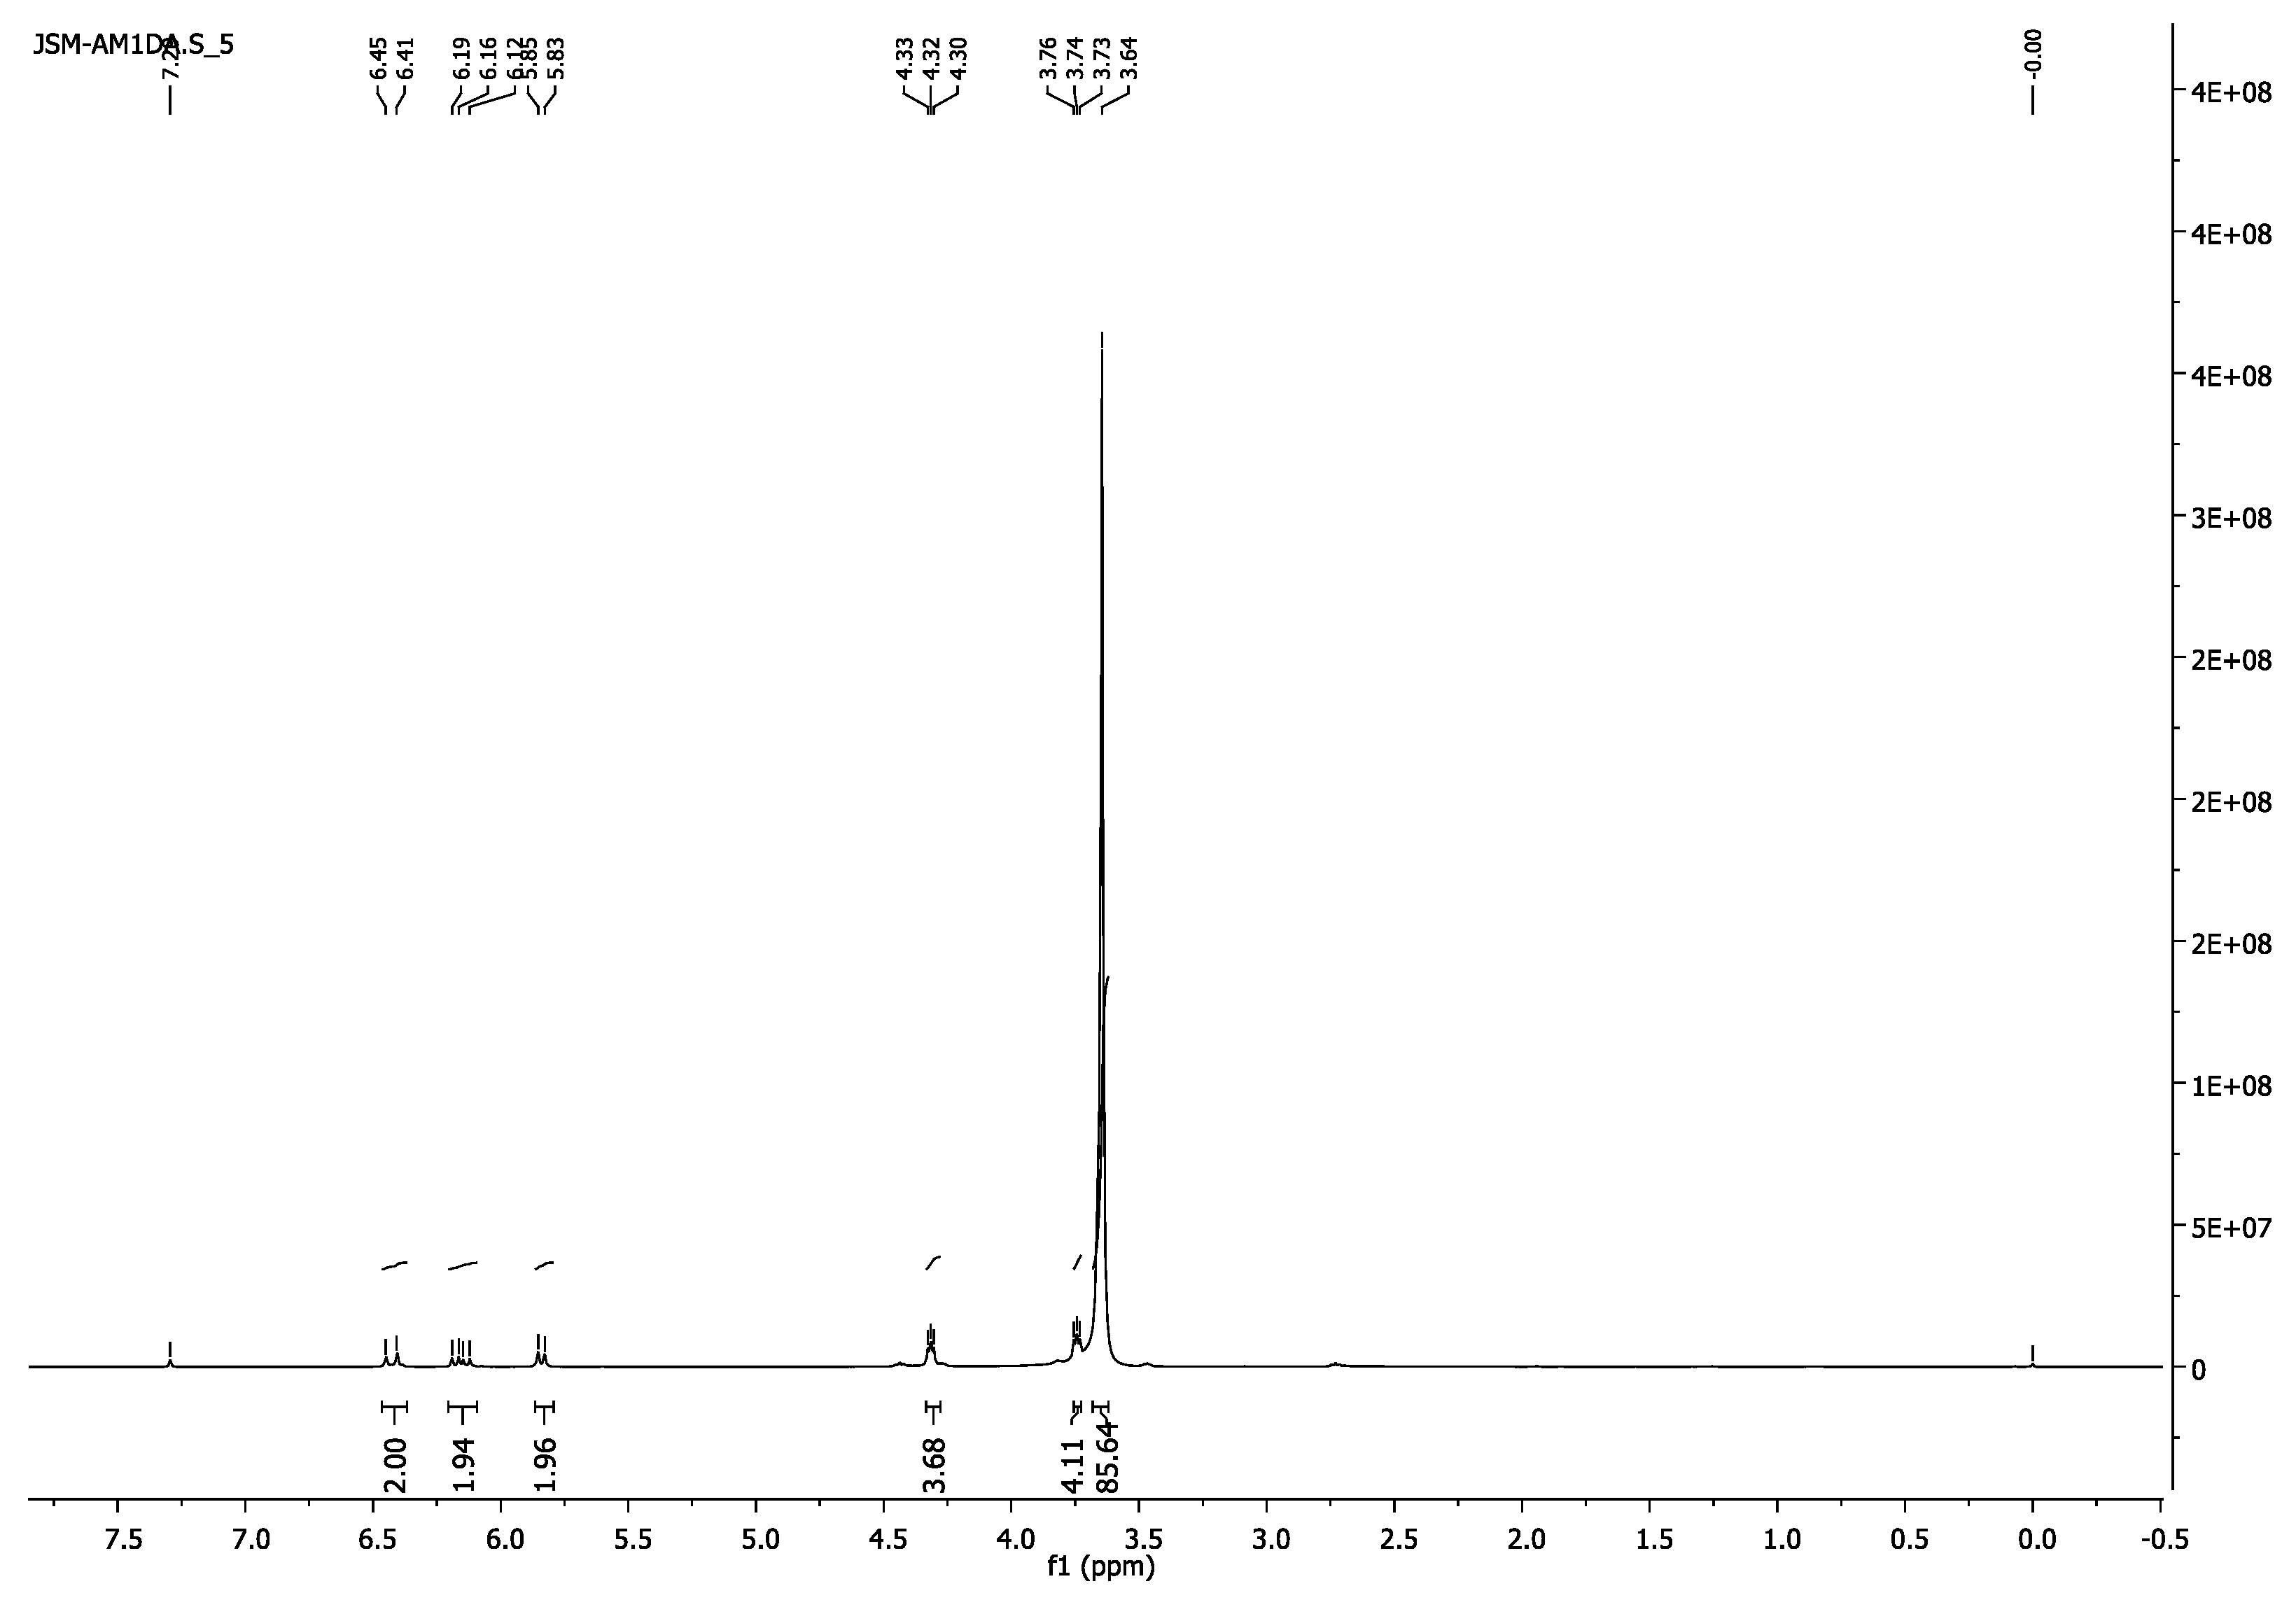
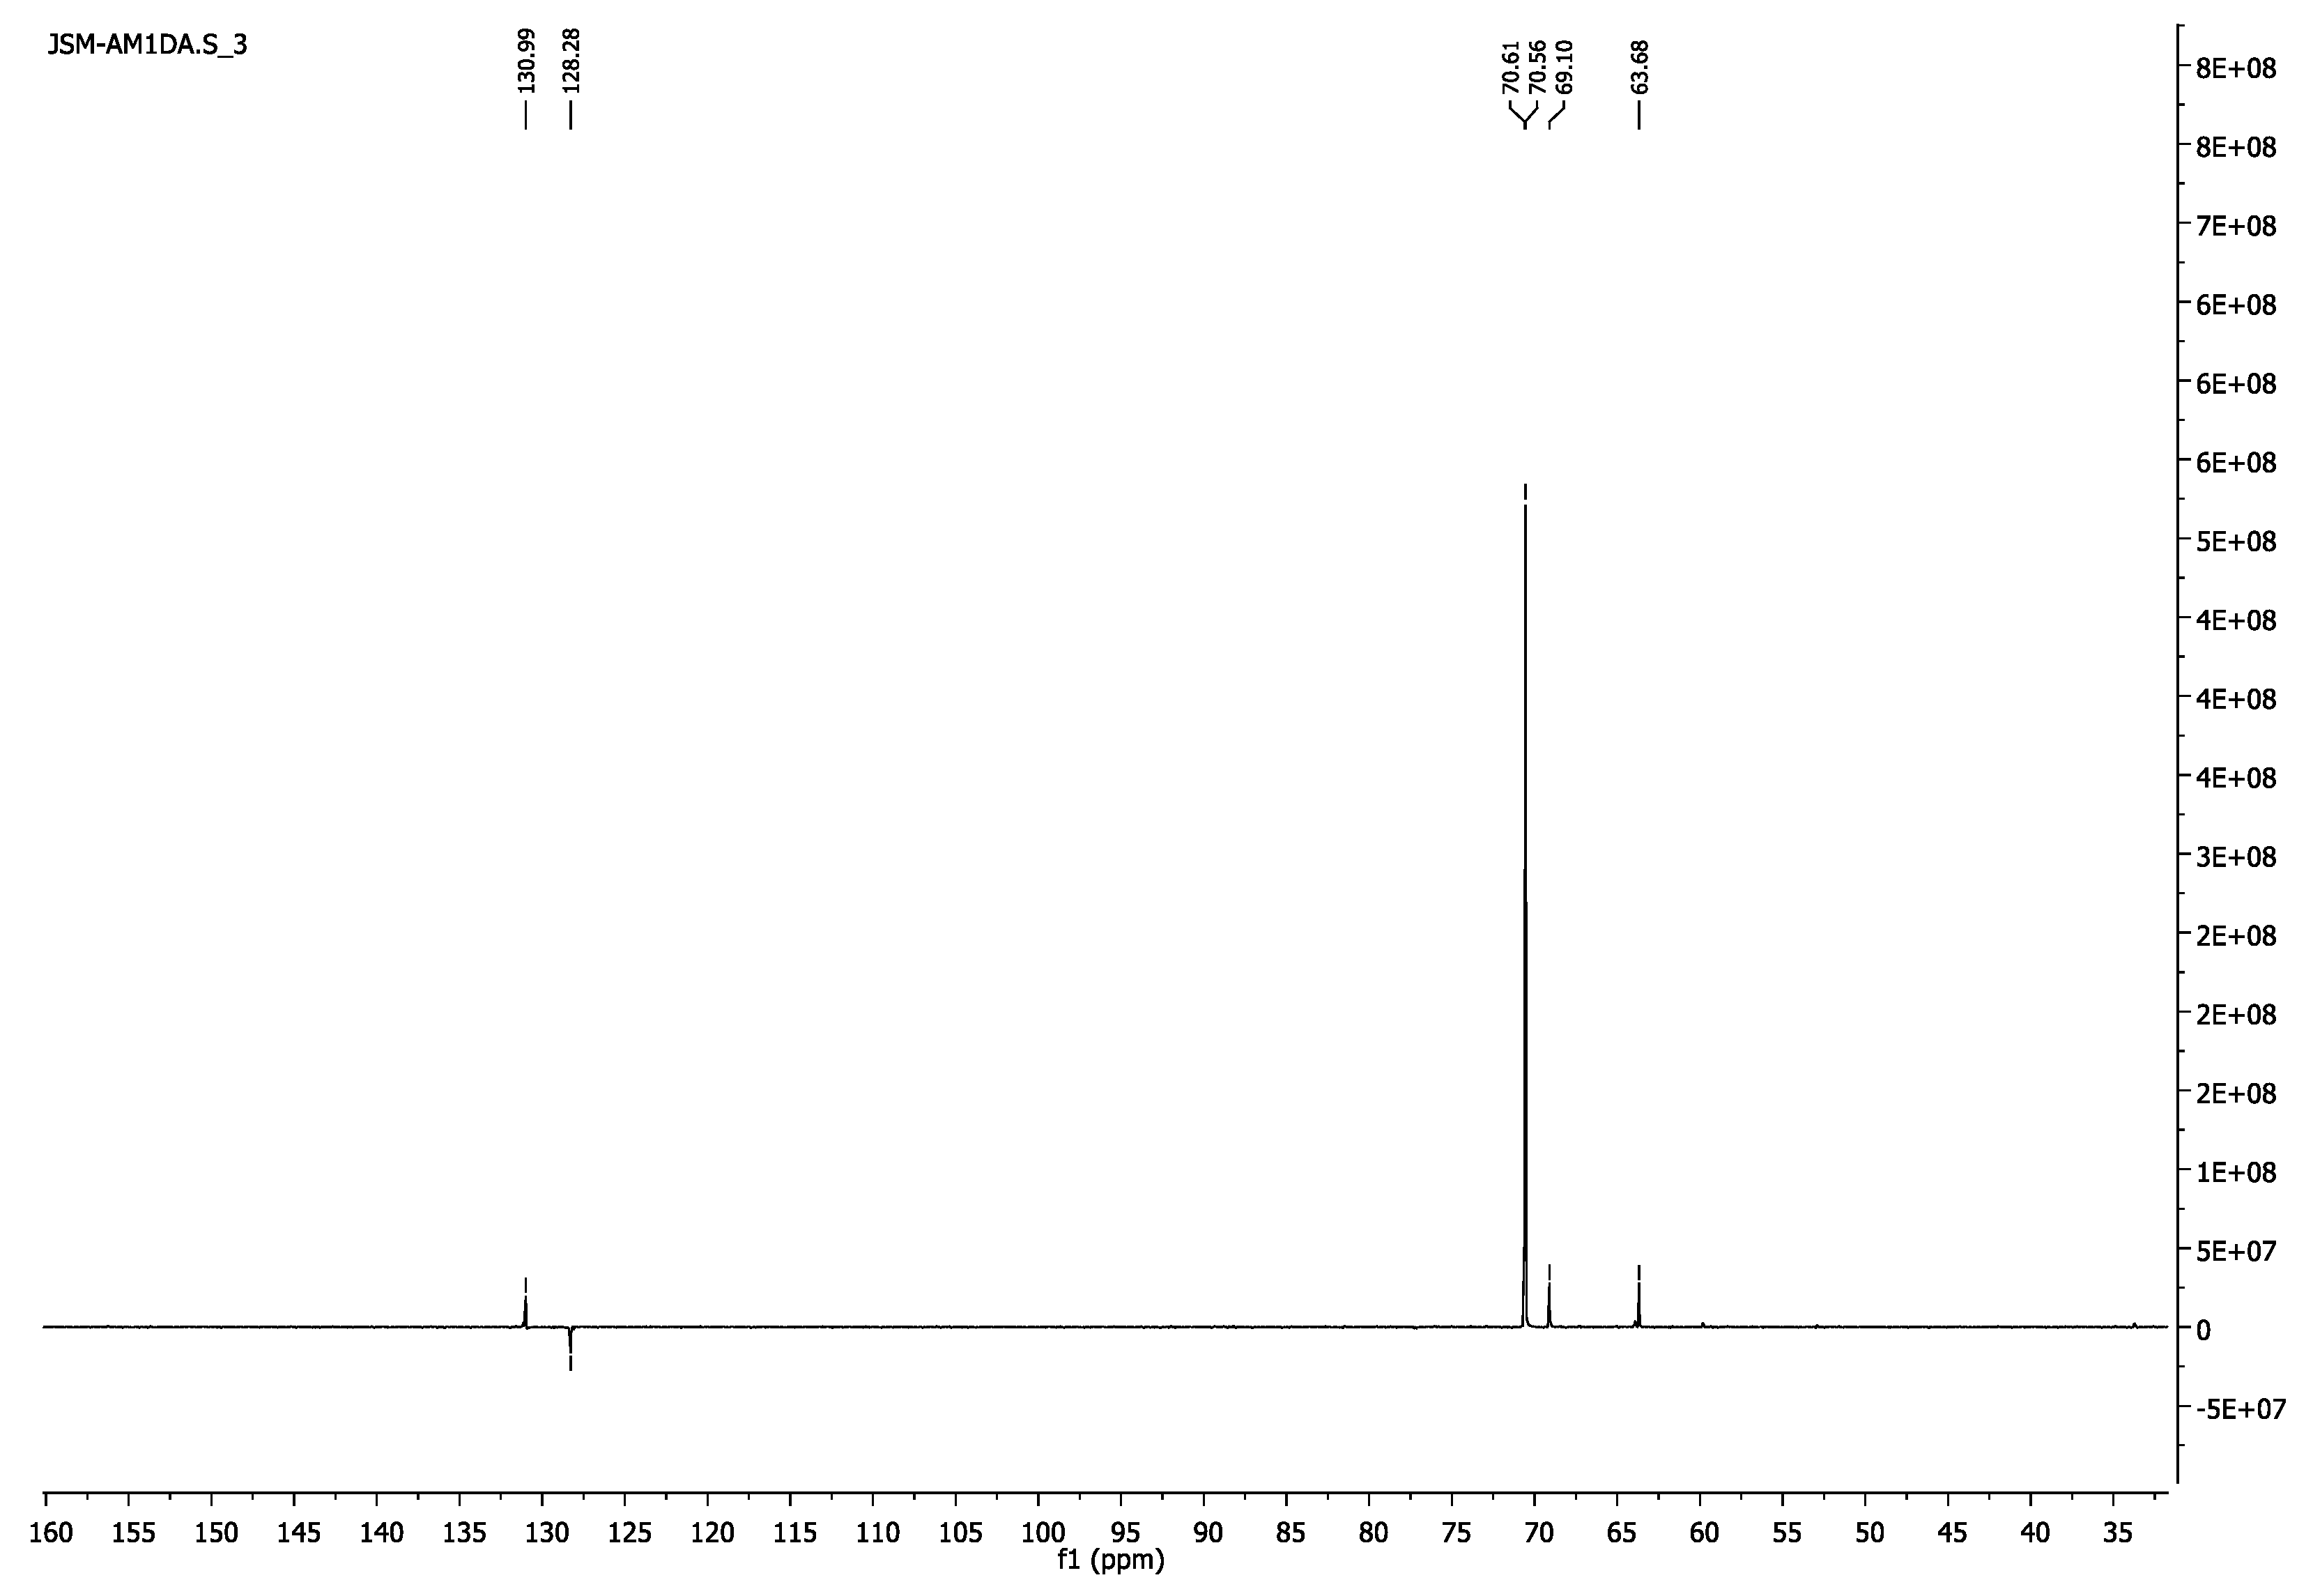
3.1.4. Poly(ethylene glycol) Diacrylate, PEG2000DA
- 1H-NMR (400 MHz, CDCl3) δ 6.16 (d, J = 17.3 Hz, 2H, =CH2), 6.16 (dd, J = 17.4, 10.4 Hz, 2H, =CH), 5.84 (d, J = 10.4 Hz, 1H, =CH2), 4.34–4.30 (m, 4H, CH2O-(C=O)), 3.76–3.73 (m, 4H, CH2CH2O-(C=O)), 3.65 (s, 103H, CH2CH2O).
- 13C-NMR (100 MHz, CDCl3) δ 63.70 (CH2O-(C=O)), 69.12 (CH2CH2O-(C=O)), 70.56 (CH2CH2O), 128.28 (CH),, 131.04 (=CH2), 166.17 (C=O).
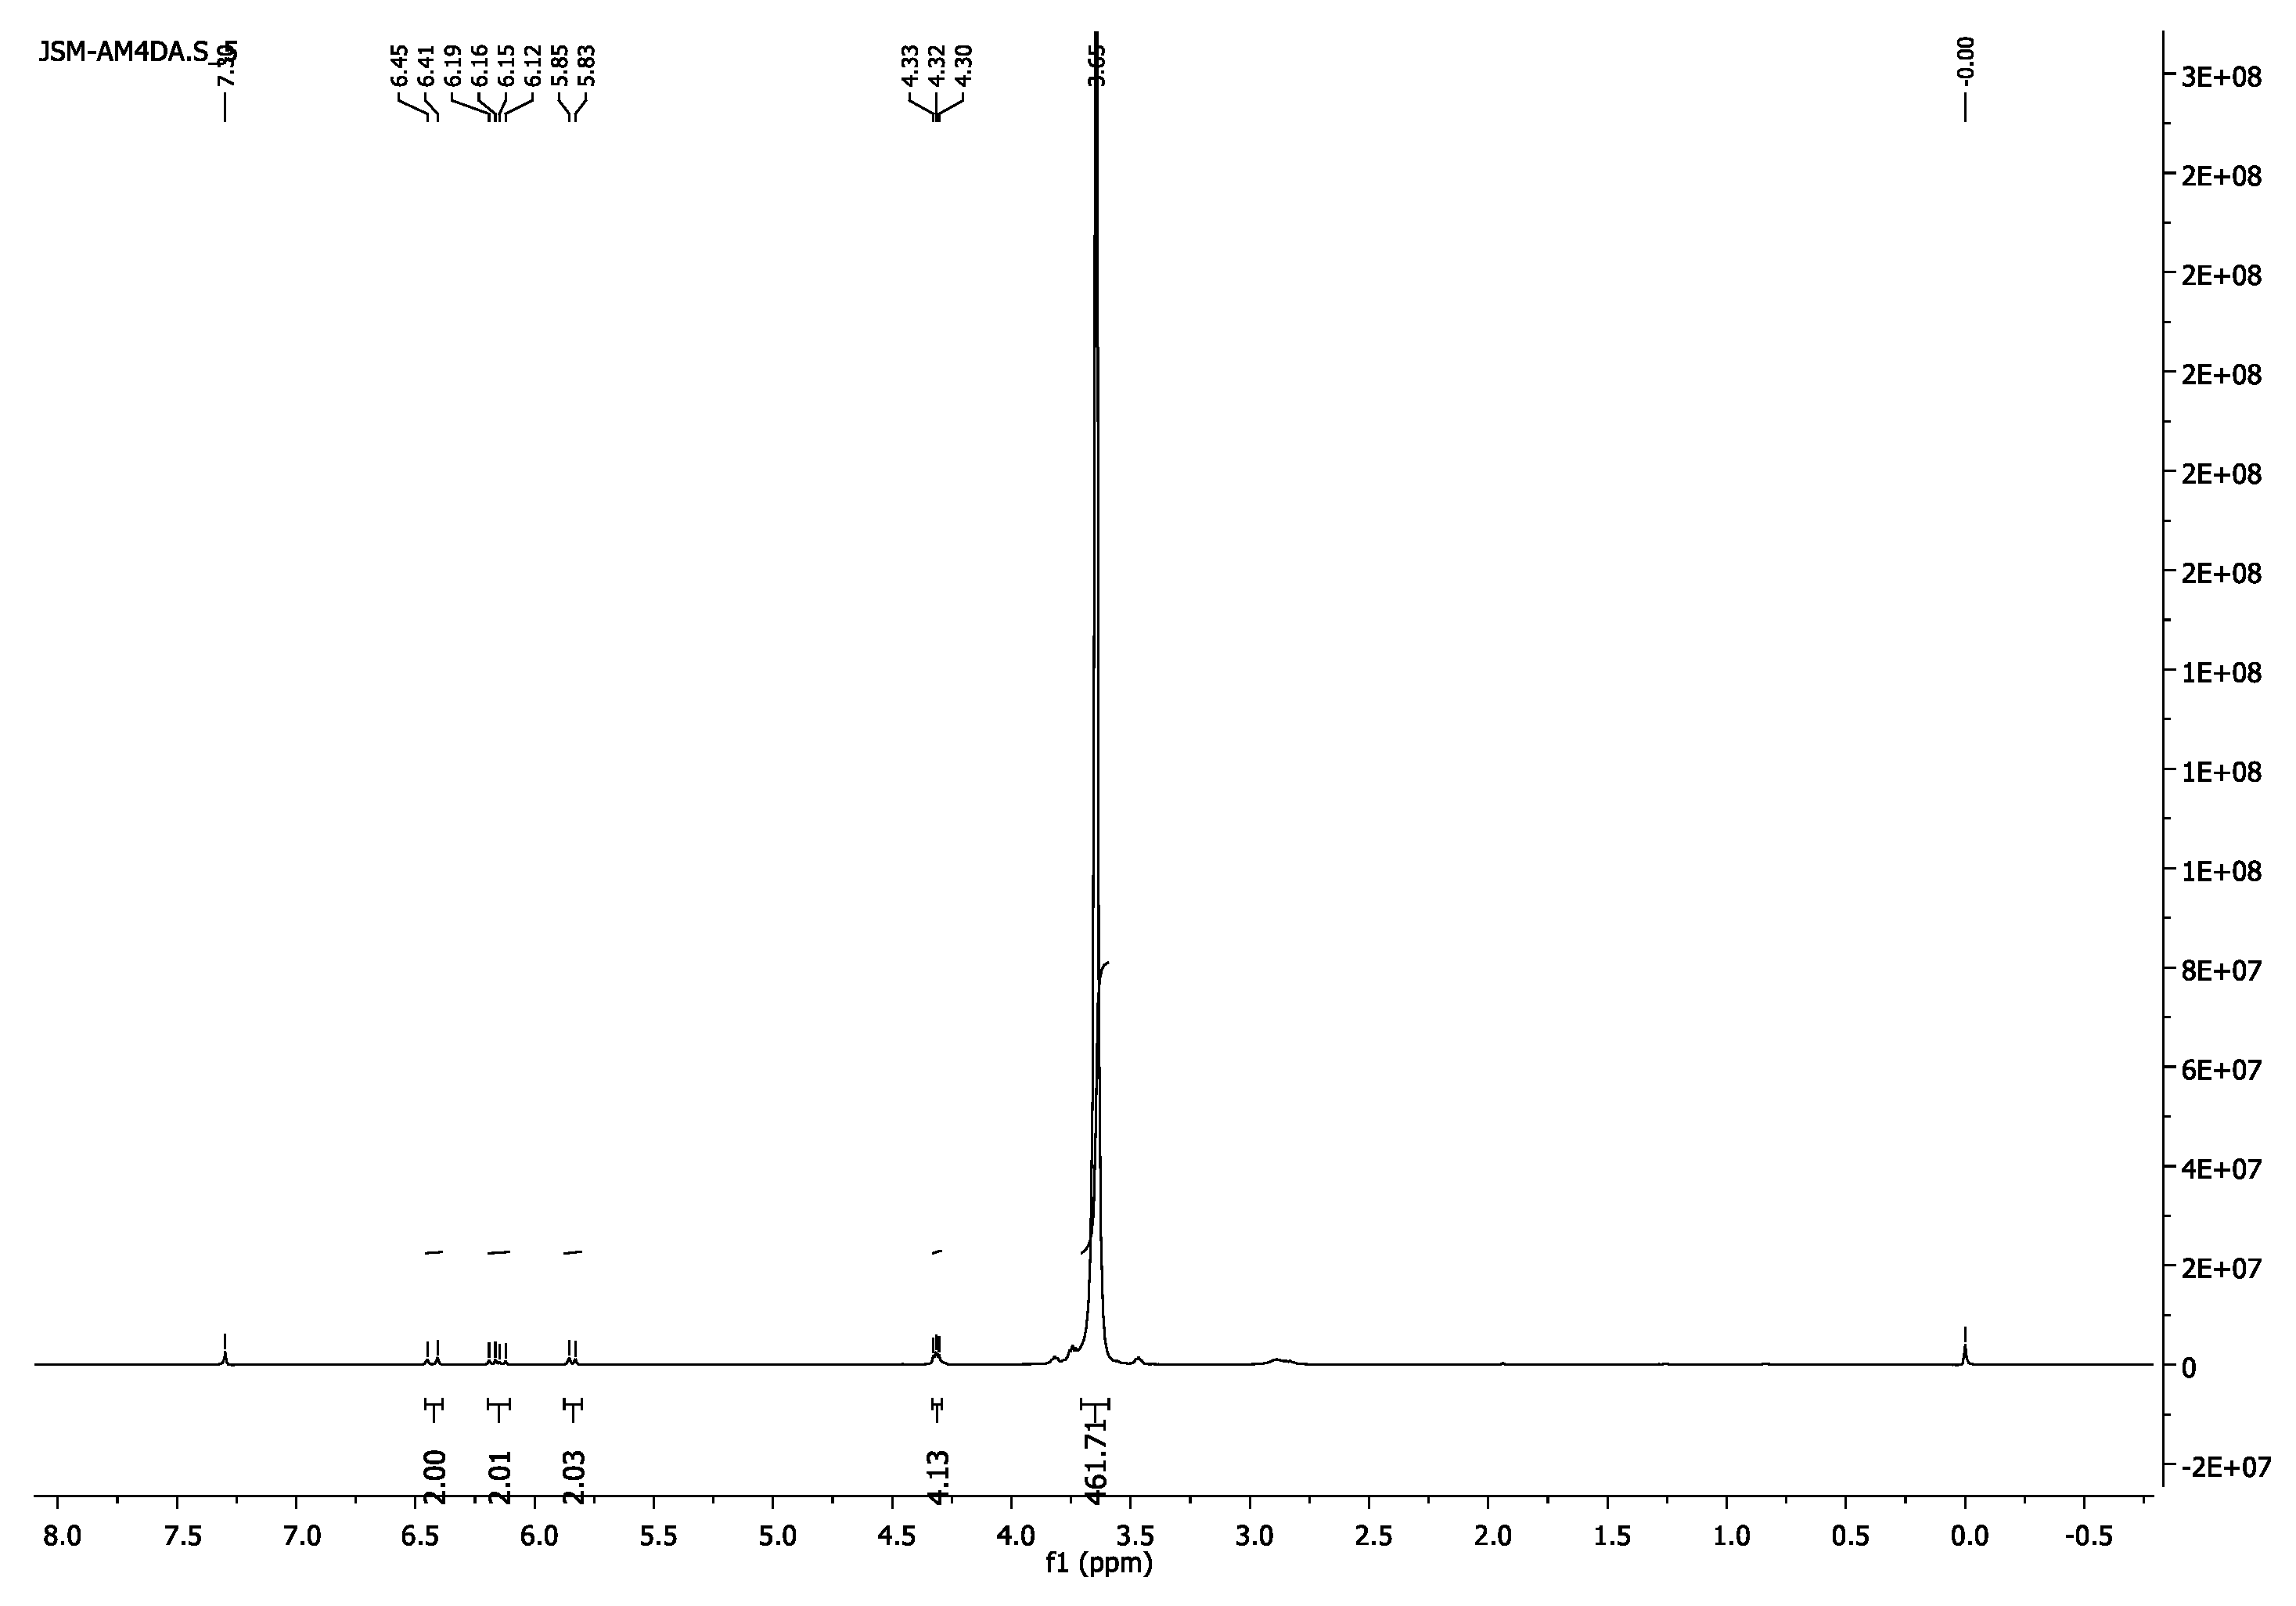
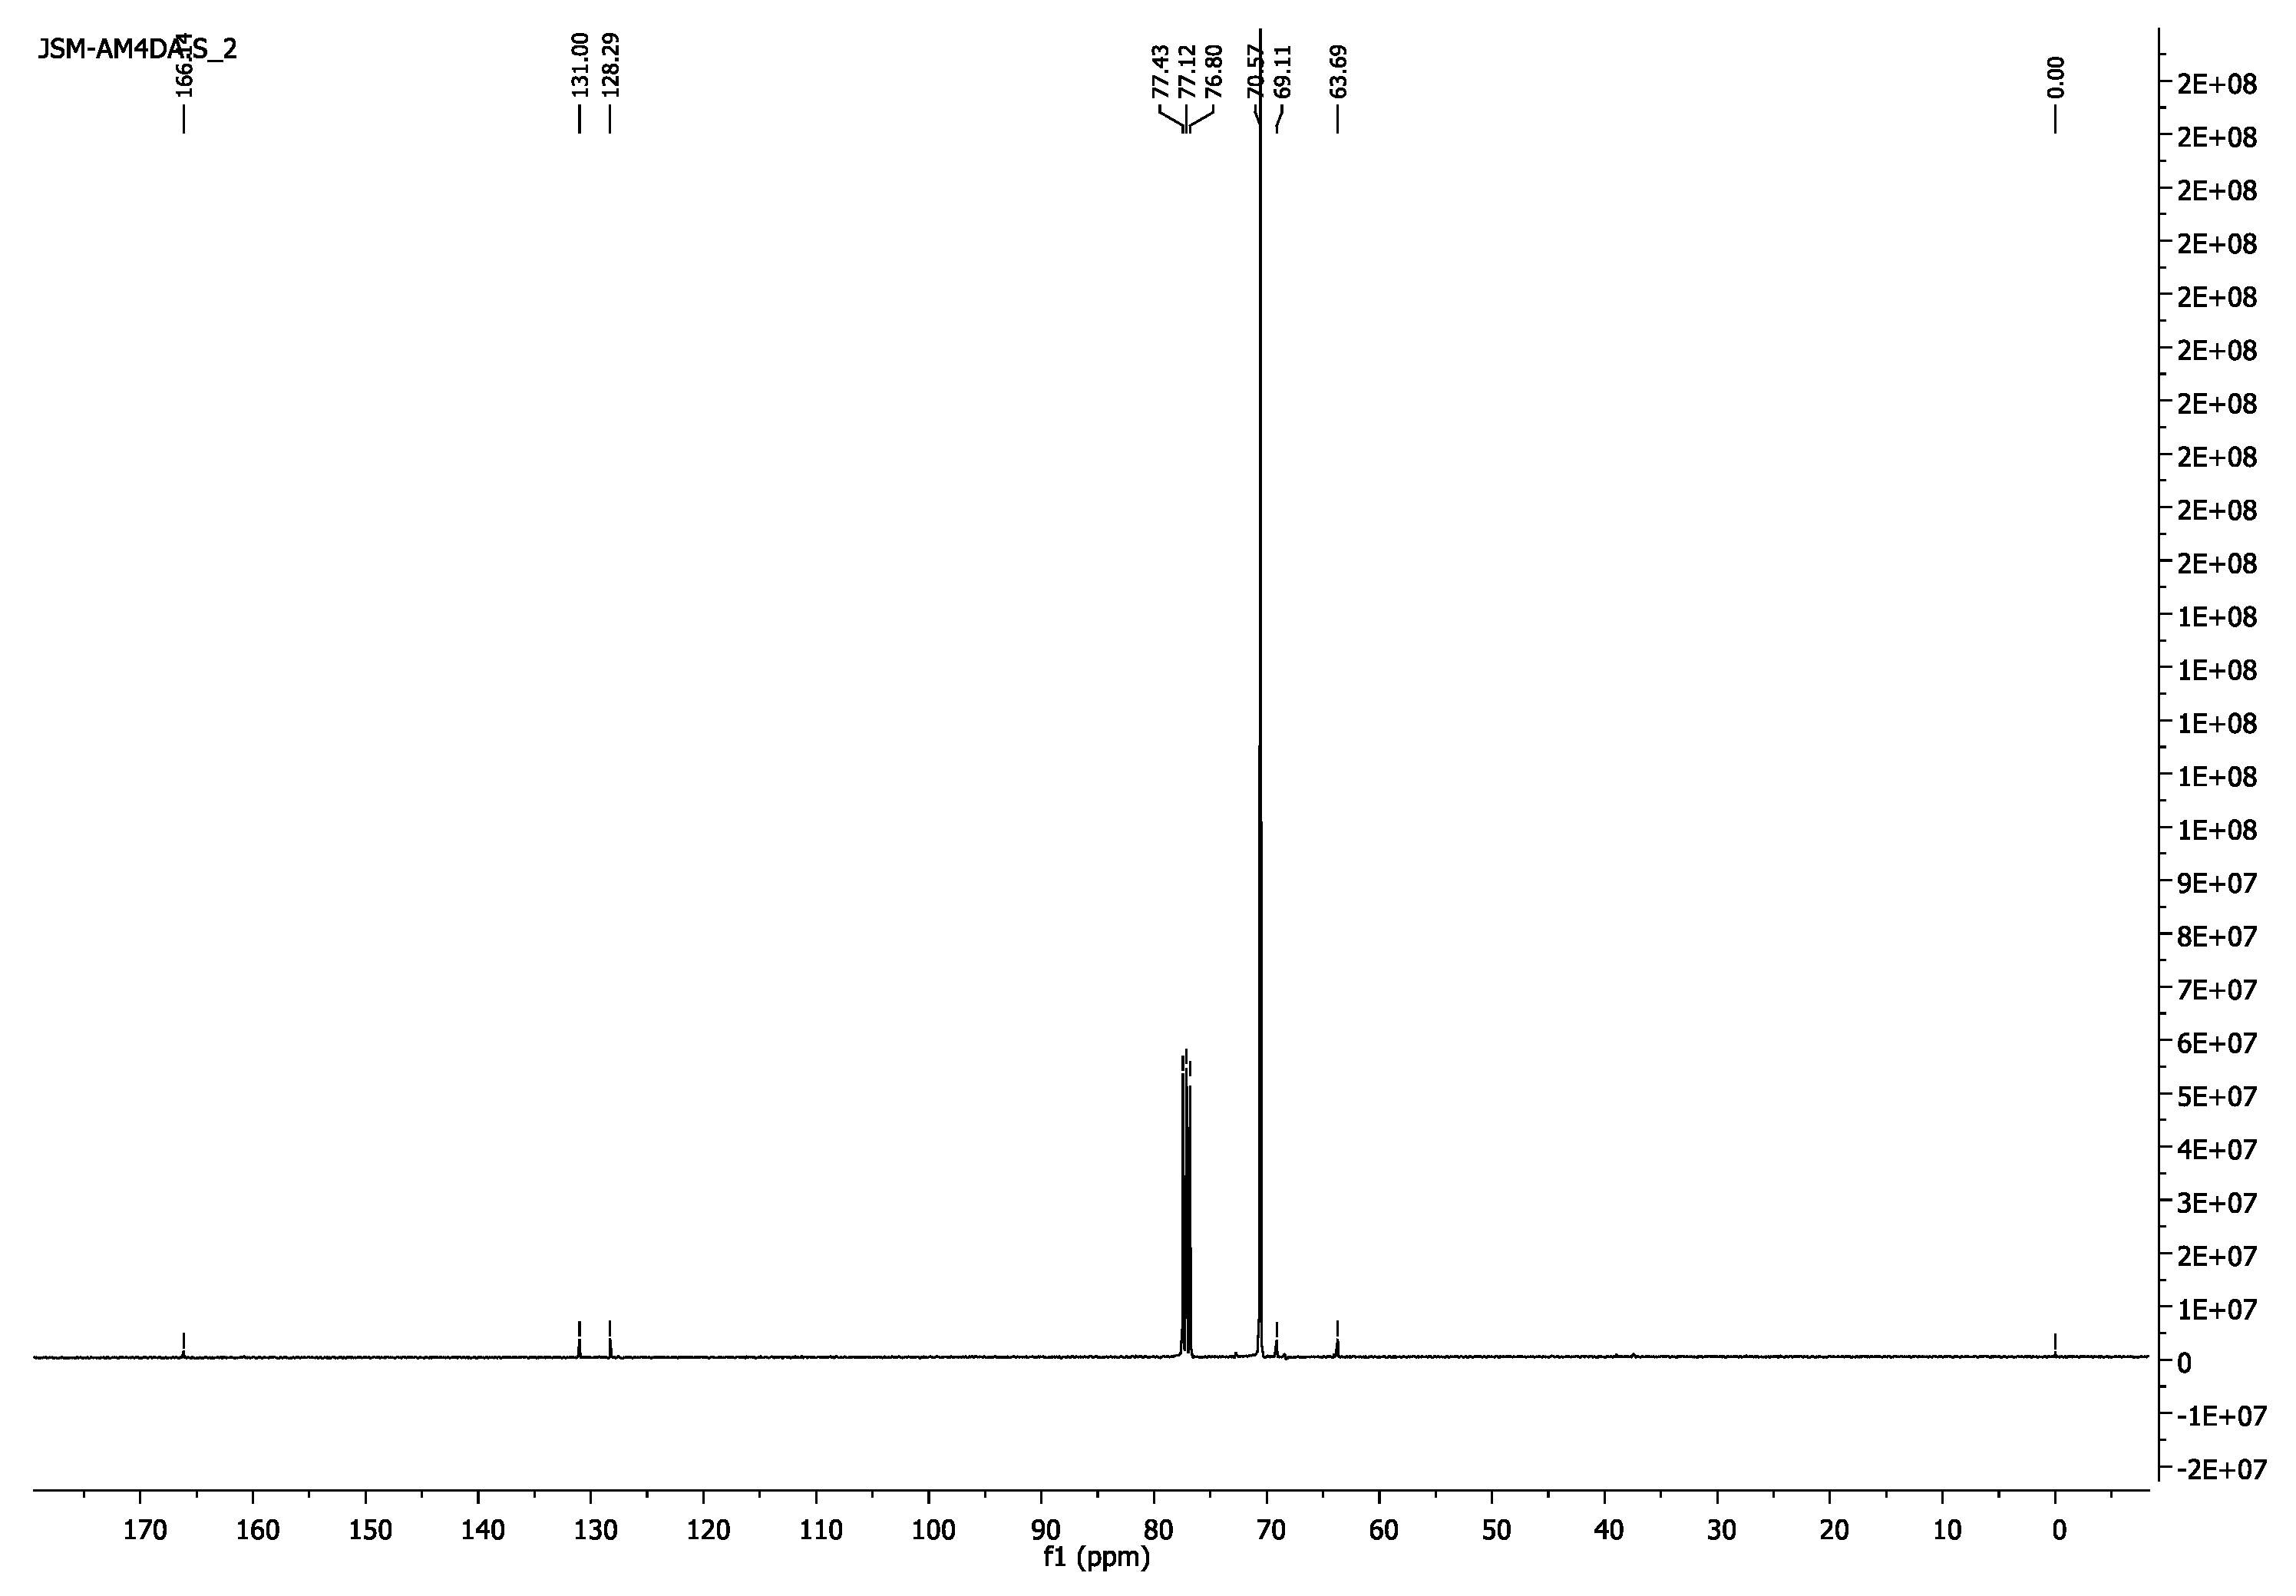
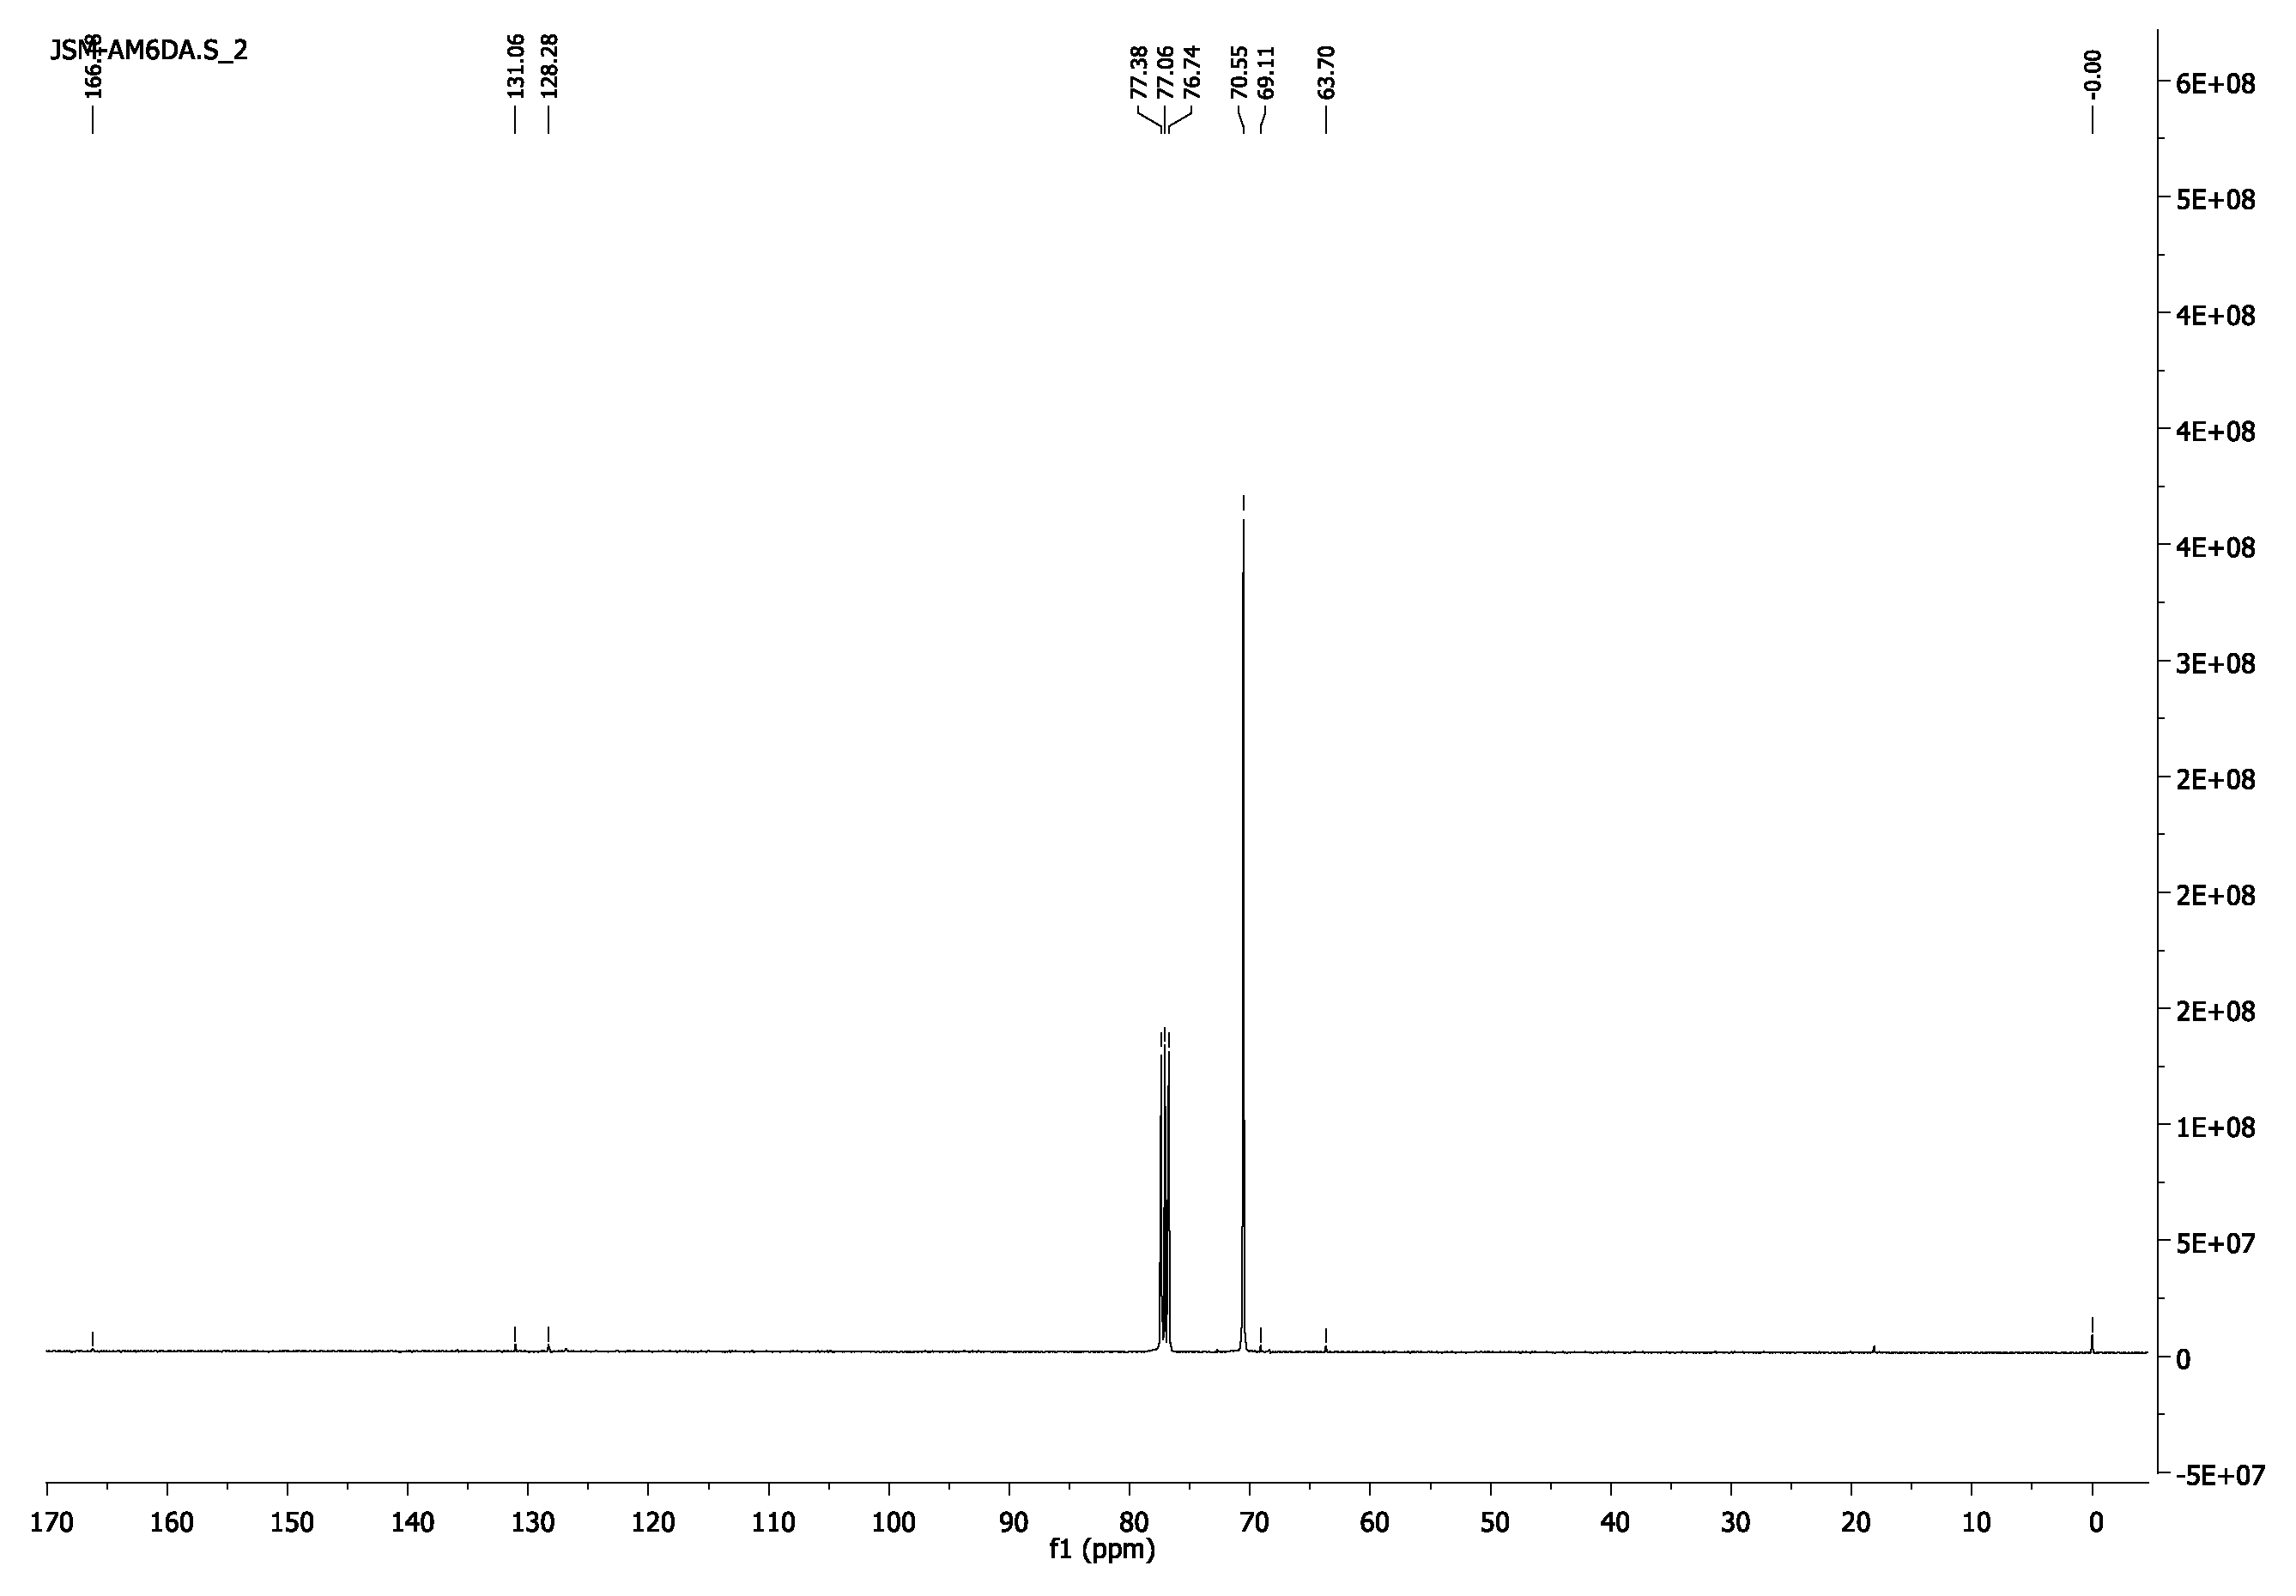
3.1.5. Poly(ethylene glycol) Diacrylate, PEG4000DA and PEG6000DA
- 1H-NMR (400 MHz, CDCl3) δ 6.43 (d, J = 17.3 Hz,2H, =CH2), 6.16 (dd, J = 17.3, 10.4 Hz, 2H, =CH), 5.84 (d, J = 10.4 Hz, 2H, =CH2), 4.33–4.29 (m, 4H, CH2O-(C=O)), 3.65 (s, 462H, CH2CH2O).
- 13C-NMR (100 MHz, CDCl3) δ 63.69 (CH2O-(C=O)), 69.11 (CH2CH2O-(C=O)), 70.57 (CH2CH2O), 128.29 (CH),131.00 (=CH2),166.14 (C=O).
- 1H-NMR (400 MHz, CDCl3) δ 6.43 (d, J = 17.3 Hz, 2H, =CH2), 6.20–6.11 (m, 2H, =CH), 5.84 (d, J = 10.4 Hz, 2H, =CH2), 4.33–4.30 (m, 4H, CH2O-(C=O)), 3.65 (s, 615H, CH2CH2O).
- 13C-NMR (100 MHz, CDCl3) (CDCl3) δ 63.70 (CH2O-(C=O)), 69.11 (CH2CH2O-(C=O)), 70.55 (CH2CH2O), 128.28 (CH),130.06 (=CH2),166.18 (C=O).
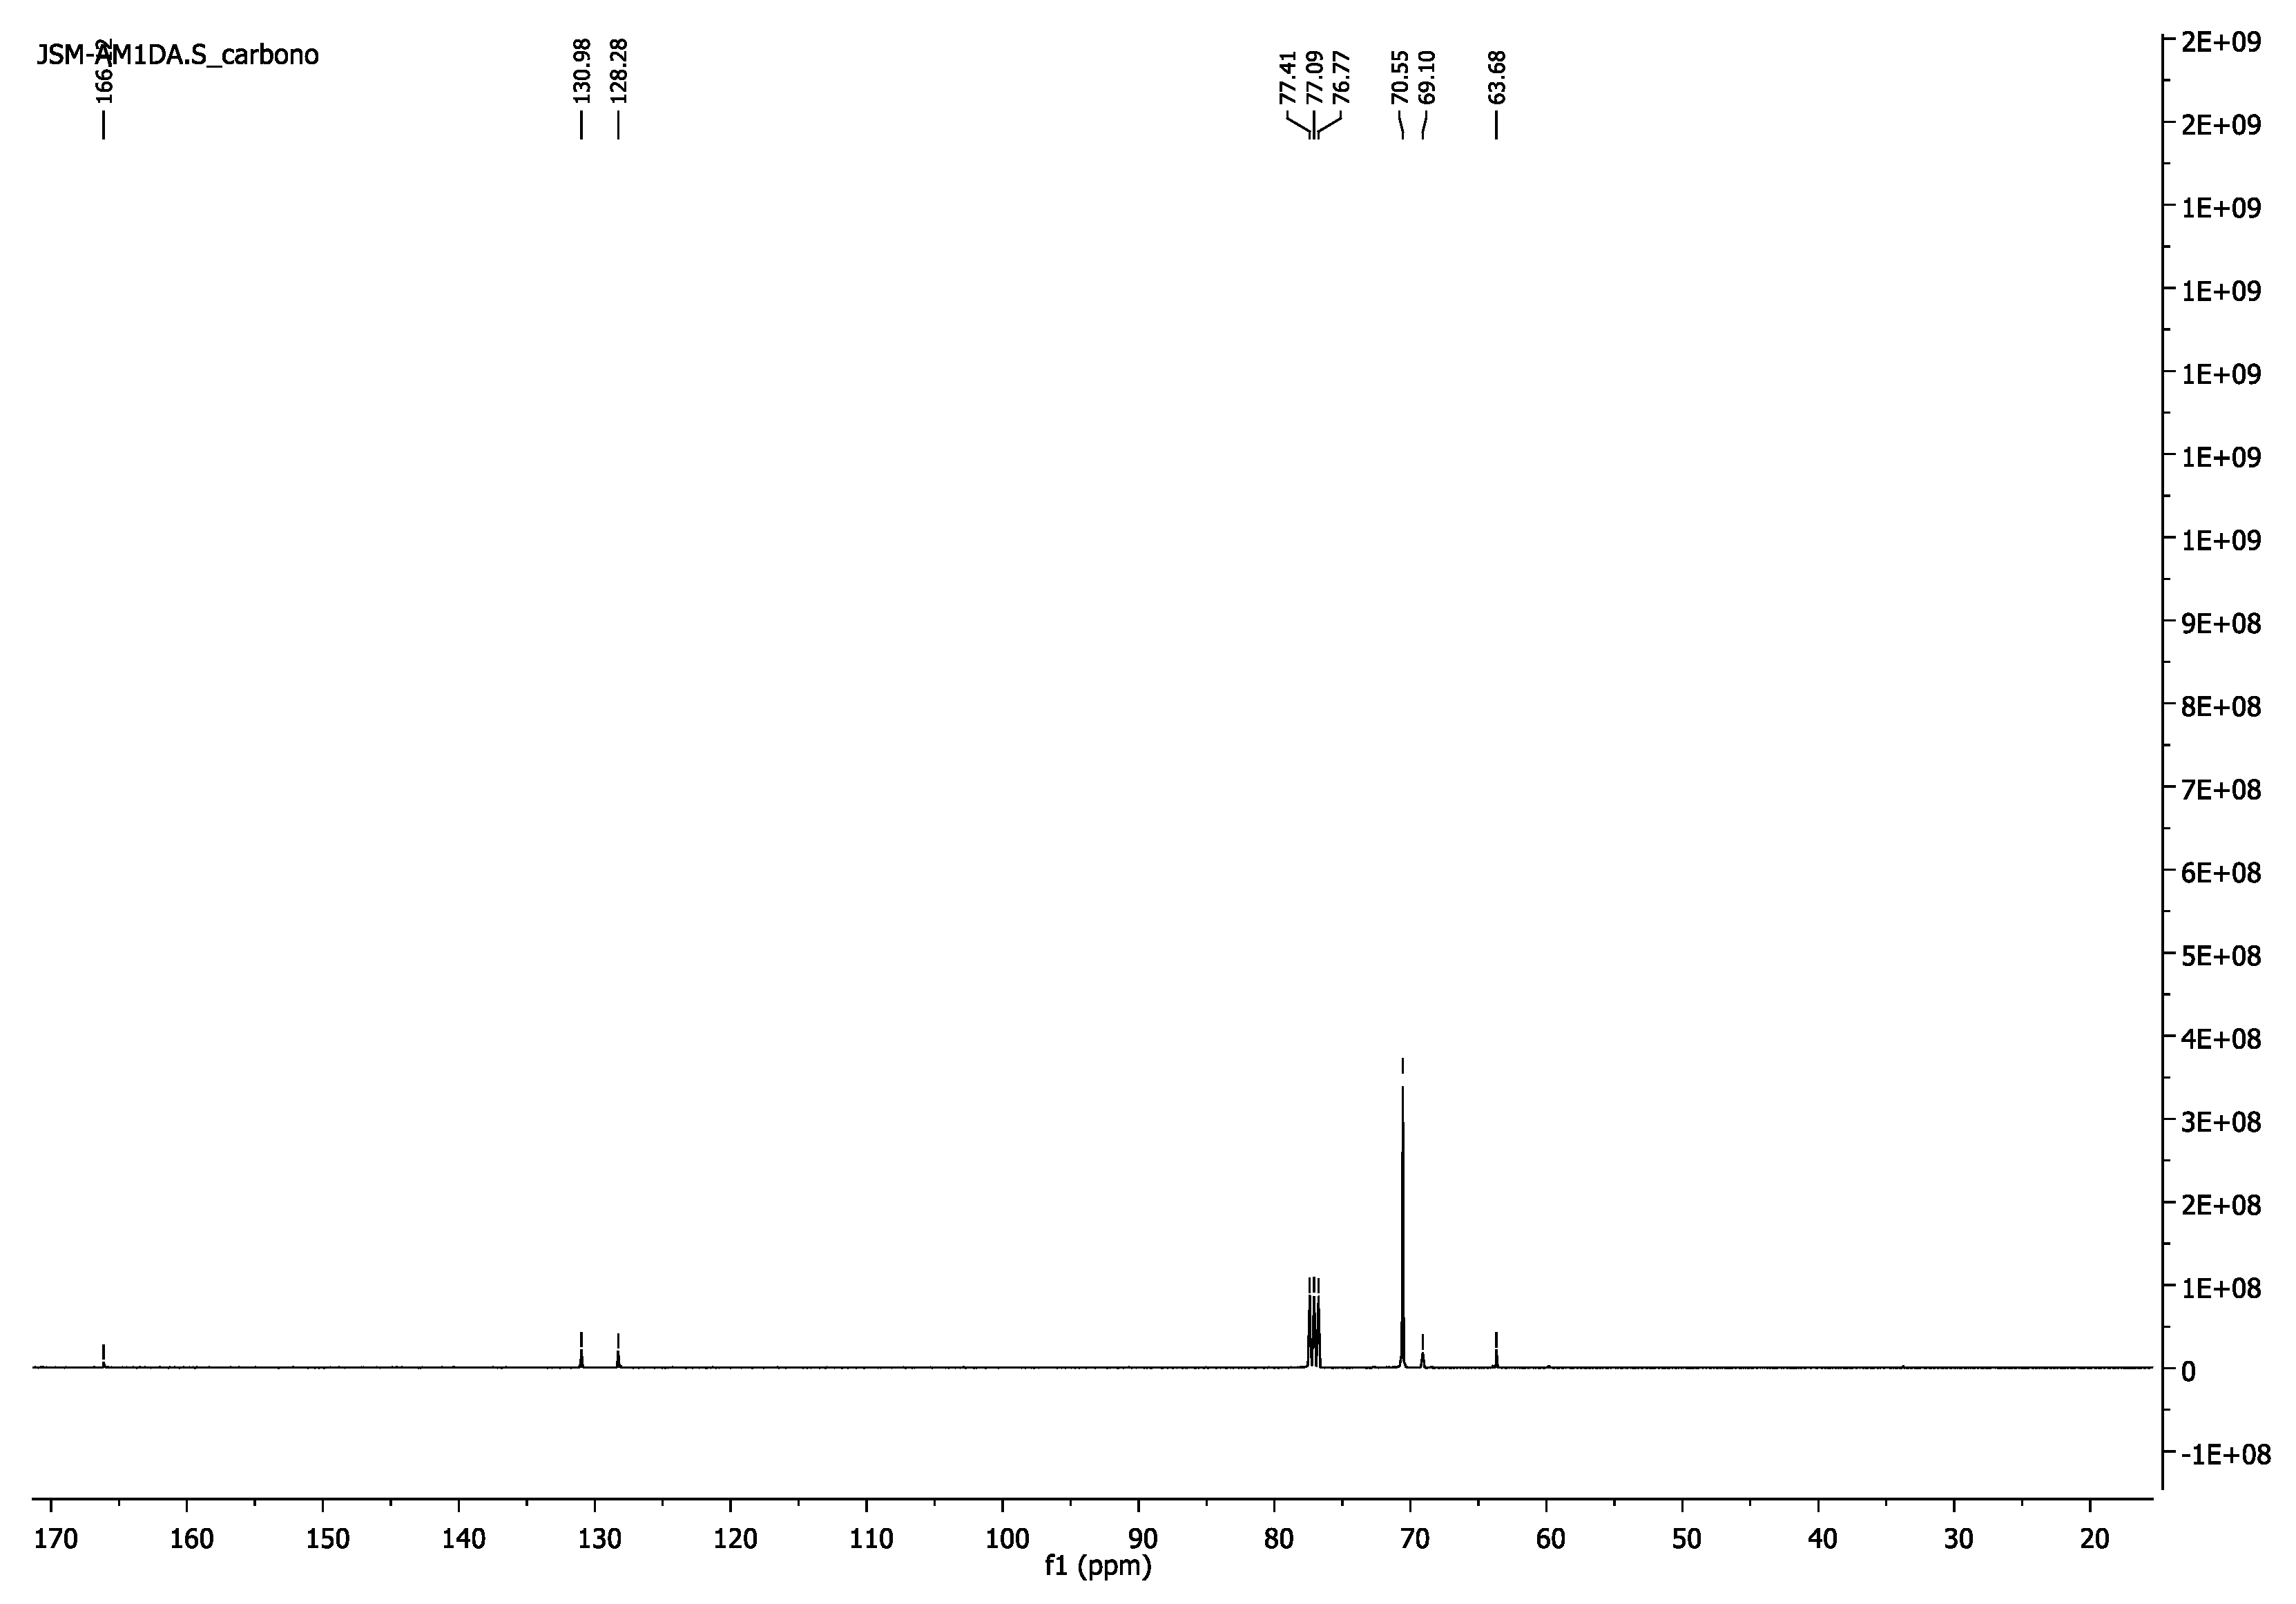
3.1.6. Poly(ethylene glycol) Diacrylate, PEG1000DA
- 1H-NMR (400 MHz, CDCl3) δ 6.43 (d, J = 17.3 Hz, 2H, =CH2), 6.16 (dd, J = 17.4, 10.4 Hz, 2H, =CH), 5.84 (d, J = 10.4 Hz, 2H, =CH2), 4.34–4.29 (m, 4H, CH2O-(C=O)), 3.77–3.72 (m, 4H, CH2CH2O-(C=O)), 3.64 (s, 86H, CH2CH2O).
- 13C-NMR (100 MHz, CDCl3) δ 63.68 (CH2O-(C=O)), 69.10 (CH2CH2O-(C=O)), 70.55 (CH2CH2O), 128.28 (CH) 130.98 (=CH2), 166.12 (C=O).
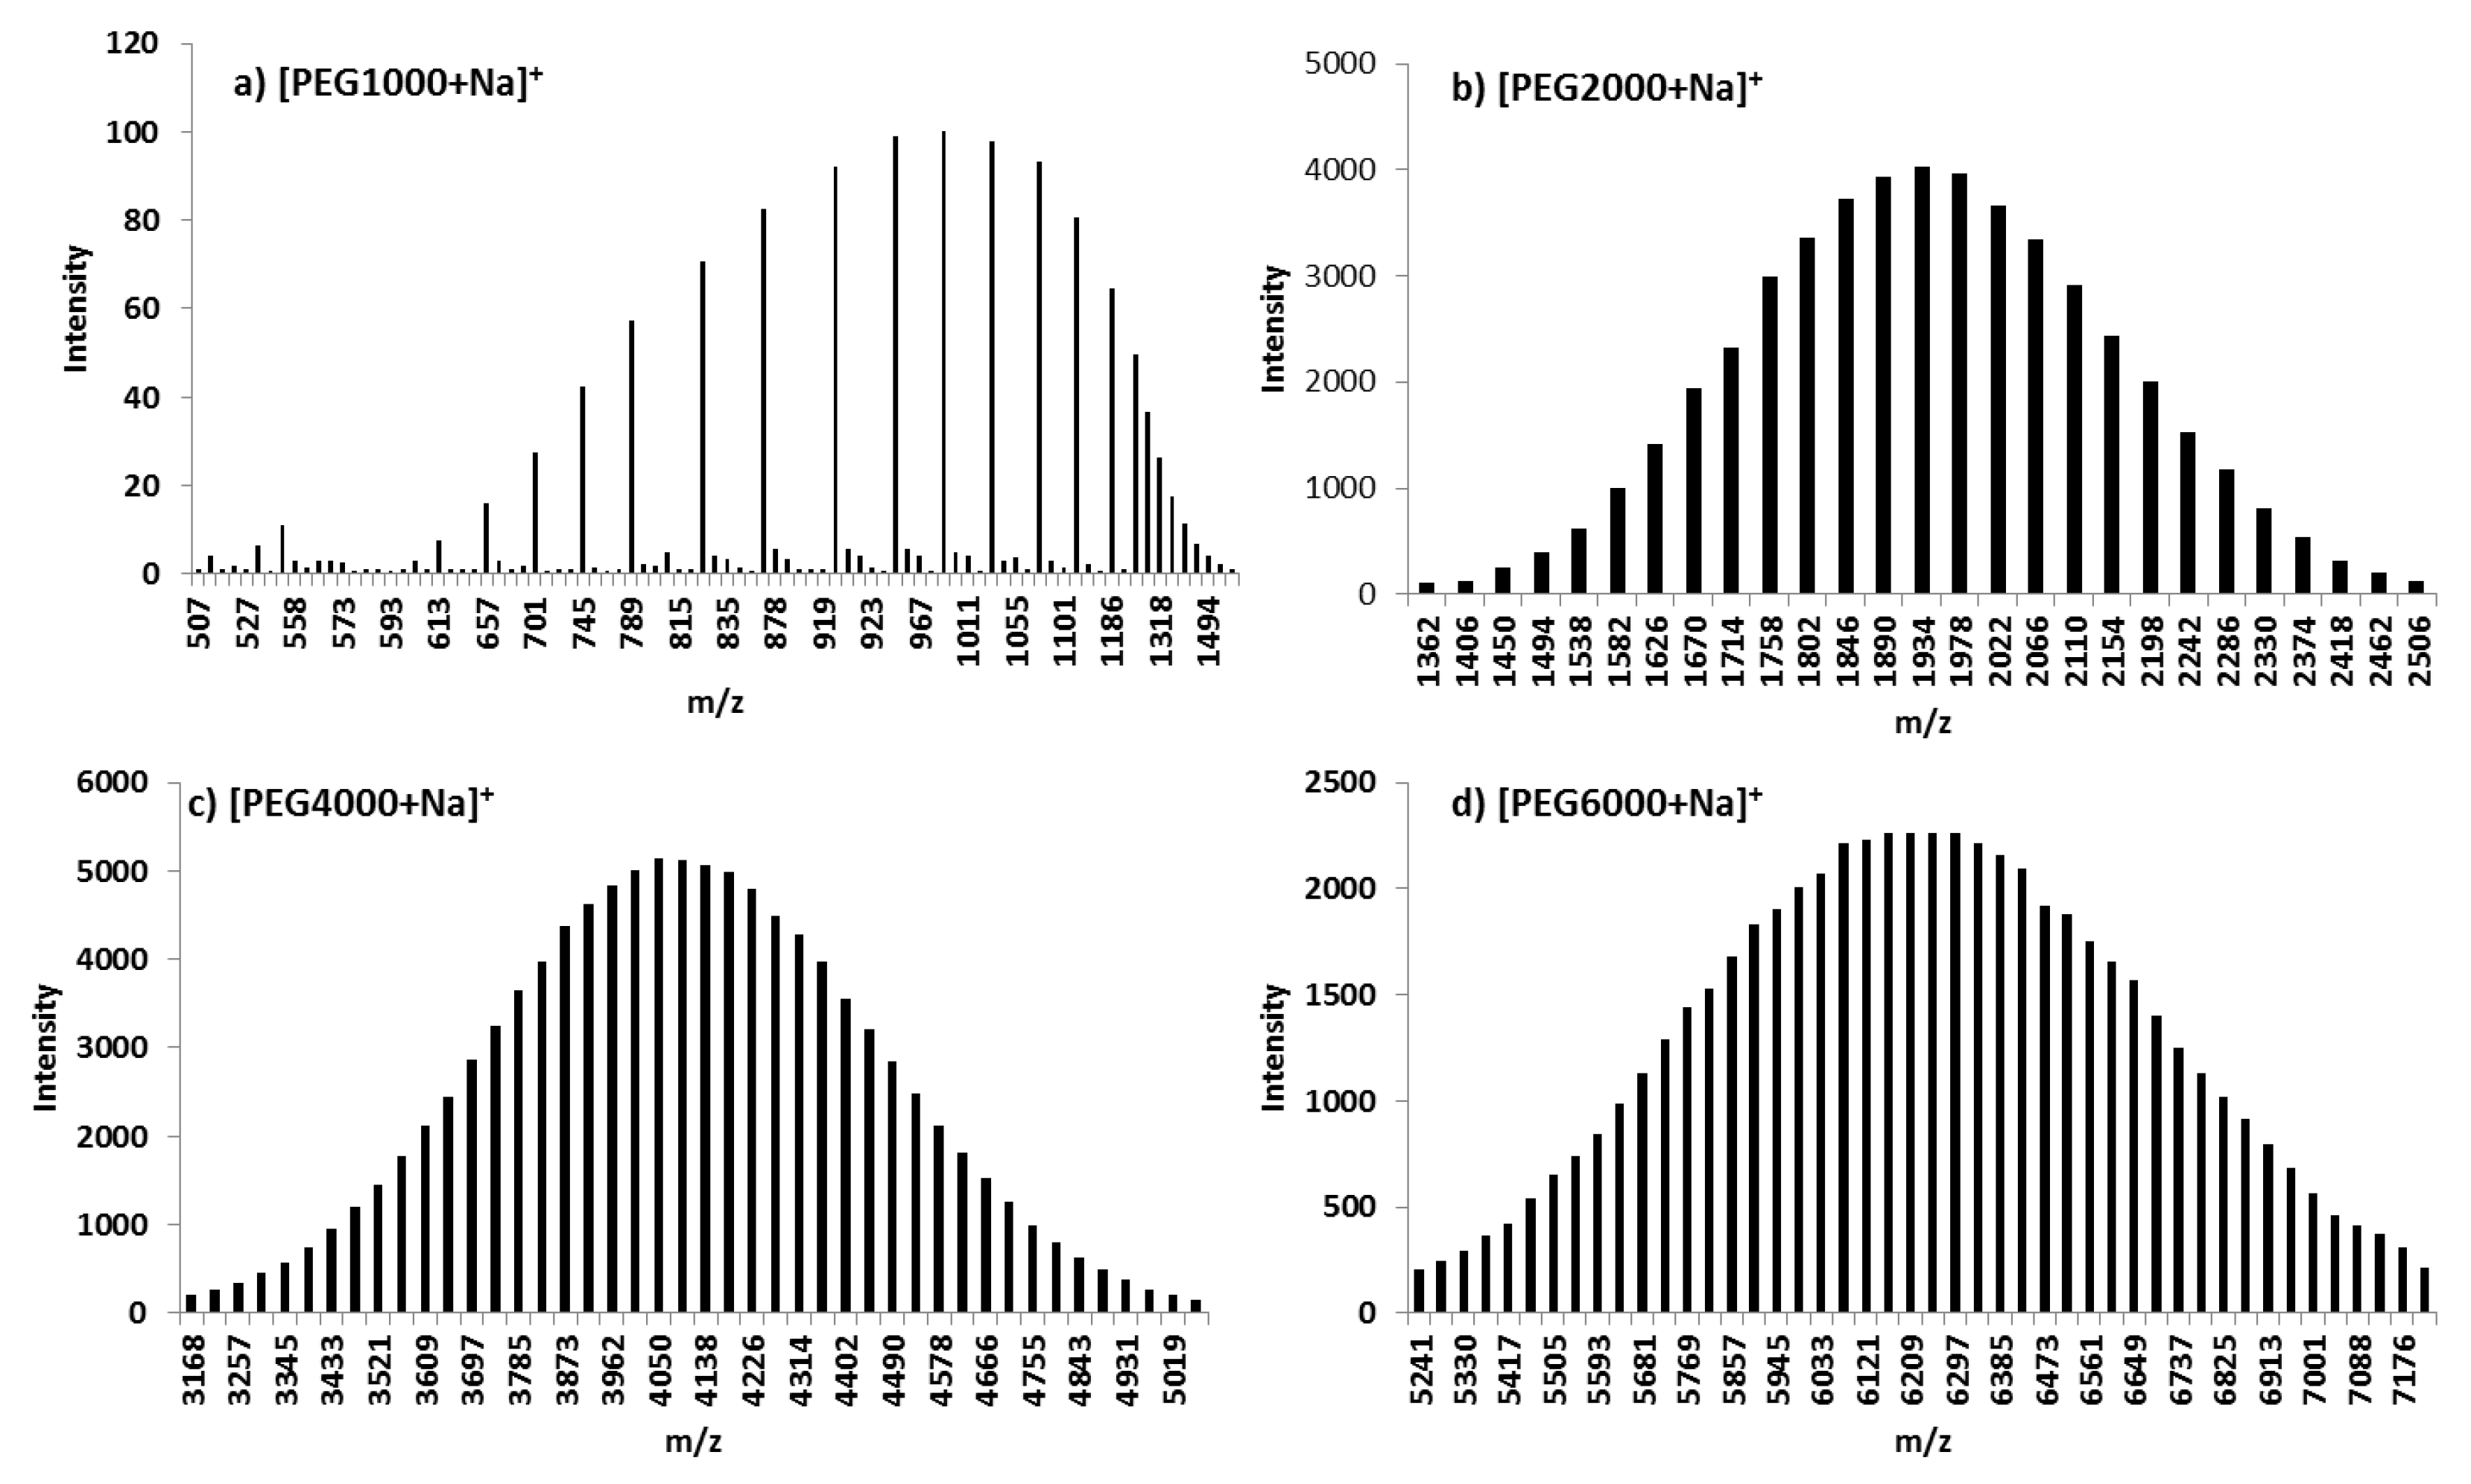
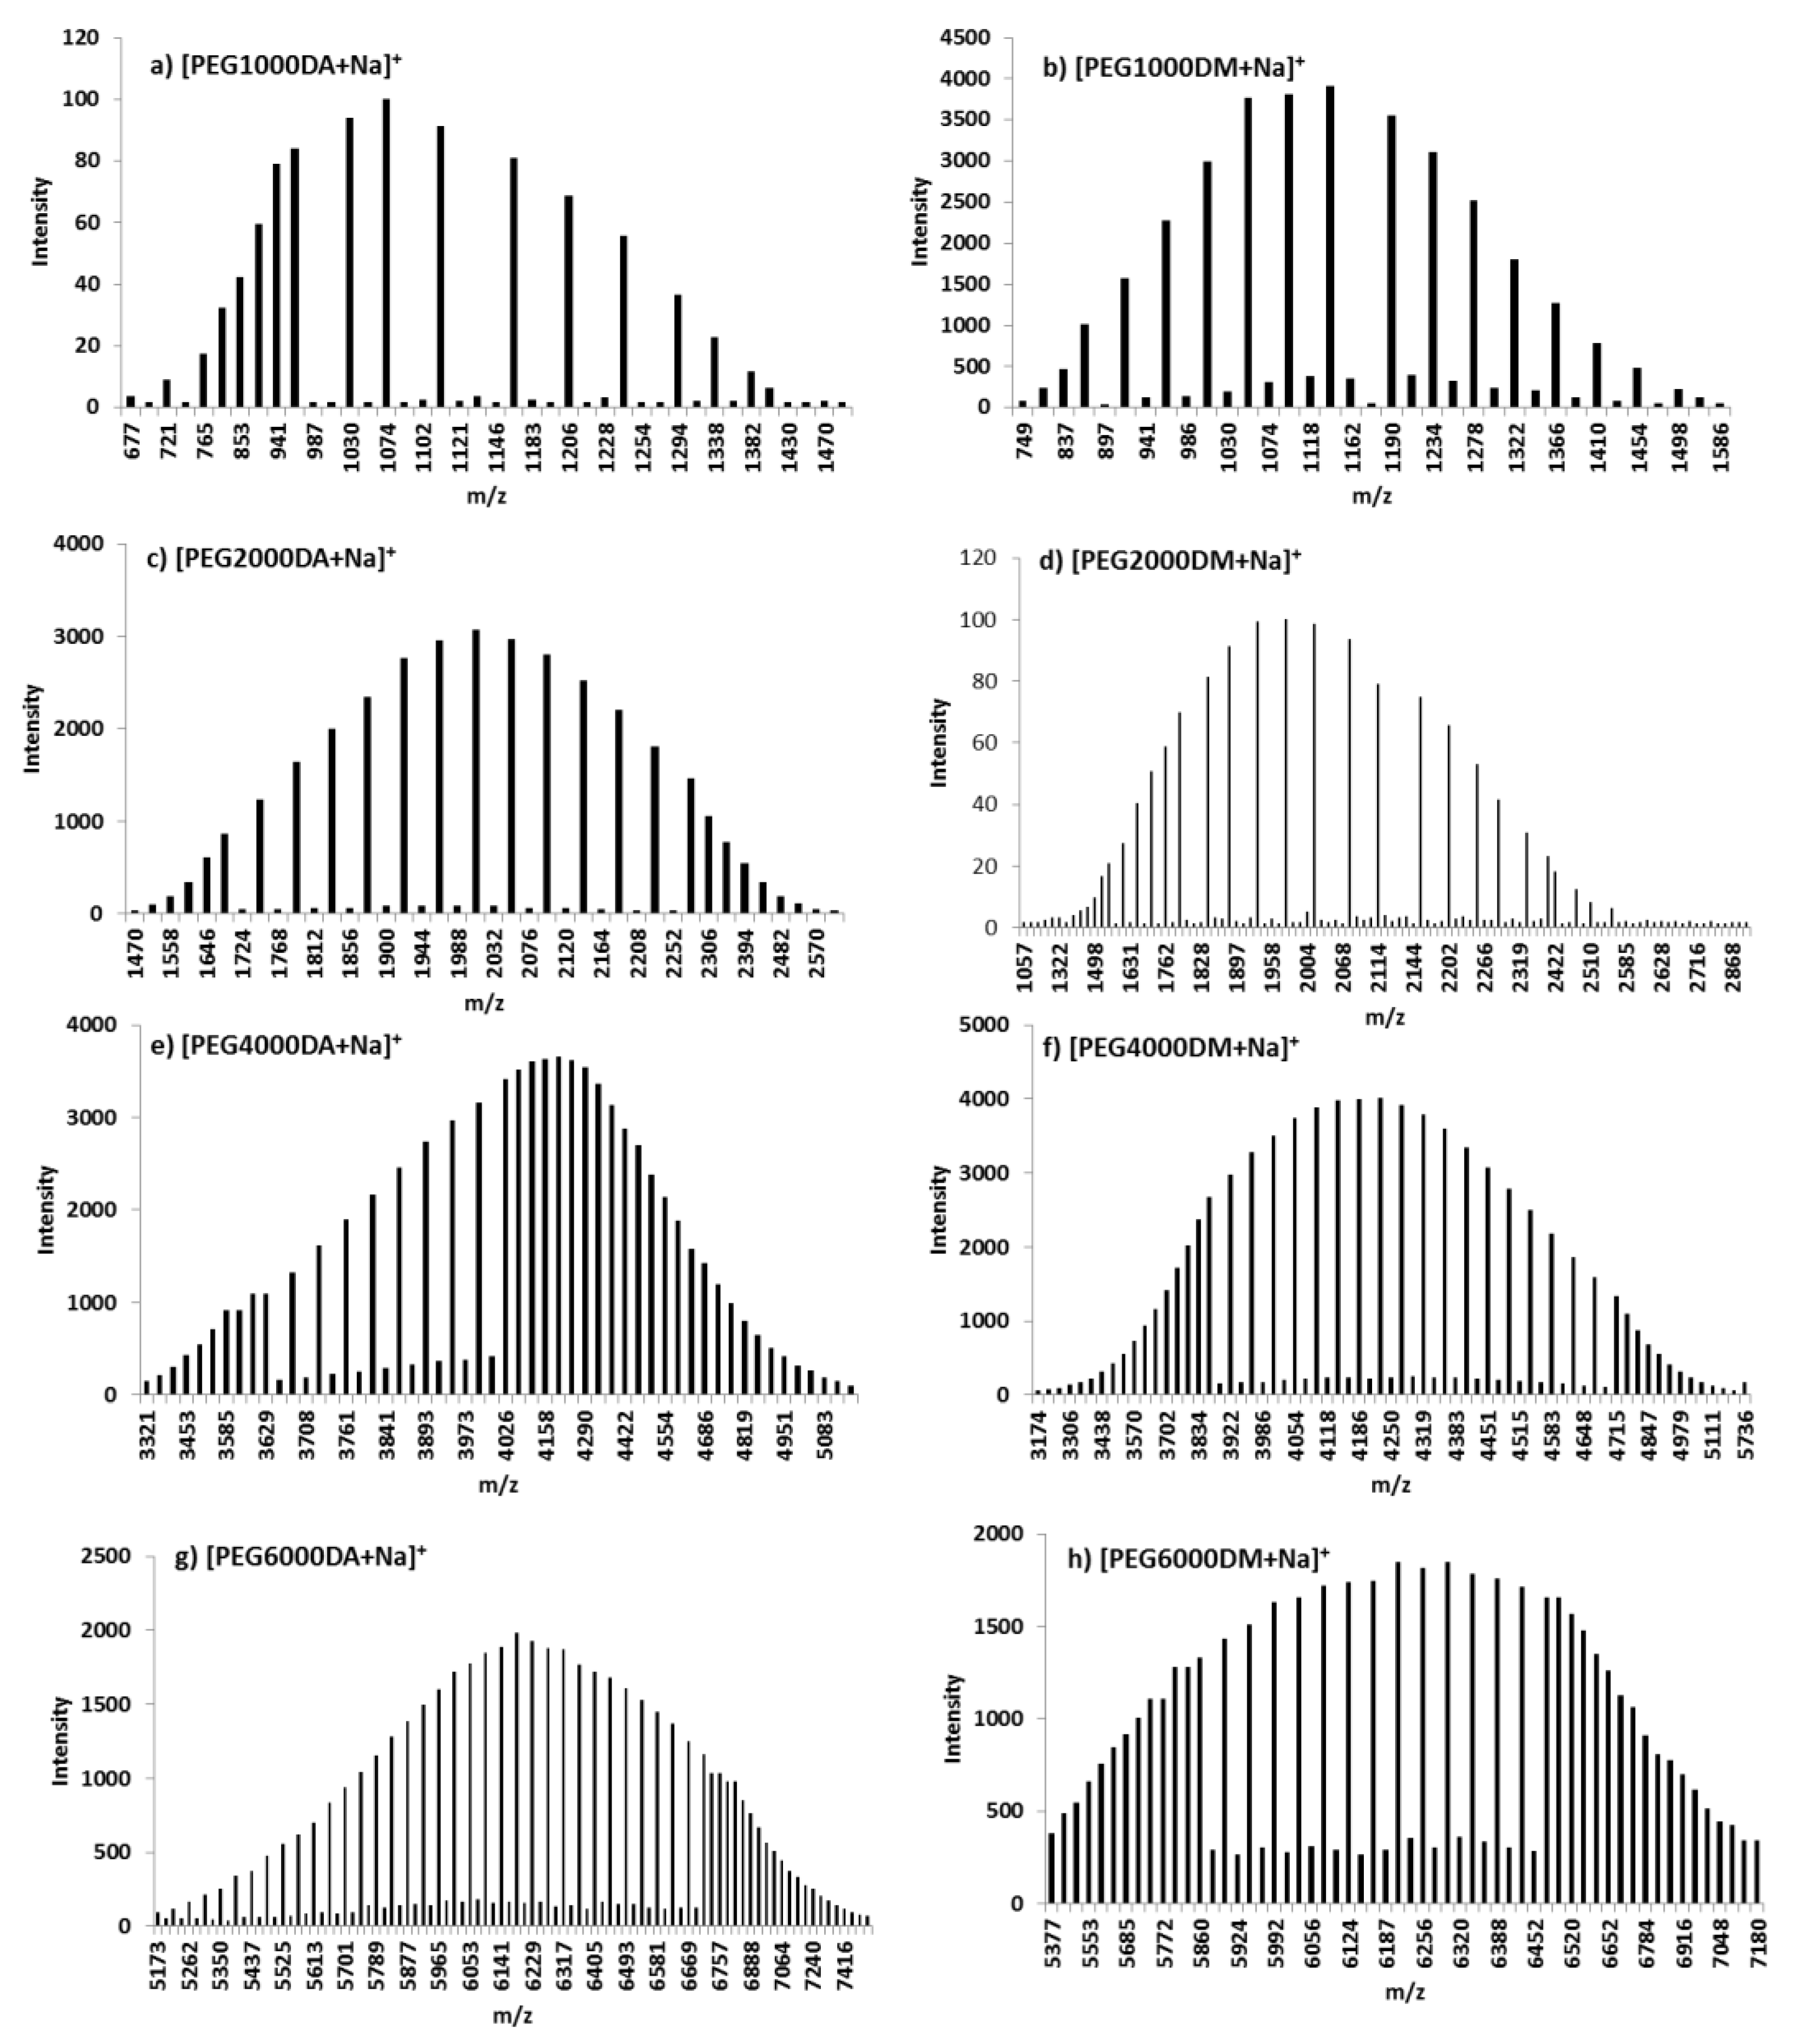
3.1.7. MALDI-TOF MS
4. Discussion
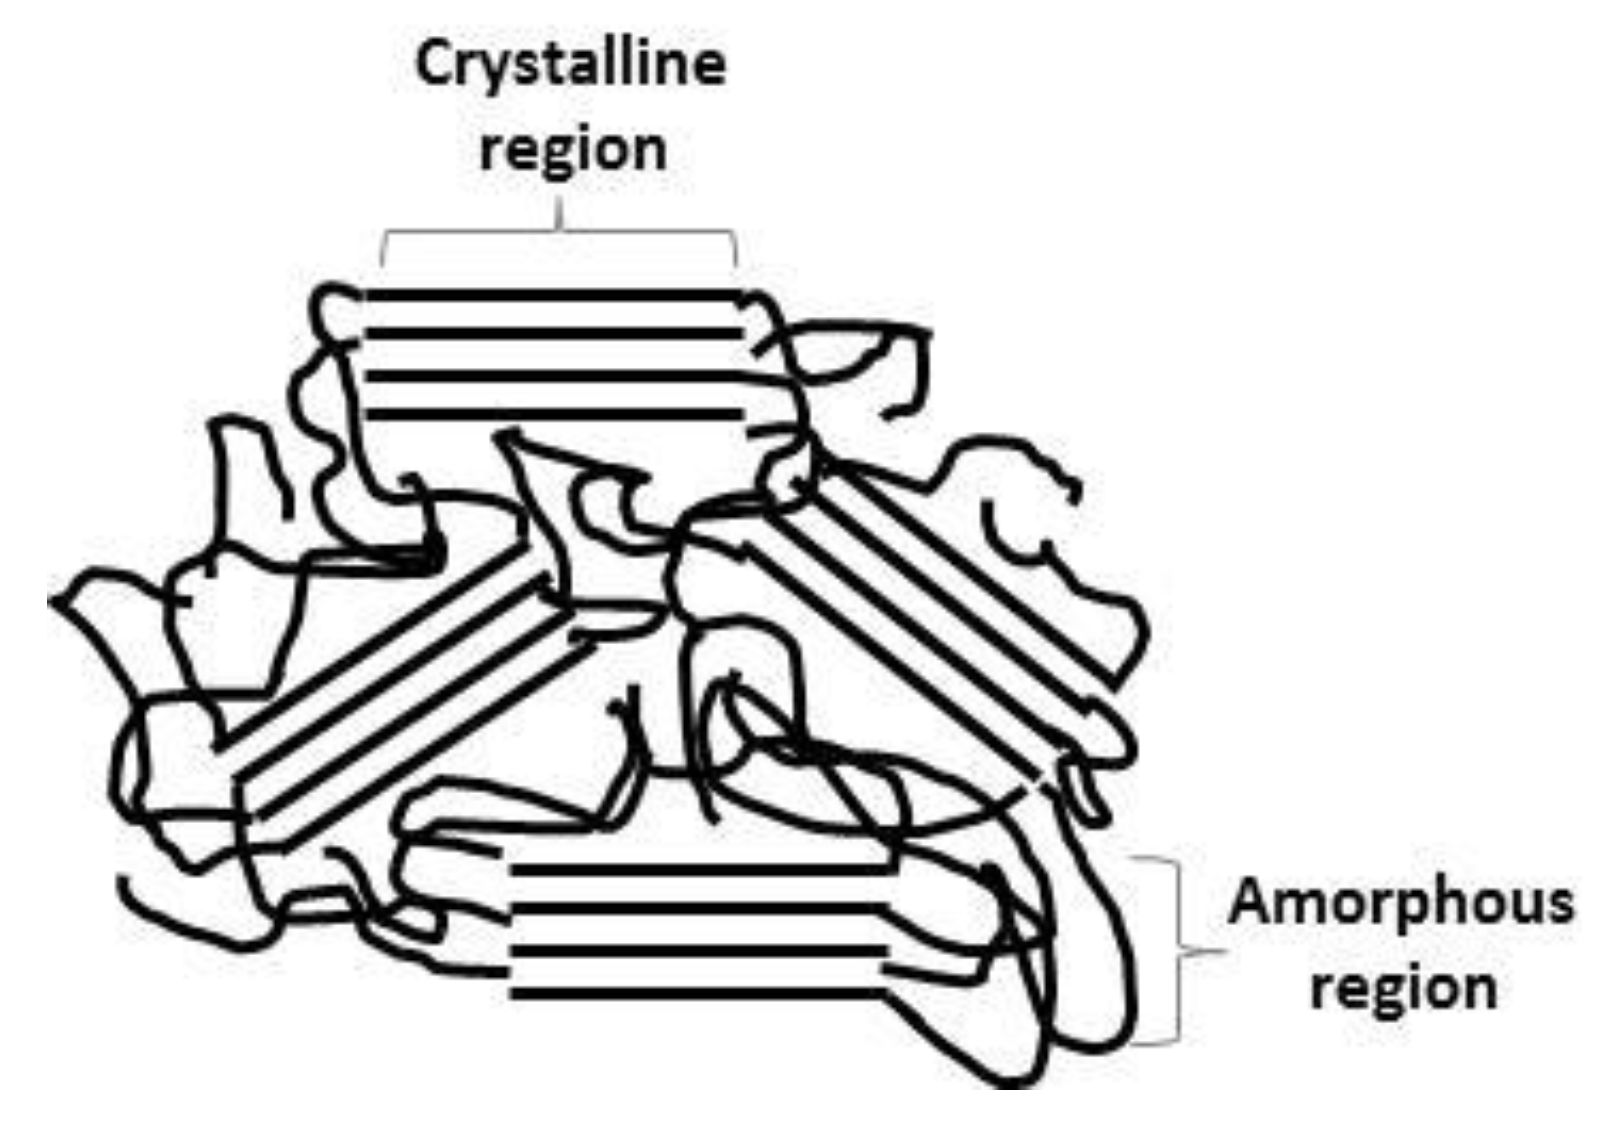
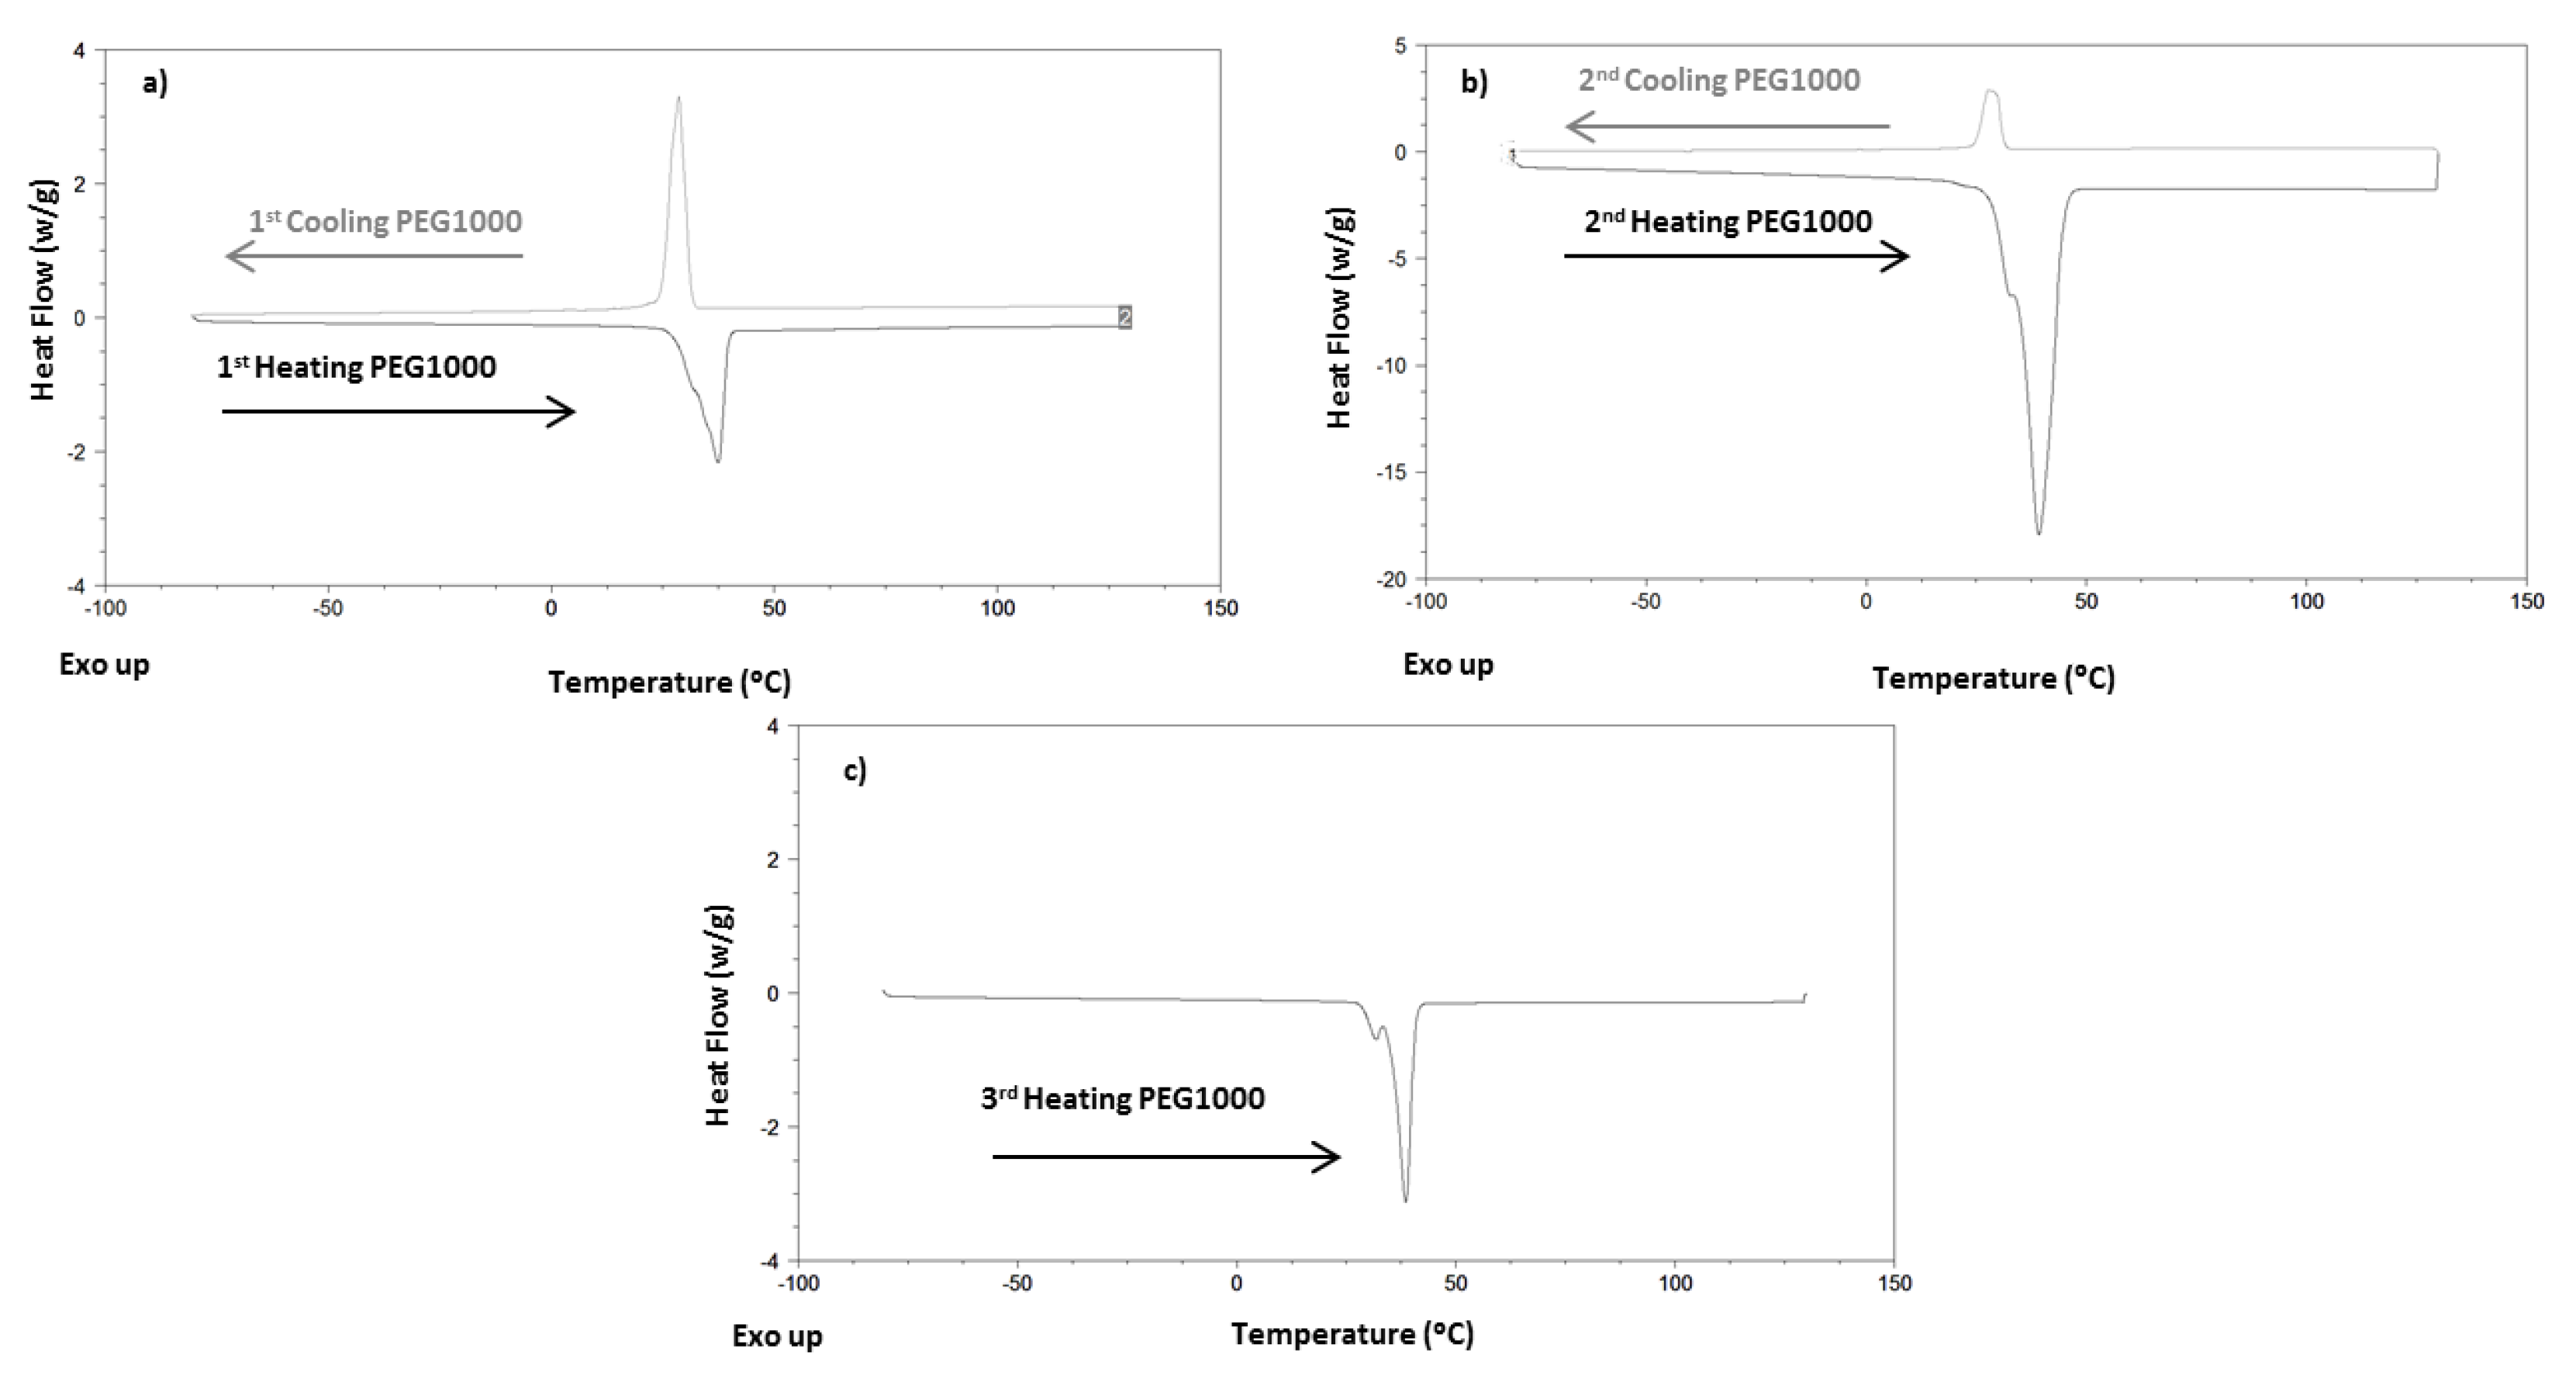
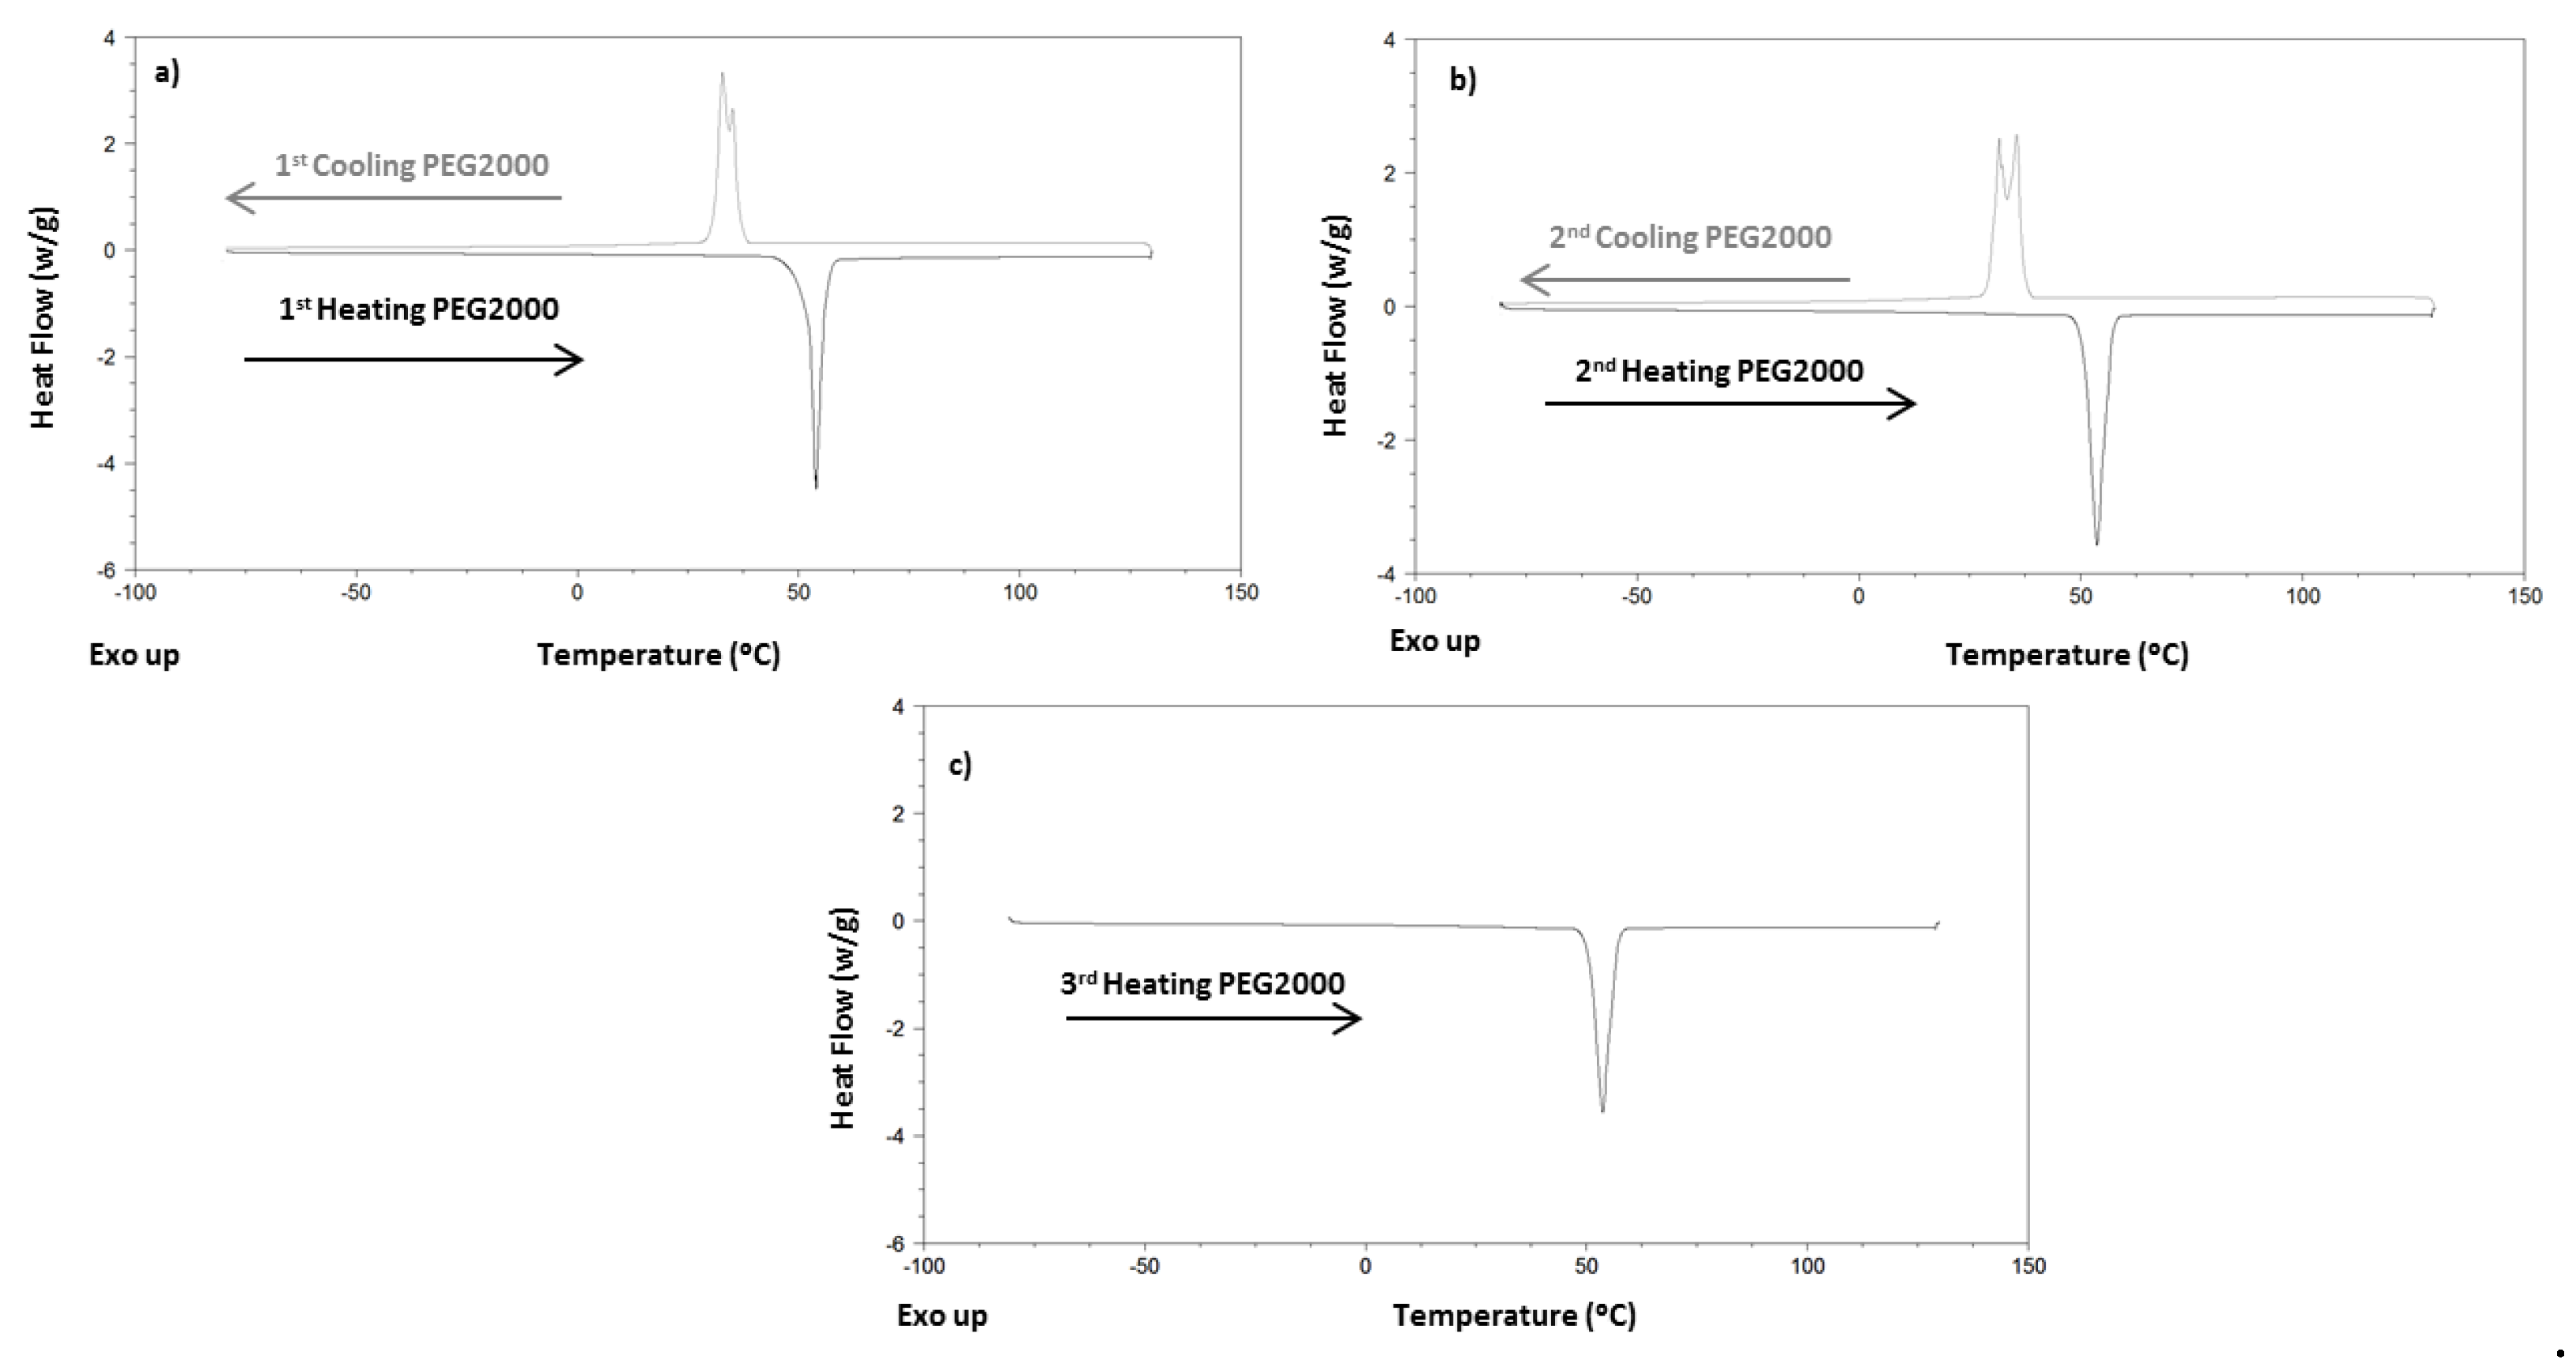
4.1. Differential Scan Calorimetry Results
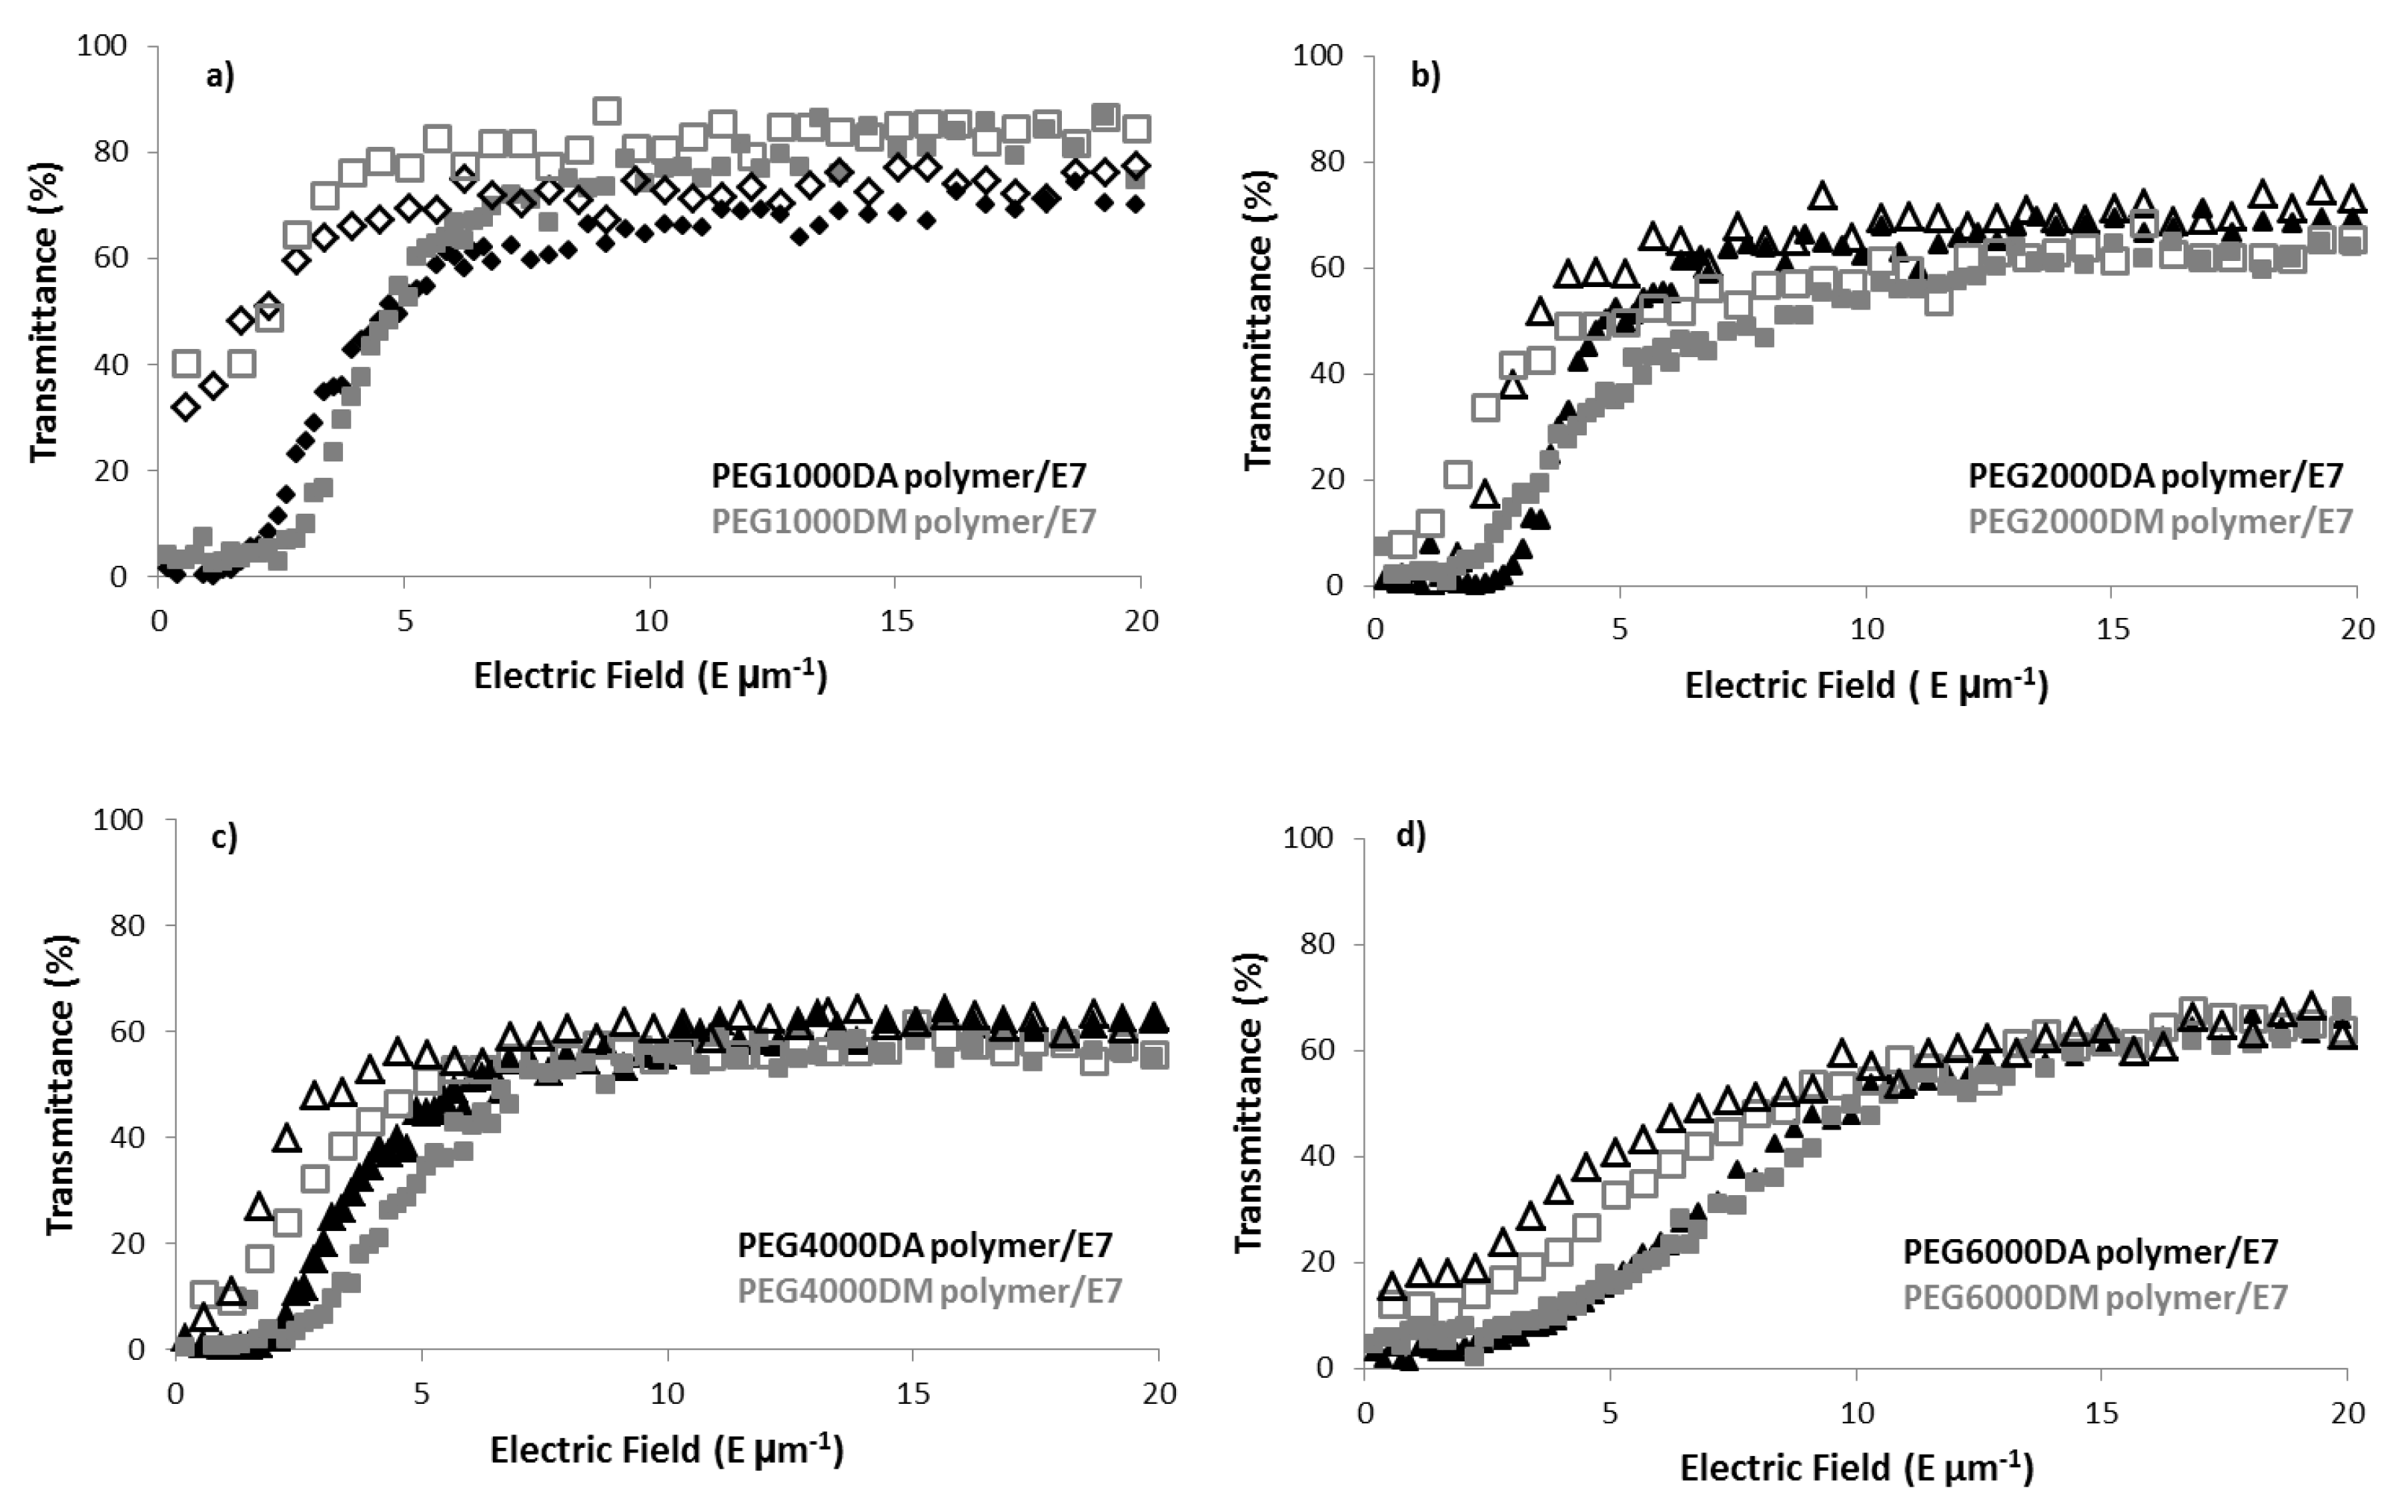
4.2. Electro-Optical Results
4.3. Polarized Optical Micrographs
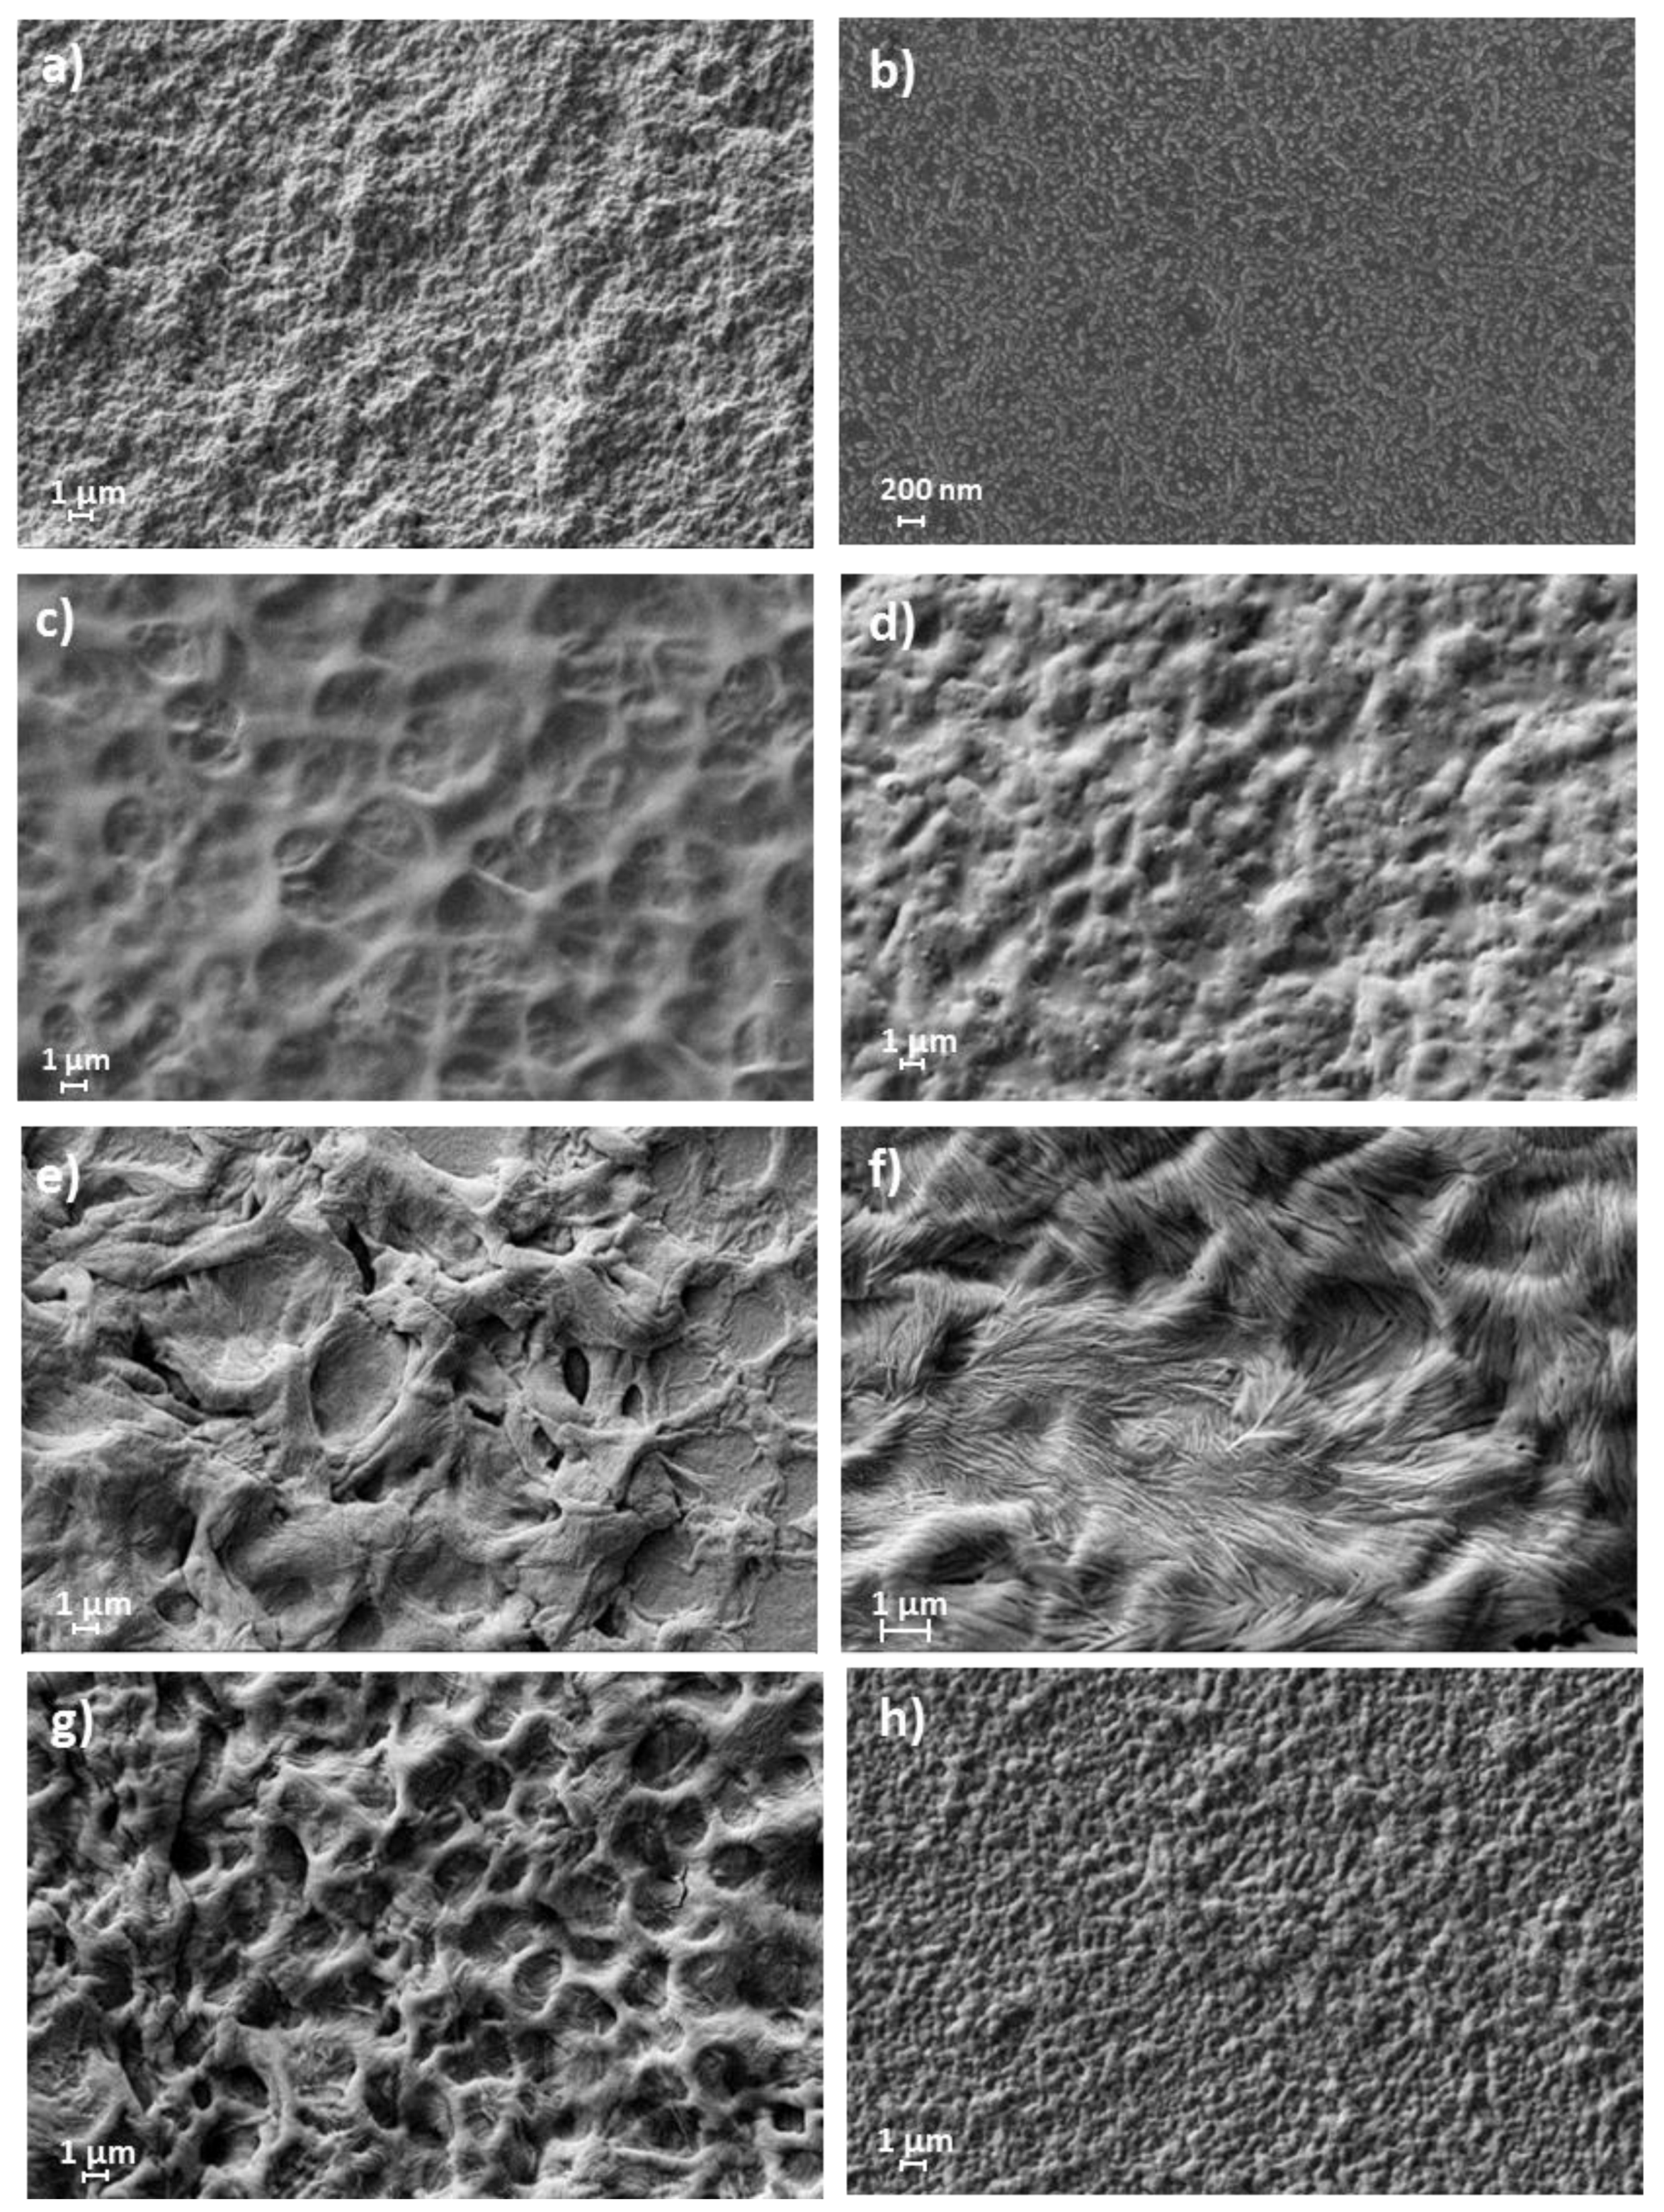
4.4. Scanning Electron Microscopy
5. Conclusions
Author Contributions
Funding
Data Availability Statement
Conflicts of Interest
References
- Shao, L.; Zhang, Y.; Liu, C.; Li, J.; Qin, A.; Wang, Y. Effect of graft polymer prepared by living radical polymerisation on electro-optical properties of polymer dispersed liquid crystal. Liq. Cryst. 2012, 39, 1458–1464. [Google Scholar] [CrossRef]
- Ravve, A. Principles of Polymer Chemistry; Springer: Berlin/Heidelberg, Germany, 2012. [Google Scholar]
- Strobl, G. The Physics of Polymers; Springer: Berlin/Heidelberg, Germany, 2007. [Google Scholar]
- Gedde, U.W. Polymer Physics; Springer: Berlin/Heidelberg, Germany, 2001. [Google Scholar]
- Priola, A.; Gozzelino, G.; Ferrero, F.; Malucelli, G. Properties of polymeric films obtained from u.v. cured poly(ethylene glycol) diacrylates. Polymer 1993, 34, 3653–3657. [Google Scholar] [CrossRef]
- Ward, I.M.; Sweeney, J. An Introduction to the Mechanical Properties of Solid Polymers; John Wiley & Sons, Ltd.: Hoboken, NJ, USA, 2004. [Google Scholar]
- Pielichowski, K.; Flejtuch, K. Differential scanning calorimetry studies on poly(ethylene glycol) with different molecular weights for thermal energy storage materials. Polym. Adv. Technol. 2002, 13, 690–696. [Google Scholar] [CrossRef]
- Godovsky, Y.K.; Slonimsky, G.L.; Garbar, N.M. Effect of molecular weight on the crystallization and morphology of poly(ethylene oxide) fractions. J. Poymer Sci. C 1972, 21, 1–21. [Google Scholar] [CrossRef]
- Gao, W.; Bai, Y.; Chen, E.; Zhou, Q. Crystallization and melting of poly(ethylene oxide) confined in nanostructured particles with cross-linked shells of polybutadiene. Chin. J. Polym. Sci. 2005, 23, 275–285. [Google Scholar] [CrossRef]
- Nishi, M.; Hikosaka, M.; Ghosh, S.K.; Toda, A.; Yamada, K. Molecular Weight Dependence of Primary Nucleation Rate of Polyethylene I. An Extended Chain Single Crystal. Polym. J. 1999, 31, 749–758. [Google Scholar] [CrossRef]
- Bower, D.I. An Introduction to Polymer Physics; Cambridge University Press: Cambridge, UK, 2002. [Google Scholar]
- Li, Y.; Ma, Q.; Huang, C.; Liu, G. Crystallization of Poly (ethylene glycol) in Poly (methyl methacrylate) Networks. Mater. Sci. 2013, 19, 147–151. [Google Scholar] [CrossRef]
- Qiao, C.; Jiang, S.; Dong, D.; Ji, X.; An, L.; Jiang, B. The Critical Lowest Molecular Weight for PEG to Crystallize in Cross-Linked Networks. Macromol. Rapid Commun. 2004, 25, 659–663. [Google Scholar] [CrossRef]
- Cheng, S.Z.D. Phase Transitions in Polymers; Elsevier: Amsterdam, The Netherlands, 2008. [Google Scholar]
- Raju, G.G. Dielectrics in Electric Fields; Marcel Dekker, Inc.: New York, NY, USA, 2003. [Google Scholar]
- Brás, A.R.E.; Henriques, S.; Casimiro, T.; Aguiar-Ricardo, A.; Sotomayor, J.; Caldeira, J.; Santos, C.; Dionísio, M. Characterization of a nematic mixture by reversed-phase HPLC and UV spectroscopy: An application to phase behaviour studies in liquid crystal-CO2 systems. Liq. Cryst. 2007, 34, 591–597. [Google Scholar] [CrossRef]
- Zhang, B.; Zhang, H.; Myers, B.K.; Elupula, R.; Jayawickramarajah, J.; Grayson, S.M. Determination of polyethylene glycol end group functionalities by combination of selective reactions and characterization by matrix assisted laser desorption/ionization time-of-flight mass spectrometry. Anal. Chim. Acta 2014, 816, 28–40. [Google Scholar] [CrossRef] [PubMed]
- Yu, D.; Vladimirov, N.; Fréchet, J.M.J. MALDI-TOF in the Characterizations of Dendritic−Linear Block Copolymers and Stars. Macromolecules 1999, 32, 5186–5192. [Google Scholar] [CrossRef]
- Lin-Gibson, S.; Bencherif, S.; Cooper, J.A.; Wetzel, S.J.; Antonucci, J.M.; Vogel, B.M.; Horkay, F.; Washburn, N.R. Synthesis and characterization of PEG dimethacrylates and their hydrogels. Biomacromolecules 2004, 5, 1280–1287. [Google Scholar] [CrossRef] [PubMed]
- Casey, B.K.; Lapucha, J.E.; Grayson, S.M.; Myers, B.K.; Lapucha, J.E.; Grayson, S.M. Synthesis and MALDI-ToF characterization of dendronized poly(ethylene glycol)s. Braz. J. Pharm. Sci. 2012, 49, 45–55. [Google Scholar]
- Ginés, J.M.; Arias, M.J.; Rabasco, A.M.; Novák, C. Thermal characterization of polyethylene glycols applied in the pharmaceutical technology using differential scanning calorimetry and hot stage microscopy. J. Therm. Anal. 1996, 46, 291–304. [Google Scholar] [CrossRef]
- Craig, D.Q.M.; Newton, J.M. Characterisation of polyethylene glycols using differential scanning calorimetry. Int. J. Pharm. 1991, 74, 33–41. [Google Scholar] [CrossRef]
- Santos, R.; Silva, M.C.; Mouquinho, A.; Sotomayor, J. Full permanent memory effects in PDLC films. Mol. Cryst. Liq. Cryst. 2015, 611, 123–131. [Google Scholar] [CrossRef]
- Mouquinho, A.; Luís, N.; Sotomayor, J. New polymer to enhance the permanent memory effect of polymer-dispersed liquid crystals films. J. Appl. Polym. Sci. 2016, 133, 43482. [Google Scholar] [CrossRef]
- Drzaic, P.S. Liquid Crystal Dispersions; Ong, H.L., Ed.; World Scientific Publishing: Singapore, 1995. [Google Scholar]


| [Macromolecule+Na]+ | Mn | Mw | PDI | |||
|---|---|---|---|---|---|---|
| Observed | Theoretical | Observed | Theoretical | Observed | Theoretical | |
| [PEG1000+Na]+ | 1011.34 | - | 1044.01 | - | 1.03 | - |
| [PEG1000DA+Na]+ | 1062.75 | 1062.68 | 1084.73 | 1084.67 | 1.02 | 1.02 |
| [PEG1000DM+Na]+ | 1137.92 | 1137.74 | 1156.87 | 1156.69 | 1.02 | 1.02 |
| [PEG2000+Na]+ | 1940.94 | - | 1963.25 | - | 1.01 | - |
| [PEG2000DA+Na]+ | 2013.90 | 2013.89 | 2033.02 | 2033.02 | 1.01 | 1.01 |
| [PEG2000DM+Na]+ | 1998.66 | 1998.81 | 2021.92 | 2022.01 | 1.01 | 1.01 |
| [PEG4000+Na]+ | 4097.09 | - | 4127.30 | - | 1.01 | - |
| [PEG4000DA+Na]+ | 4192.30 | 4192.13 | 4221.02 | 4220.87 | 1.01 | 1.01 |
| [PEG4000DM+Na]+ | 4202.99 | 4201.59 | 4231.52 | 4228.36 | 1.01 | 1.01 |
| [PEG6000+Na]+ | 6235.73 | - | 6264.05 | - | 1.01 | - |
| [PEG6000DA+Na]+ | 6276.09 | 6277.45 | 6308.06 | 6305.82 | 1.01 | 1.01 |
| [PEG6000DM+Na]+ | 6254.18 | 6255.21 | 6278.75 | 6279.79 | 1.00 | 1.00 |
| [Macromolecule+Na]+ | n | Calculated m(n) | Experimental m(n) |
|---|---|---|---|
| [PEG1000+Na]+ | 22 | 1010.17 | 1009.49 |
| [PEG1000DA+Na]+ | 22 | 1118.27 | 1117.56 |
| [PEG1000DM+Na]+ | 21 | 1102.27 | 1101.65 |
| [PEG2000+Na]+ | 43 | 1935.28 | 1934.13 |
| [PEG2000DA+Na]+ | 41 | 1955.27 | 1954.09 |
| [PEG2000DM+Na]+ | 42 | 2027.38 | 2025.97 |
| [PEG4000+Na]+ | 91 | 4049.83 | 4049.67 |
| [PEG4000DA+Na]+ | 92 | 4201.98 | 4201.87 |
| [PEG4000DM+Na]+ | 92 | 4230.03 | 4230.51 |
| [PEG6000+Na]+ | 142 | 6296.53 | 6297.09 |
| [PEG6000DA+Na]+ | 137 | 6184.36 | 6184.65 |
| [PEG6000DM+Na]+ | 138 | 6256.47 | 6256.15 |
| [Macromolecule+Na]+ | Mn | Mw | PDI | |||
|---|---|---|---|---|---|---|
| Observed | Theoretical | Observed | Theoretical | Observed | Theoretical | |
| [PEG2000A+Na]+ | 1975.06 | 1975.07 | 1985.35 | 1985.34 | 1.01 | 1.01 |
| [PEG4000A+Na]+ | 3873.62 | 3872.15 | 3876.69 | 3876.69 | 1.01 | 1.00 |
| [PEG4000M+Na]+ | 4276.44 | 4275.73 | 4287.69 | 4286.97 | 1.00 | 1.00 |
| Cooling Scan | Heating Scan | ||||||
|---|---|---|---|---|---|---|---|
| Sample | Glass Transition | Melt-Crystallization | Glass Transition | Melting | |||
| scan | Tg/°C | Tc/°C | ∆Hcr/J g-1 | Tg/°C | Tm/°C | ∆Hm/J g−1 | |
| PEG1000 | I | - | 28.61 | 152.8 | 37.37 | 153.8 | |
| II | - | 27.73 | 154.6 | 31.59/38.55 | 160.5 | ||
| III | 38.50 | 161.3 | |||||
| PEG1000DA oligomer | I | - | - | - | 36.66 | 127.1 | |
| PEG1000DA polymer | I | −50.68 | - | - | −48.41 | - | - |
| II | −51.56 | - | - | −48.50 | - | - | |
| PEG1000DM oligomer | I | - | - | - | - | 23.52 | 101.8 |
| PEG1000DM polymer | I | −51.00 | - | - | −45.71 | - | - |
| II | −51.09 | - | - | −44.89 | - | - | |
| PEG2000 | I | - | 32.79 | 163.5 | - | 53.96 | 174.8 |
| II | - | 35.52 | 163.8 | - | 53.67 | 166.6 | |
| III | - | - | - | - | 53.65 | 166.6 | |
| PEG2000DA oligomer | I | - | - | - | - | 52.25 | 141.8 |
| PEG2000DA polymer | I | - | 24.65 | 70.24 | - | 41.64 | 69.28 |
| II | 24.88 | 75.05 | - | 42.25 | 70.52 | ||
| PEG2000DM oligomer | I | - | - | - | - | 55.38 | 140.9 |
| PEG2000DM polymer | I | - | 24.65 | 70.24 | 41.64 | 69.28 | |
| II | - | 24.88 | 75.05 | 42.25 | 70.52 | ||
| PEG4000 | I | - | 41.58 | 180.8 | 62.27 | 199.4 | |
| II | - | 41.95 | 181.5 | 61.36 | 186.0 | ||
| III | - | - | - | 61.36 | 186.7 | ||
| PEG4000DA oligomer | I | - | - | - | - | 57.91 | 176.2 |
| PEG4000DA polymer | I | - | 24.92 | 72.32 | - | 41.43 | 72.05 |
| II | - | 25.24 | 73.21 | - | 41.59 | 73.69 | |
| PEG4000DM oligomer | I | - | - | - | - | 50.36 | 134.8 |
| PEG4000DM polymer | I | - | 16.78 | 55.61 | - | 35.42 | 52.93 |
| II | - | 18.56 | 58.85 | - | 35.42 | 52.93 | |
| PEG6000 | I | - | 38.90 | 164.4 | - | 62.91 | 171.5 |
| II | - | 38.46 | 163.2 | - | 62.80 | 168.85 | |
| III | - | - | - | - | 62.87 | 167.9 | |
| PEG6000DA oligomer | I | - | - | - | - | 59.01 | 76.31 |
| PEG6000DA polymer | I | - | 31.06 | 74.87 | - | 42.63 | 76.31 |
| II | - | 31.53 | 76.67 | - | 42.97 | 77.14 | |
| PEG6000DM oligomer | I | - | - | - | - | 54.88 | 149.5 |
| PEG6000DM polymer | I | - | 38.81 | 80.14 | - | 48.34 | 77.85 |
| II | 34.83 | 86.52 | - | 49.14 | 77.79 | ||
| PDLC Polymer | T0 (%) | TOFF (%) | Tmax (%) | PME (%) | MSC (%) | E90 (V µm−1) |
|---|---|---|---|---|---|---|
| PEG1000DA | 1.6 | 32 | 73 | 43 | 31 | 8.63 |
| PEG1000DM | 5.3 | 30 | 84 | 31 | 24 | 11.78 |
| PEG2000DA | 0.9 | 1.5 | 67 | 0.9 | 0.6 | 6.15 |
| PEG2000DM | 7.3 | 8.7 | 65 | 2.5 | 1.4 | 10.53 |
| PEG4000DA | 2.7 | 6 | 56 | 5.5 | 3.3 | 5.5 |
| PEG4000DM | 0.3 | 10 | 57 | 17 | 9.7 | 7.02 |
| PEG6000DA | 1.8 | 15.6 | 64 | 22 | 14 | 13.76 |
| PEG6000DM | 4.7 | 12.3 | 63 | 13 | 7.6 | 13.45 |
Disclaimer/Publisher’s Note: The statements, opinions and data contained in all publications are solely those of the individual author(s) and contributor(s) and not of MDPI and/or the editor(s). MDPI and/or the editor(s) disclaim responsibility for any injury to people or property resulting from any ideas, methods, instructions or products referred to in the content. |
© 2024 by the authors. Licensee MDPI, Basel, Switzerland. This article is an open access article distributed under the terms and conditions of the Creative Commons Attribution (CC BY) license (https://creativecommons.org/licenses/by/4.0/).
Share and Cite
Mouquinho, A.; Barros, M.T.; Sotomayor, J. Pre-Polymer Chain Length: Influence on Permanent Memory Effect of PDLC Devices. Crystals 2024, 14, 249. https://doi.org/10.3390/cryst14030249
Mouquinho A, Barros MT, Sotomayor J. Pre-Polymer Chain Length: Influence on Permanent Memory Effect of PDLC Devices. Crystals. 2024; 14(3):249. https://doi.org/10.3390/cryst14030249
Chicago/Turabian StyleMouquinho, Ana, Maria Teresa Barros, and João Sotomayor. 2024. "Pre-Polymer Chain Length: Influence on Permanent Memory Effect of PDLC Devices" Crystals 14, no. 3: 249. https://doi.org/10.3390/cryst14030249