Abstract
Lignin, which contains aromatic phenols, is the second most abundant renewable biomass material in the world. It is the main byproduct of the paper industry and is characterized by abundant sources, renewability, and low cost. The present study focused on the extraction of lignin from poplar wood through a straightforward papermaking approach, thereafter utilizing the resultant black liquor containing lignin for synthesizing lignin-based phenolic resins. During the polymerization process, cobalt (Co) and nickel (Ni) species were introduced and, subsequently, a CoNi/biochar catalyst was obtained through pyrolysis in a nitrogen atmosphere. The prepared catalyst possessed rough spherical structures. The incorporation of Co and Ni enhanced charge redistribution, thereby imparting the catalyst with strong electron acceptance capabilities. The prepared lignin-based phenolic-resin-derived carbon was used for the electrochemical sensing of 2-nitrophenol. The limit of detection (LOD) for 2-nitrophenol was calculated to be 0.0132 µM, with good repeatability, stability, and selectivity.
1. Introduction
Lignin is an abundant renewable natural resource [1]. It is a biopolymer characterized by a highly branched three-dimensional structure, encompassing various functional groups, including hydroxyl (OH), methoxy, carbonyl (C=O), and carboxyl (COOH) groups [2]. Primarily composed of guaiacol, eugenol, and p-hydroxyphenyl units, lignin boasts a diverse array of applications in the chemical industry. It serves as a precursor for producing carbon fiber [3], polyurethane [4], rubber [5], and phenolic chemicals owing to the presence of phenolic groups [6]. Furthermore, lignin finds utility as a phenolic resin substitute, aiding in the mitigation of toxic substances within final products derived from petroleum-based resins [7]. Recent advancements in sustainable chemical technologies have facilitated the utilization of low-cost bio-oils, typically obtained through the rapid pyrolysis of lignocellulosic biomass [8]. These bio-oils serve as a viable alternative for partially replacing phenol in the production of bio-based phenolic resins. Black liquor serves as the primary source of lignin in the papermaking industry, and utilizing a substantial amount of waste black liquor not only offers significant environmental benefits, but also attracts widespread attention. The derived biomass carbon (C) materials are valued for their rich surface functional groups, easy availability of raw materials, and renewability.
In recent years, metal catalysts have gained widespread adoption owing to their exceptional catalytic activity and conductivity. Among them, heterogeneous bimetallic alloy nanoparticles have garnered considerable attention as electrocatalysts, exhibiting enhanced activity and electrochemical performance [9]. The utilization of bimetallic alloys serves to increase the surface area, boost electrocatalytic activity, enhance biocompatibility, and facilitate electron transfer through synergistic effects [10]. These attributes render heterogeneous bimetallic alloy nanoparticles as highly promising materials in the field. Notably, due to synergistic interactions, bimetallic nanomaterials have been deemed to be more electroactive compared to their single-metal counterparts [11]. Moreover, the incorporation of carbon materials reduces the cost associated with metal utilization and, leveraging the abundance and excellent conductivity of C materials, the C in metal/C composites can act as a support, facilitating the even dispersion of metal particles and enhancing their utility [12]. Metal alloy nanoparticles can function as active sites and separator layers within C-based materials during electrocatalytic processes, thus accelerating electrolyte diffusion and ensuring optimal electrode-electrolyte contact [13]. Therefore, they are often doped metals in C-based materials.
2-Nitrophenol, widely employed in many industries, serves as an intermediate in the production of pesticides, pharmaceuticals, explosives, dyes, pigments, rubber chemicals, photographic chemicals, wood preservatives, and fungicides [14]. However, it is already recognized as a hazardous substance, posing a threat to soil and groundwater due to its high toxicity, even at low concentrations. Its significant stability and solubility in water raise considerable concerns as it proves harmful to nearly all forms of life, including animals and plants. In recent years, scientists have employed a range of techniques for its detection, including gas chromatography [15], capillary electrophoresis [16], UV-visible spectrophotometry [17], fluorescence detection [18], and liquid chromatography [19]. However, these methods are challenging to implement as they entail complex and time-consuming preparation processes involving extraction, absorption, and separation. Electrochemical sensors have emerged as an optimal choice among these detection methods because of their high sensitivity, affordability, and rapid response times [20]. Consequently, designing and fabricating electrode materials that offer high sensitivity and stability at a low cost has remained a focal point of research in this field.
The preparation of C-based materials into spherical shapes enhances their chemical stability and improves their conductivity and electrocatalytic performance [21]. The large number of oxygen-containing functional groups on its surface can provide more active sites, which is conducive to the adsorption of nitroaromatic hydrocarbons, making the C spheres more electrochemically reactive with 2-nitrophenol [22]. Zhou et al. have used doped nitrogen and gold on the surface of C spheres, and prepared C spheres with rich surface functional groups, which gave the catalyst the ability to adsorb nitroaromatic hydrocarbons [23]. Zang et al. fabricated a sensitive electrochemical sensor using ordered mesoporous C (OMC) to detect trace amounts of nitroaromatic explosives. It has been found that the high performance of OMC in sensing 2,4,6-trinitrotoluene is attributed to its large specific surface area, with much superior conductivity and fast electron transfer capability [24]. Pan et al. prepared hydroxyl-rich C submicrospheres (HCSs) that exhibit the highest current response to nitrobenzene (NB) on the HCS-modified electrode. The excellent sensing performance is attributed to the abundant hydroxyl groups, which facilitate the formation of H-bonding and charge-transfer interactions between electron-donating hydroxyl groups on HCSs and electron-deficiency nitroaromatic molecules [25].
In this study, lignin-based phenolic resin (PF) was synthesized using black liquor containing a large amount of lignin as a raw material. This was polymerized with formaldehyde to prepare Co and Ni lignin-based phenolic resin C (CoNi-PFC) composites by a water bath polymerization method and pyrolysis. This produced a green, efficient, and easy-to-produce composite modified electrode that was successfully used for the electrochemical detection of 2-nitrophenol.
2. Reagents and Instruments
Poplar wood chips were sourced from Linyi City (Shandong Province, China). All reagents were analytically pure and did not undergo additional purification before use. The phosphate buffer solutions (CPB) of various pHs were prepared by mixing different volumes of 0.2 M Na2HPO4 and 0.1 M citric acid solution. Tap water was taken from the laboratory, Shandong University of Technology (Shandong, China).
The FT-IR was performed on a Nicolet 5700 (Thermo Nicolet Instruments Co., Ltd., Madison, WI, USA). Scanning electron microscopic imaging was conducted using a Sirion 200 (FEI Co., Ltd., Hillsboro, OR, USA). Transmission electron microscopic (TEM) images of the samples were obtained at 200 kV using an FEI Tecnai G2T20 (Thermo Fisher Scientific Co., Pittsburgh, PA, USA). X-ray diffraction (XRD) images of the samples were obtained using a Rigaku Ultima IV (Rigaku Corp., Ltd., Tokyo, Japan). Raman spectra were captured using a miniature Raman spectrometer (Horiba Ltd., Kyoto, Japan) at 532 nm. X-ray photoelectron spectroscopy was performed using a Thermo Scientific K-Alpha+ (Thermo Fisher Scientific Co.) calibrated against the C-1s peak (284.8 eV).
Electrochemical characterization was carried out using cyclic voltammetry (CV) and differential pulse voltammetry (DPV) using a CHI660E electrochemical workstation. A three-electrode system was employed for the experiments, with a glassy C electrode (GCE) serving as the working electrode, a platinum wire electrode as the counter electrode, and a saturated calomel electrode (SCE) as the reference electrode. The GCE (d = 3 mm) or PFC composite-modified GCE was used as the working electrode. Prior to the modification process, the GCE was sequentially polished with a 1 mm, 0.3 mm, and 0.05 m alumina/water slurry. In addition, homogeneous ink containing 2 mg PFC, 1 mL water, and 5 µL Nafion (5 wt%) was obtained via a subsequent ultrasonication treatment of 30 min. A PFC-modified electrode was prepared via the drop casting method with 5 µL of ink. The electrode was stored under N2 atmosphere at room temperature (~25 °C). All electrochemical tests were carried out at a constant temperature (25 °C).
3. Results and Discussion
3.1. Morphology and Structure
To confirm the successful utilization of lignin phenolic in black liquor with formaldehyde to synthesize the lignin-based phenolic resin polymer, FT-IR testing was conducted (Figure S1 and Table S1). The methylene bridge absorption peak at 1460 cm−1 vanished as a result of its polymerization with formaldehyde [26]. Due to the inclusion of hydroxyethyl cellulose, the 1654 cm−1 band was attributed to the ring stretching of glucose [27]. Bands at 1220 cm−1 shown by PF and CoNi-PF were related to the presence of C-O stretching vibrations of phenolic C-OH and C-O(Ar) in both guaiacyl and syringyl types of lignin and, in the 1030 cm−1 band in PF, CoNi-LPF spectra were attributed to the presence of C-O stretching vibrations of aliphatic C-OH, aliphatic C-O(Ar), and methylol C-OH in syringyl type of lignin [28,29]. Bands at 1375 cm−1 were assigned to phenolic OH stretching vibrations. The lignin spectrum always showed a high peak, but in curves a and b, this peak was decreased, which indicated that phenolic OH and formaldehyde successfully synthesized phenolic resins [30,31].
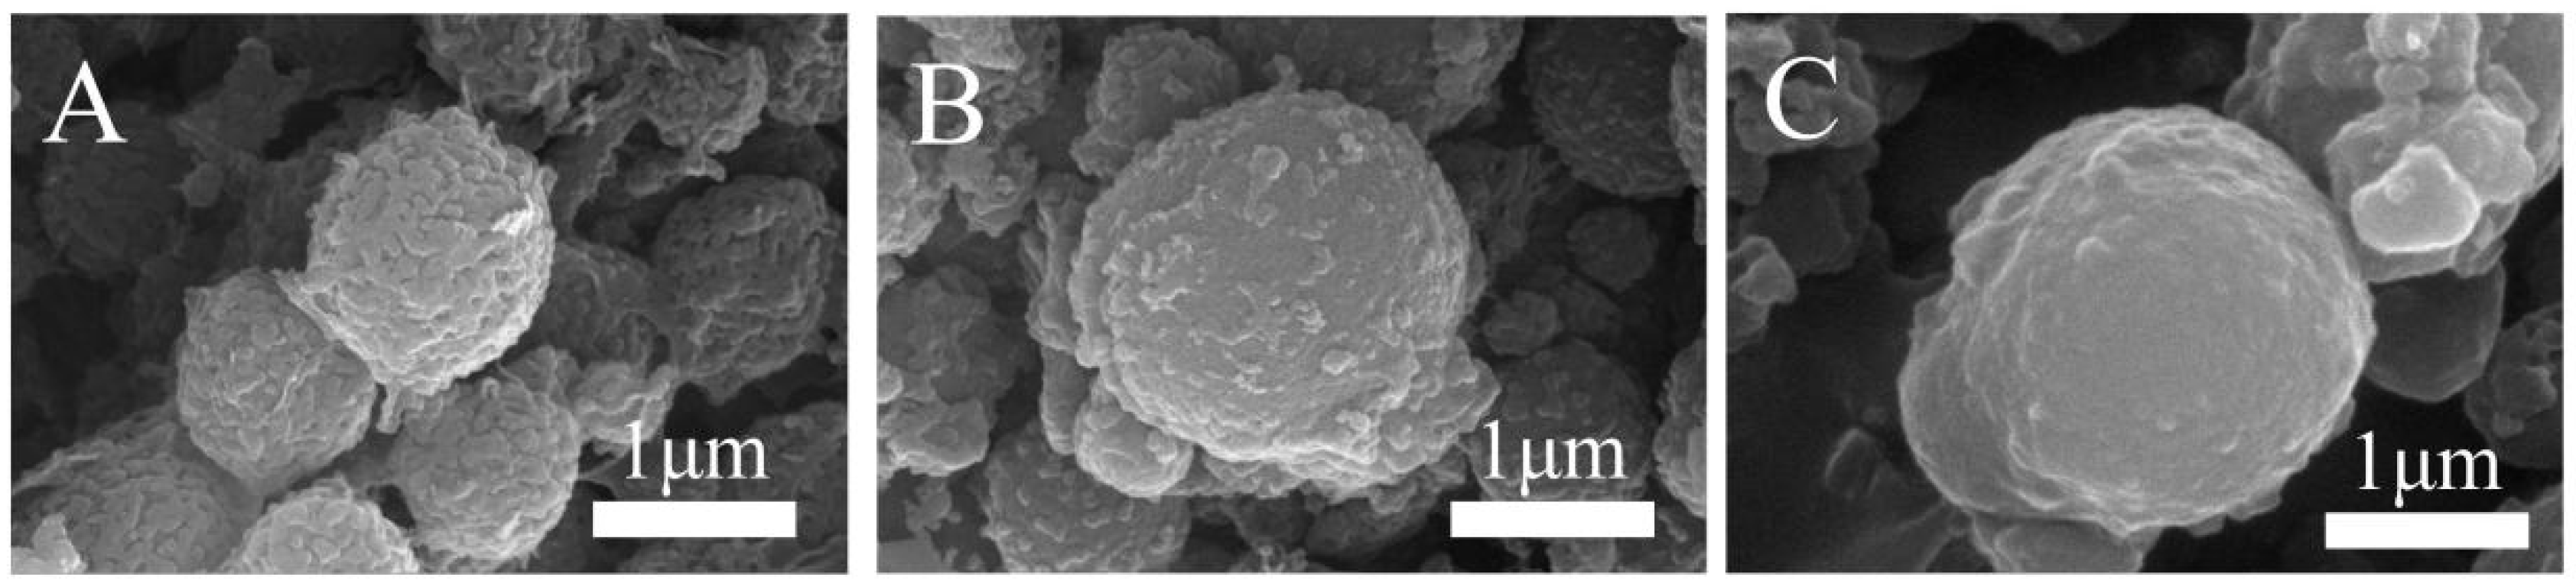
The SEM of PF, PFC, and CoNi-PFC showed that the surface roughness observed on phenolic spheres was attributed to the inclusion of the surfactant hydroxyethyl cellulose, an amphiphilic polymer (Figure 1B,C). Its adsorption onto the surface of the microspheres served to decrease the surface energy of microspheres within the system, thereby stabilizing their state and conducive to the formation of good morphology of the products [32]. The carbonization of PF microspheres and CoNi-PF microspheres (Figure 2B,C) showed that, even after carbonization, the phenolic microspheres retained their rough surface.
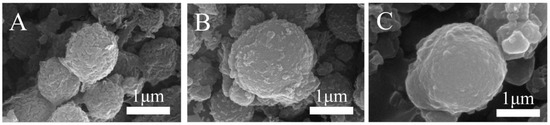
Figure 1.
SEM images of PF (A), PFC (B), and CoNi-PFC (C).
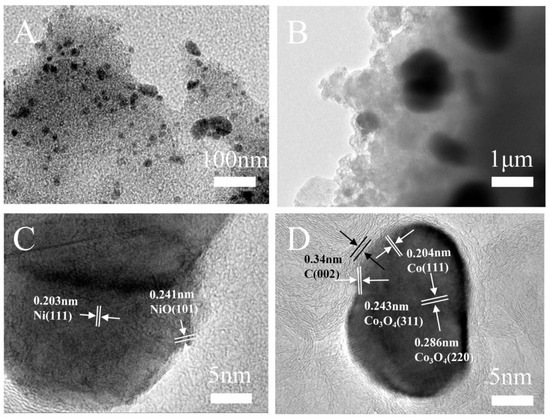
Figure 2.
TEM images of CoNi-PFC with different magnifications (A–D).
The structure of CoNi-PFC revealed that CoNi nanoparticles were uniformly distributed on C (Figure 2A,B). The lattice spacings of 0.203 nm were assigned to the (111) planes of Ni and the lattice spacings of 0.241 nm assigned to the (101) planes of NiO (Figure 2C) [33]. The lattice spacings of 0.204, 0.243, and 0.286 nm corresponded to the (111) crystal plane of Co and the (311) plane and (220) crystal planes of Co3O4, respectively (Figure 2D) [34,35]. The (002) crystal plane of graphite C corresponded to a lattice spacing of 0.34 nm [36], which suggested that the nanoparticles were composed of Co, Co3O4, Ni, and NiO. The successful doping of Co and Ni was evidenced by the even distribution of C, N, O, Co, and Ni across the mapped surfaces, and metallic Co and Ni did not exhibit agglomeration (Figure S3A–F).
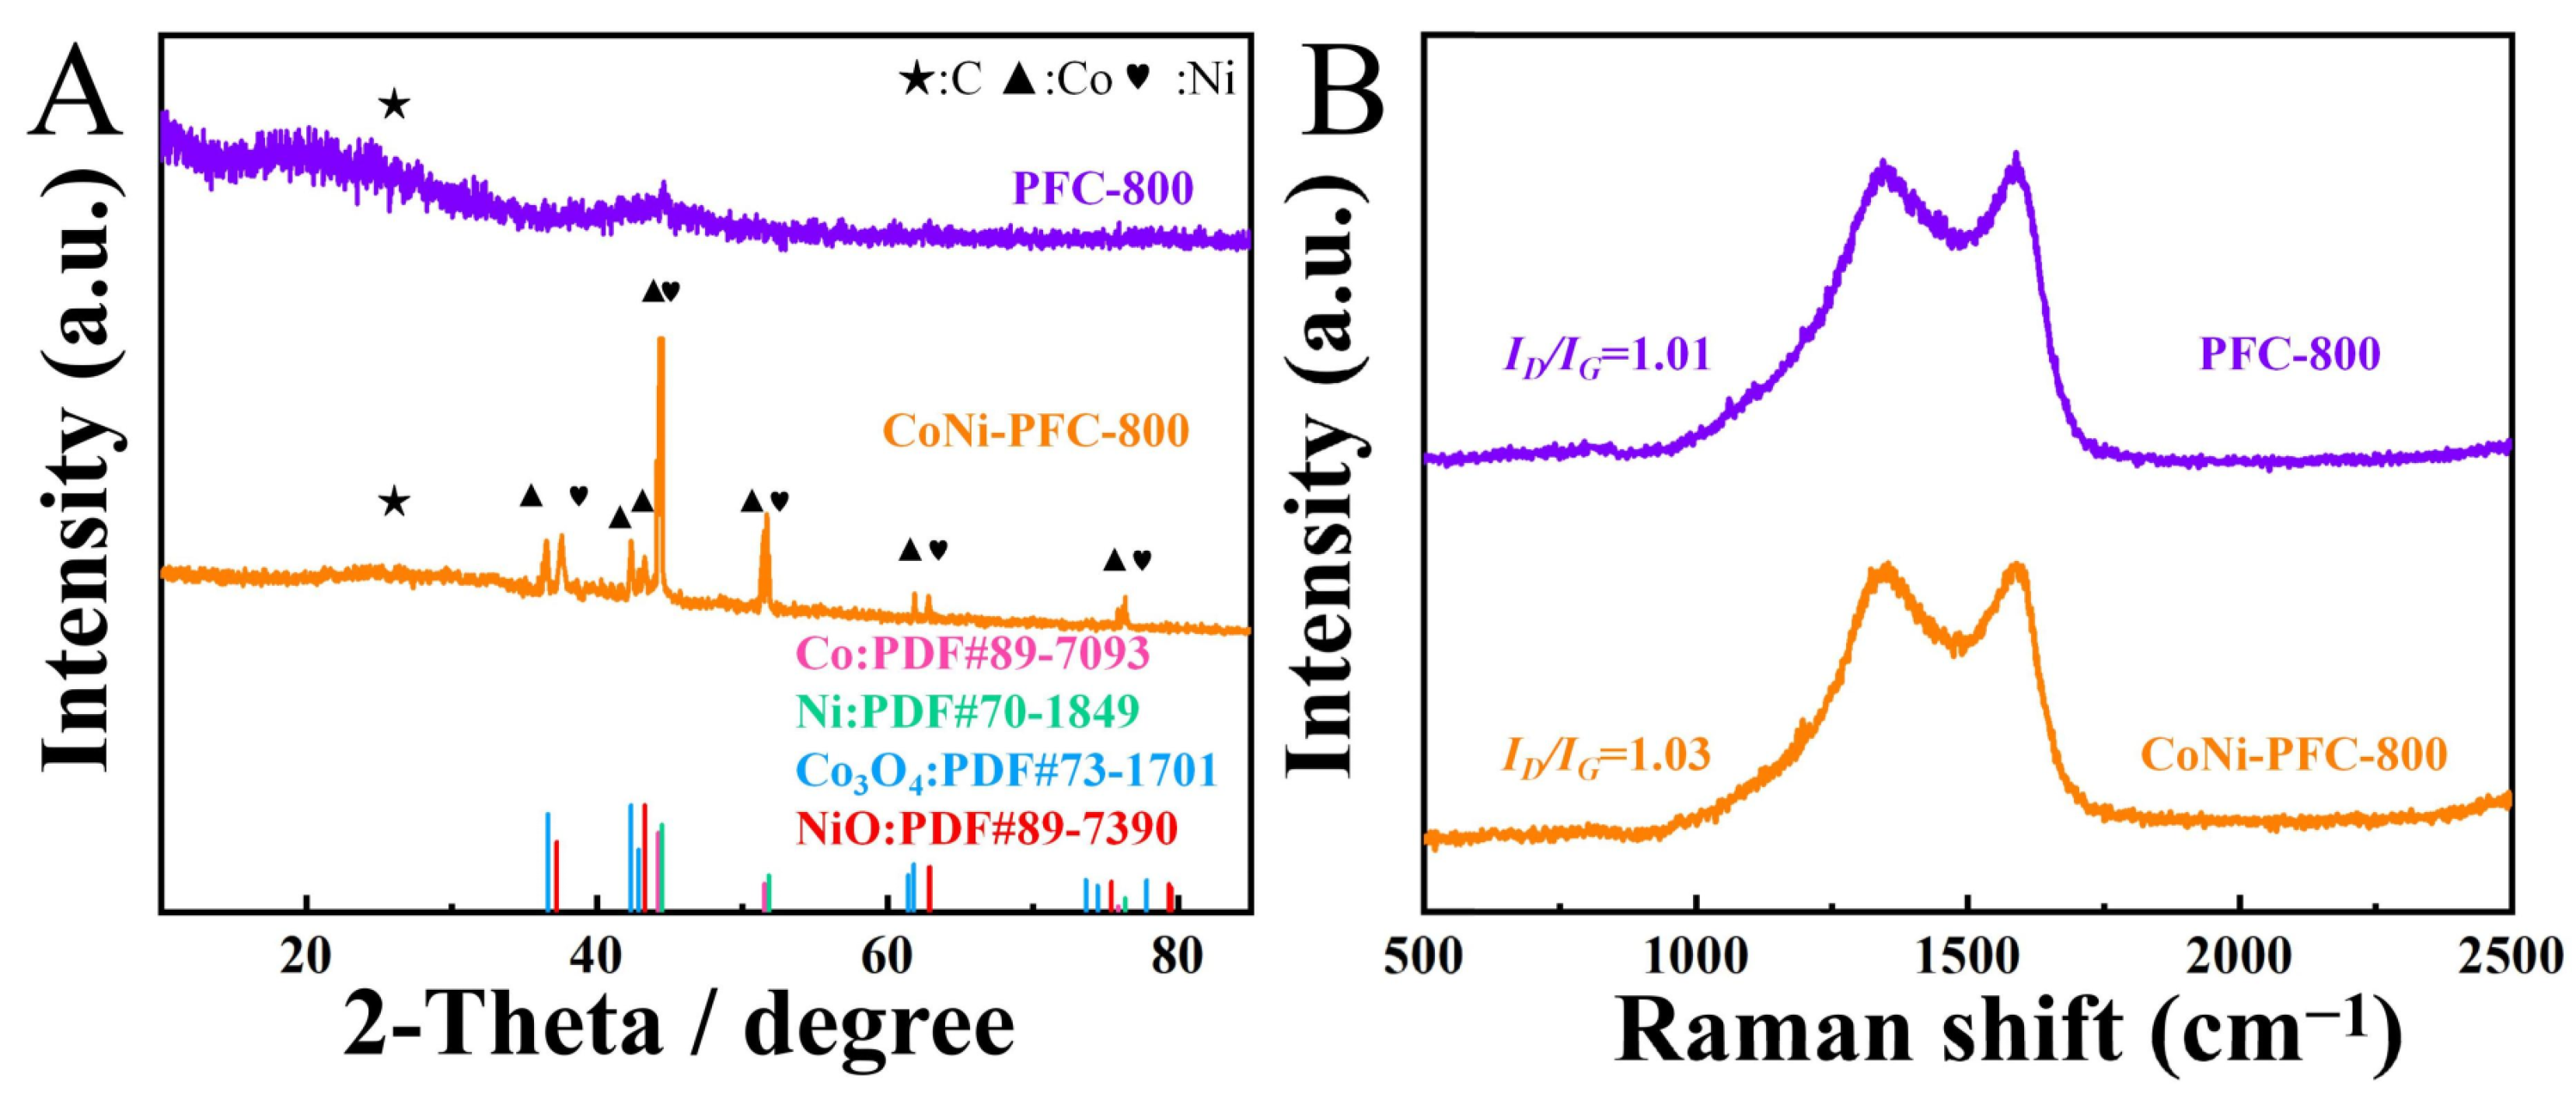
The crystal phase of the material was analyzed using XRD (Figure 3A). The diffraction peaks of PFC and CoNi-PFC at 26.4° indicated the graphite C (002) crystal plane (PDF#26-1080) [37]. Both samples exhibited similar broad peaks at 22.5°, indicating a lower degree of surface C graphitization. This observation was likely due to the presence of defects in the material [38].
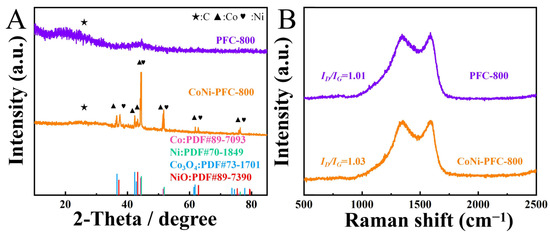
Figure 3.
PFC and CoNi-PFC (A). Raman images of PFC and CoNi-PFC (B).
Raman spectra of PFC and CoNi-PFC were evaluated to determine the degree of graphitization of C materials according to the values of ID/IG (Figure 3B). The ID/IG value of CoNi-PFC was 1.03, which was higher than the value of PFC, at 1.01. This difference was attributed to the presence of CoNi in the pyrolysis process, which affected the graphitization process of C materials and led to more defects. It is generally believed that an increase in defects often results in more exposed active sites, which would be beneficial for improving catalytic activity [39].
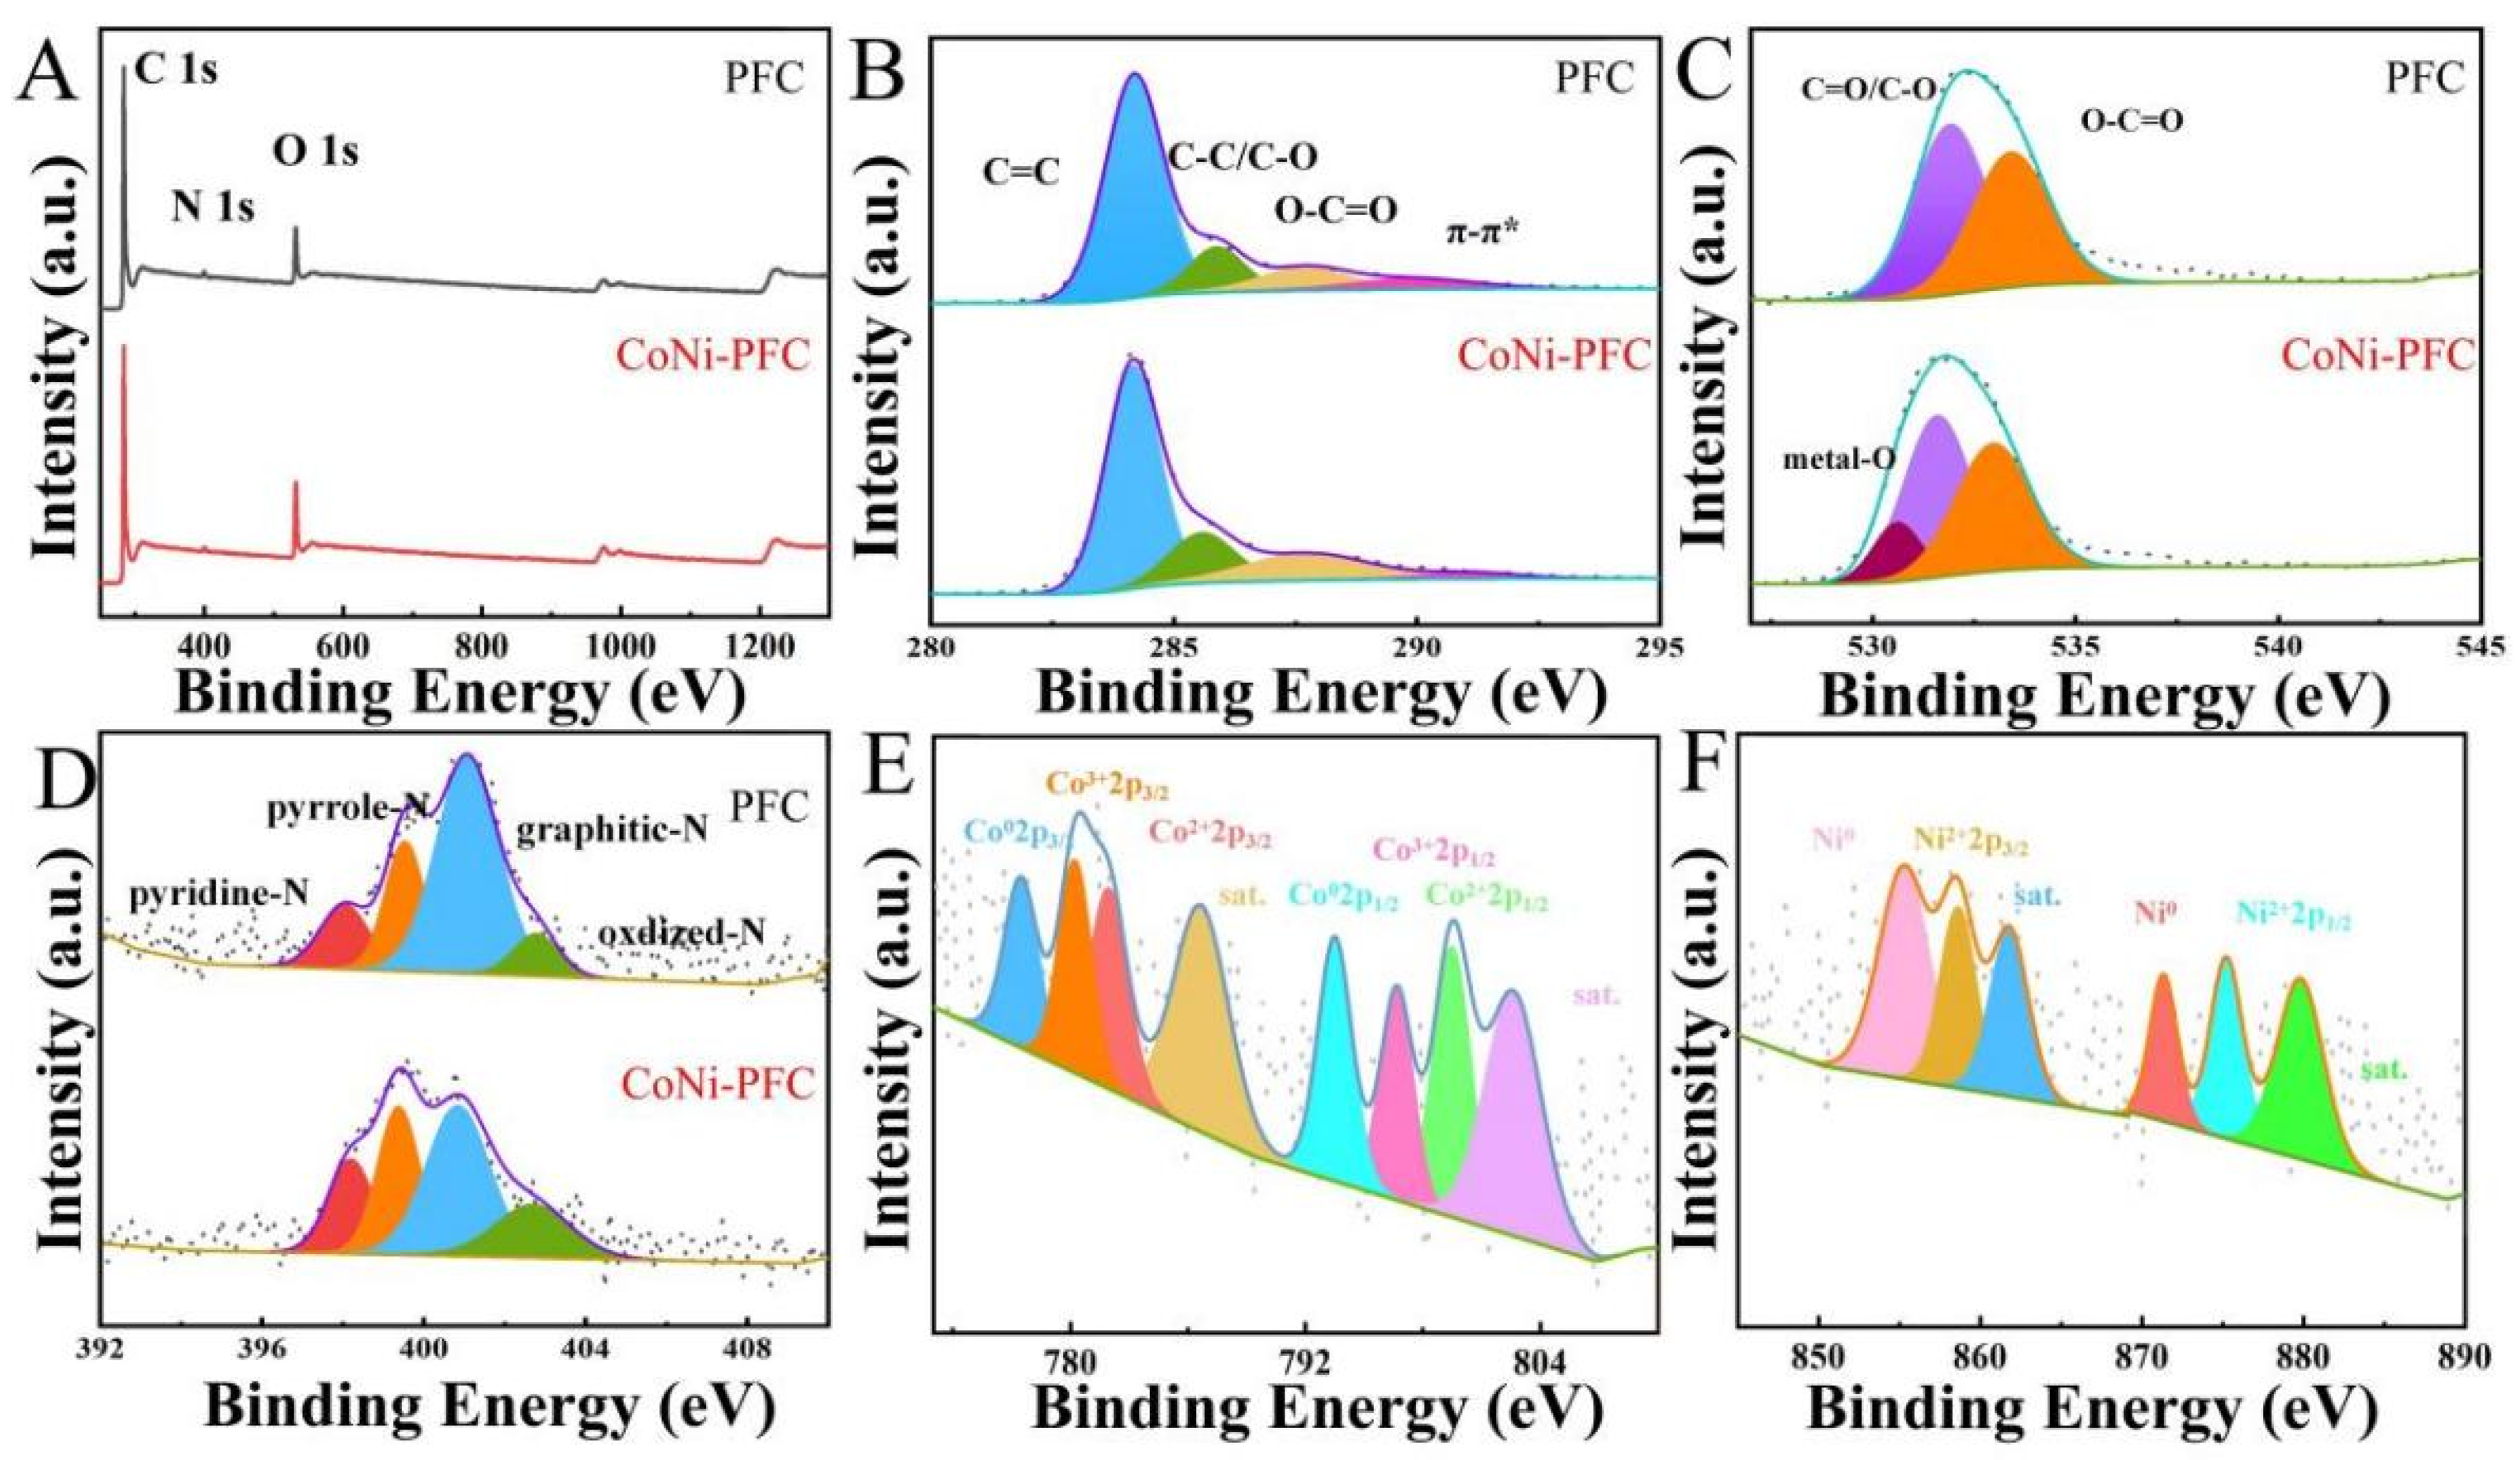
X-ray photoelectron spectroscopy (XPS) was applied to analyze the composition and chemical state of surface elements in PFC and CoNi-PFC. The elemental compositions of PFC and CoNi-PFC composites were also explored through XPS (Figure 4A–F, Table 1). In the C-1s spectra of PFC and CoNi-PFC, the broad peak was resolved into four subpeaks, indicating the presence of C=C (284.2 eV), C-C/C-O (285.0 eV), O-C=O (286.1 eV), and π-π* (288.0 eV) functional groups (Figure 4B) [40]. The O-1s spectra of PFC was deconvoluted into three peaks corresponding to metal-O (531.1 eV), C=O/C-O (532.1 eV), and O-C=O (533.5 eV, Figure 4C). The N-1s spectra of PFC and CoNi-PFC was resolved into four peaks corresponding to pyridinic-N (398.5 eV), pyrrolic-N (399.7 eV), graphitic-N (400.5 eV), and oxidized-N (402.6 eV, respectively) [41]. Pyrrolic-N and graphitic-N peaks were the dominant N configurations in PFC and CoNi-PFC. Both N species enhanced the conductivity and wettability of C [42]. The Co-2p and Ni-2p XPS spectra of CoNi-PFC exhibited two characteristic peaks at 778.4 and 794.6 eV (Figure 4E,F), corresponding to Co-2p3/2 and Co-2p1/2 of zero-valent Co, respectively. The peaks at 780.9 and 797.1 eV were assigned to Co3+2-p3/2 and Co3+-2p1/2, while the peaks at 782.4 and 798.6 eV corresponded to Co2+-2p3/2 and Co2+-2p1/2. The characteristic peaks at 786.2 and 804.1 eV represented satellite peaks [43]. This suggested that Co in CoNi-PFC existed in the form of zero-valent Co and Co3O4, consistent with XRD test results. Ni-2p had two different characteristic peaks at 856.7 and 875.2 eV, corresponding to Ni2+-2p3/2 and Ni2+-2p3/2, respectively, which was caused by NiO in nanoparticles (Figure 4F). The binding energy peaks of Ni-2p at 854.3 and 872.5 eV were attributed to Ni0 and the peaks at 861.4 and 879.9 eV were satellite peaks [44]. The XPS spectrum of Ni-2p confirmed the coexistence of Ni and NiO, while the appearance of satellite peaks indicated the presence of amorphous NiO.
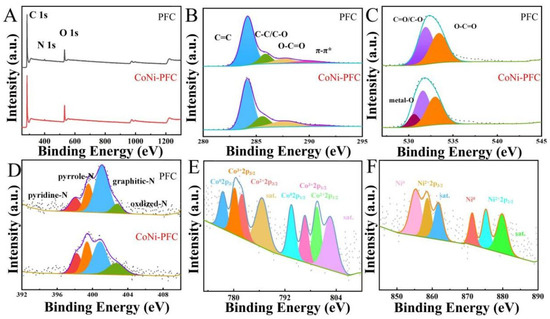
Figure 4.
XPS survey spectra of the prepared samples PFC and CoNi-PFC (A), C-1s (B), O-1s (C), N-1s (D), Co-2p spectra of CoNi-PFC (E), and Ni-2p spectra of CoNi-PFC (F).

Table 1.
Content of C, N, O, Co, and Ni in PFC composites calculated from the XPS results.
3.2. Electrochemical Behavior of 2-Nitrophenol at Different Modified Electrodes
The electrochemical behavior of 2-nitrophenol at bare GCE, PFC/GCE, and different CoNi-PFC/GCE loadings were investigated by CV (Figure 5). From curve a, it is evident that the reduction capability of GCE for 2-nitrophenol was weak, with a minor reduction peak appearing at about −0.5 V, while no oxidation peak was observed at ~0.4 V. However, oxidation peaks were present in curves b, c, d, and e. It was speculated that 2-nitrophenol was first reduced to 2-hydroxyamine phenol. To compare PFC and CoNi-PFC, the activity toward the electrochemical reaction for 2-nitrophenol was calculated, with the PFC and 0.5, 1, and 1.5-wt% CoNi-PFC showing current densities at 5.12, 5.43, 5.83, and 5.01 mA∙cm−2, respectively (b–e). Notably, the reduction of 2-nitrophenol in curves c, d, and e were stronger than that in curve b. This was attributed to the addition of CoNi, which enhanced the defect level of the material, exposed more active sites, and augmented the conductivity and electron transfer rate of the composite through the synergistic coupling effects of C and CoNi. However, loading more CoNi could block some C active sites, resulting in a decrease in the current density [45,46].
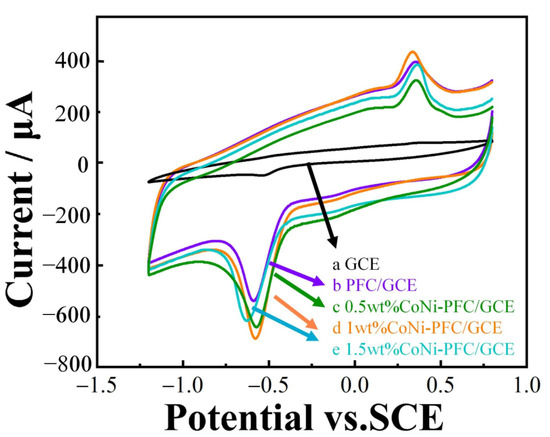
Figure 5.
CV diagram of electrodes modified with different materials in a 0.1 M CPB solution (pH 6.8) containing 100 µM 2-nitrophenol with a scan rate of 100 mV∙s−1.
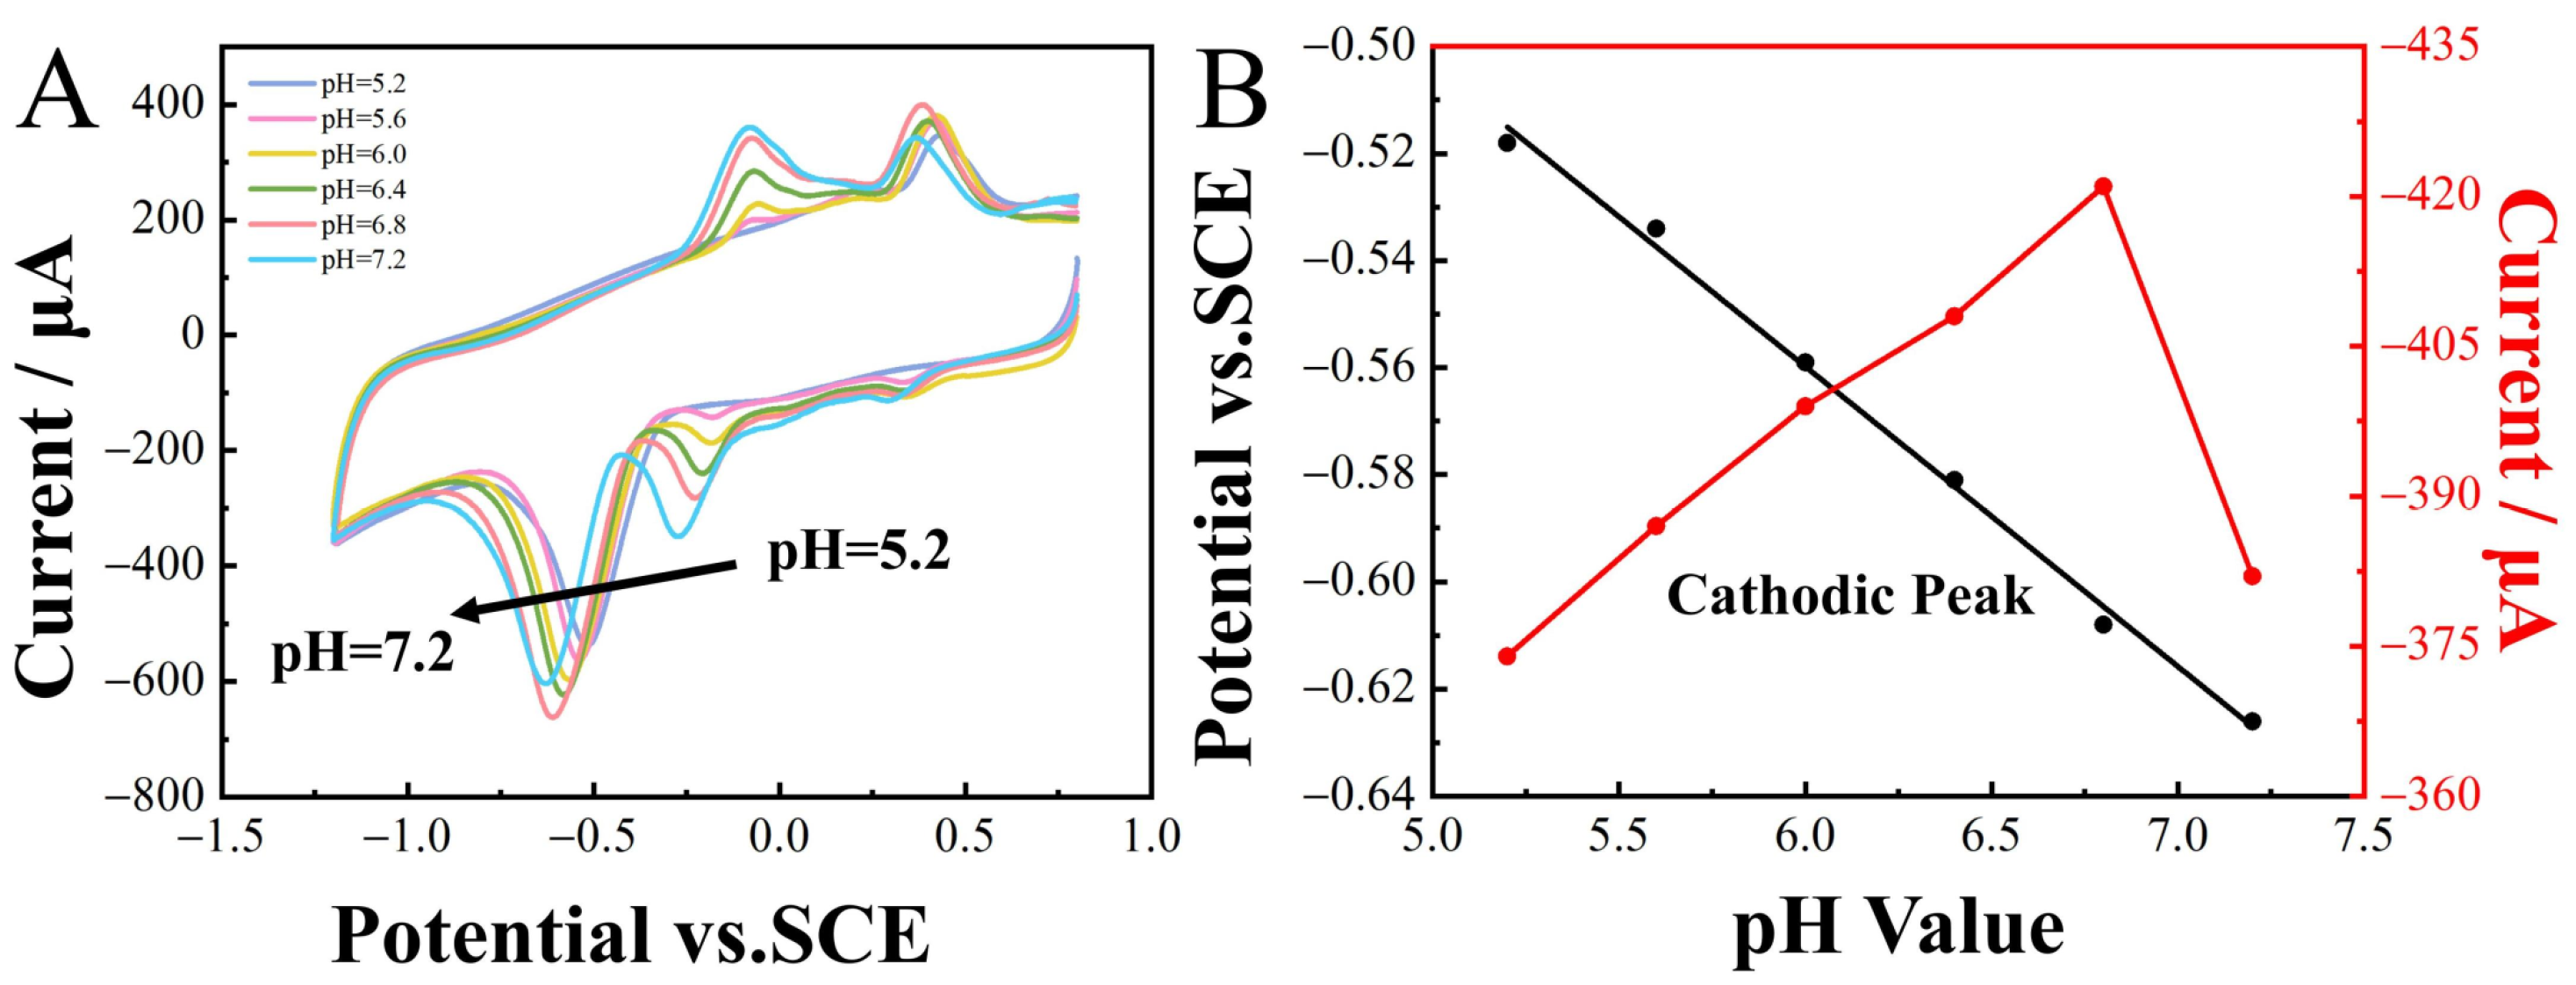
When detecting the target substance, the pH of the supporting electrolyte significantly influenced the detection results. Therefore, CV analysis was conducted to investigate the impact of pH on the reduction peak potentials of 2-nitrophenol (100 µM). The pH of the 0.1 M CPB buffer solution was adjusted within the range of 5.6 to 7.2. Optimal current responses were observed at pH 6.8 and, consequently, selected as the optimal buffer environment for subsequent electrochemical measurements. The reduction peaks of 2-nitrophenol shifted in the negative direction as the pH ranged from 5.6 to 7.2, demonstrating the transfer of protons in the reaction and showing a linear relationship between Epc and pH (Figure 6A), expressed as
Epc = −0.056pH − 0.22 (R2 = 0.994).
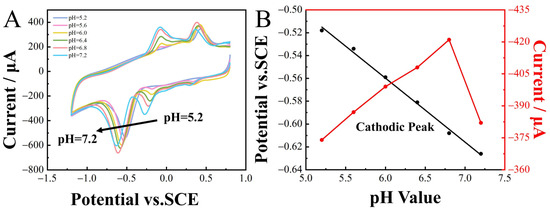
Figure 6.
CoNi-PFC/GCE CV curves for 100 µM 2-nitrophenol in a 0.1 M CPB solution at different pH, scan rate 100 m∙s−1. (A) Linear relationship between reduction peak potential, reduction peak current, and pH (B).
Based on ER = Eθ − (0.059 m/n) pH [47], the reaction of 2-nitrophenol involved an equal number of electrons and protons. The 2-nitrophenol was reduced to hydroxylaminophenol via a 4 H+ and 4 e− process [48].
3.3. Effects of Scan Rate
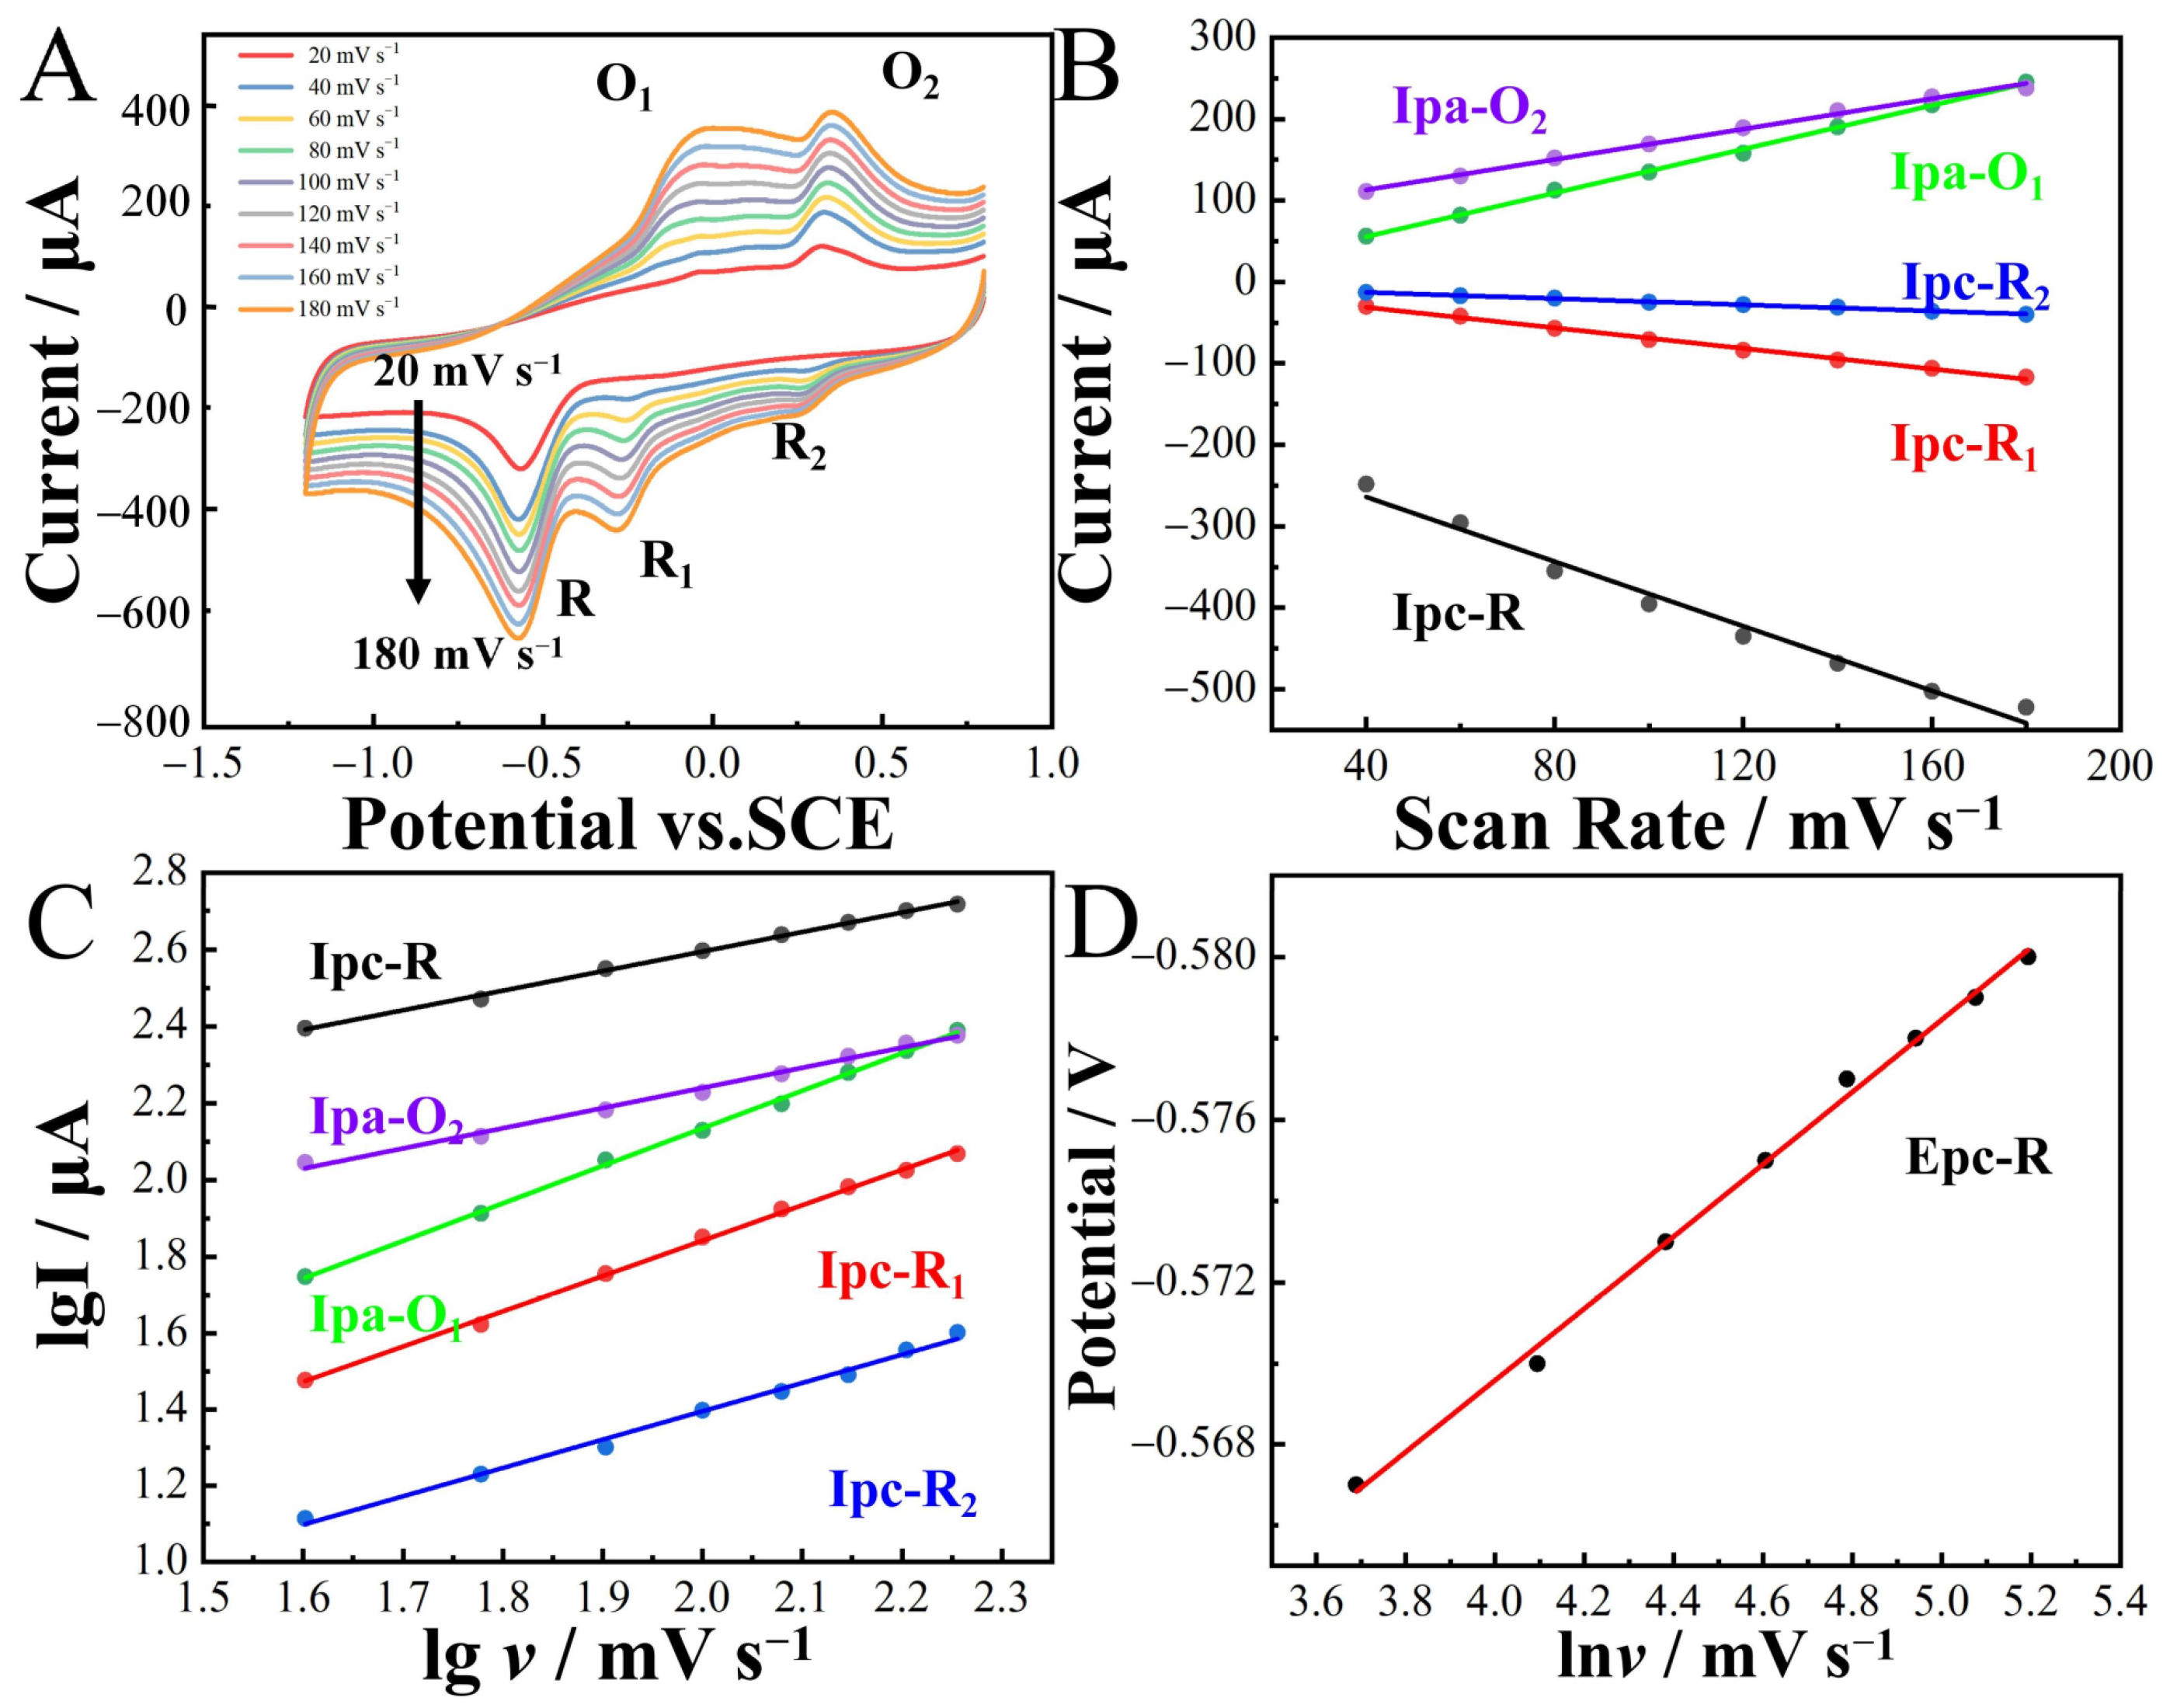
The influence of the scan rate (20–180 mV∙s−1) on the redox peak current and potential of 2-nitrophenol was explored using CoNi-PFC/GCE (Figure 7A–D). The peak current exhibited an increase with higher scan rates. By calculating the linear relationship between Ip and v, the slope of the linear equation, it became possible to determine the reaction kinetic process of CoNi-PFC/GCE. This aided in identifying whether the control was through adsorption or diffusion. The linear equations were
Ipc-R = −1.98v − 184.72 (R2 = 0.991),
Ipc-R1 = −0.63v − 6.04 (R2 = 0.996),
Ipc-R2 = −0.19v − 5.29 (R2 = 0.997),
Ipa-O1 = 1.34v + 1.67 (R2 = 0.998),
Ipa-O2 = 0.93v + 75.58 (R2 = 0.996),
lgIpc-R1 = 0.51lgv + 0.01 (R2 = 0.998),
lgIpc-R1 = 0.92lgv − 0.01 (R2 = 0.998),
lgIpc-R2 = 0.74lgv − 0.09 (R2 = 0.997),
lgIpa-O1 = 0.97lgv + 0.18 (R2 = 0.999), and
lgIpa-O2 = 0.53lgv + 1.18 (R2 = 0.997).

Figure 7.
Current response of CoNi-PFC/GCE to 100 µM 2-nitrophenol in 0.1M CPB (pH 6.8) solution at different scan rates (A). Linear relationship between Ipc, Ipa and scan rate v (B). Linear relationship between lgI and lgv (C). Linear relationship between potential and lnv (D).
In the electrochemical process of the CoNi-PFC/GCE detection of 2-nitrophenol, there was a linear relationship between Ipc-R, Ipc-R1, Ipc-R2, Ipa-O1, Ipa-O2, and v. The coefficients for detecting 2-nitrophenol were 0.51, 0.92, 0.74, 0.97, and 0.53, respectively. More than 0.5 and less than 1 indicated that the reaction kinetics was controlled by both adsorption and diffusion [49,50].
To further illustrate the kinetic processes of CoNi-PFC/GCE in 2-nitrophenol, irreversible reactions were examined, with the number of transferred electrons determined according to the following equation [51]:
where Eθ (V) is the formal potential, R, T, and F the gas constant (8.314 J mol−1∙K−1), Kelvin temperature (298.15 K), and Faraday constant (96,498 C∙mol−1), respectively, D (cm2∙s−1) the diffusion coefficient, ks (s−1) the electron transfer rate constant, α the electron transfer coefficient, n the number of transferred electrons participating in the rate controlling step, and v the scan rate. Epc is a function of the scan rate and, in 2-nitrophenol detection, Epc shifted negatively with an increased scan rate (lnv). The linear equation was (Figure 7D), expressed as
Epc = Eθ − M [0.78 + ln(D1/2ks−1) − 0.5 lnM] − 0.5Mlnv M = RT/(1 − α)nF,
Epc-R/V = −0.009lnv(mV∙s−1) − 0.53 (R2 = 0.997).
To determine the number of transferred electrons during the irreversible reduction-oxidation process of 2-nitrophenol on CoNi-PFC/GCE, it was necessary to solve for the α value from the CV, using [52]
while Ep represents the peak potential and Ep/2 denotes the half-peak potential. Irreversible reduction peaks were listed, along with the │Ep − Ep/2│, α, and n values (Table 2). For reversible redox peaks, as the potential was independent of the scanning rate, the value of n was calculated from [53]
│Ep − Ep/2│ = 1.857RT/αF = 0.0477/α,
│Ep − Ep/2│ = 2.2RT/nF = 0.0565/n.
Table 2.
Kinetic parameters of a CoNi-PFC/GCE-modified electrode for 2-nitrophenol CV measurements in CPB (pH 6.8).
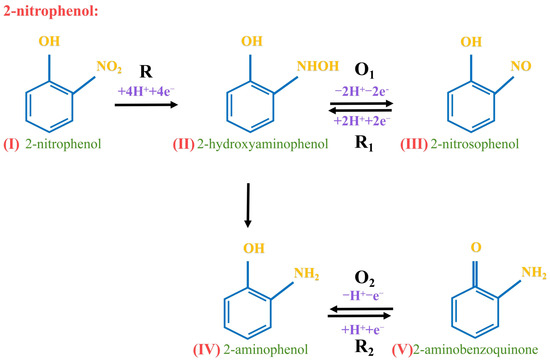
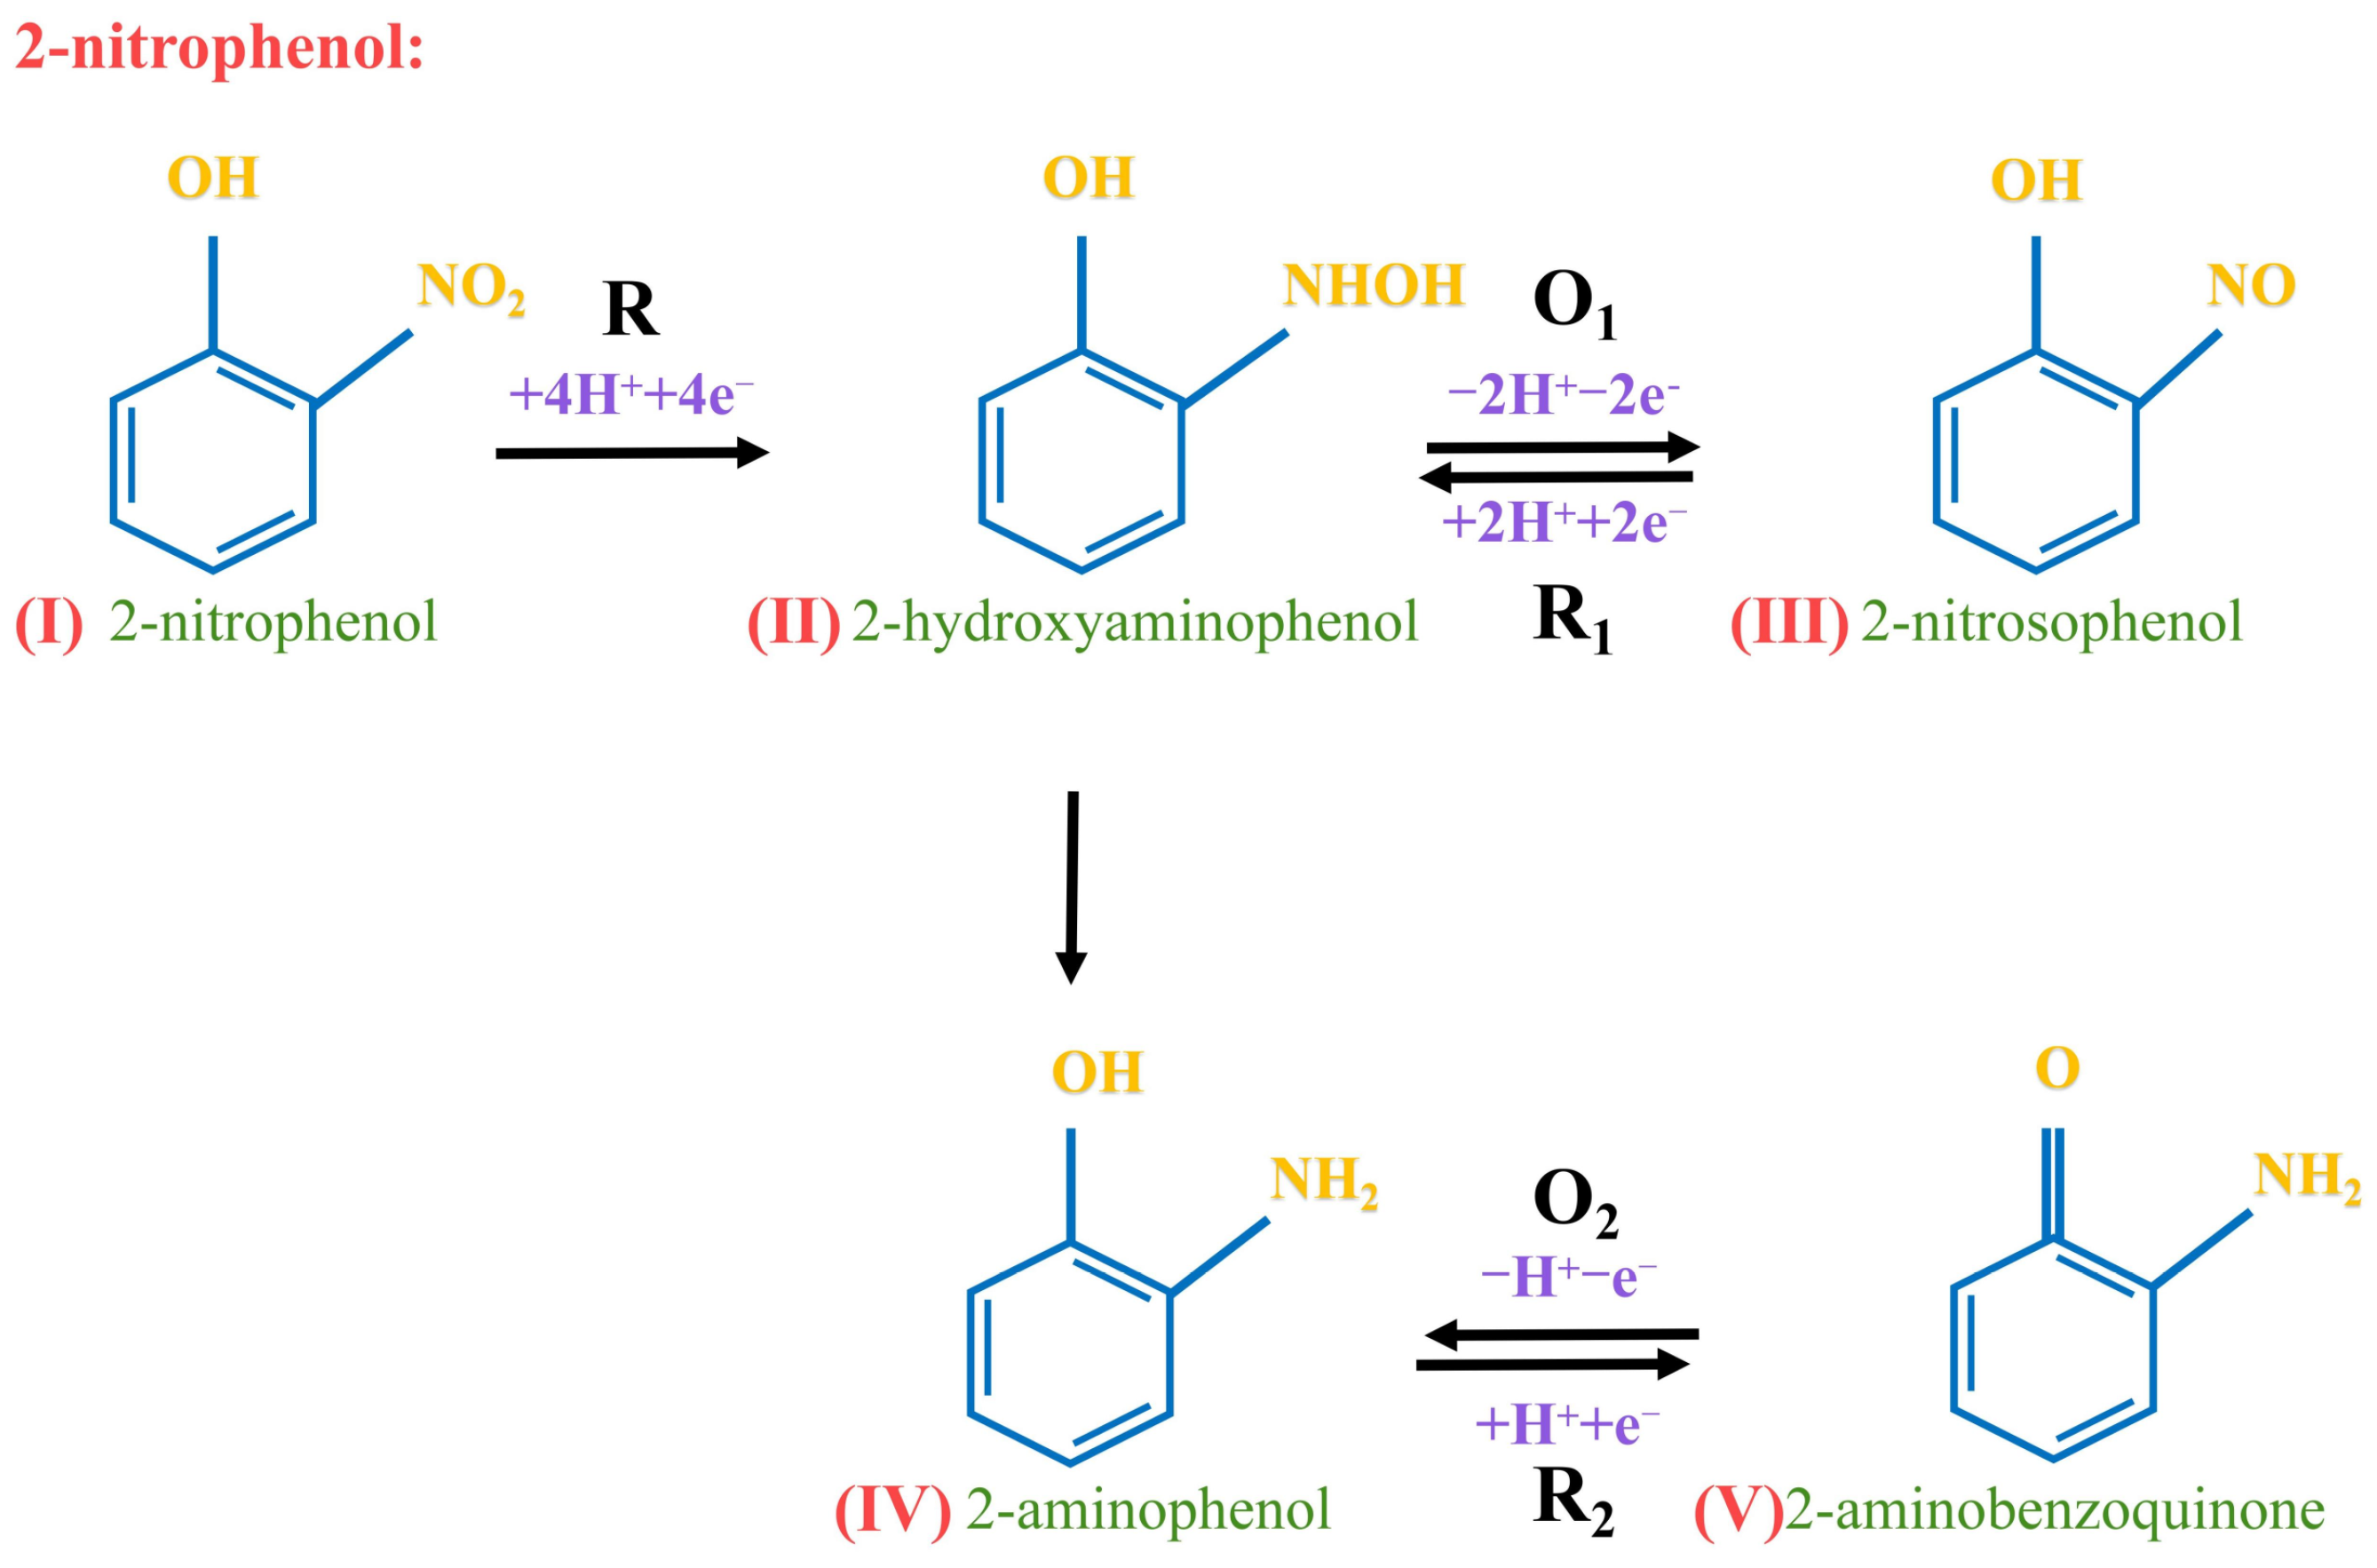
In the electrochemical analysis, the α value reflected the impact of electrode potential on the activation energy of the cathodic reaction (Table 2). In a redox reaction, the number of transferred electrons should be an integer. The obtained value of n from the redox reaction aligned with the reaction mechanism of 2-nitrophenol was depicted (Scheme 1). Therefore, the above conclusion was confirmed by the study of its electrochemical performance through the scanning rate. Specifically, 2-nitrophenol(I) was reduced to 2-hydroxylaminephenol(II) through the transfer of 4 H+ and 4 e−. Subsequently, 2-hydroxylaminephenol(II) was oxidized to 2-nitrosophenol(III) by losing 2 H+ and 2 e−. This resulted in a quasi-reversible oxidation-reduction reaction [54]. Thus, 2-nitrophenol(I) produced 2-aminophenol(IV) during the reduction process [55], and then 2-aminophenol(IV) was oxidized to 2-aminobenzoquinone(V) through the transfer of 1 H+ and 1 e− [56].
Scheme 1.
Redox mechanism of 2-nitrophenol on CoNi-PFC/GCE.
3.4. Electrochemical Detection of 2-Nitrophenol
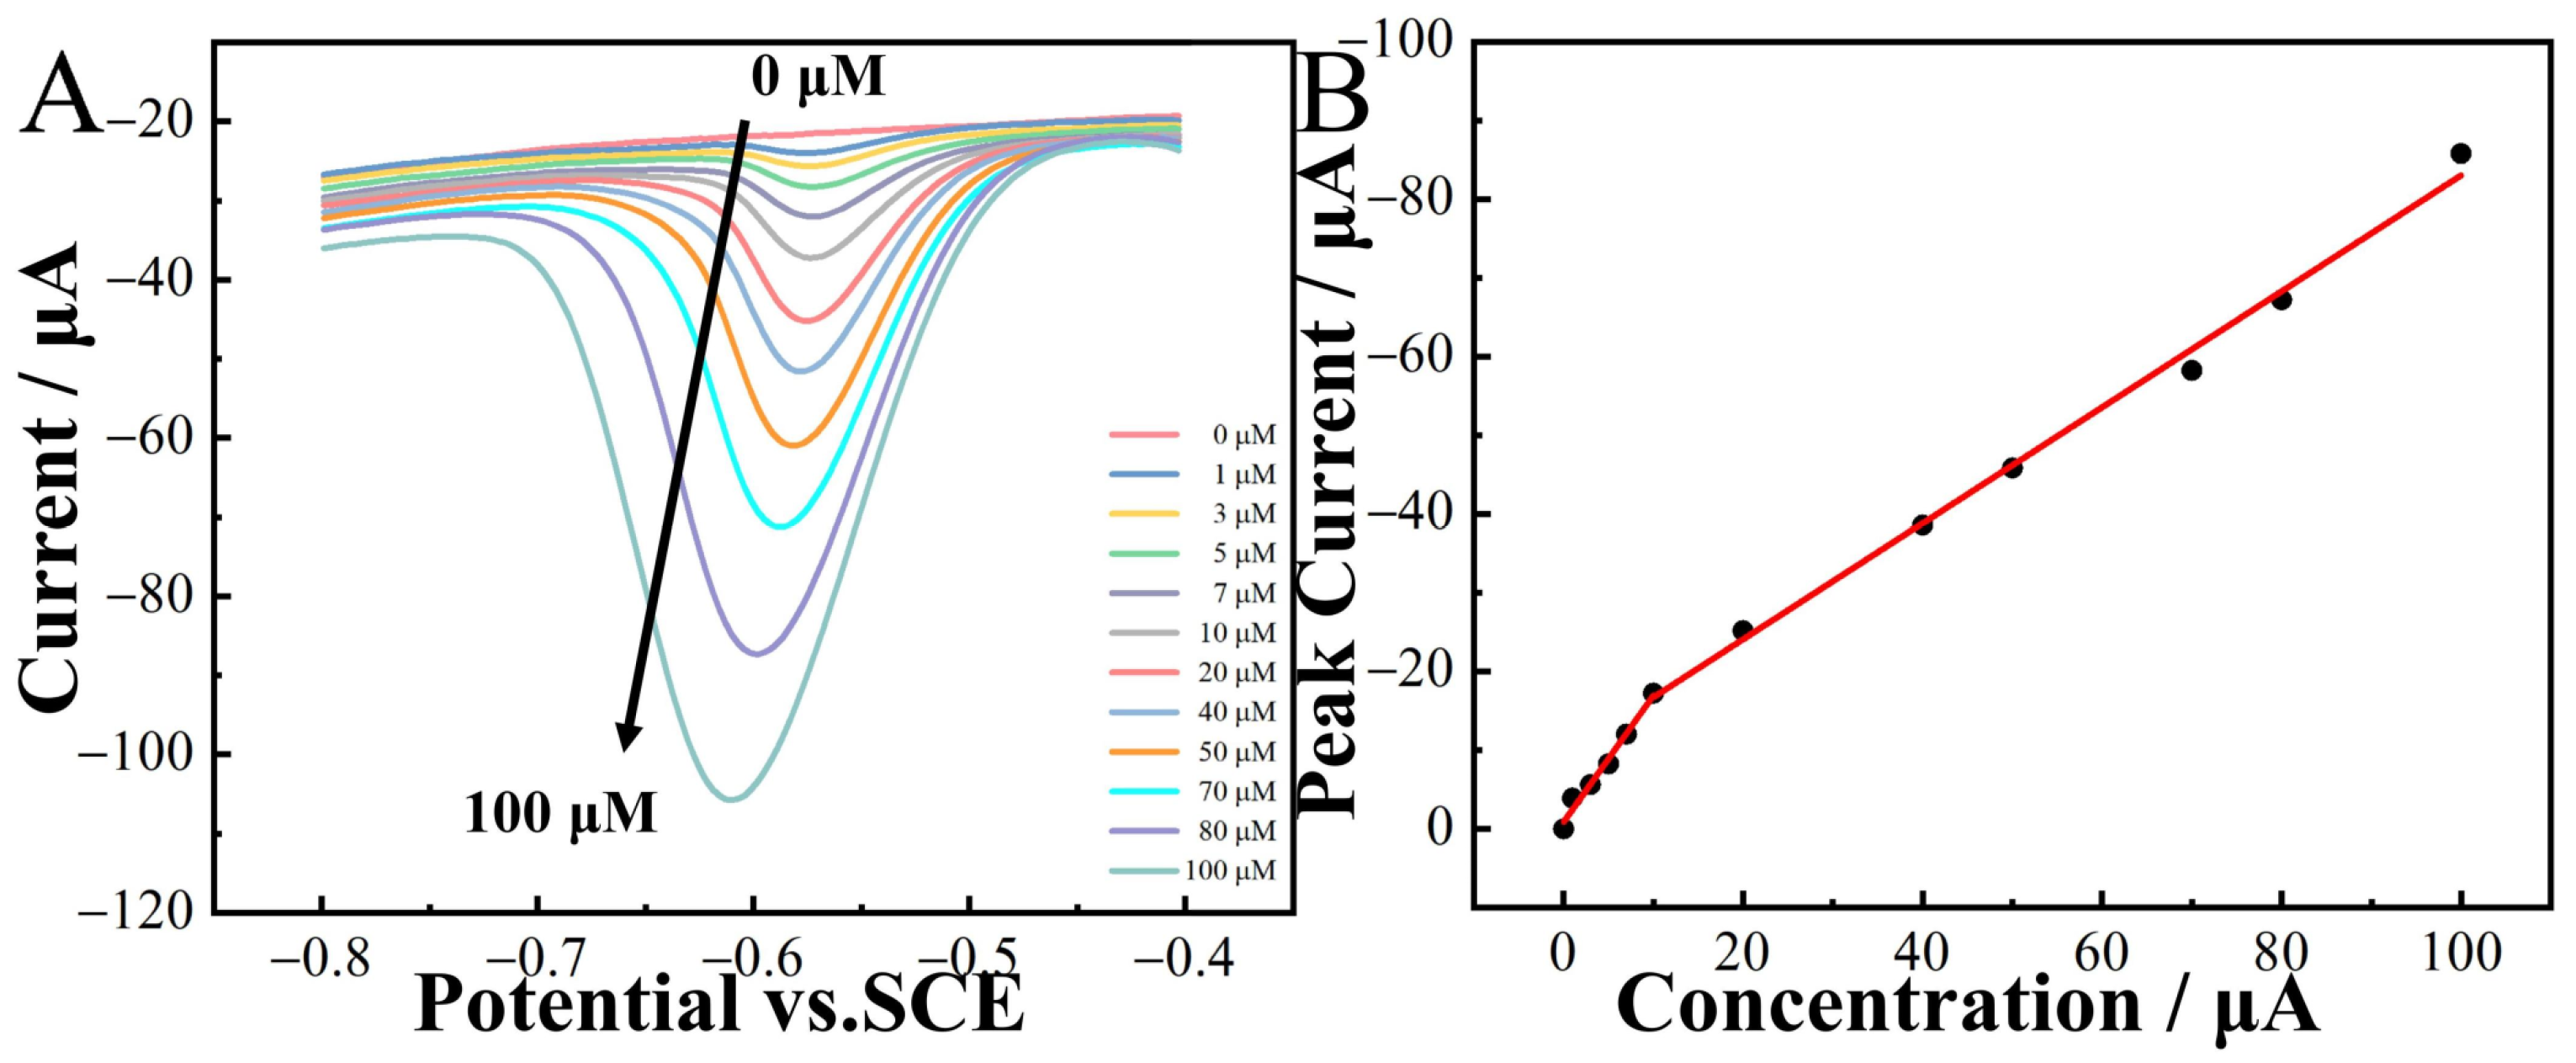
The DPV method was employed for the quantitative detection of 2-nitrophenol in a 0.1 M CPB solution. The results revealed a substantial increase in the peak current with the rise in 2-nitrophenol concentrations (Figure 8A). Furthermore, within the concentration range of 0–100 µM, a linear relationship existed between the peak current and concentration. The linear regression equations were
I(µA) = −1.607c(µM) − 0.863 (R2 = 0.991) and
I(µA) = −0.737c(µM) − 9.334 (R2 = 0.997).
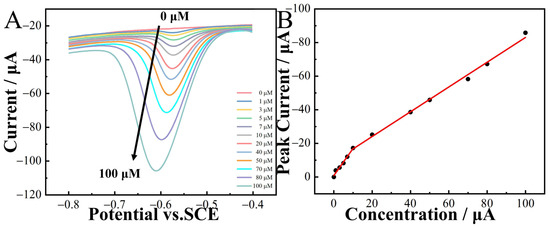
Figure 8.
DPV curves of CoNi-PFC/GCE in 0.1 M CPB (pH 6.8) at different concentrations of 2-nitrophenol (0–100 µM, (A)) and calibration curves of concentration and current (B).
The limit of detection (LOD) was calculated as 3σ/S, where 3 was the confidence factor, σ the standard deviation of the blank sample, and S the slope of the fitting line. The LOD of 2-nitrophenol was 0.0132 µM. Comparing with the previous results in Table 3, it can be seen the CoNi-PFC fabricated in this research has good LOD as a 2-nitrophenol electrochemical sensor.
Table 3.
Comparison LOD of 2-nitrophenol electrochemical sensor.
3.5. Anti-Interference, Stability, Reproducibility and Repeatability
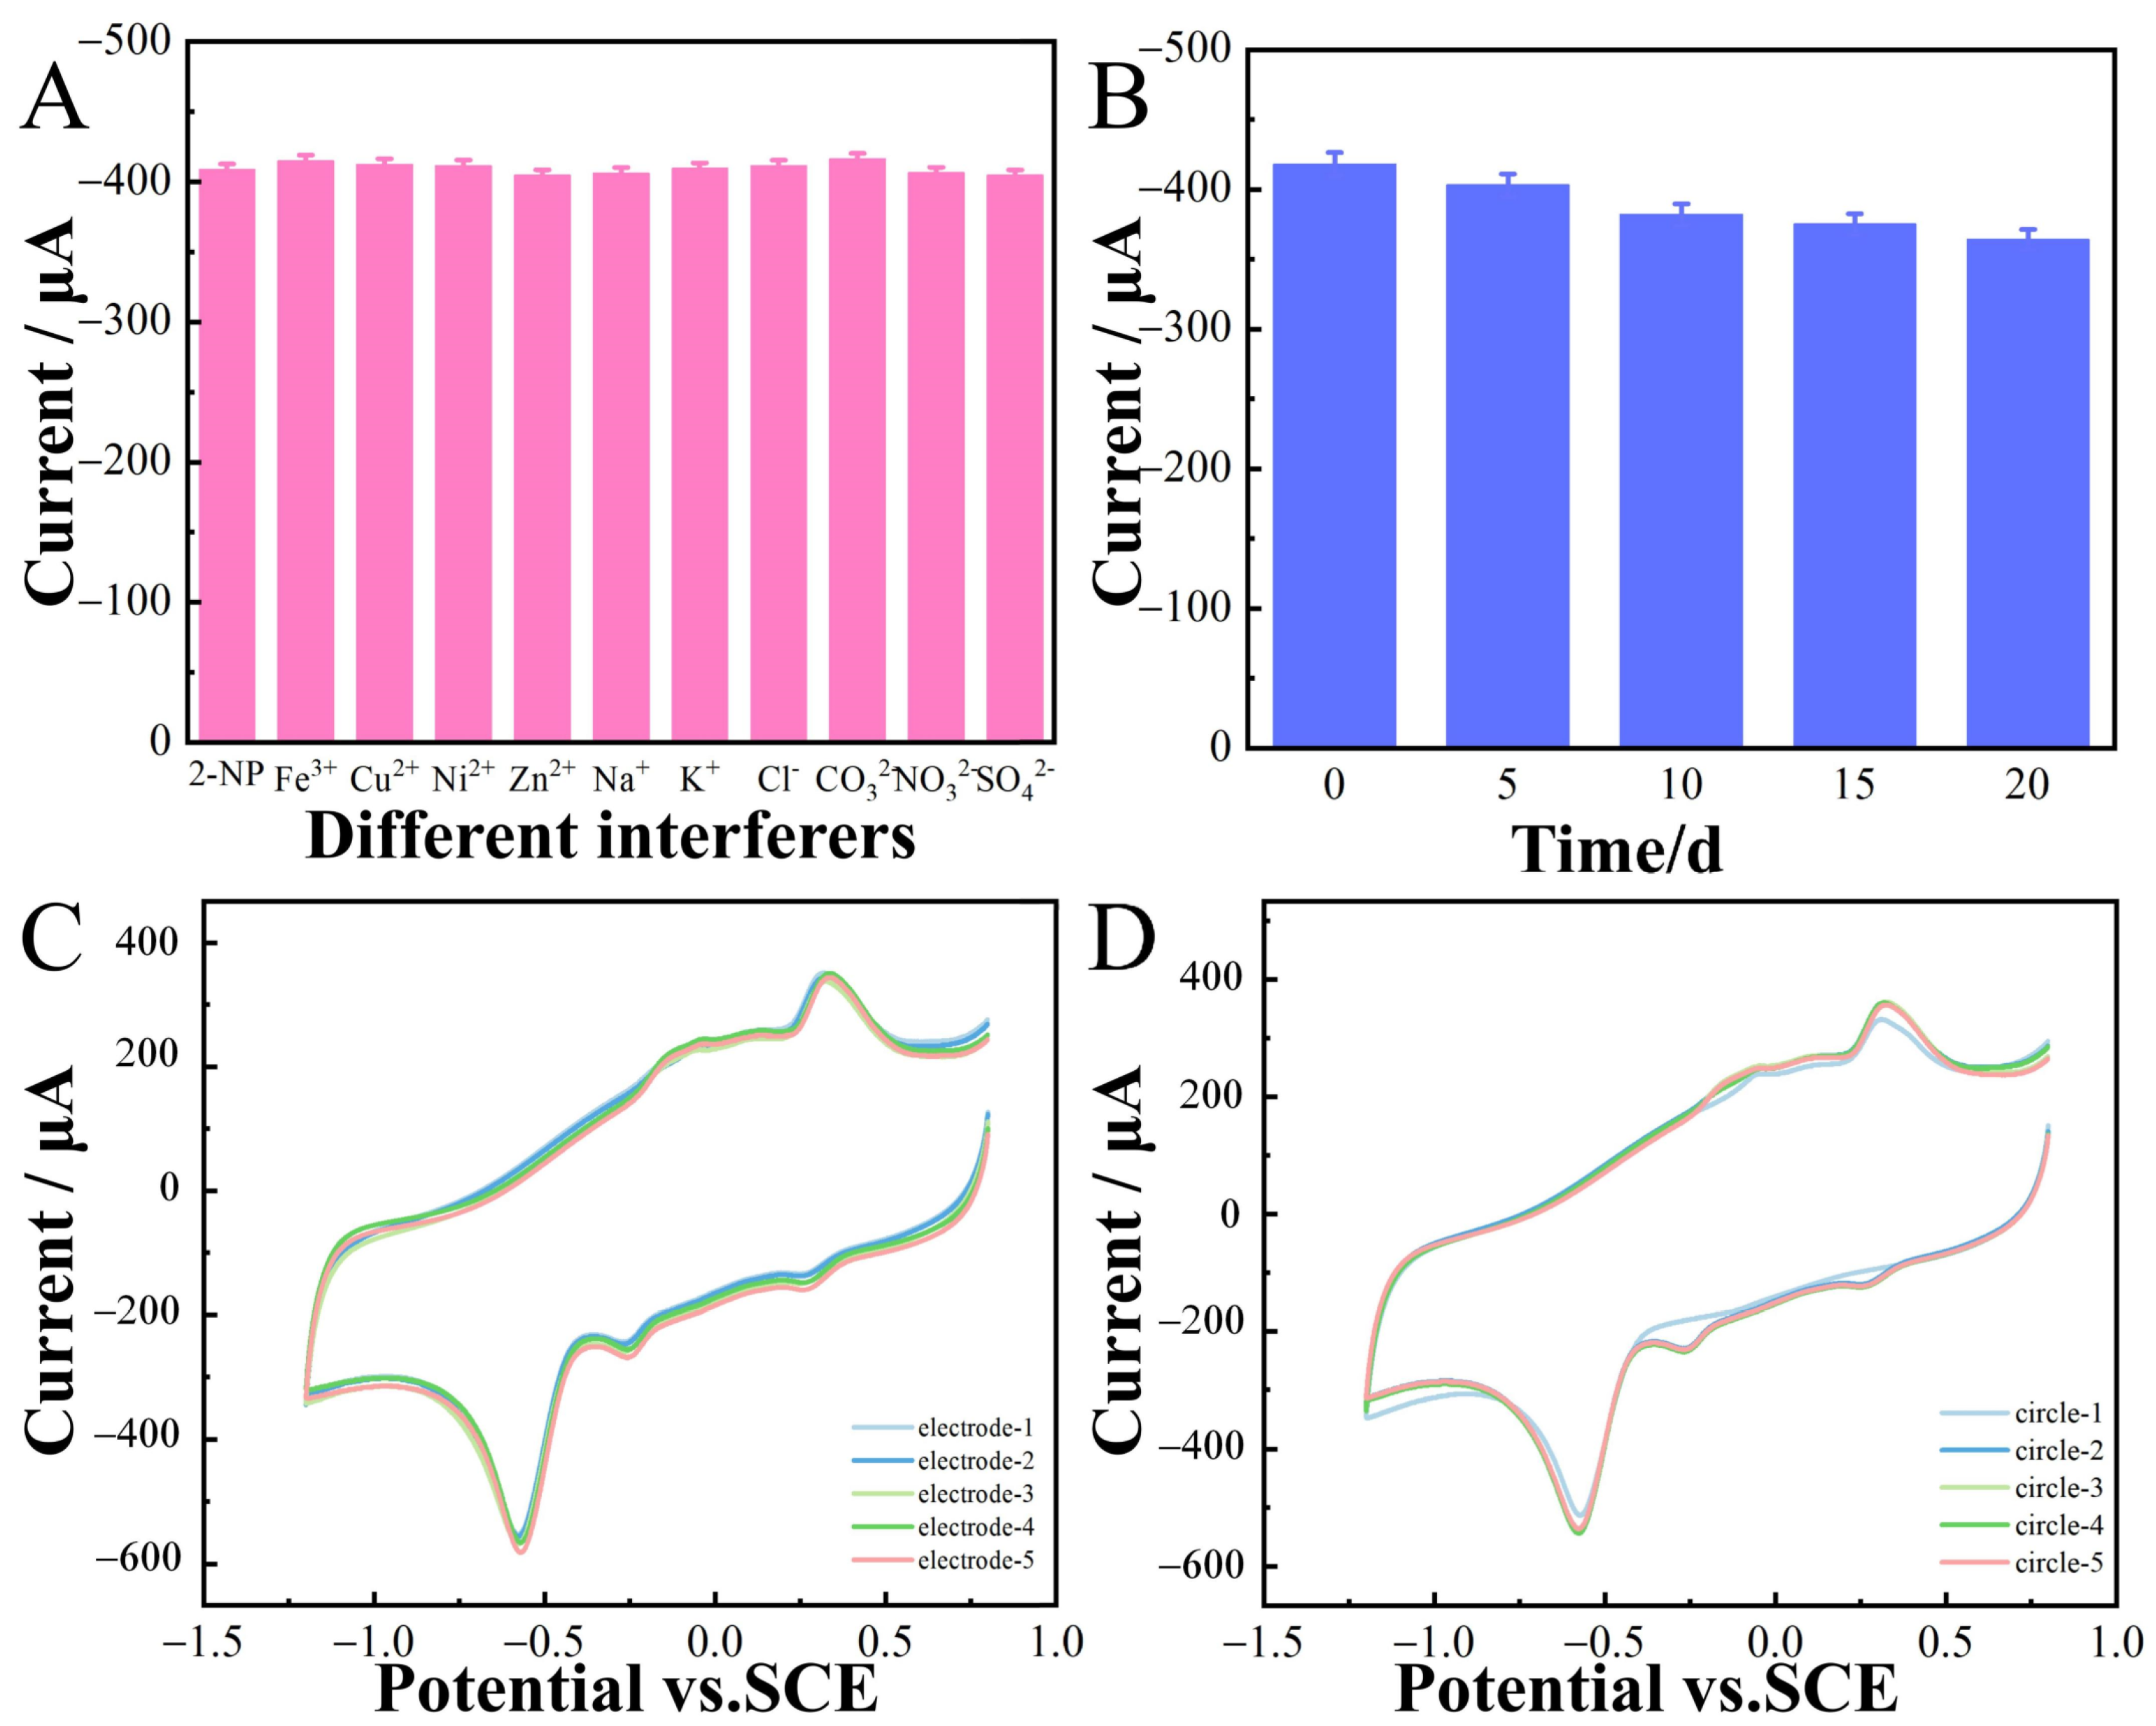
The anti-interference ability of the prepared sensor was investigated via CV in 0.1 M CPB (pH 6.8) containing 100 μM 2-nitrophenol. The coexistence of some potential interfering substances, such as Fe3+, Cu2+, Ni2+, Zn2+, Na+, K+, Cl−, CO32−, NO3−, and SO42−, at concentrations 10-fold higher than that of 2-nitrophenol was examined. The response did not significantly show interference, confirming that the CoNi-PFC/GCE exhibited good anti-interference ability for the electrochemical determination of 2-nitrophenol (Figure 9A). The electrode was placed for 20 d, and 2-nitrophenol detected at the same concentration every five d (Figure 9B). These electrochemical sensors demonstrated good stability throughout the 20 d period.
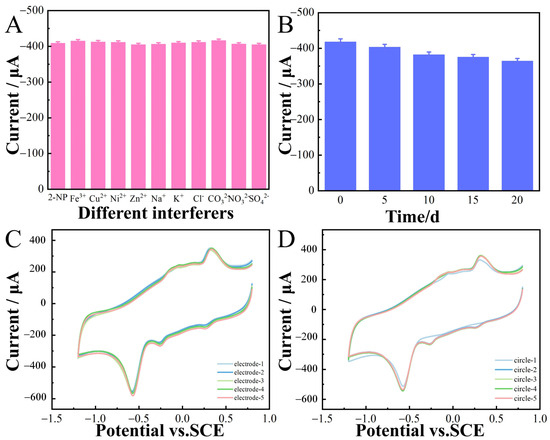
Figure 9.
The current response for 100 µM 2-nitrophenol and 10-fold concentration of interfering substances (Fe3+, Cu2+, Ni2+, Zn2+, Na+, K+, Cl−, CO32−, NO3−, and SO42−) in 0.1 M CPB (pH 6.8) (A). Long-term stability experiment of 2-nitrophenol sensor based on CoNi-PFC/GCE (0–20 d) (B). Response currents of five different electrodes to the same concentration of 2-nitrophenol (C). Five consecutive measurements of the same concentration of 2-nitrophenol at the same electrode (D).
In this study, CV was employed to assess the reproducibility of the CoNi-PFC/GCE (Figure 9C). Five different samples of CoNi-PFC/GCE were prepared in a 0.1 M CPB solution at pH 6.8. By detecting 2-nitrophenol, consistent current responses were observed for the reduction peaks of the modified electrode across all five samples, with the relative standard deviation (RSD) at 3.1%. Furthermore, five consecutive measurements were conducted using the same CoNi-PFC/GCE samples (Figure 9D), revealing no significant changes in the response current. These results indicated that the CoNi-PFC/GCE exhibited better repeatability.
3.6. Real Sample Studies
CoNi-PFC/GCE was applied for detecting 2-nitrophenol in real samples of tap water to evaluate the possibility of practical applications for the developed sensor. The experiments were carried out by a standard addition method. Before detection, real samples were diluted 100-fold using 0.1 M CPB (pH 6.8). The recoveries of 2-nitrophenol at CoNi-PFC/GCE were 98.75–102.76% for real samples (Table 4). The results indicated that the fabricated electrochemical sensors could be used for the effective detection of 2-nitrophenol in real samples.
Table 4.
Recoveries for the detection of 4-nitrophenol in real samples.
4. Conclusions
In this study, CoNi-PFC was synthesized via a facile in situ pyrolysis of lignin-based phenolic resin. The effects of microstructure and electrochemical performance were investigated, and the material exhibited successful application in the electrochemical detection of 2-nitrophenol. The loading of CoNi increased the defect sites, thereby exposing more electrochemically active sites and enhancing the conductivity and electron transfer rate of the composite material through the synergistic effects of C and CoNi. In addition, the presence of oxygen-containing functional groups on C surfaces provided more active sites. The Co/Co3O4/Ni/NiO structure doped by C demonstrated good stability and selectivity. Based on the calibration plot, the limit of detection (LOD) was calculated to be 0.0132 µM, with a linear range of 0 to 100 µM.
Supplementary Materials
The following supporting information can be downloaded at: https://www.mdpi.com/article/10.3390/cryst14060506/s1. Figure S1: FTIR images of PF (a) and CoNi-PFC (b); Figure S2: CV curves of a 5.0 mM K3[Fe(CN)6] solution in the presence of 0.1 M KCl. Figure S3: EDS image: (A–F) CoNi-PFC. Table S1: Wavenumber-dependent assignment of lignin-based phenolic resin and CoNi-lignin-based phenolic resin, Table S2: Redox current response of 5.0 mM K3[Fe(CN)6] on PFC-700, PFC-800, and PFC-900.
Author Contributions
Conceptualization, T.B. and W.S.; methodology, T.B.; software, T.B.; validation, T.B. and Q.W.; formal analysis, X.Z. and Q.W.; investigation, T.B.; resources, Y.J. and T.B.; data curation, T.B.; writing—original draft preparation, T.B. and Q.W.; writing—review and editing, W.S.; visualization, T.B.; supervision, J.C. and Y.C.; project administration, W.S. and Q.L.; funding acquisition, W.S. All authors have read and agreed to the published version of the manuscript.
Funding
This research was funded by the National Natural Science Foundation of China (Nos. 51502161 and 21706148), the Natural Science Foundation of Shandong Province (nos. ZR2020ME041, ZR2022QB173, and ZR2023MB054), Joint Zibo-SDUT Fund (no. 2019ZBXC358), and the Foundation of State Key Laboratory of Biobased Material and Green Papermaking, Qilu University of Technology (Shandong Academy of Sciences, no. KF2019-06).
Data Availability Statement
The original contributions presented in the study are included in the article and Supplementary Material, further inquiries can be directed to the corresponding author.
Conflicts of Interest
The authors declare no conflict of interest.
References
- Supanchaiyamat, N.; Jetsrisuparb, K.; Knijnenburg, J.T.N.; Tsang, D.C.W.; Hunt, A.J. Lignin materials for adsorption: Current trend, perspectives and opportunities. Bioresour. Technol. 2019, 272, 570–581. [Google Scholar] [CrossRef] [PubMed]
- Naseem, A.; Tabasum, S.; Zia, K.M.; Zuber, M.; Ali, M.; Noreen, A. Lignin-derivatives based polymers, blends and composites: A review. Int. J. Biol. Macromol. 2016, 93 Pt A, 296–313. [Google Scholar] [CrossRef]
- Wang, S.; Bai, J.; Innocent, M.T.; Wang, Q.; Xiang, H.; Tang, J.; Zhu, M. Lignin-based carbon fibers: Formation, modification and potential applications. Green Energy Environ. 2022, 7, 578–605. [Google Scholar] [CrossRef]
- Ma, X.; Chen, J.; Zhu, J.; Yan, N. Lignin-Based Polyurethane: Recent Advances and Future Perspectives. Macromol. Rapid Commun. 2021, 42, e2000492. [Google Scholar] [CrossRef] [PubMed]
- Mohamad Aini, N.A.; Othman, N.; Hussin, M.H.; Sahakaro, K.; Hayeemasae, N. Lignin as Alternative Reinforcing Filler in the Rubber Industry: A Review. Front. Mater. 2020, 6, 329. [Google Scholar] [CrossRef]
- Liu, X.; Bouxin, F.P.; Fan, J.; Budarin, V.L.; Hu, C.; Clark, J.H. Recent Advances in the Catalytic Depolymerization of Lignin towards Phenolic Chemicals: A Review. ChemSusChem 2020, 13, 4296–4317. [Google Scholar] [CrossRef] [PubMed]
- Pinheiro, F.G.C.; Soares, A.K.L.; Santaella, S.T.; Silva, L.M.A.e.; Canuto, K.M.; Cáceres, C.A.; Rosa, M.d.F.; Feitosa, J.P.d.A.; Leitão, R.C. Optimization of the acetosolv extraction of lignin from sugarcane bagasse for phenolic resin production. Ind. Crops Prod. 2017, 96, 80–90. [Google Scholar] [CrossRef]
- Li, P.; Yang, C.; Yi, D.; Li, S.; Wang, M.; Wang, H.; Jin, Y.; Wu, W. Preparation of spherical porous carbon from lignin-derived phenolic resin and its application in supercapacitor electrodes. Int. J. Biol. Macromol. 2023, 252, 126271. [Google Scholar] [CrossRef] [PubMed]
- Gholivand, M.B.; Jalalvand, A.R.; Goicoechea, H.C. Computer-assisted electrochemical fabrication of a highly selective and sensitive amperometric nitrite sensor based on surface decoration of electrochemically reduced graphene oxide nanosheets with CoNi bimetallic alloy nanoparticles. Mater. Sci. Eng. C 2014, 40, 109–120. [Google Scholar] [CrossRef]
- Jiang, N.; Song, J.; Yan, M.; Hu, Y.; Wang, M.; Liu, Y.; Huang, M. Iron cobalt-doped carbon nanofibers anode to simultaneously boost bioelectrocatalysis and direct electron transfer in microbial fuel cells: Characterization, performance, and mechanism. Bioresour. Technol. 2023, 367, 128230. [Google Scholar] [CrossRef]
- Yang, L.; Chen, Y.; Wen, Q.; Lin, C.; Gao, H.; Qi, Z.; Pan, X. Bimetallic ZIF-derived heteroatomic-doped bioanode catalysts for enhanced power production in microbial fuel cells. Fuel 2024, 357, 129921. [Google Scholar] [CrossRef]
- Xiao, W.; Cheng, M.; Liu, Y.; Wang, J.; Zhang, G.; Wei, Z.; Li, L.; Du, L.; Wang, G.; Liu, H. Functional metal/carbon composites derived from metal–organic frameworks: Insight into structures, properties, performances, and mechanisms. ACS Catal. 2023, 13, 1759–1790. [Google Scholar] [CrossRef]
- Pang, B.; Lin, S.; Shi, Y.; Wang, Y.; Chen, Y.; Ma, S.; Feng, J.; Zhang, C.; Yu, L.; Dong, L. Synthesis of CoFe2O4/graphene composite as a novel counter electrode for high performance dye-sensitized solar cells. Electrochim. Acta 2019, 297, 70–76. [Google Scholar] [CrossRef]
- Veerapandi, G.; Govindan, R.; Sekar, C. Quick and accurate determination of hazardous phenolic compounds using CaCu2O3 nanorods based electrochemical sensor. Chemosphere 2023, 313, 137370. [Google Scholar] [CrossRef] [PubMed]
- Jaber, F.; Schummer, C.; Al Chami, J.; Mirabel, P.; Millet, M. Solid-phase microextraction and gas chromatography-mass spectrometry for analysis of phenols and nitrophenols in rainwater, as their t-butyldimethylsilyl derivatives. Anal. Bioanal. Chem. 2007, 387, 2527–2535. [Google Scholar] [CrossRef] [PubMed]
- Guo, X.; Wang, Z.; Zhou, S. The separation and determination of nitrophenol isomers by high-performance capillary zone electrophoresis. Talanta 2004, 64, 135–139. [Google Scholar] [CrossRef] [PubMed]
- Niazi, A.; Yazdanipour, A. Spectrophotometric simultaneous determination of nitrophenol isomers by orthogonal signal correction and partial least squares. J. Hazard. Mater. 2007, 146, 421–427. [Google Scholar] [CrossRef] [PubMed]
- Nistor, C.; Oubiña, A.; Marco, M.-P.; Barceló, D.; Emnéus, J. Competitive flow immunoassay with fluorescence detection for determination of 4-nitrophenol. Anal. Chim. Acta 2001, 426, 185–195. [Google Scholar] [CrossRef]
- Huang, X.; Qiu, N.; Yuan, D. Direct enrichment of phenols in lake and sea water by stir bar sorptive extraction based on poly (vinylpyridine-ethylene dimethacrylate) monolithic material and liquid chromatographic analysis. J. Chromatogr. A 2008, 1194, 134–138. [Google Scholar] [CrossRef]
- Dincer, C.; Bruch, R.; Costa-Rama, E.; Fernandez-Abedul, M.T.; Merkoci, A.; Manz, A.; Urban, G.A.; Guder, F. Disposable Sensors in Diagnostics, Food, and Environmental Monitoring. Adv. Mater. 2019, 31, e1806739. [Google Scholar] [CrossRef]
- Li, J.; Chen, D.; Zhang, T.; Chen, G. Highly sensitive electrochemical determination of methotrexate based on a N-doped hollow nanocarbon sphere modified electrode. Anal. Methods 2021, 13, 117–123. [Google Scholar] [CrossRef] [PubMed]
- Wu, M.; Lin, Y.-n.; Guo, H.; Li, W.; Wang, Y.; Lin, X. Design a novel kind of open-ended carbon sphere for a highly effective counter electrode catalyst in dye-sensitized solar cells. Nano Energy 2015, 11, 540–549. [Google Scholar] [CrossRef]
- Zhou, H.-F.; Li, S.-X.; Wu, Y.-J.; Chen, D.-J.; Li, Y.-H.; Zheng, F.-Y.; Yu, H.-W. Nitrogen-doped carbon spheres surface modified with in situ synthesized Au nanoparticles as electrochemical selective sensor for simultaneous detection of trace nitrophenol and dihydroxybenzene isomers. Sens. Actuators B Chem. 2016, 237, 487–494. [Google Scholar] [CrossRef]
- Zang, J.; Guo, C.X.; Hu, F.; Yu, L.; Li, C.M. Electrochemical detection of ultratrace nitroaromatic explosives using ordered mesoporous carbon. Anal. Chim. Acta 2011, 683, 187–191. [Google Scholar] [CrossRef] [PubMed]
- Pan, S.; Wang, L.; Chen, X.; Tang, Y.; Chen, Y.; Sun, Y.; Yang, X.; Wan, P. Enhanced electrochemical sensing of nitroaromatic compounds based on hydroxyl modified carbon submicroparticles. Electrochim. Acta 2016, 203, 301–308. [Google Scholar] [CrossRef]
- Borrás, C.; Laredo, T.; Mostany, J.; Scharifker, B.R. Study of the oxidation of solutions of p-chlorophenol and p-nitrophenol on Bi-doped PbO2 electrodes by UV-Vis and FTIR in situ spectroscopy. Electrochim. Acta 2004, 49, 641–648. [Google Scholar] [CrossRef]
- El Fawal, G.F.; Abu-Serie, M.M.; Hassan, M.A.; Elnouby, M.S. Hydroxyethyl cellulose hydrogel for wound dressing: Fabrication, characterization and in vitro evaluation. Int. J. Biol. Macromol. 2018, 111, 649–659. [Google Scholar] [CrossRef] [PubMed]
- Zhang, W.; Ma, Y.; Wang, C.; Li, S.; Zhang, M.; Chu, F. Preparation and properties of lignin-phenol-formaldehyde resins based on different biorefinery residues of agricultural biomass. Ind. Crops Prod. 2013, 43, 326–333. [Google Scholar] [CrossRef]
- Yang, W.; Rallini, M.; Natali, M.; Kenny, J.; Ma, P.; Dong, W.; Torre, L.; Puglia, D. Preparation and properties of adhesives based on phenolic resin containing lignin micro and nanoparticles: A comparative study. Mater. Des. 2019, 161, 55–63. [Google Scholar] [CrossRef]
- Siddique, M.; Soomro, S.A.; Aziz, S. Characterization and optimization of lignin extraction from lignocellulosic biomass via green nanocatalyst. Biomass Convers. Biorefinery 2022, 1–9. [Google Scholar] [CrossRef]
- Liu, Y.; Hu, T.; Wu, Z.; Zeng, G.; Huang, D.; Shen, Y.; He, X.; Lai, M.; He, Y. Study on biodegradation process of lignin by FTIR and DSC. Environ. Sci. Pollut. Res. Int. 2014, 21, 14004–14013. [Google Scholar] [CrossRef] [PubMed]
- Wang, Y.; Tu, M.; Li, X.; Zhang, J.; Cheng, J. Facile synthesis of marigold-like microspheres from urea formaldehyde with controllable morphology. Mater. Lett. 2015, 145, 27–29. [Google Scholar] [CrossRef]
- Gu, J.; Xu, Y.; Li, Q.; Pang, H. Porous Ni/NiO nanohybrids for electrochemical catalytic glucose oxidation. Chin. Chem. Lett. 2021, 32, 2017–2020. [Google Scholar] [CrossRef]
- Lv, H.; Liang, X.; Ji, G.; Zhang, H.; Du, Y. Porous Three-Dimensional Flower-like Co/CoO and Its Excellent Electromagnetic Absorption Properties. ACS Appl. Mater. Interfaces 2015, 7, 9776–9783. [Google Scholar] [CrossRef] [PubMed]
- Han, X.; He, G.; He, Y.; Zhang, J.; Zheng, X.; Li, L.; Zhong, C.; Hu, W.; Deng, Y.; Ma, T.Y. Engineering Catalytic Active Sites on Cobalt Oxide Surface for Enhanced Oxygen Electrocatalysis. Adv. Energy Mater. 2017, 8, 1702222. [Google Scholar] [CrossRef]
- Pallavolu, M.R.; Prabhu, S.; Nallapureddy, R.R.; Kumar, A.S.; Banerjee, A.N.; Joo, S.W. Bio-derived graphitic carbon quantum dot encapsulated S- and N-doped graphene sheets with unusual battery-type behavior for high-performance supercapacitor. Carbon 2023, 202, 93–102. [Google Scholar] [CrossRef]
- Luo, M.; Li, S.; Di, Z.; Li, H.; Liu, Q.; Lü, B.; Wang, A.; Shi, B.; Khan, I. Fischer–Tropsch Synthesis: Study of Different Carbon Materials as Cobalt Catalyst Support. Reactions 2021, 2, 43–61. [Google Scholar] [CrossRef]
- Wang, C.; Kim, J.; Tang, J.; Na, J.; Kang, Y. Large-Scale Synthesis of MOF-Derived Superporous Carbon Aerogels. Angew. Chem. Int. Ed. 2020, 132, 2082–2086. [Google Scholar] [CrossRef] [PubMed]
- Xie, C.; Yan, D.; Chen, W.; Zou, Y.; Chen, R.; Zang, S.; Wang, Y.; Yao, X.; Wang, S. Insight into the design of defect electrocatalysts: From electronic structure to adsorption energy. Mater. Today 2019, 31, 47–68. [Google Scholar] [CrossRef]
- Chen, Y.; Chen, L.; Jiang, L.; Zhu, X.; Li, F.; Liu, X.; Mai, K.; Zhang, Z.; Fan, X.; Lv, X. Multifunctional radical polymers-enabled rapid charge/discharge and high capacity for flexible self-standing LiFePO4/PETM/SWNT hybrid electrodes. Chem. Eng. J. 2024, 482, 149008. [Google Scholar] [CrossRef]
- Zhao, X.; Zhang, L.; Chu, Z.; Wang, Q.; Cao, Y.; Cao, J.; Li, J.; Lei, W.; Zhang, B.; Si, W. Fe-Decorated Nitrogen-Doped Carbon Nanospheres as an Electrochemical Sensing Platform for the Detection of Acetaminophen. Molecules 2023, 28, 3006. [Google Scholar] [CrossRef] [PubMed]
- Jiang, Y.; Zhao, X.; Wang, Q.; Sun, Y.; Cao, Y.; Han, N.; Lee, C.; Cao, J.; Li, J.; Si, W. Facile Synthesis of Paper-Derived Porous Activated Carbon and the Electrochemical Determination of Hydrogen Peroxide. J. Electrochem. Soc. 2022, 169, 056510. [Google Scholar] [CrossRef]
- Wang, D.; Yang, Q.; Yang, G.; Xiong, S.; Li, X.; Peng, Y.; Li, J.; Crittenden, J. Rational tuning towards A/B-sites double-occupying cobalt on tri-metallic spinel: Insights into its catalytic activity on toluene catalytic oxidation. Chem. Eng. J. 2020, 399, 125792. [Google Scholar] [CrossRef]
- Wang, L.; Jiao, Y.; Yao, S.; Li, P.; Wang, R.; Chen, G. MOF-derived NiO/Ni architecture encapsulated into N-doped carbon nanotubes for advanced asymmetric supercapacitors. Inorg. Chem. Front. 2019, 6, 1553–1560. [Google Scholar] [CrossRef]
- Yu, S.; Wu, Y.; Xue, Q.; Zhu, J.-J.; Zhou, Y. A novel multi-walled carbon nanotube-coupled CoNi MOF composite enhances the oxygen evolution reaction through synergistic effects. J. Mater. Chem. A 2022, 10, 4936–4943. [Google Scholar] [CrossRef]
- Tan, Y.; Zhang, Z.; Lei, Z.; Yu, L.; Wu, W.; Wang, Z.; Cheng, N. Electronic modulation optimizes OH* intermediate adsorption on Co-Nx-C sites via coupling CoNi alloy in hollow carbon nanopolyhedron toward efficient reversible oxygen electrocatalysis. Appl. Catal. B Environ. 2022, 304, 121006. [Google Scholar] [CrossRef]
- Laviron, E. Adsorption, autoinhibition and autocatalysis in polarography and in linear potential sweep voltammetry. J. Electroanal. Chem. Interfacial 1974, 52, 355–393. [Google Scholar] [CrossRef]
- Wang, Q.; Li, R.; Zhao, Y.; Zhe, T.; Bu, T.; Liu, Y.; Sun, X.; Hu, H.; Zhang, M.; Zheng, X.; et al. Surface morphology-controllable magnetic covalent organic frameworks: A novel electrocatalyst for simultaneously high-performance detection of p-nitrophenol and o-nitrophenol. Talanta 2020, 219, 121255. [Google Scholar] [CrossRef] [PubMed]
- Lavanya, J.; Gomathi, N. High-sensitivity ascorbic acid sensor using graphene sheet/graphene nanoribbon hybrid material as an enhanced electrochemical sensing platform. Talanta 2015, 144, 655–661. [Google Scholar] [CrossRef]
- Meng, X.-T.; Zhu, D.-J.; Jiang, Y.-H.; Cao, Y.; Si, W.-M.; Cao, J.; Li, Q.-h.; Li, J.; Lei, W. Electrochemical sensing of phenacetin on electrochemically reduced graphene oxide modified glassy carbon electrode. New Carbon Mater. 2022, 37, 764–772. [Google Scholar] [CrossRef]
- Nicholson, R.S.; Shain, I. Theory of stationary electrode polarography. Single scan and cyclic methods applied to reversible, irreversible, and kinetic system. Anal. Chem. 1964, 36, 706–723. [Google Scholar] [CrossRef]
- Bard, A.J.; Faulkner, L.R.; White, H.S. Electrochemical Methods: Fundamentals and Applications; John Wiley & Sons: Hoboken, NJ, USA, 2022. [Google Scholar]
- Ren, H.; Wang, J.; Feng, H.; Li, Y.; Ye, B. A versatile ratiometric electrochemical sensing platform based on N-Mo2C for detection of m-nitrophenol. Biosens. Bioelectron. 2019, 144, 111663. [Google Scholar] [CrossRef] [PubMed]
- Ma, F.; Jin, S.; Li, Y.; Feng, Y.; Tong, Y.; Ye, B.-C. Pyrolysis-derived materials of Mn-doped ZIF-67 for the electrochemical detection of o-nitrophenol. J. Electroanal. Chem. 2022, 904, 115932. [Google Scholar] [CrossRef]
- Serrà, A.; Artal, R.; Pozo, M.; Garcia-Amorós, J.; Gómez, E. Simple Environmentally-Friendly Reduction of 4-Nitrophenol. Catalysts 2020, 10, 458. [Google Scholar] [CrossRef]
- Hwa, K.-Y.; Sharma, T.S.K.; Ganguly, A. Design strategy of rGO–HNT–AgNPs based hybrid nanocomposite with enhanced performance for electrochemical detection of 4-nitrophenol. Inorg. Chem. Front. 2020, 7, 1981–1994. [Google Scholar] [CrossRef]
- Cheng, X.; Xia, X.; Xu, Q.; Wang, J.; Sun, J.; Zhang, Y.; Li, S. Superior conductivity FeSe2 for highly sensitive electrochemical detection of p-nitrophenol and o-nitrophenol based on synergistic effect of adsorption and catalysis. Sens. Actuators B Chem. 2021, 348, 130692. [Google Scholar] [CrossRef]
- Sriram, B.; Kogularasu, S.; Wang, S.-F.; Sheu, J.-K. Rationally designed RGO@CuO@Mn2O3 as an excellent electrocatalyst for the rapid and real-time detection of 2-nitrophenol. New J. Chem. 2020, 44, 12465–12472. [Google Scholar] [CrossRef]
- Li, J.; He, L.; Jiang, J.; Xu, Z.; Liu, M.; Liu, X.; Tong, H.; Liu, Z.; Qian, D. Facile syntheses of bimetallic Prussian blue analogues (KxM[Fe(CN)6]·nH2O, M=Ni, Co, and Mn) for electrochemical determination of toxic 2-nitrophenol. Electrochim. Acta 2020, 353, 136579. [Google Scholar] [CrossRef]
- Yuan, M.; Zou, J.; Guan, J.; Huang, Z.; Yu, J. Highly sensitive and selective determination of p-nitrophenol at an interpenetrating networks structure of self-assembled rod-like lanthanum hydroxide-oxidized multi-walled carbon nanotubes nanocomposite. Ecotoxicol. Environ. Saf. 2020, 201, 110862. [Google Scholar] [CrossRef]
- Gerent, G.G.; Spinelli, A. Magnetite-platinum nanoparticles-modified glassy carbon electrode as electrochemical detector for nitrophenol isomers. J. Hazard. Mater. 2017, 330, 105–115. [Google Scholar] [CrossRef]
- Zhang, J.; Cui, S.; Ding, Y.; Yang, X.; Guo, K.; Zhao, J.-T. Two-dimensional mesoporous ZnCo2O4 nanosheets as a novel electrocatalyst for detection of o-nitrophenol and p-nitrophenol. Biosens. Bioelectron. 2018, 112, 177–185. [Google Scholar] [CrossRef] [PubMed]
- Huang, Y.; Bai, S.; Huang, J.; Ma, Y.; Zeng, Q.; Wang, M.; Wang, L. Simultaneous detection of nitrophenol isomers using an easy-to-fabricate thiophene-based microporous polymer film modified electrode. Microchem. J. 2020, 153, 104465. [Google Scholar] [CrossRef]


Disclaimer/Publisher’s Note: The statements, opinions and data contained in all publications are solely those of the individual author(s) and contributor(s) and not of MDPI and/or the editor(s). MDPI and/or the editor(s) disclaim responsibility for any injury to people or property resulting from any ideas, methods, instructions or products referred to in the content. |
© 2024 by the authors. Licensee MDPI, Basel, Switzerland. This article is an open access article distributed under the terms and conditions of the Creative Commons Attribution (CC BY) license (https://creativecommons.org/licenses/by/4.0/).