Article

Numerical Simulations of the Impact of CaO/Al2O3 on the Structure and Crystallization Behavior of Red Mud

College of Metallurgy and Energy, North China University of Science and Technology, Tangshan 063009, China
*
Author to whom correspondence should be addressed.
Crystals 2024, 14(6), 526; https://doi.org/10.3390/cryst14060526
Submission received: 19 May 2024 / Revised: 30 May 2024 / Accepted: 30 May 2024 / Published: 31 May 2024
(This article belongs to the Special Issue Crystallization Process and Simulation Calculation, Second Edition)

Abstract

:
The problem of large stockpiles of red mud needs to be solved, and the use of red mud to prepare inorganic fibers is a new way of applying red mud on a large scale. The role of CaO/Al2O3 in the melting point and melt structure of red mud was investigated by molecular dynamics simulations and thermodynamic calculations. Liquid phase line temperatures for different CaO/Al2O3 systems were calculated using the Factsage program. The radial distribution function and the type of oxygen bonding were used to characterize the effect of different CaO/Al2O3 on the structure of the red mud melt. The melting point of MgAl2O4 is lower than that of CaTiO3 due to the fact that the type of oxygen bonding in MgAl2O4 is predominantly bridging oxygen bonds. When the red mud system has a low SiO2 content and CaO/Al2O3 is between 0.3 and 3.9, the melting point temperature increases significantly, which is not conducive to the fibrillation of the red mud melt.

1. Introduction

Red mud is a common type of non-ferrous metal industrial solid waste, typically referred to as waste slag generated during the alumina production process using the Bayer method [1,2,3,4]. Due to its complex composition and high alkalinity, as well as limited recycling research, red mud has not been effectively recycled, resulting in large-scale accumulation in landfills [5,6,7]. To recover the iron content from red mud, a process involving a rotary hearth furnace can yield low iron-containing red mud via extraction [8]. The resulting silicate substance mainly consists of SiO2, Al2O3, CaO, and Na2O, and can be used to produce mineral wool fibers. The research, development, and industrialization of mineral wool fiber products can serve as an effective strategy to utilize solid waste, such as red mud melt, on a large scale [9,10,11]. However, because the Al2O3 content in red mud melt exceeds the composition requirements of mineral wool fibers [12], with insufficient CaO and SiO2 content, modulators with high silicon and low aluminum are needed to modify red mud melts.
Crystallization will occur during the fiberizing process of red mud slag. These crystals can potentially cause the fibers to break and affect the overall quality of mineral wool fibers [13,14,15]. In recent years, FactSage 7.1 thermodynamic calculation software has been commonly used to study the crystalline phases of high-temperature slag, to help elucidate the impact of slag composition on crystalline phase transition [16,17,18]. Unfortunately, thermodynamic calculations can only provide information such as crystalline phase precipitation and transformation, which may not provide suitable results for describing or explaining the evolution of ordered crystalline phase structures during the cooling process. Materials Studio 2017 (MS) simulation software serves as a powerful tool to study the crystal phase network structure at the molecular level, and has been widely used to uncover the fundamental physical properties of microstructure evolution [19,20]. Using molecular dynamics simulations, Bi et al. [21] found that changes in the Al2O3 content in SiO2-CaO melts cause Al2O3 to exhibit amphoteric behavior and affect the bridging oxygen content and degree of polymerization in the system. In terms of slag crystallization behavior, MS simulations can offer insight into the continuous changes in the structure and properties of slag at different cooling temperatures [22]. The radial distribution function, mean coordination number, and bridging oxygen distribution results can be used to analyze the role of each component in the system, providing a correlation between crystal phase structure evolution and performance.
Al2O3 is an amphoteric oxide with different coordination forms in different acid–base systems, and can be used as a network former and modifier [23,24,25]. In silicate systems, CaO is a major source of free oxygen supply, and differences in the CaO content of the system affect the amphoteric behavior of Al2O3. Due to the high Al2O3 content in red mud melt, and considering the modification direction of mineral wool fiber and the difficulty of obtaining conditioners, in this study, we used CaO as the alkaline modifier. We also explored the impact of increasing calcium and reducing aluminum on the crystallization behavior of the red mud melt. Combined thermodynamic calculations and molecular dynamic simulations were used to analyze the impact of the CaO/Al2O3 mass percentage ratio on the crystallization phase during the red mud slag cooling process, particularly focusing on the primary phase at high temperatures. This study revealed how CaO/Al2O3 impacted the network structure of the red mud melt slag system from a microscopic perspective, providing theoretical guidance for improving the crystallization behavior of the red mud melt slag fibrillation process.

2. Materials and Methods

2.1. Simulation Method

The red mud raw material comes from an aluminum plant in Shandong Province, China. The pre-treatment process flow for iron extraction from red mud is red mud mixing after balling treatment into the rotary hearth furnace for roasting, and then heating by the electric arc furnace and reduction; to obtain the fused slag and molten iron, this process can be used directly for the production of steelmaking iron. The chemical composition of the red mud after iron extraction is shown in Table 1. In this study, due to the pre-treatment, during which most of the Fe2+ was oxidized to Fe3+, iron is only represented as Fe2O3 in this paper. Based on the main compositions of red mud in Table 1, seven main components were selected for the design of the simulation scheme. Table 2 presents the design method used in this study, where CaO/Al2O3 was increased from 0.3 to 3.9, and all other components remained constant.

2.2. Thermodynamics Calculations

The thermodynamic calculations in this study were conducted using the FactPS and FToxid databases in the FactSage 8.1 software package [13]. In addition, the Equilb module was used to calculate the liquidus temperature of the melted red mud system at equilibrium, as well as the type and content of the initial crystallization phase during the cooling process. The calculations were carried out in the temperature range of 1200 to 1600 °C at standard atmospheric pressure.

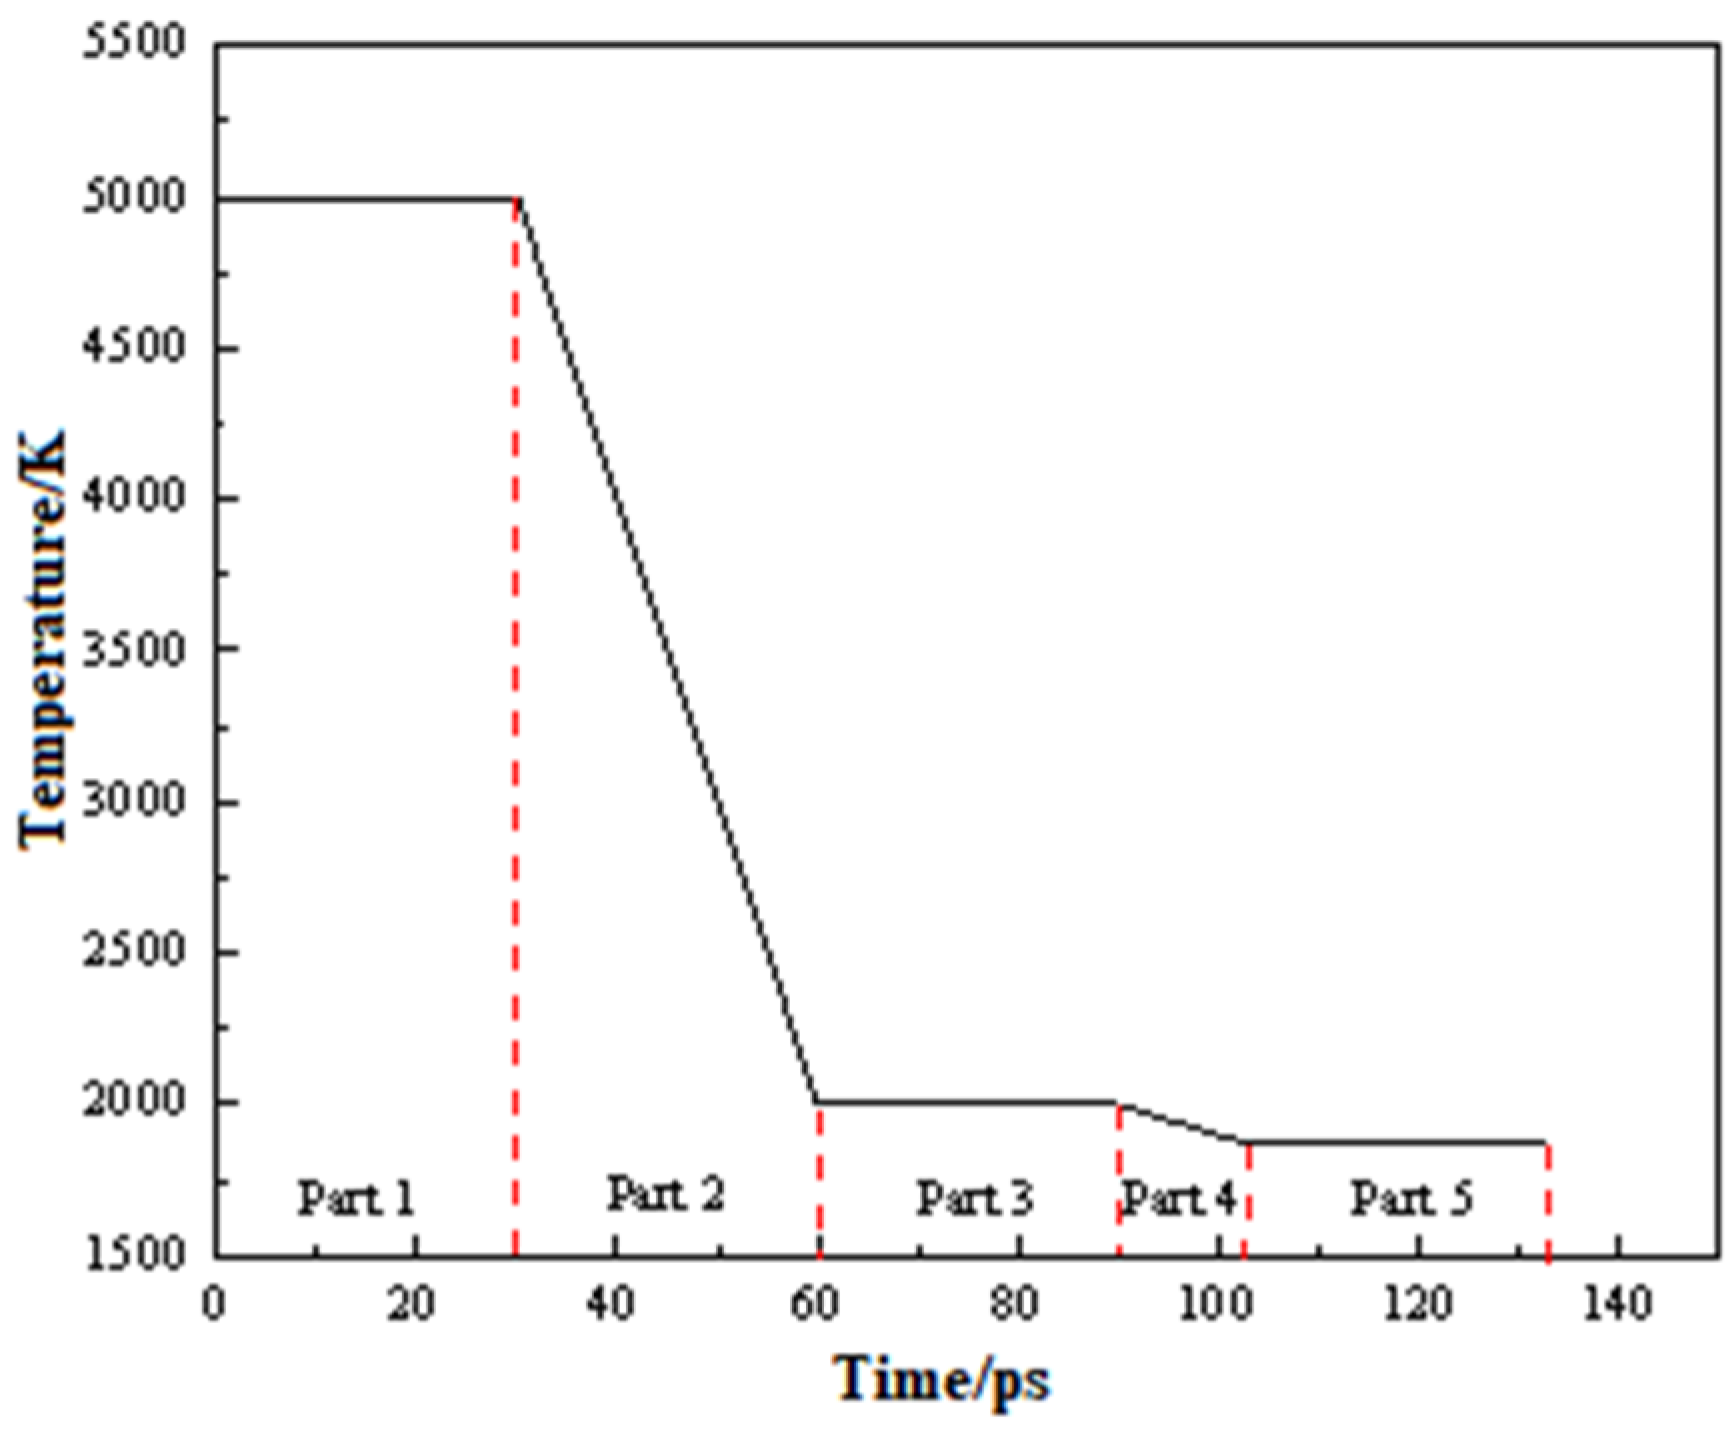
2.3. Molecular Dynamics Simulations

The Garofalini potential function in MS 2021 software was used in the molecular dynamics simulations of the red mud melt slag, to describe the interactions between the particles in the silicate melt [26]. Under this potential field, oxygen and metal atoms were imported into the three-dimensional periodic model as a single particle, and the number of atoms in the system was not limited. These assumptions met the requirements of random atom distribution in the red mud melt system. The Garofalini potential function contained a modified BMH potential function and a three-body potential function including the Coulomb potential, repulsive potential, and attractive potential, with the following expression:
V i j = q i q j 4 π ε 0 r i j + A i j exp ( B i j r i j ) C i j r i j 6 D i j r 8
where Vij is the interaction potential between atoms i and j, qiqj denotes the charge of atoms i and j, ɛ0 is the dielectric constant of the free space, rij is the distance between atoms i and j, and Aij, Bij, Cij, and Dij denote the potential constants between the atom couples. Table 3 lists all potential constants used in this study.
When using MS to simulate the microstructure of the red mud melt slag, the initial model required an amorphous state, with the atoms in a disordered and randomly distributed state. The atom number and density in the system, the calculation time, and the algorithm were critical to the accuracy and validity of the simulation results. In this study, the total number of atoms in the seven sample groups varied between 2121 and 2278, and the system density was in the range of 3.31 and 3.17 g/cm3, as shown in Table 4. The atoms in each group were randomly placed in the model box, where the side length of the simulation box was 32.5 Å. Periodic boundary conditions were applied around the model box to form a boundaryless infinite system, to make the calculation results more realistic.
Because the BMH potential energy assumed that the red mud melt slag system was completely molten during the simulation, the simulation had to be conducted at the temperature of complete melting. According to the thermodynamic calculation results, the liquid phase regions of the different CaO/Al2O3 samples were all below 1873 K. To ensure that the atoms in the melt system were uniformly mixed and in a molten state, the micro-canonical ensemble (NVE) was used to describe the relaxation process, and the canonical ensemble with a Nosé–Hoover thermal bath (NVT) was used to describe the cooling process when the system temperature was lowered to 1873 K. The entire cooling process could be divided into five stages, as shown in Figure 1. (1) The initial temperature was set as 5000 K and the relaxation time was set to 30 ps. (2) After 30 ps, the system was cooled down to 2000 K, and the cooling rate was 1 × 10¹⁴ K/s. (3) The system was relaxed at 2000 K for 30 ps. (4) The system was cooled down to 1873 K after 12.7 ps, and the cooling rate was 1 × 10¹³ K/s. (5) The system was finally relaxed at 1873 K for 30 ps. Based on the microstructural information obtained after the fifth relaxation stage, we assessed the bond length, bond angle, mean square displacement (MSD), bridge oxygen, and Q m n distribution in the system with different CaO/Al2O3 ratios.

3. Results

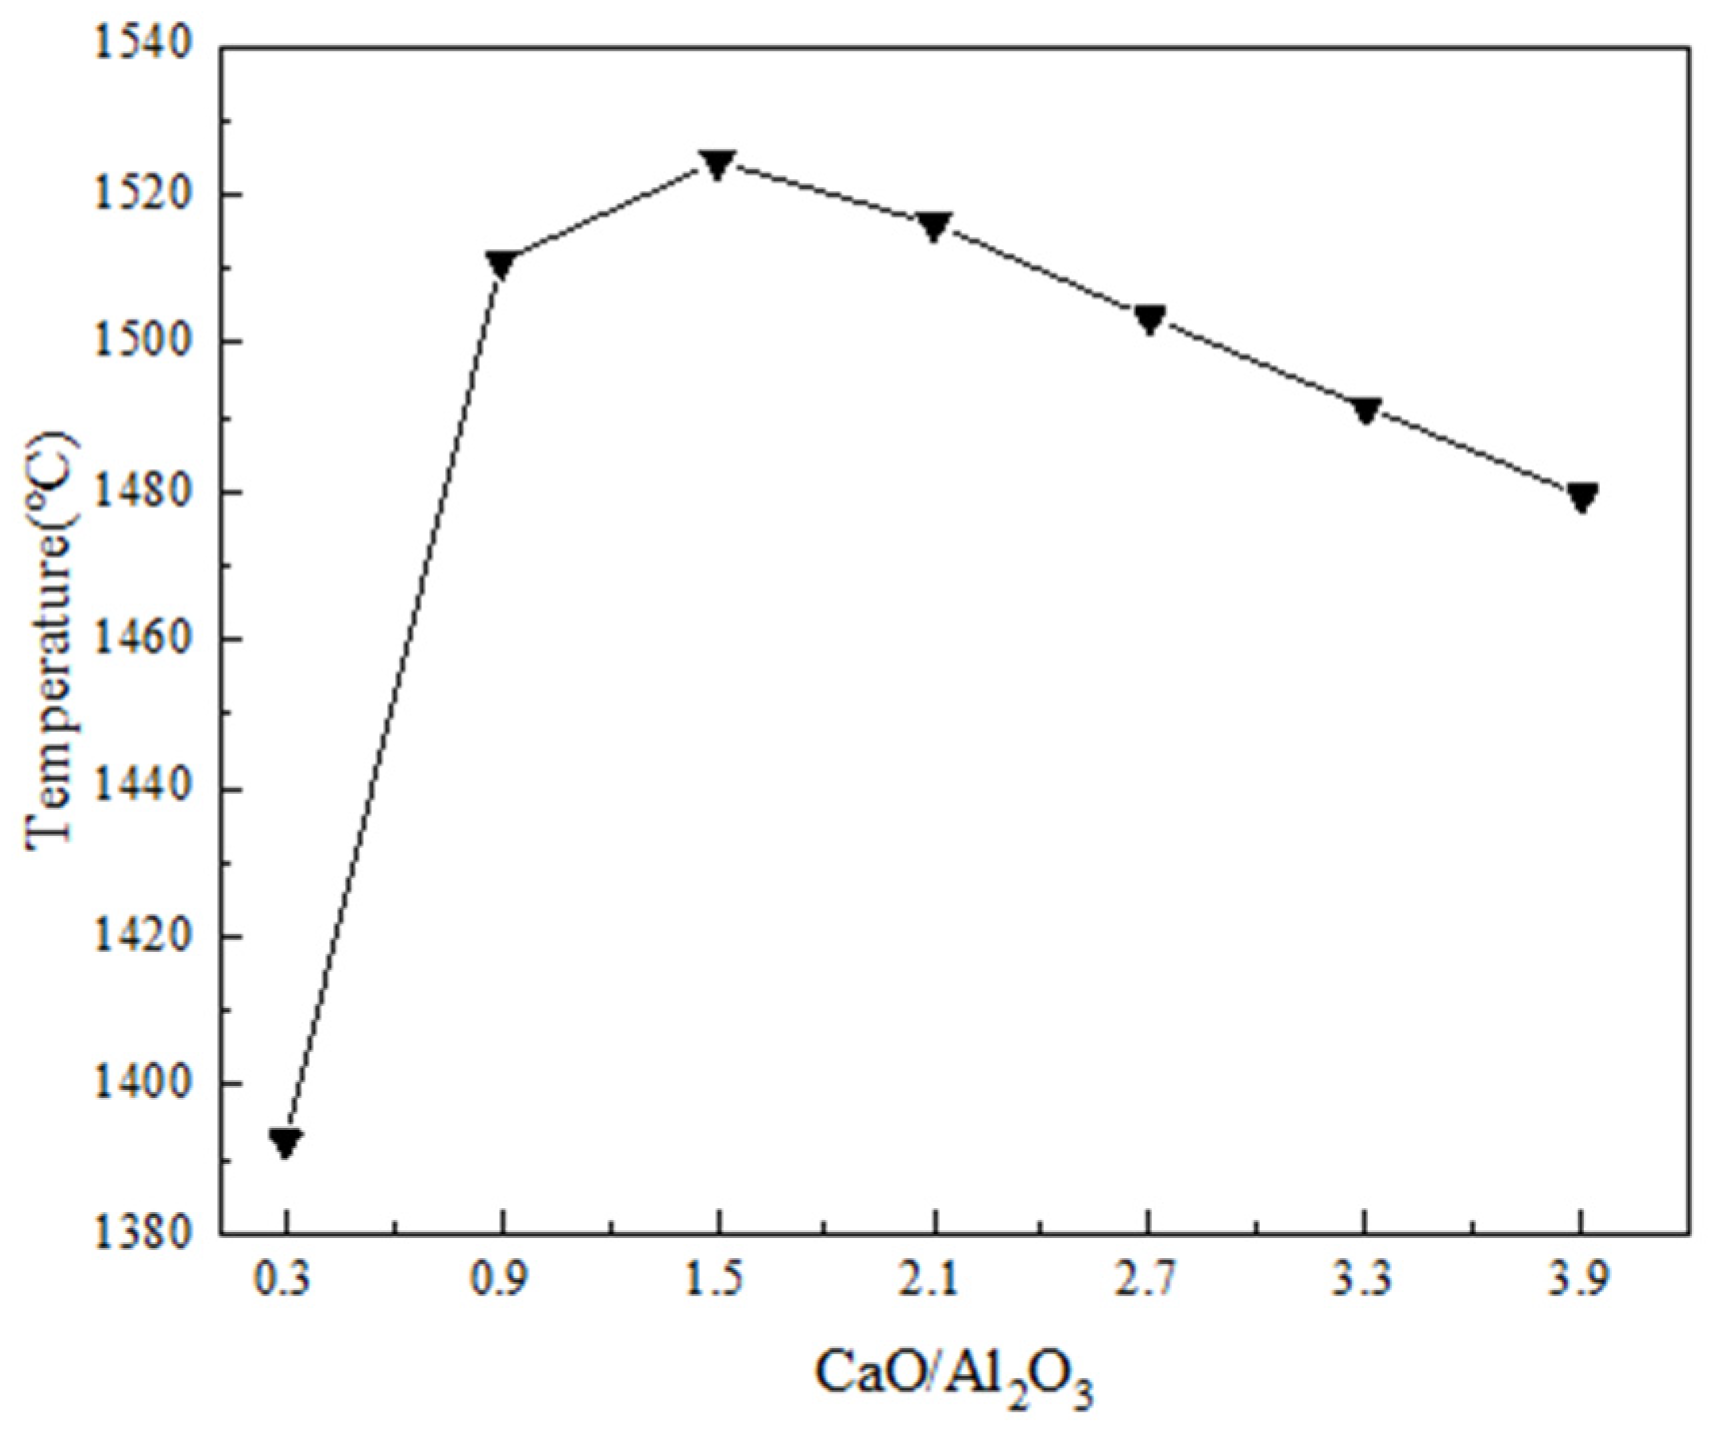
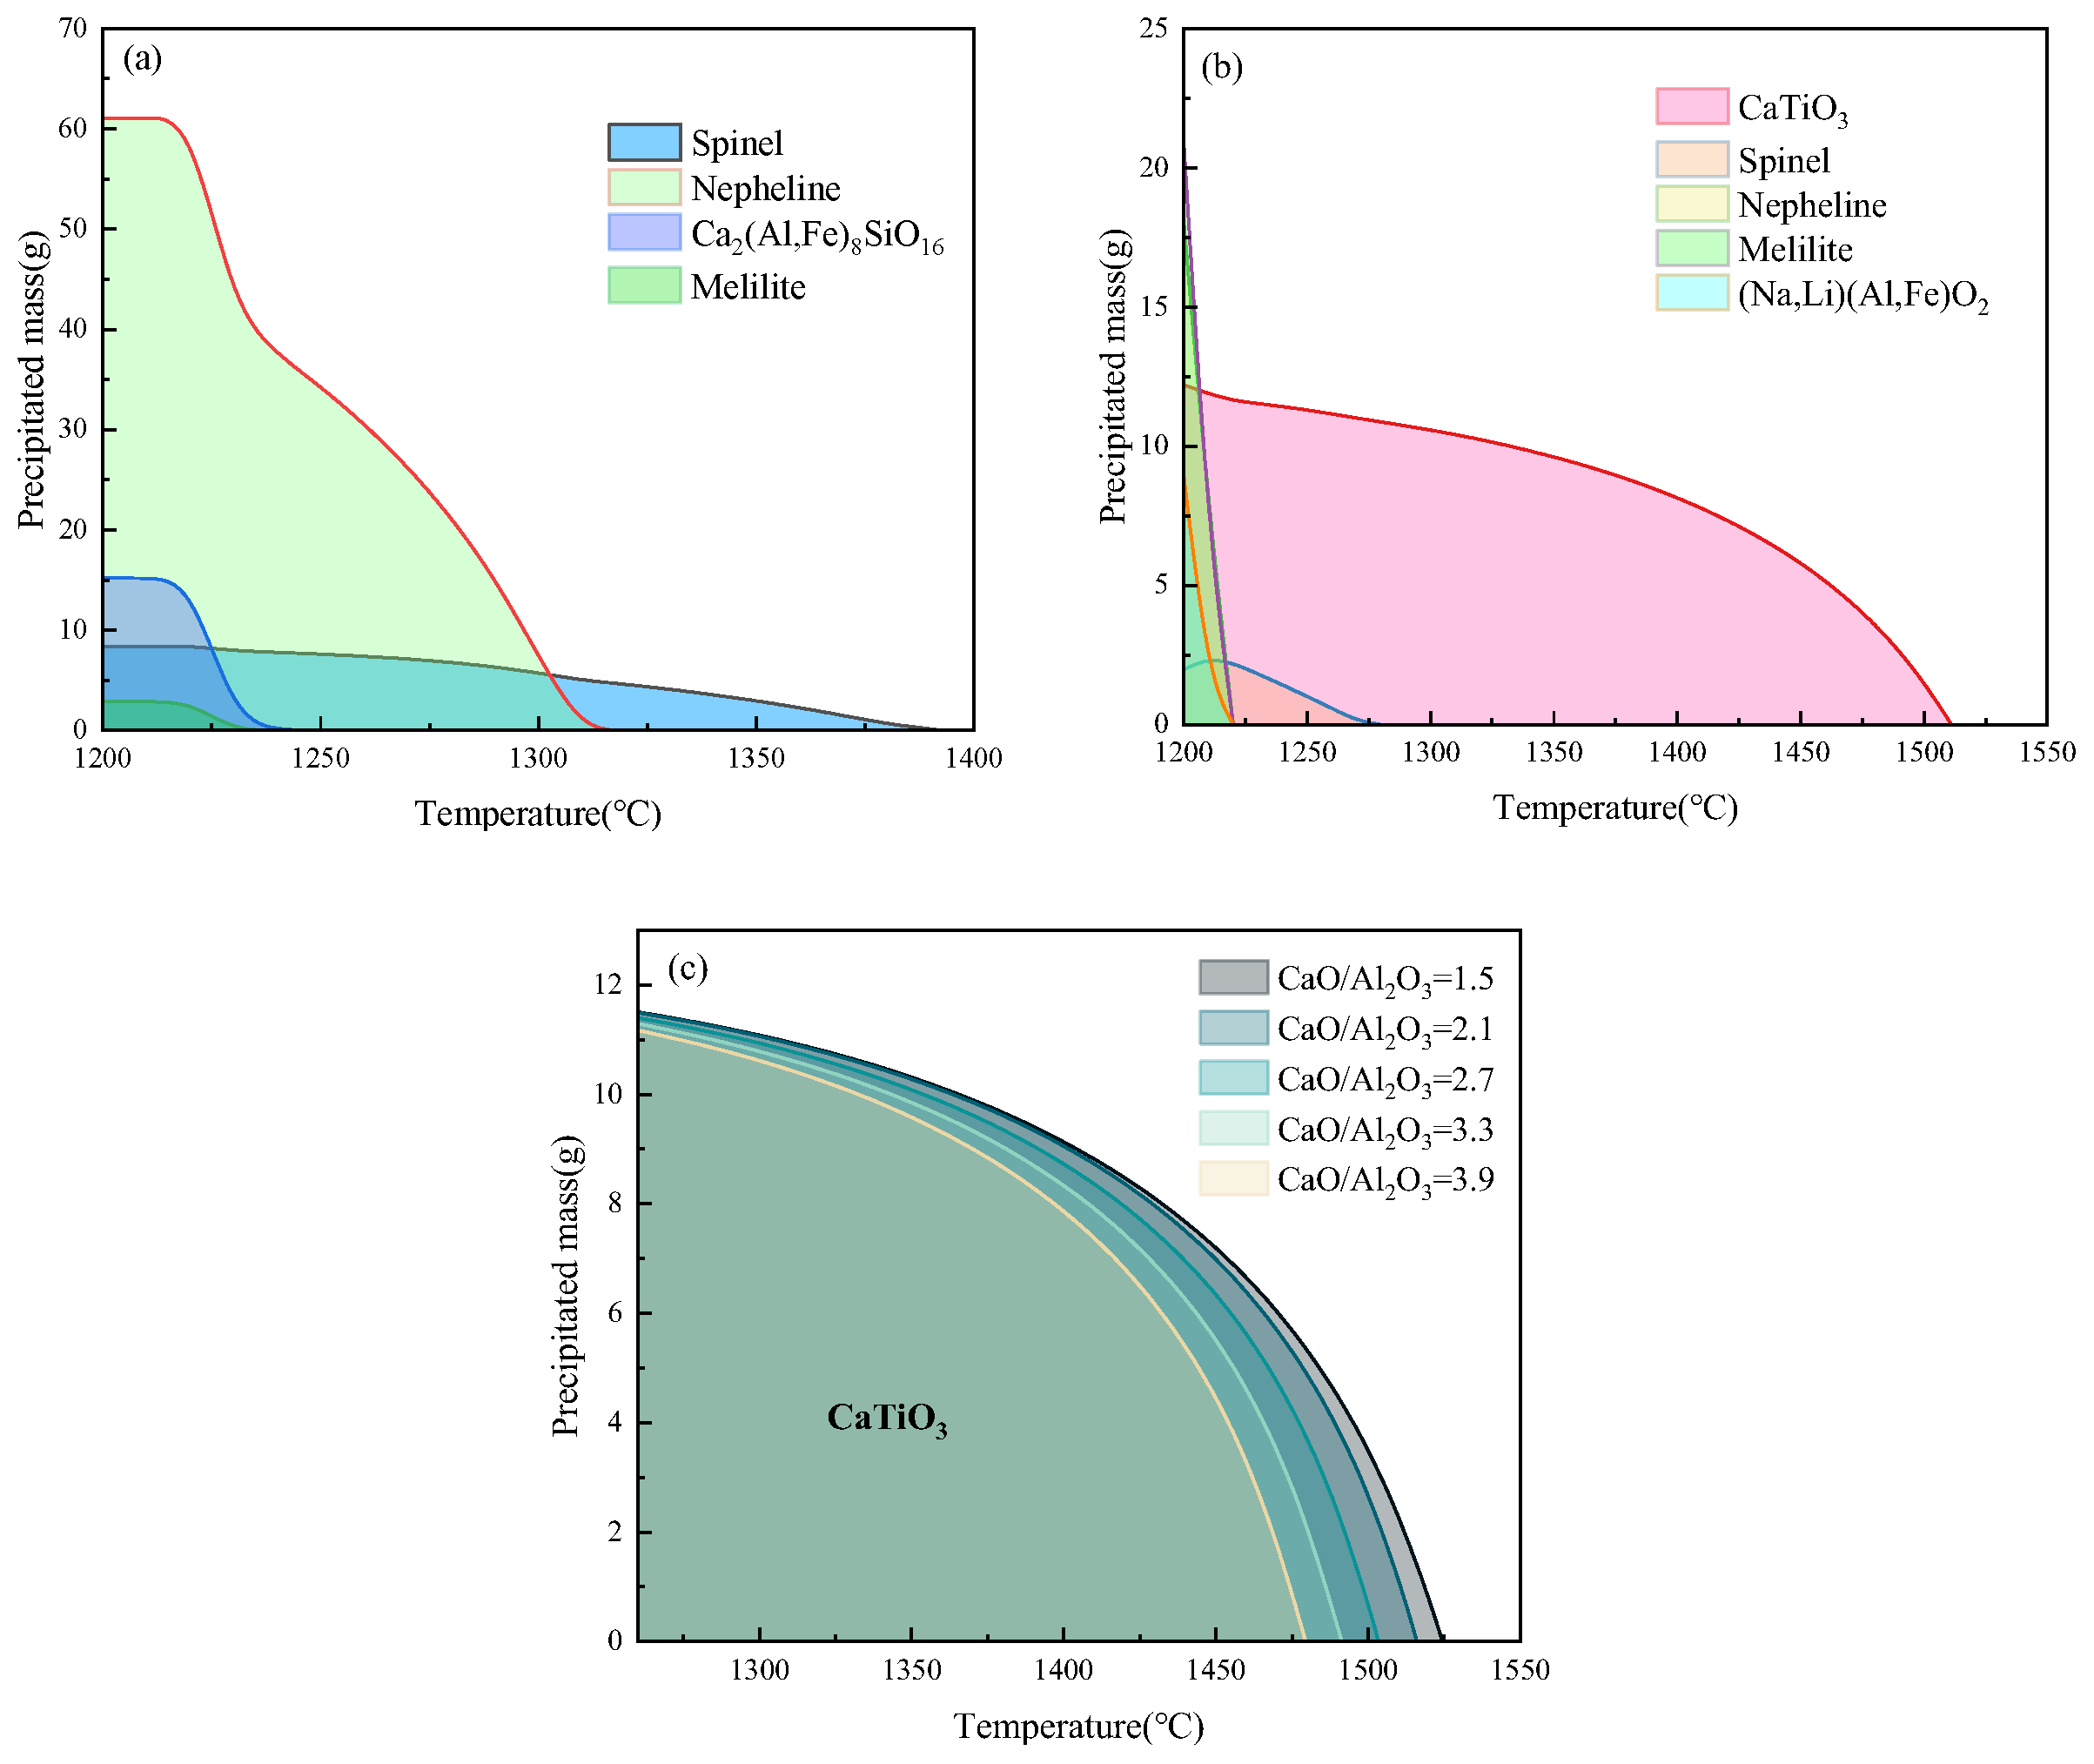
3.1. Calculation of Red Mud Melting Point (Liquidus Temperature)

Above the liquidus temperature, the system was entirely in a liquid phase, while below this temperature, crystals started to precipitate as primary crystals. In order to investigate the influence law of CaO/Al2O3 on the melting point of red mud, calculations were carried out using the Scheil–Gulliver cooling model in the Equlib module of FactSage 8.1 thermodynamic software. The liquid phase line temperature of the red mud system was predicted and the data are shown in Figure 2.
At lower CaO/Al2O3 (0.3 to 1.5), the melting points calculated by FactSage increase rapidly as CaO/Al2O3 increases. Then, after CaO/Al2O3 is greater than 1.5, the melting point tends to decrease slowly. When CaO/Al2O3 increased from 0.3 to 1.5, the melting point of the feedstock increased by 132 °C, indicating that high melting point substances were generated in the system at lower CaO/Al2O3. This shows that when the SiO2 content in the red mud is low, a small increase in CaO/Al2O3 will cause a significant increase in the melting point of the red mud, in which it is difficult for CaO to play the role of fluxing, but instead plays the role of nucleation. When CaO/Al2O3 increased from 1.5 to 3.9, the melting point of the raw material decreased by 45 °C, indicating that the effectiveness fluxing of CaO gradually began to appear at higher CaO/Al2O3.
The stable phases first formed by the melt under different CaO/Al2O3 conditions were also analyzed using the Equilib module of FactSage, as shown in Figure 3. When CaO/Al2O3 is 0.3, the first and most stable phase is Spinel, and after CaO/Al2O3 reaches 1.5, the first stable phase is CaTiO3. There is a significant change in the liquidus temperature with increasing CaO/Al2O3, which may be attributed to the microstructural transition between Spinel and CaTiO3. The liquidus temperature is above 1480 °C, when CaTiO3 is the first stable phase to appear in the red mud melt. In this range, the flow behavior of the melt is not suitable for the preparation of inorganic fibers. Therefore, it is necessary to analyze the microstructural features provided by the MS results, such as the radial distribution function (RDF) and oxygen bonding species, in order to reveal the influence of CaO/Al2O3 on the melting point in the following calculations.

3.2. Analysis of the Red Mud Melt Structure

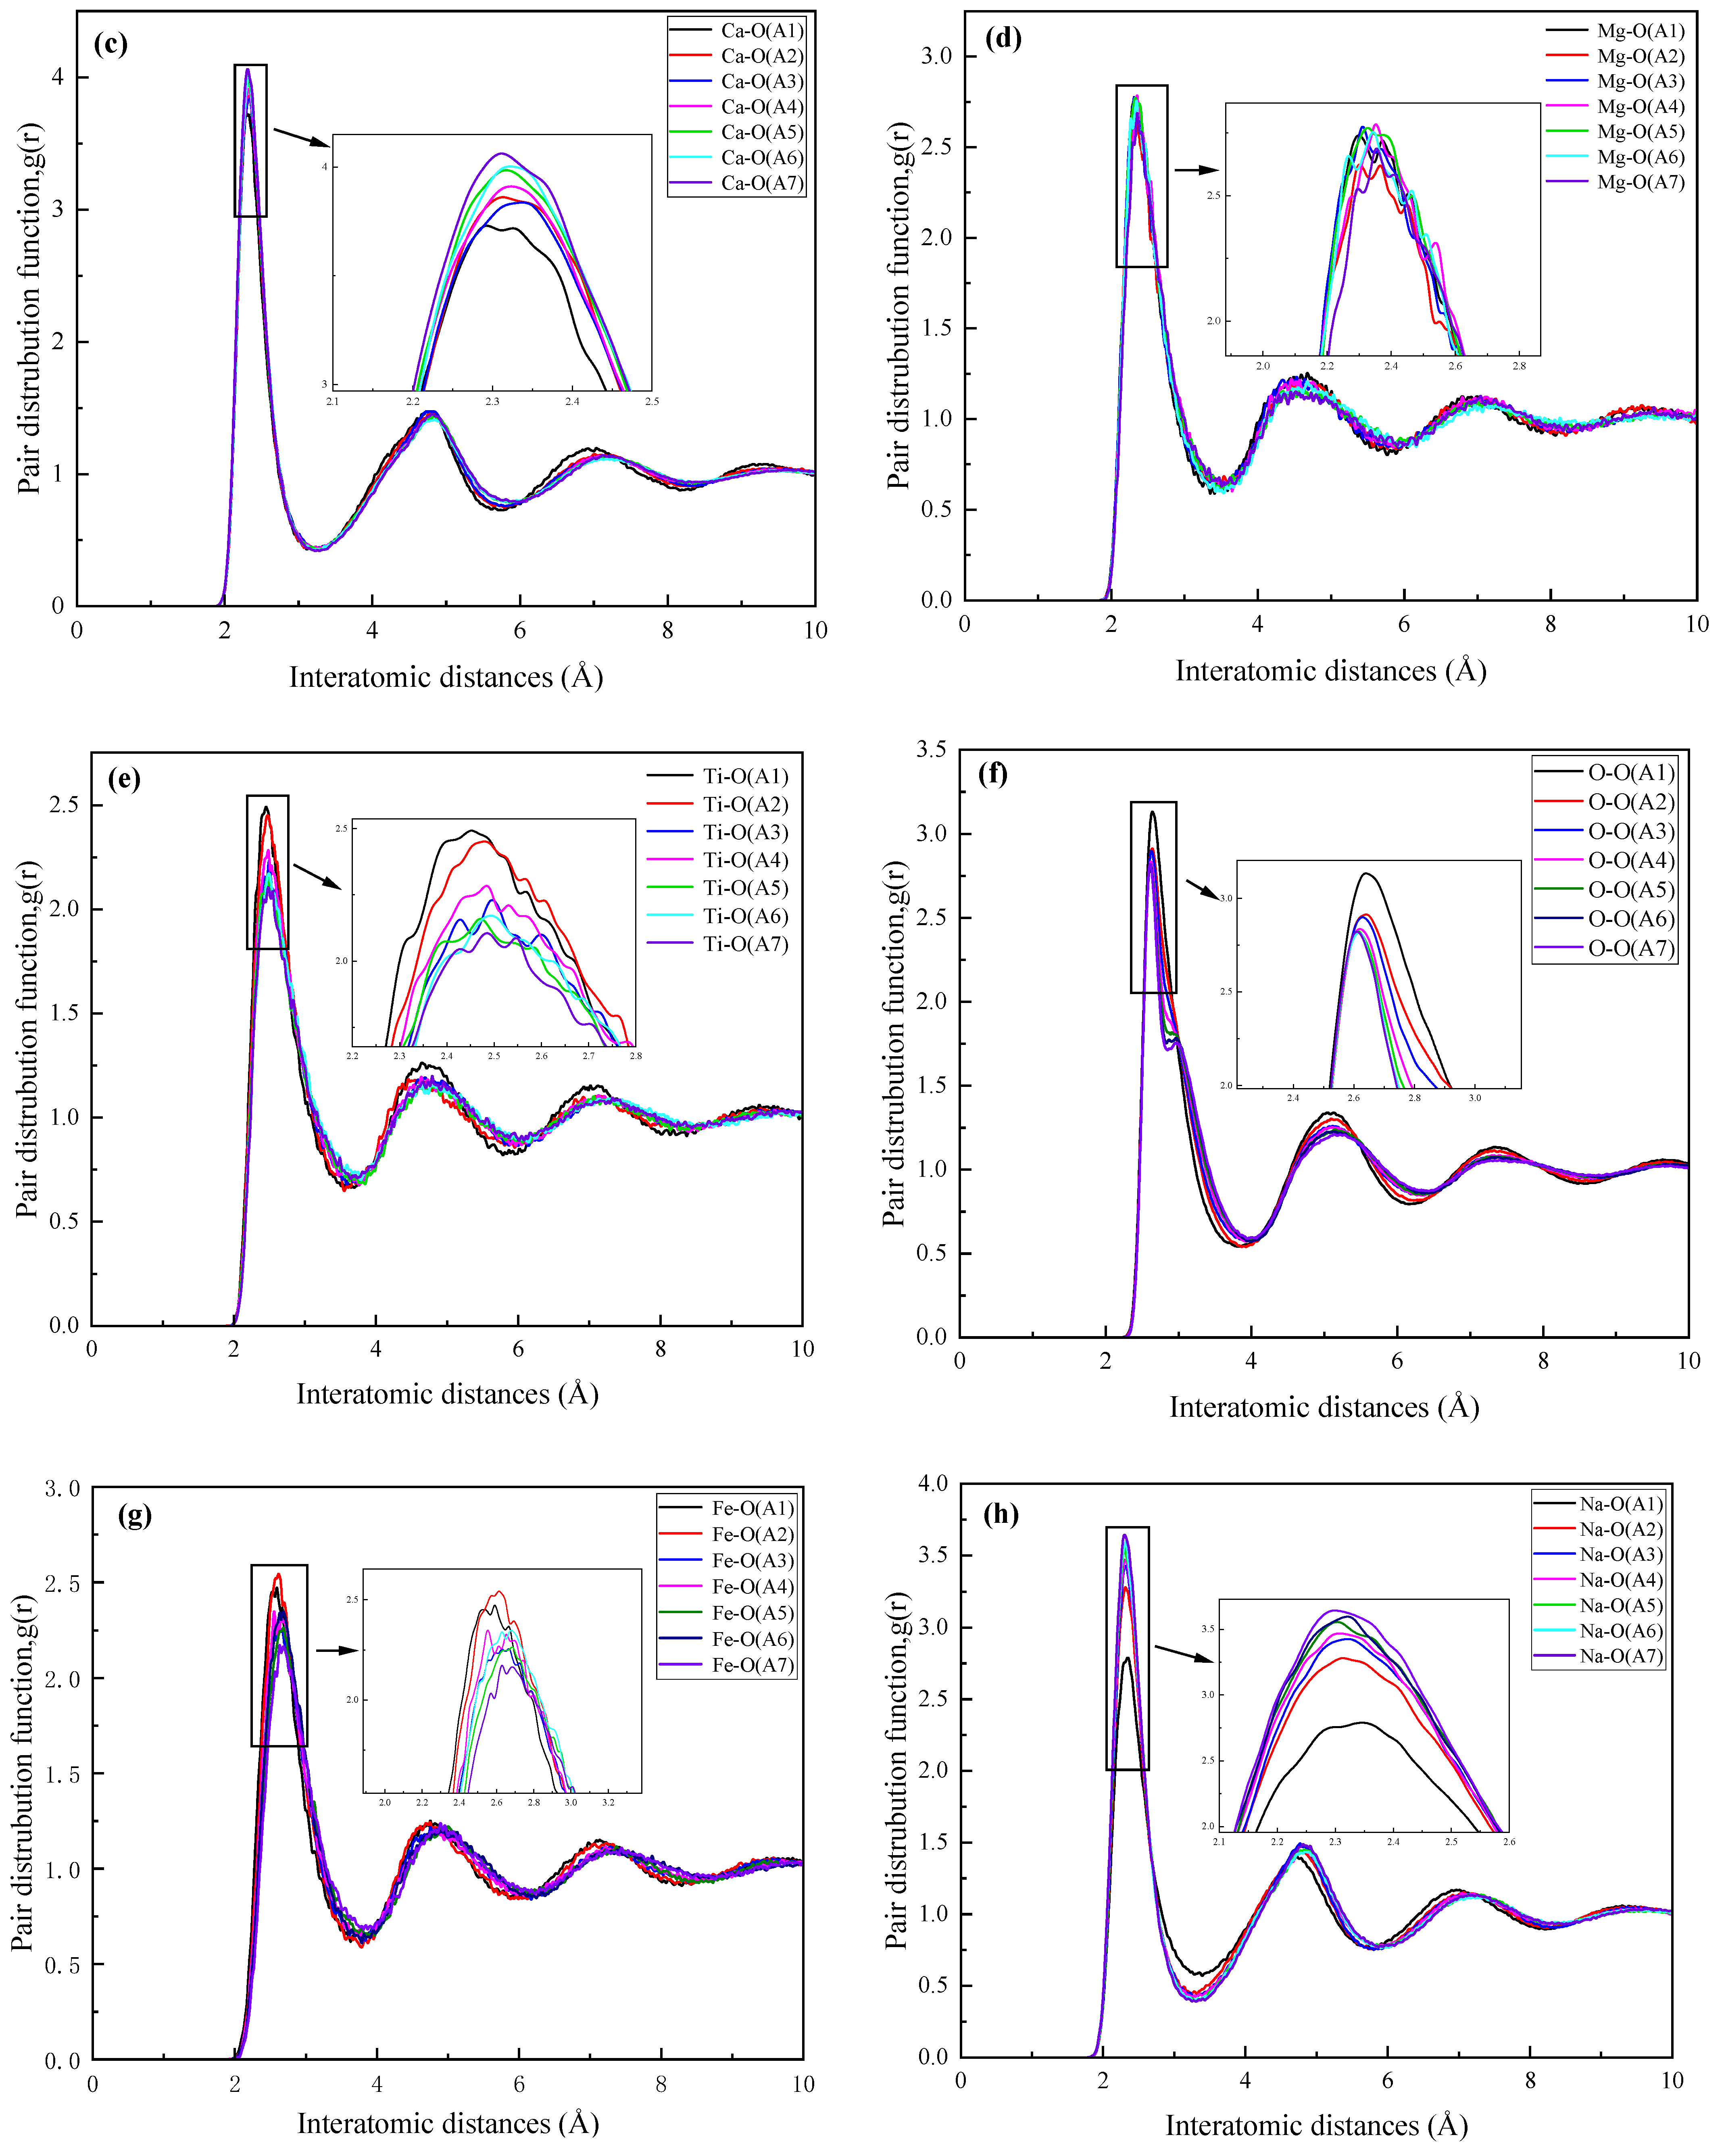
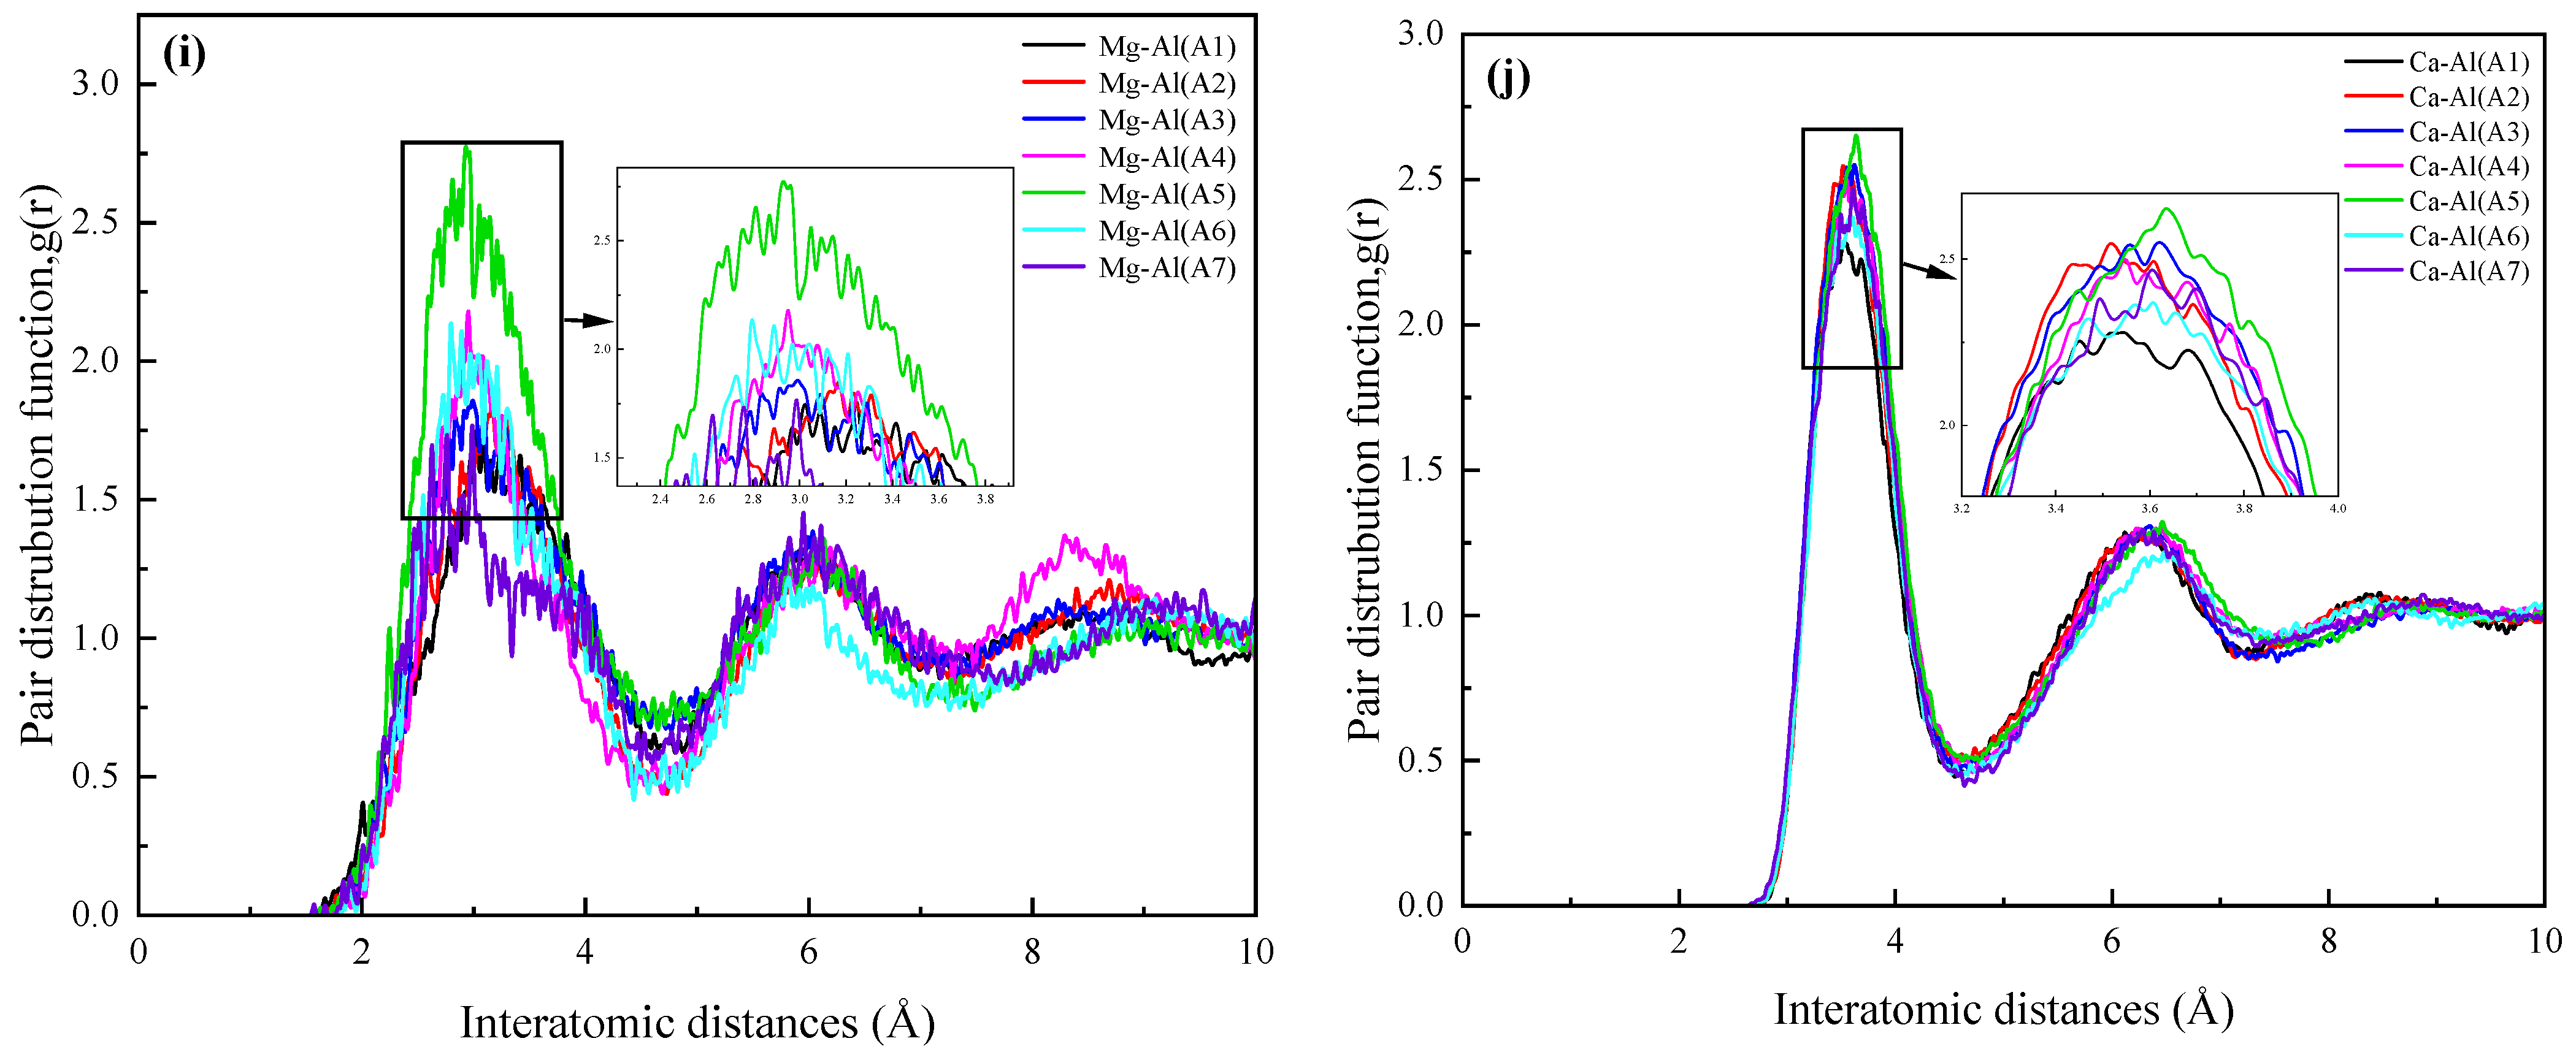
3.2.1. Radial Distribution Function

The radial distribution function (RDF) was used to describe the nearest neighbor distribution between atoms in the melt, as well as the distribution of other surrounding particles [27]. The RDF curve when CaO/Al2O3 increased from 0.3 to 3.9 is shown in Figure 4. The abscissa value of the first peak in (a)–(h) consisted of the bond length of the corresponding ion pairs. Due to the similarity in chemical bonds, the bond length positions of Si–O and Al–O in the different slag systems were the same. The abscissa value of the first peak in the radial distribution function of the corresponding iron pair was represented by r1, indicating the bond length between the corresponding ion pair. The length of each bond in the melt is shown in Table 5. As shown in Table 5, we observed that the r1 of various ions and oxygen ions did not vary significantly as CaO/Al2O3 increased, and the r1 values were maintained at 1.59 Å (Si–O bond), 1.77 Å (Al–O bond), 2.31 Å (Ca–O bond), 2.35 Å (Mg–O bond), 2.48 Å (Ti–O bond), 2.62 Å (O–O bond), 2.63 Å (Fe–O bond), and 2.32 Å (Na–O bond). In addition, the r1 values of Mg–Al and Ca–Al did not vary significantly and were maintained at 3.00 Å and 3.58 Å, respectively. These values are consistent with the results obtained in the literature [28,29].
According to the peak height, the peak heights of the Mg-O and Al-O RDF curves of MgAl2O4 are more similar to the peak heights of the RDF curves at a CaO/Al2O3 of 0.3 [30], and the peak Ca-O and Ti-O RDF curves for CaTiO3 are more similar to the peak heights of the RDF curves for CaO/Al2O3 of 0.9 and above [31].
As shown in Figure 4, the first peaks in the Si–O, Al–O, Ca–O, and Na–O RDF curves became more prominent with increasing CaO/Al2O3, indicating that the number of oxygen atoms surrounding Si, Al, Ca, and Na increased as CaO/Al2O3 increased. This could be attributed to the fact that CaO served as a substantial source of free oxygen. The first peak in the O–O RDF curve decreased as CaO/Al2O3 increased, due to stronger attraction between the Ca and O atoms compared to between the oxygen atoms. Therefore, as the number of Ca atoms increased, the oxygen atoms surrounding O gradually decreased. The second-to-third-peak ratio in the Ca–O and Na–O RDF curves was larger than in the Si–O and Al–O curves, because the impact of Ca and Na on O was larger than the impact of Si and Al on O [32]. In addition, in combination with Table 5, it can be found that the r1 value of the Al-O bond tends to decrease with the increase in CaO/Al2O3 in the system, which proves that the increase in CaO content affects the stability of the Al-O bond.

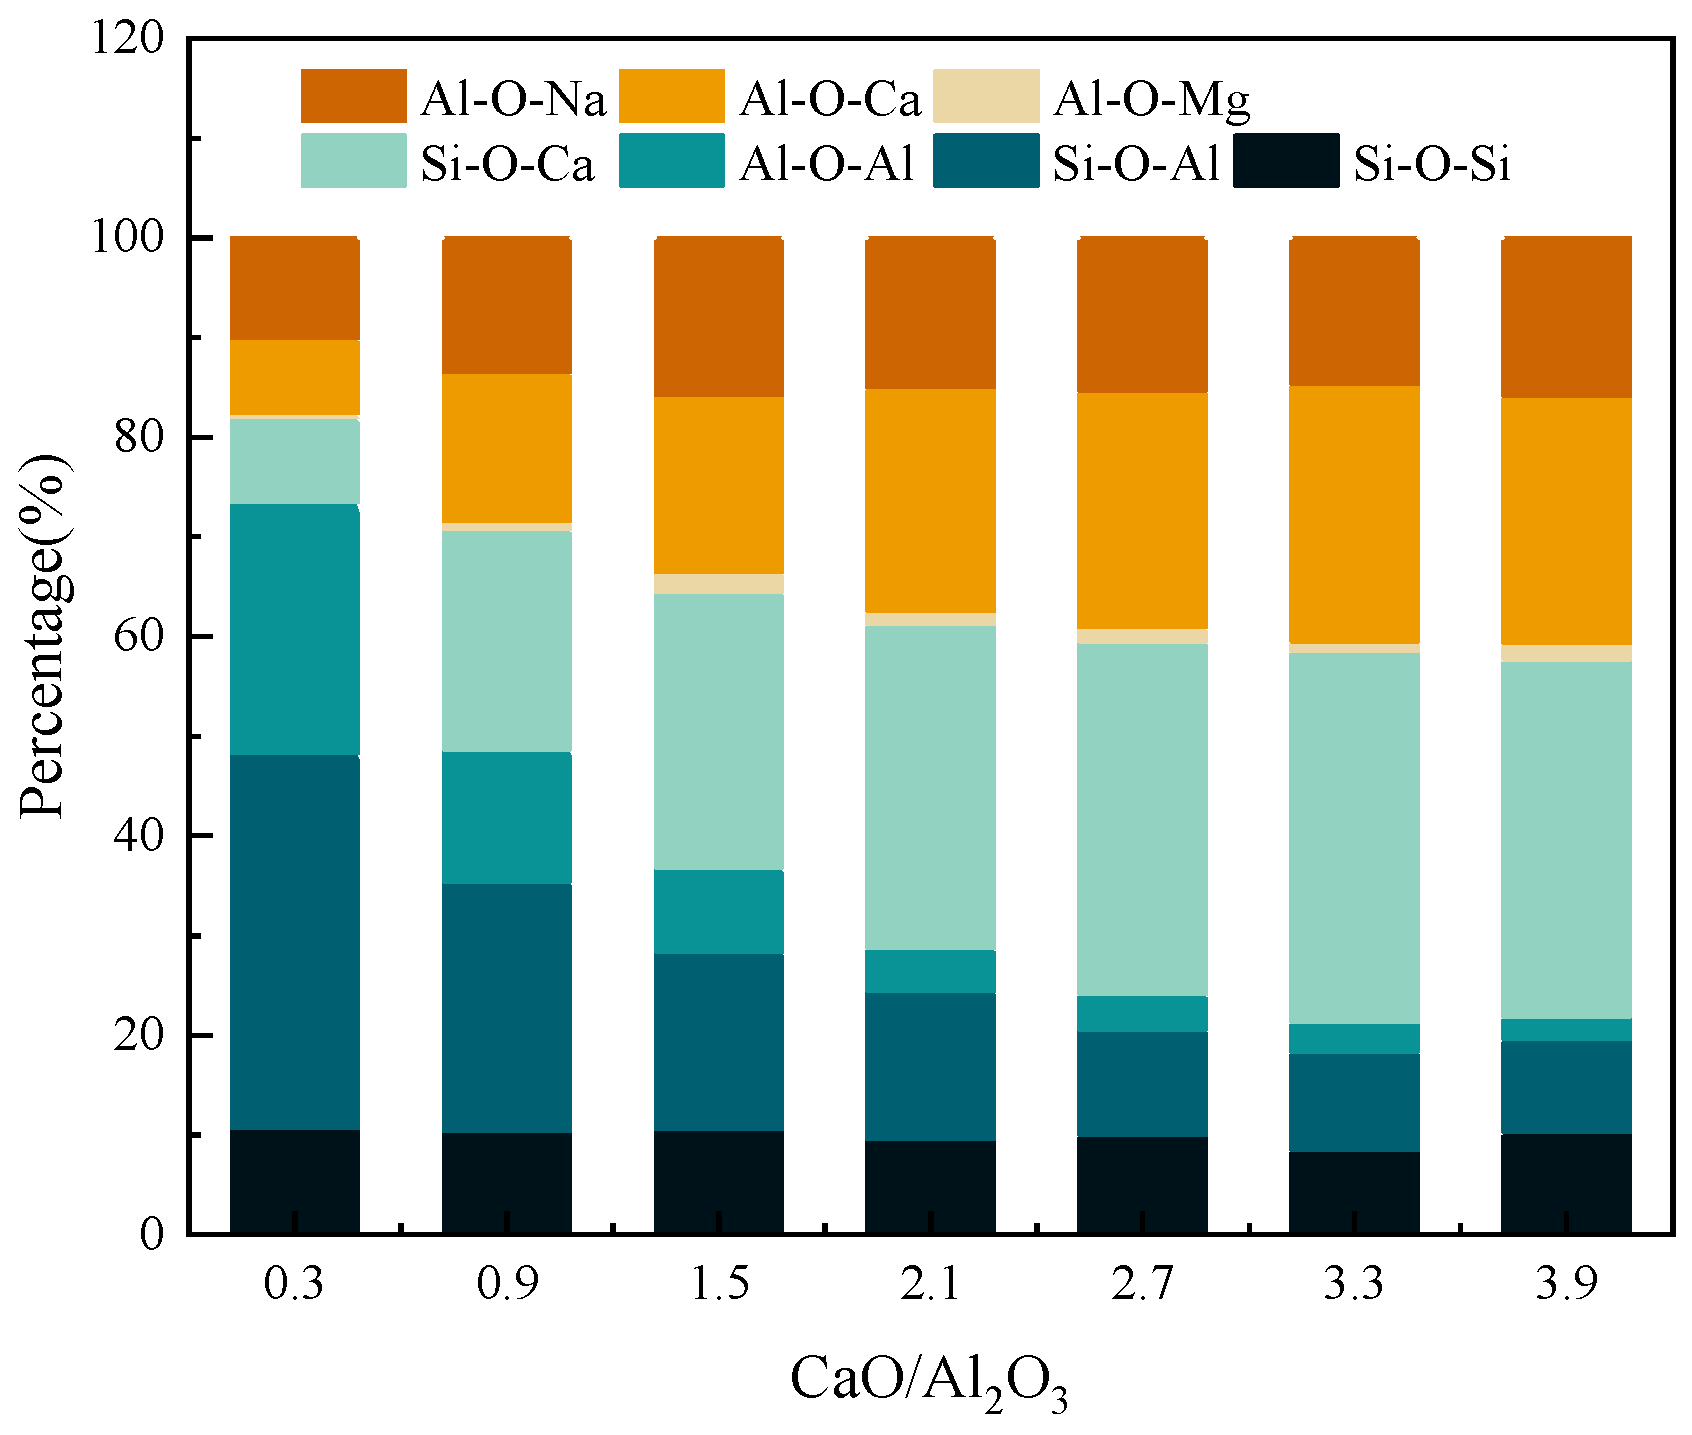
3.2.2. Oxygen Components

The changes in bridging and non-bridging oxygen in the red mud melts are shown in Figure 5, indicating that the Si–O–Al bonds, Al–O–Al bonds, and Si–O–Si bonds were the main components of the bridging oxygen bonds. When CaO/Al2O3 is 0.9, the surrounding Si-O-Al decreases by about 29% and Al-O-Al decreases by about 44%, while the Si-O-Ca and Al-O-Ca contents start to increase significantly, with no significant changes in the other bond types. This is consistent with the prediction described above that Ca atoms interact primarily with Al-O.
As can be seen in Figure 5, the number of bridging oxygen bonds decreases to less than 50% when the CaO/Al2O3 in the system is 0.9, and non-bridging oxygen becomes the dominant oxygen species in the melt. The oxygen species in MgAl2O4 are predominantly bridging oxygen bonds, whereas non-bridging oxygen bonds predominate in CaTiO3. This difference explains well the increase in the melting point when changing from Spinel to CaTiO3. That is, upon raising CaO/Al2O3 in the melt, the bridging oxygen atoms in the melt, which connect the tetrahedra to form a stable structure, are transformed into non-bridging oxygen atoms. This transformation phenomenon may be related to the free oxygen atoms provided by the Ca dispersed in the network, since free oxygen weakens the bridging oxygen bonds in the network. This is also consistent with the concept of Ca atoms as network modifiers in glass science [33]. The typical microstructures of the two mineral phases are shown in Figure 6. As the number of calcium atoms in the system increases, the Al-O bond in the melt is easily broken, making the probability of forming an [AlO4] structure decrease and the probability of calcium atoms appearing around the Ti-O bond increase.
To characterize the degree of polymerization and complexity in the system, Q m n was employed, where Q denotes the tetrahedral structural unit, n signifies the number of bridging oxygens in the tetrahedral structure, and m refers to the atomic species connected to the tetrahedral structure. The distribution of oxygen species in the red mud slag system is shown in Figure 7. As CaO/Al2O3 increased, the number of Si surrounding [SiO4]4− in the system did not vary significantly (Figure 7a), while the number of Al surrounding [SiO4]4−, the number of Si surrounding [AlO4]5−, and the number of Al surrounding [AlO4]5− all varied (Figure 7b,c). This could be attributed to the bridging oxygen Si–O–Si bonds in [SiO4]4− or [AlO4]5−, which were more stable than the Si–O–Al bonds and less likely to be damaged. Notably, as CaO/Al2O3 increased, the free oxygen content gradually increased, leading to a reduction in bridging oxygen bonds and causing S i A l 0 , A l S i 0 , and A l A l 0 to become the main oxygen species. This signals that the structural framework of the melt is becoming less stable.

4. Conclusions

In this study, thermodynamic calculations and molecular dynamics simulations were conducted on a red mud slag system. The liquidus temperature and primary crystal phase during the cooling process were calculated using FactSage 8.1 software, and the phase diagram and primary crystal phase structure evolution (e.g., radial distribution function and oxygen species analysis) corresponding to microstructure changes were analyzed based on MS molecular dynamics simulations.
(1)
Overall, the melting point of red mud shows a significant increase firstly and then a slow decrease with the increase in CaO/Al2O3 when the CaO/Al2O3 is in the range of 0.3 to 3.9. When CaO/Al2O3 in red mud increases to 0.9, the initial crystalline phase changes from MgAl2O4 to CaTiO3 during melt cooling and a significant increase in melting point temperature occurs.
(2)
The increase in CaO/Al2O3 in red mud mainly affects the bonding of aluminum atoms with oxygen atoms, and higher CaO/Al2O3 leads to the change in bridging oxygen bonds (e.g., Si-O-Al or Al-O-Al) to non-bridging oxygen bonds (e.g., Si-O-Ca or Al-O-Ca), while resulting in a decrease in the degree of polymerization of the red mud melt system.
(3)
In summary, when the amount of bridging oxygen in the red mud melt is lower than 50 percent, the melt is prone to preferentially generate high-melting-point substances for precipitation during cooling, which will not be conducive to the preparation of inorganic fibers from the red mud melt. In order to keep the melting point of red mud low during the preparation of fibers, CaO/Al2O3 should be controlled in the range of 0.3 to 0.9.

Author Contributions

Conceptualization, L.X.; methodology, P.-P.D.; software, L.X.; validation, P.-P.D. and Z.-H.L.; formal analysis, P.-P.D. and L.X.; investigation, Z.-H.L.; resources, Y.L.; data curation, P.-P.D.; writing—original draft preparation, L.X. and P.-P.D.; writing—review and editing, Z.-H.L. and Y.L.; visualization, L.X.; supervision, Z.-H.L. and Y.L.; project administration, Z.-H.L. and Y.L.; funding acquisition, Y.L. All authors have read and agreed to the published version of the manuscript.

Funding

This research was funded by the National Science Foundation of China, grant number U20A20271, 51874138.

Data Availability Statement

The data presented in this study are available on request from the corresponding author due to privacy.

Acknowledgments

Thanks to all authors for their contributions to this study.

Conflicts of Interest

The authors declare no conflicts of interest.

References

  1. Liu, R.X.; Poon, C.S. Utilization of red mud derived from bauxite in self-compacting concrete. J. Clean. Prod. 2016, 112, 384–391. [Google Scholar] [CrossRef]
  2. Li, Y.C.; Min, X.B.; Ke, Y.; Liu, D.G.; Tang, C.J. Preparation of red mud-based geopolymer materials from MSWI fly ash and red mud by mechanical activation. Waste Manag. 2019, 83, 202–208. [Google Scholar] [CrossRef] [PubMed]
  3. Gräfe, M.; Power, G.; Klauber, C. Bauxite residue issues: III. Alkalinity and associated chemistry. Hydrometallurgy 2011, 108, 60–79. [Google Scholar] [CrossRef]
  4. Li, Y.C.; Min, X.B.; Ke, Y.; Chai, L.Y.; Shi, M.Q.; Tang, C.J.; Wang, Q.W.; Liang, Y.J.; Lei, J.; Liu, D.G. Utilization of red mud and Pb/Zn smelter waste for the synthesis of a red mud-based cementitious material. J. Hazard. Mater. 2018, 344, 343–349. [Google Scholar] [CrossRef]
  5. Wang, P.; Liu, D.Y. Physical and Chemical Properties of Sintering Red Mud and Bayer Red Mud and the Implications for Beneficial Utilization. Materials 2012, 5, 1800–1810. [Google Scholar] [CrossRef]
  6. Xie, L.Q.; Zhang, T.A.; Lv, G.Z.; Zhu, X.F. Direct calcification-carbonation method for processing of bayer process red mud. Russ. J. Non-Ferr. Met. 2018, 59, 142–147. [Google Scholar] [CrossRef]
  7. Liu, S.H.; Guan, X.M.; Zhang, S.S.; Dou, Z.Z.; Feng, C.H.; Zhang, H.B.; Luo, S.Q. Sintered bayer red mud based ceramic bricks: Microstructure evolution and alkalis immobilization mechanism. Ceram. Int. 2017, 43, 13004–13008. [Google Scholar] [CrossRef]
  8. Ning, G.S.; Zhang, B.; Liu, C.J.; Li, S.; Ye, Y.; Jiang, M.F. Large-Scale consumption and zero-waste recycling method of red mud in steel making process. Minerals 2018, 8, 102. [Google Scholar] [CrossRef]
  9. Hu, W.; Nie, Q.K.; Huang, B.S.; Shu, X.; He, Q. Mechanical and microstructural characterization of geopolymers derived from red mud and fly ashes. J. Clean. Prod. 2018, 186, 799–806. [Google Scholar] [CrossRef]
  10. He, W.C.; Luo, M.S.; Deng, Y.; Qin, Y.L.; Zhang, S.; Lv, X.W.; Zhao, Y.; Jiang, C.Z.; Pang, Z.D. Preparation of high acidity coefficient slag wool fiber with blast furnace slag and modifying agents. J. Iron Steel Res. Int. 2023, 30, 1440–1450. [Google Scholar] [CrossRef]
  11. Gao, H.T.; Liu, X.H.; Chen, J.Q.; Qi, J.L.; Wang, Y.B.; Ai, Z.R. Preparation of glass-ceramics with low density and high strength using blast furnace slag, glass fiber and water glass. Ceram. Int. 2018, 44, 6044–6053. [Google Scholar] [CrossRef]
  12. Yliniemi, J.; Ramaswamy, R.; Luukkonen, T.; Laitinen, O.; De Sousa, A.N.; Huuhtanen, M.; Illikainen, M. Characterization of mineral wool waste chemical composition, organic resin content and fiber dimensions: Aspects for valorization. Waste Manag. 2021, 131, 323–330. [Google Scholar] [CrossRef] [PubMed]
  13. Ren, Q.Q.; Zhang, Y.Z.; Long, Y.; Zou, Z.S.; Pei, J.J. Crystallisation behaviour of blast furnace slag modified by adding fly ash. Ceram. Int. 2018, 44, 11628–11634. [Google Scholar] [CrossRef]
  14. Cai, S.; Tian, T.L.; Guo, Z.H.; Zhang, Y.Z. Effect of acidity coefficient on crystallization behaviour of modified blast furnace slag. Ironmak. Steelmak. 2022, 49, 555–561. [Google Scholar] [CrossRef]
  15. Gan, L.; Zhang, C.X.; Zhou, J.C.; Shangguan, F.Q. Continuous cooling crystallization kinetics of a molten blast furnace slag. J. Non-Cryst. Solids 2012, 358, 20–24. [Google Scholar] [CrossRef]
  16. Li, M.; Xu, J.L.; Xiao, H.X.; Liu, X.; Yu, G.S.; Chen, X.L. Exploring influence of MgO/CaO on crystallization characteristics to understand fluidity of synthetic coal slags. Chin. J. Chem. Eng. 2023, 53, 1–13. [Google Scholar] [CrossRef]
  17. Li, Z.H.; Zhang, Y.J.; Zhang, Y.Z.; Du, P.P.; Ren, Q.Q. Effect of content of Al2O3 and MgO on crystallization of blast furnace slag during fiber formation. J. Cent. South. Univ. 2018, 25, 2373–2379. [Google Scholar] [CrossRef]
  18. Kang, Y.; Liu, C.; Zhang, Y.Z.; Xing, H.W. Influence of crystallization behavior of gas quenching blast furnace slag on the preparation of amorphous slag beads. Crystals 2020, 10, 30. [Google Scholar] [CrossRef]
  19. Song, L.; Liu, W.H.; Xin, F.H.; Li, Y.M. “Materials Studio” Simulation Study of the Adsorption and Polymerization Mechanism of Sodium Silicate on Active Silica Surface at Different Temperatures. Int. J. Met. 2021, 15, 1091–1098. [Google Scholar] [CrossRef]
  20. Liu, H.L.; Song, L. Materials Studio simulation for the adsorption properties of CO2 molecules at the surface of sodium silicate and potassium silicate solution under different pressure conditions. Int. J. Met. 2022, 16, 242–251. [Google Scholar] [CrossRef]
  21. Bi, Z.S.; Li, K.J.; Jiang, C.H.; Zhang, J.L.; Ma, S.F. Effects of amphoteric oxide (Al2O3 and B2O3) on the structure and properties of SiO2-CaO melts by molecular dynamics simulation. J. Non-Cryst. Solids 2021, 559, 120687. [Google Scholar] [CrossRef]
  22. Wang, Y.L.; Wang, Q.D.; Liu, N.; Chen, J.Y.; Wang, Z.H.; Tan, C.L.; Sheng, Z.Y. Crystallization kinetics of Ni-Mn alloy thin film using molecular dynamics simulation. Ferroelectrics 2019, 549, 234–240. [Google Scholar] [CrossRef]
  23. Wang, C.; Lin, P.P.; Liu, X.; Li, G.; Lin, T.S.; He, P.; Long, W.M.; Liu, H.Z. Microstructure evolution and cooperative reinforcement mechanisms of Al2O3/Al2O3 joints brazed by low-melting borosilicate glass. Ceram. Int. 2020, 46, 186–195. [Google Scholar] [CrossRef]
  24. Pan, X.Y.; Shen, F.M.; Gao, Q.J.; Jiang, X.; Zheng, H.Y. Effect of erosion behavior of FeO-CaO-SiO2-MgO-Al2O3 blast furnace primary slag on Al2O3 substrate. Crystals 2021, 11, 957. [Google Scholar] [CrossRef]
  25. Shi, G.Y.; Zhang, T.A.; Dou, Z.H.; Niu, L.P. Dissolution behavior of Al2O3 inclusions in CaO-Al2O3 based slag representing aluminothermic reduction slag. Crystals 2020, 10, 1061. [Google Scholar] [CrossRef]
  26. Xu, B.; Cao, Y.R.; Wang, Z.Z.; Du, P.P.; Long, Y. Molecular Dynamics Study on the Effect of SiO2/Al2O3 Mass Ratio on the Structural Properties and Viscosity of Molten Fused Red Mud. Minerals 2022, 12, 925. [Google Scholar] [CrossRef]
  27. Chen, G.; Xian, W.K.; Wang, Q.M.; Li, Y. Molecular simulation-guided and physics-informed mechanistic modeling of multifunctional polymers. Acta. Mech. Sin. 2021, 37, 725–745. [Google Scholar] [CrossRef]
  28. Sun, W.; Du, J.C. Local ordering and interfacial structure between spinel crystal and aluminosilicate glasses from molecular dynamics simulations. Int. J. Appl. Glass Sci. 2019, 10, 41–56. [Google Scholar] [CrossRef]
  29. Souza, J.A.; Rino, J.P. A molecular dynamics study of structural and dynamical correlations of CaTiO3. Acta. Mater. 2011, 59, 1409–1423. [Google Scholar] [CrossRef]
  30. Bi, Z.S.; Li, K.J.; Jiang, C.H.; Zhang, J.L.; Ma, S.F.; Sun, M.M.; Wang, Z.M.; Li, H.T. Performance and transition mechanism from acidity to basicity of amphoteric oxides (Al2O3 and B2O3) in SiO2-CaO-Al2O3-B2O3 system: A molecular dynamics study. Ceram. Int. 2021, 47, 12252–12260. [Google Scholar] [CrossRef]
  31. Ross, S.; Welsch, A.M.; Behrens, H. Lithium conductivity in glasses of the Li2O-Al2O3-SiO2 system. Phys. Chem. Chem. Phys. 2015, 17, 465–474. [Google Scholar] [CrossRef] [PubMed]
  32. Dai, X.; Bai, J.; Huang, Q.; Liu, Z.; Bai, X.J.; Lin, C.T.; Li, W.; Guo, W.P.; Wen, X.D.; Du, S.Y. Coal ash fusion properties from molecular dynamics simulation: The role of calcium oxide. Fuel 2018, 216, 760–767. [Google Scholar] [CrossRef]
  33. Möncke, D.; Tricot, G.; Winterstein-Beckmann, A.; Wondraczek, L.; Kamitsos, E.I. On the connectivity of borate tetrahedra in borate and borosilicate glasses. Phys. Chem. Glas.-B 2015, 56, 203–211. [Google Scholar]
Figure 1. The simulation cooling process stages.
Crystals 14 00526 g001
Figure 2. Variation of red mud melting point with CaO/Al2O3.
Crystals 14 00526 g002
Figure 3. The relationship between the red mud system temperature and mineral precipitates: (a) crystal precipitates during the cooling process when the CaO/Al2O3 ratio was 0.3; (b) crystal precipitates during the cooling process when CaO/Al2O3 was 0.9; (c) crystal precipitates during the cooling process when CaO/Al2O3 was between 1.5 and 3.9.
Crystals 14 00526 g003
Figure 4. The RDFs of the red mud systems with different CaO/Al2O3 ratios, with the first peak region zoomed out: (a) RDF of the Si-O bond in the system, (b) RDF of the Al-O bond in the system, (c) RDF of the Ca-O bond in the system, (d) RDF of the Mg-O bond in the system, (e) RDF of the Ti-O bond in the system, (f) RDF of the O-O bond in the system, (g) RDF of the Fe-O bond in the system, (h) RDF of the Na-O bond in the system, (i) RDF of the Mg-Al bond in the system, and (j) RDF of the Ca-Al bond in the system.
Crystals 14 00526 g004aCrystals 14 00526 g004bCrystals 14 00526 g004c
Figure 5. Changes in the bridging and non-bridging oxygen in the red mud melt system.
Crystals 14 00526 g005
Figure 6. Microstructures of MgAl2O4 and CaTiO3.
Crystals 14 00526 g006
Figure 7. The oxygen distribution in the red mud melt slag system: (a) the number of Si surrounding the [SiO4]4− tetrahedral; (b) the number of Al surrounding the [SiO4]4− tetrahedral; (c) the number of Si surrounding the [AlO4]5− tetrahedral; (d) the number of Al surrounding the [AlO4]5− tetrahedral.
Crystals 14 00526 g007
Table 1. Chemical composition of red mud (mass percentage, %).
Red Mud CompositionSiO2CaOAl2O3MgONa2OFe2O3TiO2K2OMnOOther
Mass/%27.2610.6232.312.1411.167.567.230.300.131.29
Table 2. Red mud slag system simulation schemes under different CaO/Al2O3 ratios (mass percentage, %).
SchemeCaO/Al2O3Red Mud Composition/Mass Percentage, %
CaOAl2O3SiO2Na2OFe2O3TiO2MgOTotal
A10.310.8032.8927.7511.367.697.362.17100
A20.920.7022.9927.7511.367.697.362.17100
A31.526.2017.4927.7511.367.697.362.17100
A42.129.614.0927.7511.367.697.362.17100
A52.731.911.7927.7511.367.697.362.17100
A63.333.510.1927.7511.367.697.362.17100
A73.934.88.8927.7511.367.697.362.17100
Table 3. The BMH potential constant of the electron pairs in the red mud slag system.
ijAij/eVBij/(Å−1)Cij/(eV·Å6)
OO1.18 × 1057.310
OSi1.98 × 1055.770
OCa1.52 × 1054.930
OFe2.74 × 1056.080
OMg1.06 × 1054.950
AlO1.95 × 1033.550
TiO2.40 × 1056.060
NaO1.99 × 1036.250
CaAl3.68 × 1046.250
AlMg1.72 × 1026.250
Table 4. The density of the red mud slag system and the number of atoms.
SampleDensityNumber of Atoms
CaSiAlTiMgFeNaOTotal
A13.319623132246274818413242278
A23.2618523122646274818412692216
A33.2323423117246274818412372179
A43.2126423113846274818412162154
A53.1928423111646274818412032139
A63.1829923110046274818411942129
A73.173102318846274818411872121
Table 5. The mean position (r1) of the first peak in different samples.
Si–OAl–OCa–OMg–OTi–OO–OFe–ONa–OMg–AlCa–Al
r1 (Å)
A11.591.772.292.372.452.632.592.353.253.55
A21.591.772.312.372.492.652.612.313.173.51
A31.591.772.352.312.492.632.692.332.913.61
A41.591.792.332.352.492.612.552.312.953.55
A51.591.772.312.332.472.612.692.312.973.63
A61.591.752.312.352.492.612.632.332.793.61
A71.591.752.312.352.492.612.632.292.993.61
Disclaimer/Publisher’s Note: The statements, opinions and data contained in all publications are solely those of the individual author(s) and contributor(s) and not of MDPI and/or the editor(s). MDPI and/or the editor(s) disclaim responsibility for any injury to people or property resulting from any ideas, methods, instructions or products referred to in the content.

