Abstract
Additive friction stir deposition (AFSD), in which molten metal materials are formed into free-form stacked structural parts according to the path design, may have a wide range of applications in high-efficiency mass production. In this study, experiments were conducted for the rotational speed in the AFSD parameters of 6061 aluminium alloy bars to investigate the effects of different rotational shear conditions and heat inputs on the properties of the deposited layer for diameter bars based on the analysis of the micro-morphology, micro-tissue composition, and mechanical properties. The width and thickness of each layer were constant, approximately 40 mm wide and 2.5 mm thick. The particle undulations on the surface of the deposited layer were positively correlated with the AFSD rotational speed. Continuous dynamic recrystallisation in the AFSD process can achieve more than 90% grain refinement. When the rotational speed increases, it causes localised significant orientation and secondary deformation within the recrystallised grains. The ultimate tensile strength of the deposited layer was positively correlated with the rotational speed, reaching a maximum of 211 MPa, and the elongation was negatively correlated with the rotational speed, with a maximum material elongation of 37%. The cross-section hardness of the deposited layer was negatively correlated with the number of thermal cycles, with the lowest hardness being about 45% of the base material and the highest hardness being about 80% of the base material.
1. Introduction
Additive manufacturing (AM) technology is one of the key technologies in intelligent manufacturing technology. Contrary to subtractive manufacturing, AM is the process of manufacturing objects using computer-aided design and stacking materials layer by layer based on a three-dimensional model [1,2]. In addition, it has been found that machining parts with AM technology can produce parts with good material and mechanical properties [3,4]. As a result, AM technology is receiving more and more attention.
The leading metal AM technology currently uses the fusion cladding method and solid-phase additive manufacturing technology [5]. The fusion additive methods include selective laser melting (SLM) [6,7,8], direct metal laser sintering (DMLS) [9,10], and electron beam selective zone melting (SEBM) [11,12]. The basic working principle of these AM methods is to melt solid powder materials through a computer-controlled laser heat source, stack the melted materials layer by layer and cover the previous additive layer, finally completing the AM of the structural parts. The laser cladding method has the characteristics of a high accuracy of moulding, saving material, and being environmentally friendly [13]. However, the additive technology of fusion cladding has been developed for a long time. There are still a lot of unresolved problems, mainly including cladding using a high-energy laser to make the material in a short period. There is a phenomenon of overheating, melting, and overcooling solidification; an excellent temperature gradient leading to the material inside the holes, cracks, and local residual stress; the microstructure of the columnar crystals having inferior mechanical properties; the need for a long time taken for the laser melting of the metal, resulting in excessive energy consumption; and the problem of connecting between the workpiece, leading to the cladding technology in the manufacture of large-scale workpieces being more complex [14,15]. Therefore, it is difficult for cladding-based additive technologies to meet the demand for high-efficiency, low-residual-stress additive materials.
Additive friction stir deposition (AFSD) technology is a metal solid-phase additive technology based on the plastic deformation of materials, which has a wide range of applications in the aerospace and transport sectors [16,17]. AFSD technology is a new type of solid phase AM based on friction stir welding (FSW) technology, combining metallurgy principles and solid-state joining [18,19,20]. This technology is applied by rotational friction and axial pressure on metal raw materials such as powders, wires, and bars [21,22,23]. The raw metal material is plasticised on the working plane under intense friction, shear, friction-generated heat, and axial pressure. The shoulder of the tool head mixes the raw material and the substrate with the softened part of the material, a metallurgical reaction occurs, the gap between the shoulder and the substrate is filled, and finally, a deposition layer is formed [24]. The deposition of the structural part is completed after layer-by-layer stacking. The metal bar moves laterally during the additive process, and the plasticised material is not constrained in the radial and axial directions, creating redundant curls around the material as it builds up [25,26,27]. The AFSD study of aluminium alloys is divided into different grades, including 7XXX [28,29], 6XXX [30], 5XXX [31,32,33], and 2XXX [34,35]. Previous studies have analysed the AFSD process parameters for different metals and the mechanical properties and microstructure evolution of the deposited layers by the process parameters. Sameehan et al. [36] examined the AFSD of AZ31B magnesium alloy with the dimensions 9.5 mm × 9.5 mm at a 400 rpm rotation speed and 4.2 mm/s–6.3 mm/s velocity and found microscopic grain refinement of the deposited layer with a higher grain size and higher hardness than the initial material. Mason et al. [37] investigated the effect of the microstructural evolution and mechanical response of AA7050 aluminium alloy of the size 9.5 mm × 9.5 mm, precipitating phases containing elements such as Mg and Cu under a cyclic heat input. Griffiths et al. [38] investigated the formation of extensive substructure grains by recrystallising Al-Mg-Si produced under AFSD thermo-mechanical behaviour. Agrawal et al. [39] investigated the thermal cycling process of SS316 material under different process parameters of AFSD to produce recrystallisation and yield work hardening and, finally, the formation of multilevel twins and the martensitic phase. Alzahrani et al. [40] investigated the precipitated phases. The mechanical properties of deposited layers produced by the stirred friction deposition annealing treatment of die-cast A356 alloy with a diameter of 22 mm at different velocities indicated that there is a positive effect of AFSD on the eutectic Si of the deposited layer and that the degree of grain refinement of the deposited layer can reach above 92%. Tang et al. [24] investigated the multilayer bonding mechanism and mechanical properties of 6061 aluminium alloy friction extrusion additive manufacturing (FEAM) at different rotational speeds. They found that the material flowed strongly at 400 rpm, the grain refinement was evident, and the average grain size reached 6.0 ± 3.3 μm. Chen et al. [41] investigated the effect of the rotational speed and traverse velocity in the AFSD of 6061 aluminium alloy bars with a diameter of 10 mm. They found that the grain size positively correlates with the feed rate and rotational speed. The increase in the traverse velocity and speed increases the grain size and decreases the degree of recrystallisation. Chen et al. [42] investigated the microstructure evolution and mechanical properties of a 6061 aluminium alloy bar in an AFSD multilayer state with a size of 9.5 mm × 9.5 mm and found many massive and rod-like AlFeSi phases. The multilayer AFSD interlayer dislocation density decreases due to repetitive thermal input. Babaniaris et al. [43] investigated the hardness and precipitated Mg and Si phases in the build direction of 6063 aluminium alloy AFSD after tempering treatment. They found that non-hardenable phases formed at the deposited layer’s bottom.
In the above article, it was found that AFSD heat production is positively correlated with the bar diameter and rotational speed and that the AFSD process parameters are more sensitive to the properties of the material of the bar as well as the size of the bar. Based on the experiments, it was found that the existing process parameters explored for the AFSD of small-diameter metal bars are difficult to apply to large-diameter bars. When AFSD is put into practical application, it mainly produces large structural parts. Small-diameter AFSD in the production of large structural parts will lead to a low processing efficiency and an increase in the number of post-processing processing, the time costs, and other unfavourable factors, so the study of large-diameter bar AFSD is needed. Domestic and foreign research on large-diameter bar AFSD is scant when applying large-diameter AFSD process parameters and needs corresponding theoretical support. Therefore, there is a requirement to explore the process parameter relationship between AFSD and rotational speed for large-diameter bars. Larger-diameter bars generate a more significant heat input during the AFSD process and form more extensive deposition layers with a greater risk of defects in the interlayer bonding. Therefore, there is a need to investigate the surface properties and mechanical properties related to the interlayer bonding of large-bar AFSDs and to analyse the internal material composition and microstructure evolution. This paper explores the effect of the rotational speed on the surface morphology, microstructure, and related mechanical properties of 6061 aluminium alloy AFSD. AFSD was first carried out on 6061 aluminium alloys using different rotational speeds for single and multilayer deposition to analyse the associated macro-morphology. Roughness experiments were performed on the surface of single-layer additive materials, and the interlayer morphology of multilayer additive materials was observed. The microstructure of the deposited layers was analysed using Electron Backscatter Diffraction (EBSD), and the micro-composition was analysed using X-ray diffraction (XRD) and an EDS energy spectrometer. A universal testing machine and Vickers hardness tester were used to test the mechanical properties of the parts, with temperature detection for different process parameters using an infrared thermographic camera. This study will guide the expansion of theoretical research and engineering applications of AFSD.
2. Materials and Methods
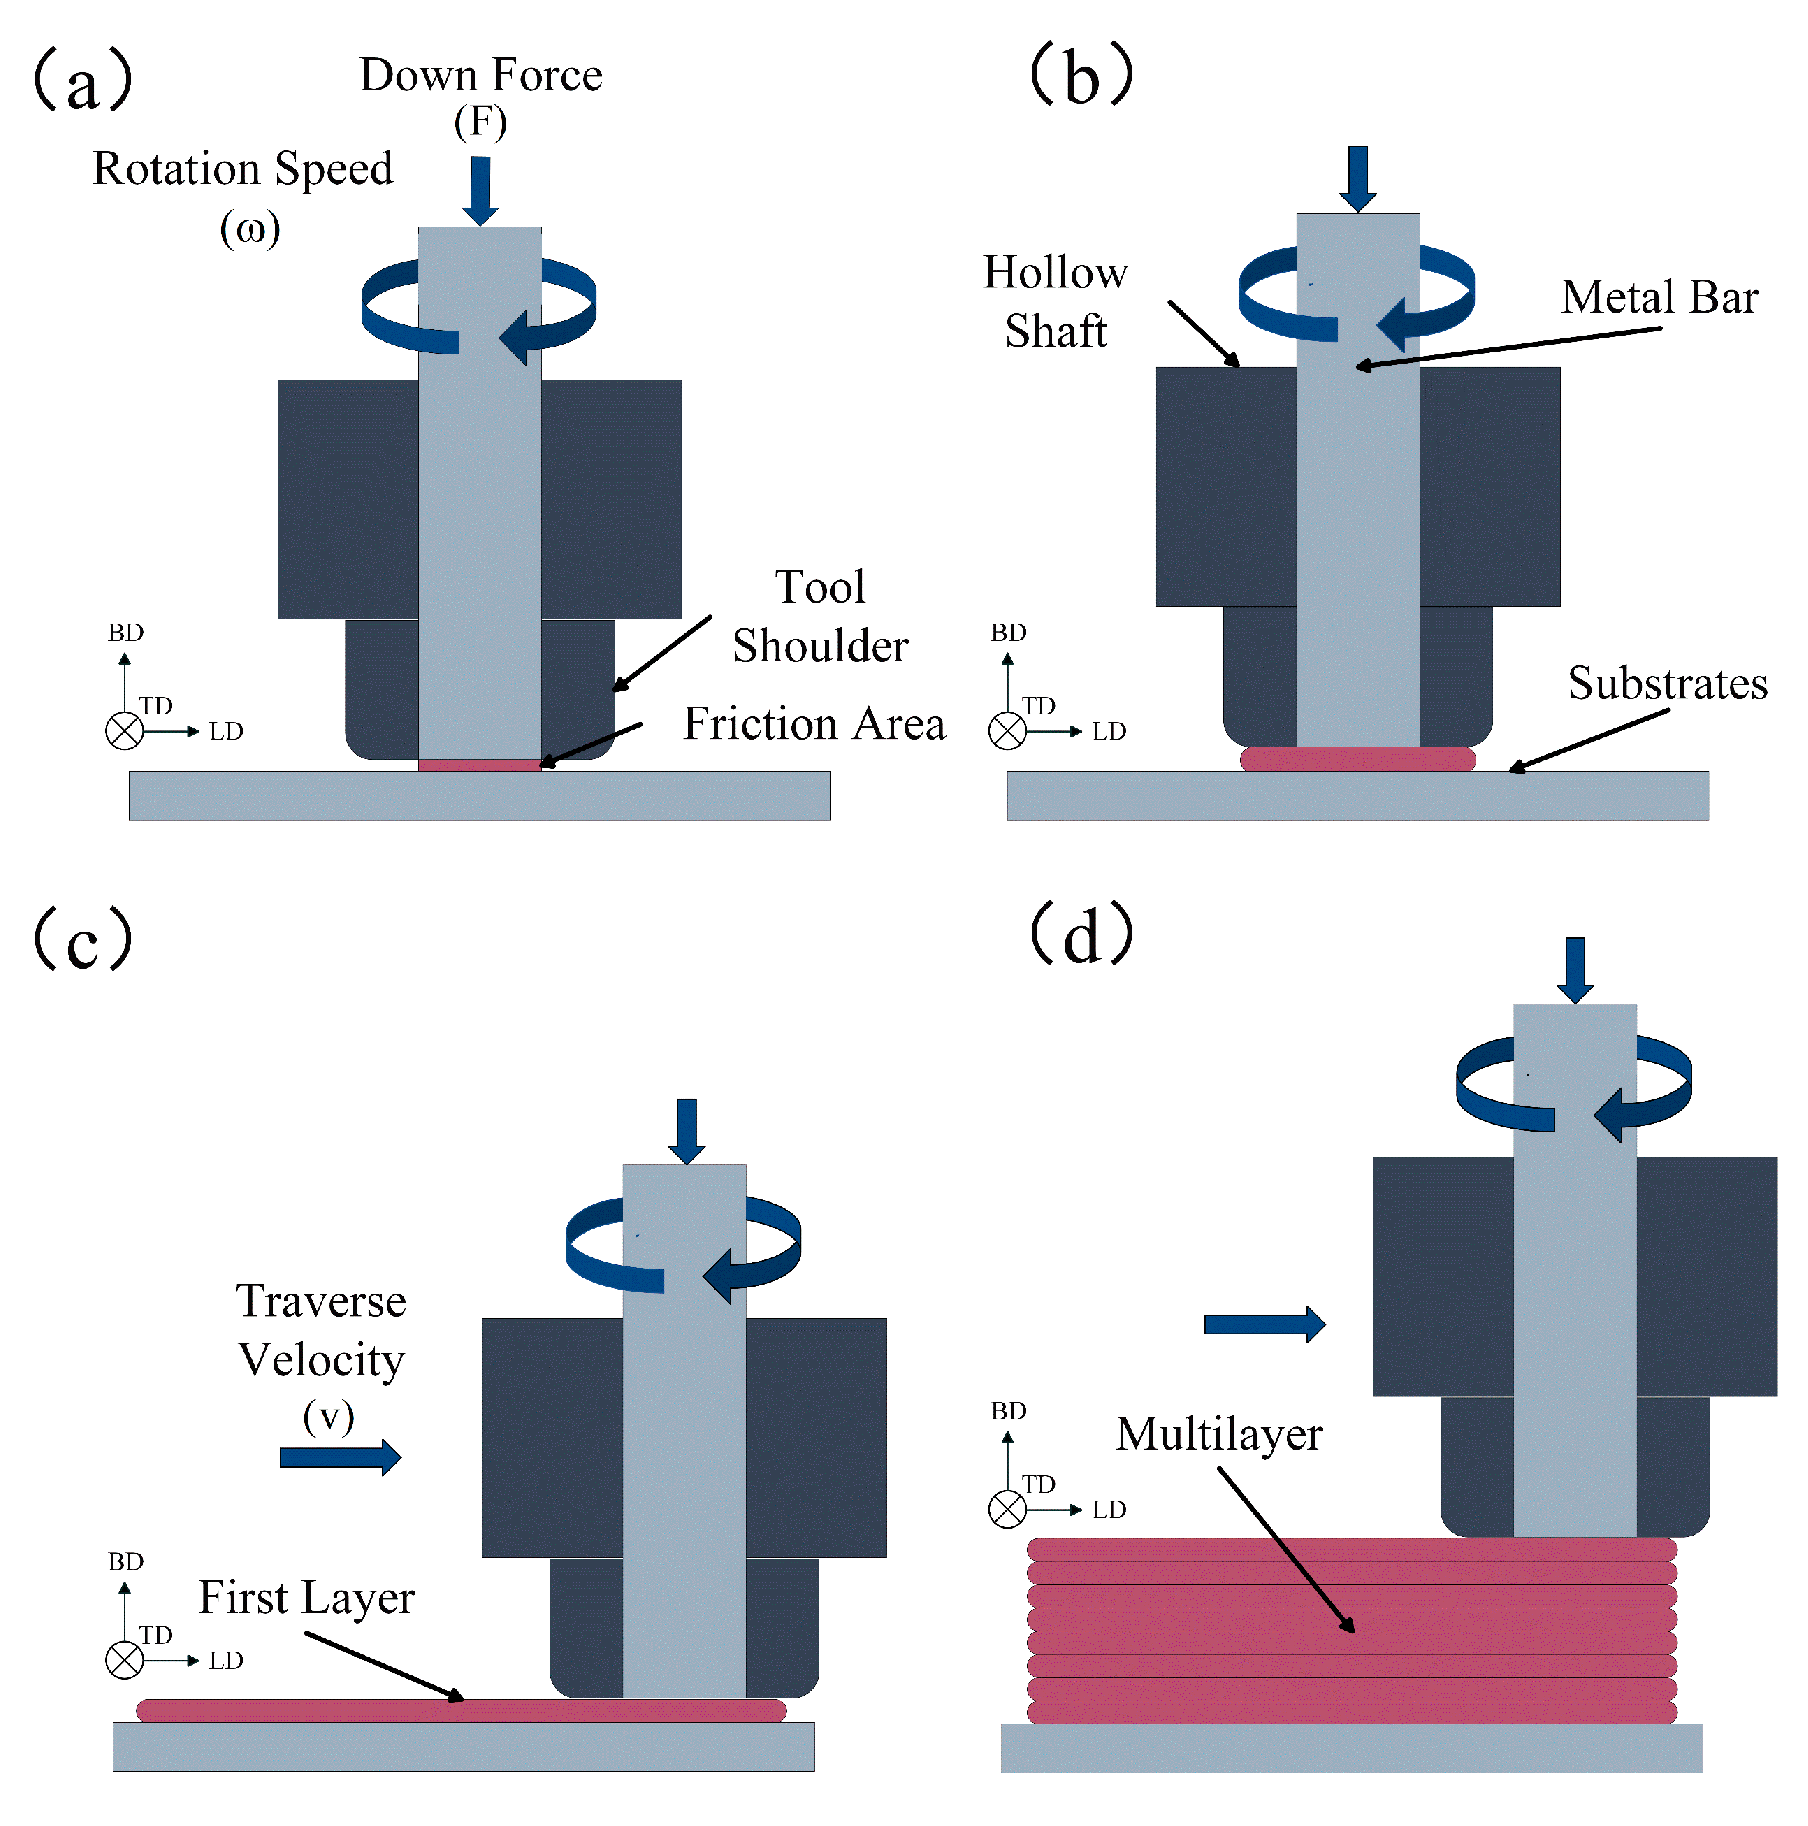
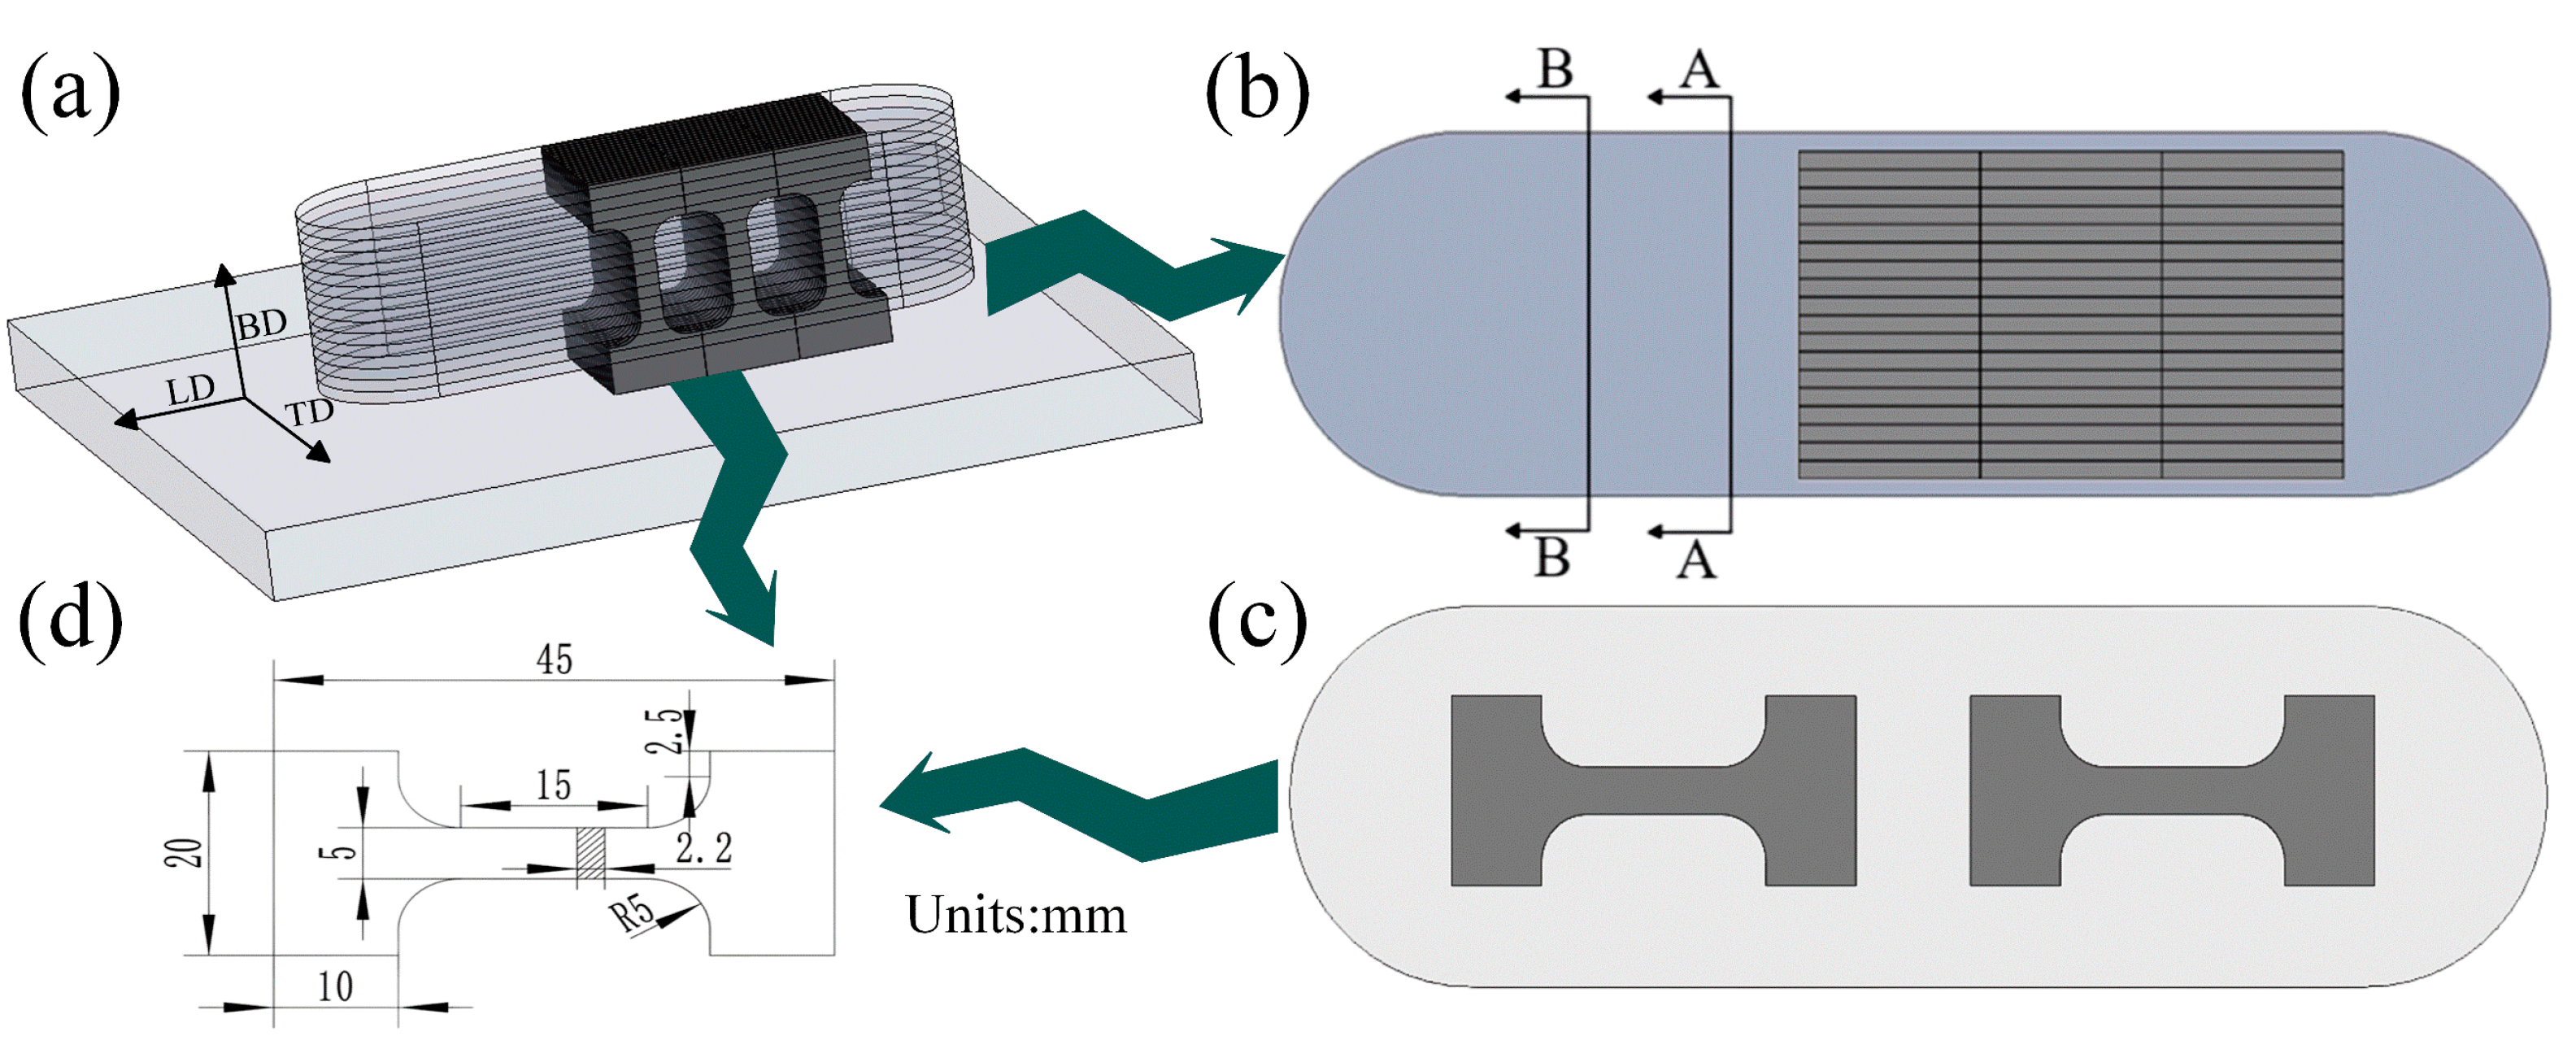
The process of AFSD moulding structural parts can be divided into four stages: (1) Rotating the tool head close to the substrate, reserving the position according to the height of the single additive layer, and starting the downward pressure and rotation, as shown in Figure 1a; (2) The bar material undergoes softening and plasticising after a period of downward pressure and rotation, filling the gap between the shoulder and substrate, as shown in Figure 1b; (3) The tool head is moved in the longitudinal direction (LD) to form the first s layer, as shown in Figure 1c; (4) The tool head is returned to the top of the starting position and the above steps are repeated to complete the multilayer deposition in the build (BD) direction, as shown in Figure 1d.
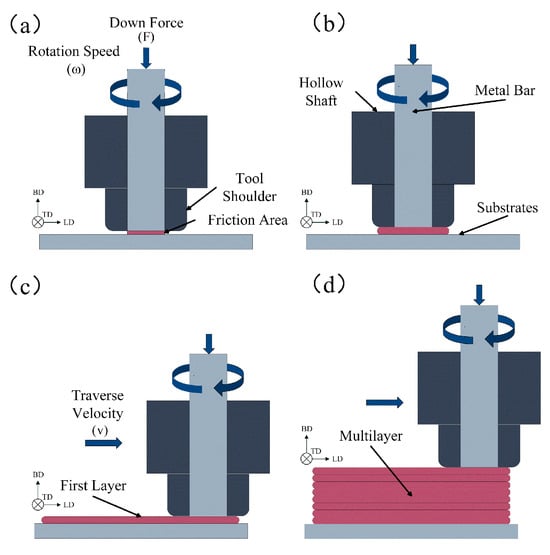
Figure 1.
Schematic diagram of the AFSD process: (a) working position of the tool head, (b) stirring and friction softening material to fill the gap between the tool head and the substrate, (c) deposition of the first layer by the tool head moving in the LD direction, (d) multilayer deposition by the tool map in the LD direction.
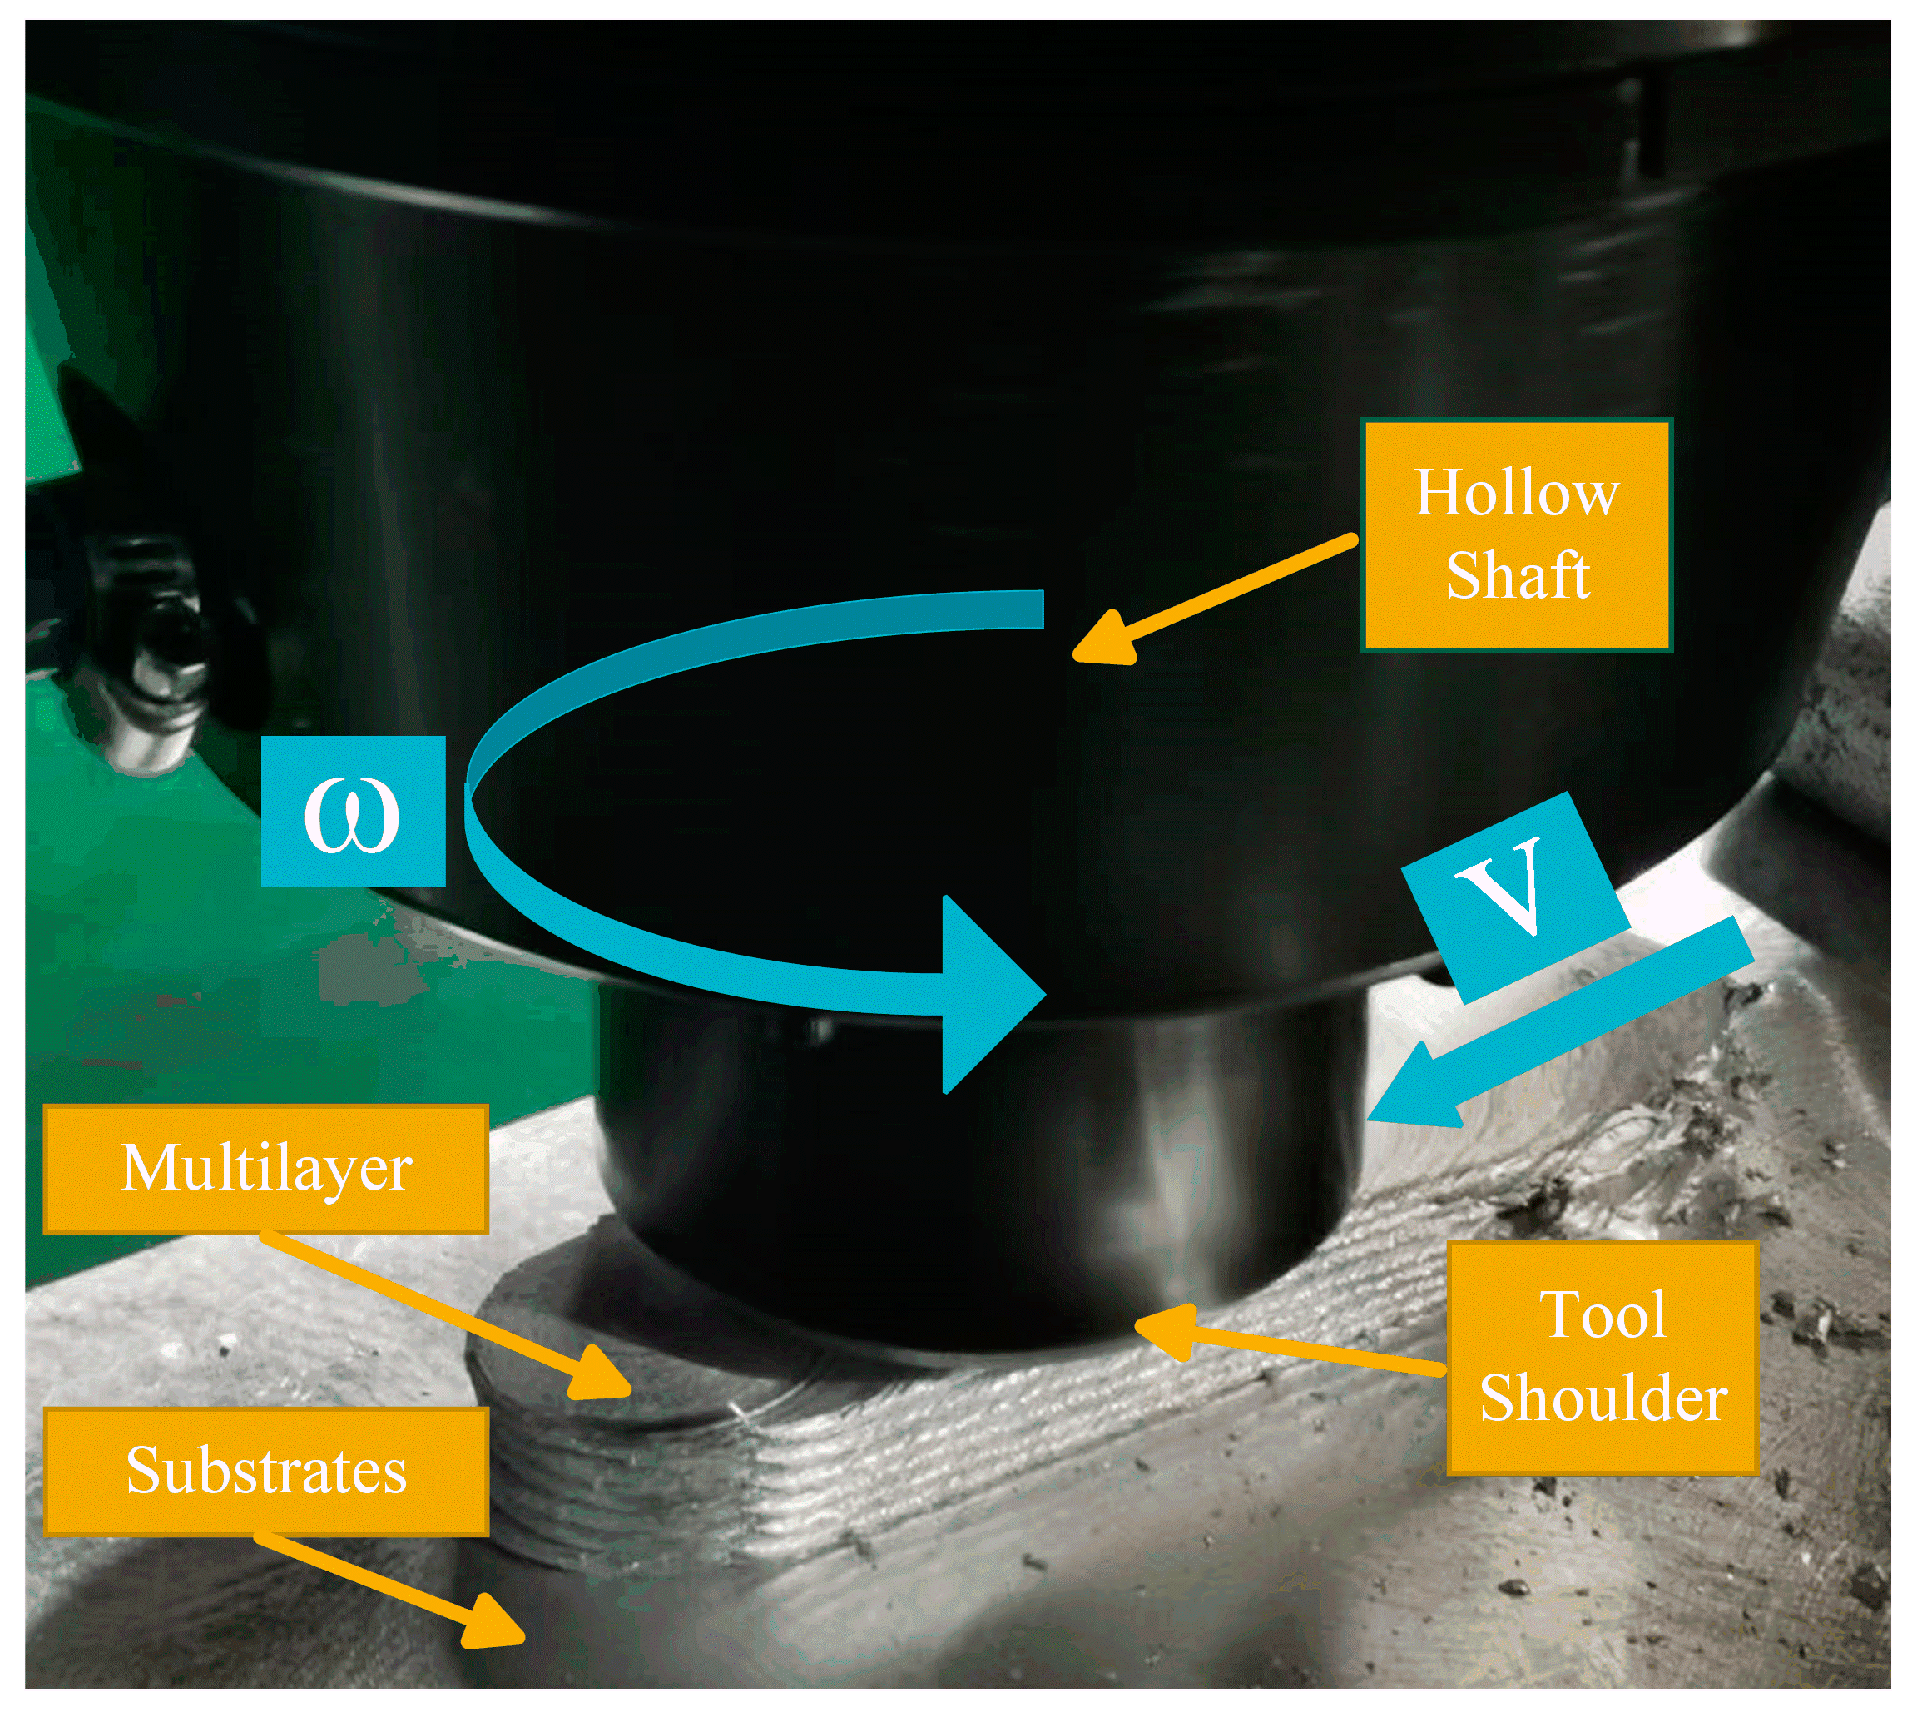
In this experiment, a self-developed AFSD machine (Harbin Institute of Technology Weihai FSD001) was used for AFSD, as shown in Figure 2. The width of the shoulder of the tool head is 58 mm and the material of the tool head is 40 Cr. The bar size is 28 mm × 28 mm × 400 mm; the material is 6061-T6 aluminium alloy. The main components of the bars and substrates are described in Table 1.
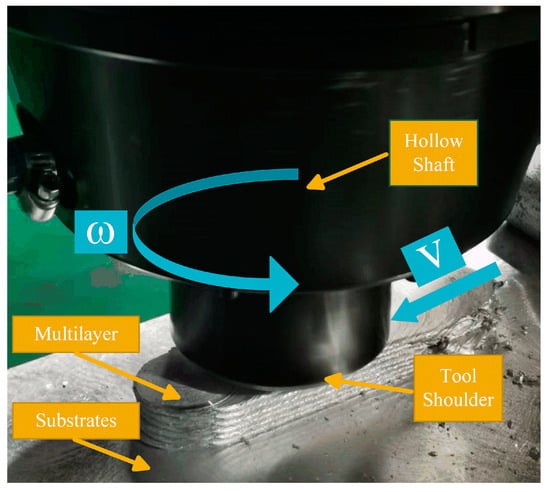
Figure 2.
Working diagram of AFSD equipment (FSD001).

Table 1.
Chemical composition of 6061 aluminium alloy bar and substrate (wt%).
In previous experiments, it was found that the rotational speed of the tool head affects the heat input during material additions and that the heat input increases when the rotational speed is higher. We found that when the rotational speed was lower than 600 rpm, the thermal input of the material was insufficient, and the plasticising ability was low enough to form a dense additive deposition layer. When the rotational speed is higher than 1000 rpm, the heat input of the material is too high, the material will form bonding and expansion due to overheating, and the metal bar and the tool head will generate enormous friction, resulting in the non-uniform plasticisation of the material, which will affect the material properties. The main parameters of the AFSD include the rotational speed of the tool head ω, traverse velocity ν, and downforce F. We investigated the effect of the rotational speed on AFSD based on previous experiments, and the parameters were set as follows: the feed rate of the tool head was 90 mm/min, the down pressure was 10 kN, and the thickness of the single-layer additive deposition layer was 2.5 mm. The single and multilayer (15-layer) deposition was carried out at different rotational speeds, and the experimental parameters are shown in Table 2 below.
Table 2.
Details of the AFSD parameters used or recorded in this study.
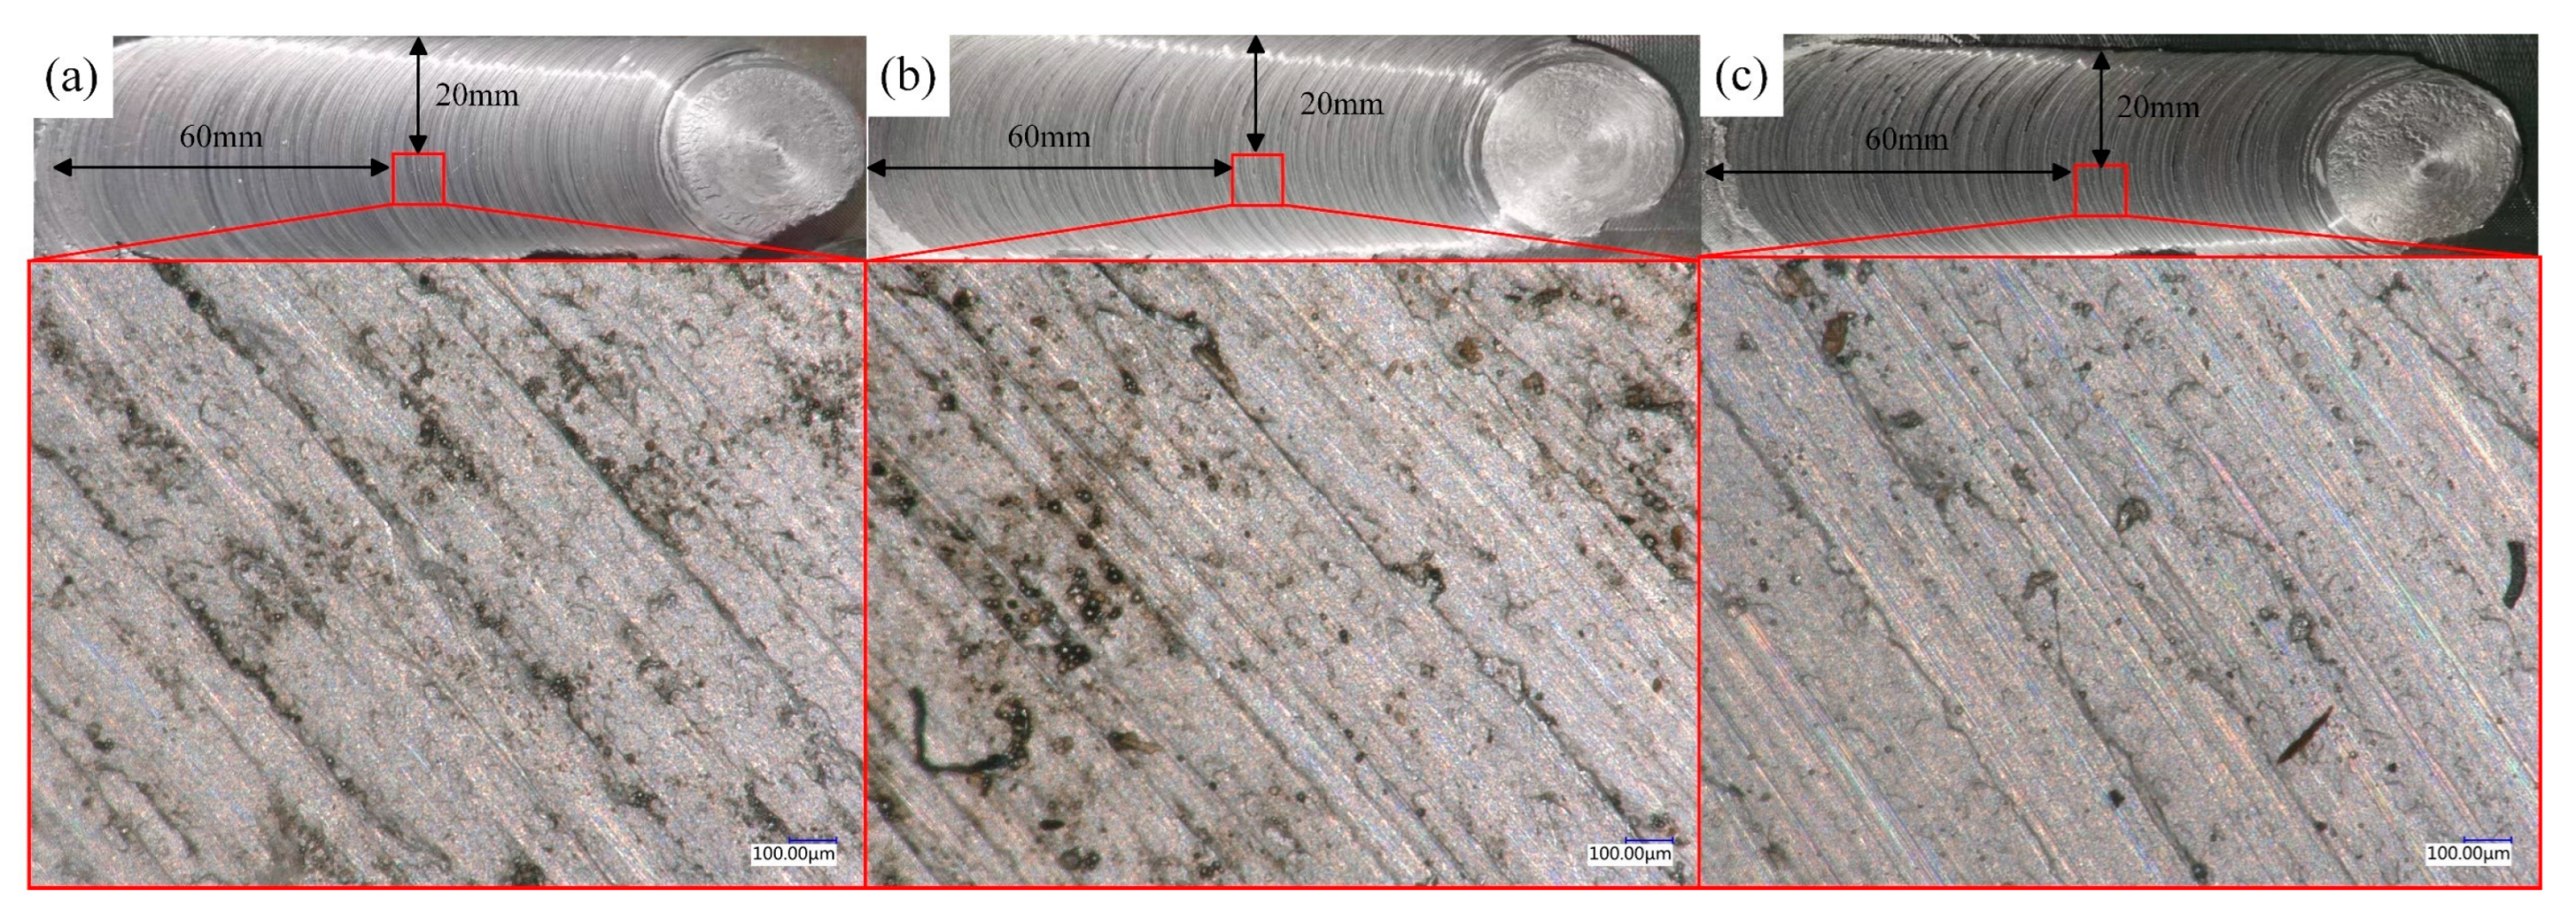
The specification of the dog-bone-type specimen used for the tensile experiment is based on the standard (GB/T 16865-2023 in China [44]), and the size is shown in Figure 3d, which is processed by laser wire-cutting. Tensile specimens were tested on an equipment material testing machine (5967-30 KN, Instron, Helveticon, UK) at a 9 mm/min quasi-static tensile rate. Single-layer tensile specimens were selected along the LD direction according to Figure 3c, and multilayer tensile specimens were chosen along the BD direction according to Figure 3a. A microhardness tester (HV-1000T, Sance, Laizhou, China) was used for microhardness measurements of the additive sections. The XRD test program utilised a testing machine (DX-2700, Haoyuan, Dandong, China) with a scanning speed of 0.03°/s, and the XRD results were analysed using Jade 6 software (MDI, Oakland, CA, USA). Roughness analysis was performed on the surface of the single deposition layer in Figure 4. The sampling positions for the analysis of monolayer deposition samples were (a) NO.1, (b) NO.2, and (c) NO.3. The surface was cleaned with alcohol before testing the roughness, and the roughness analysis was carried out by the super depth of a field 3D microscope (VHX-6000, Keyence, Osaka, Japan) for the measurement of surface roughness, line roughness, and protrusion height. Temperature changes during AFSD were tested using an infrared thermal imaging camera (LT7, DALI, Hangzhou, China) at an emissivity of 0.20, with a humidity of 40% and a background temperature of 20 °C, the same as room temperature.
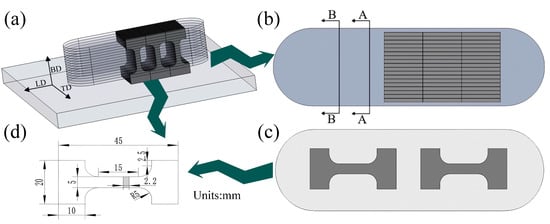
Figure 3.
Specimen selection position and specimen size: (a) BD direction tensile specimen selection, (b) top view of the multilayer deposition layer, (c) single-layer deposition layer LD direction tensile specimen selection, (d) tensile specimen size.
The specimens were ground according to the metallographic preparation standards (particle size order of 400, 800, 1200, 2000), polished with W0.5 diamond polish, and etched for 35 s using Keller’s reagent (2 mL HF + 3 mL HCL + 5 mL HNO3 + 190 mL H2O). The surfaces of three monolayer additive samples with different rotational speed conditions were scanned and analysed for micro-composition using field emission scanning electron microscopy (MERLIN Compact, Zeiss, Oberkochen, Germany) and energy dispersive X-ray spectroscopy (EDS, Hitachi, Tokyo, Japan). The grain size, grain morphology, and crystal orientation were observed using scanning electron microscopy (SEM, S-4800, Hitachi, Tokyo, Japan) and electron backscatter diffraction (EBSD, Oxford, UK). Samples for microstructural studies were prepared by continuous grinding followed by polishing in SiO2 polishing suspension (OPS, Struers, Denmark). SEM (S-4800, Hitachi, Tokyo) was used to observe the surface morphology analysis of the tensile fracture, and EDS was used to analyse the composition of the fracture.
3. Results
3.1. Macrostructure
The rotational speed of the AFSD process affects the roughness of the surface layer of the additive, the amount of heat input during the AFSD process, the degree of plasticisation of the material, and the material cooling and solidification process. Figure 4 shows the deposited samples of a single layer for the parameter conditions NO.1, NO.2, and NO.3. In Figure 4, it can be found that for a bar of this size, a moving length of 100 mm in the LD direction can form a deposition layer close to 130 mm in length and close to 40 mm in width. Overall, the deposition morphology of the samples, as well as the presence of defects, were found. The samples would form rounded curved areas in both the deposition start and end regions, and the advancing side (AS) of the deposited layer would be smoother than the receding side (RS), which is in agreement with the results of the experiments of the previous articles [41,45]. Under different rotational speed conditions, the morphology of the deposited layer changes due to the rotational speed. When the rotational speed is 600 rpm, as shown in Figure 4a,b, an intense flash is generated on the deposition start side. This is due to the low degree of plasticisation of the material, which results in a lower flow rate and thus generates the flash. There is a more pronounced serrated edge on the receding side, also due to insufficient heat transfer and low material plasticity, resulting in inadequate discharge and serrated edges. During the additive process, the action of the tool head creates varying shades of onion lines on the additive surface. At 600 rpm (NO.1) and 800 rpm (NO.2), the surface of the onion lines is relatively flat. At 1000 rpm (NO.3), as shown in Figure 4, the onion lines are more prominent and have severe ups and downs. The position of roughness selection is shown in Figure 5.
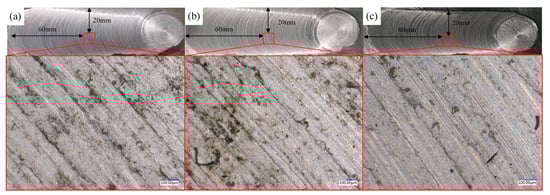
Figure 5.
Sampling positions for the analysis of monolayer deposition samples: (a) NO.1, (b) NO.2, (c) NO.3.
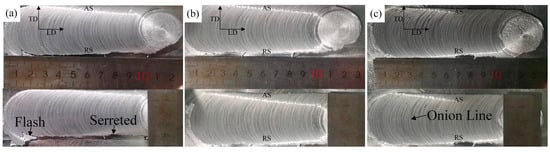
Figure 4.
Macroscopic morphology of single-layer deposition: (a) NO.1, (b) NO.2, (c) NO.3.
Figure 4.
Macroscopic morphology of single-layer deposition: (a) NO.1, (b) NO.2, (c) NO.3.
Surface roughness was analysed on NO.1, NO.2, and NO.3 parametric condition AFSD samples to investigate the surface morphology. According to the above surface morphology analysis, the moulding quality of the RS side is generally lower than that of the AS side during the AFSD material additive process. Therefore, the region of the sample close to the RS side was selected for roughness detection, as shown in Figure 5. The area’s chosen morphology was observed on a 100 μm scale, which reveals the specific onion line orientation on the surface of the additive. Due to the thermal input and mechanical agitation, black etching was found on the surface.
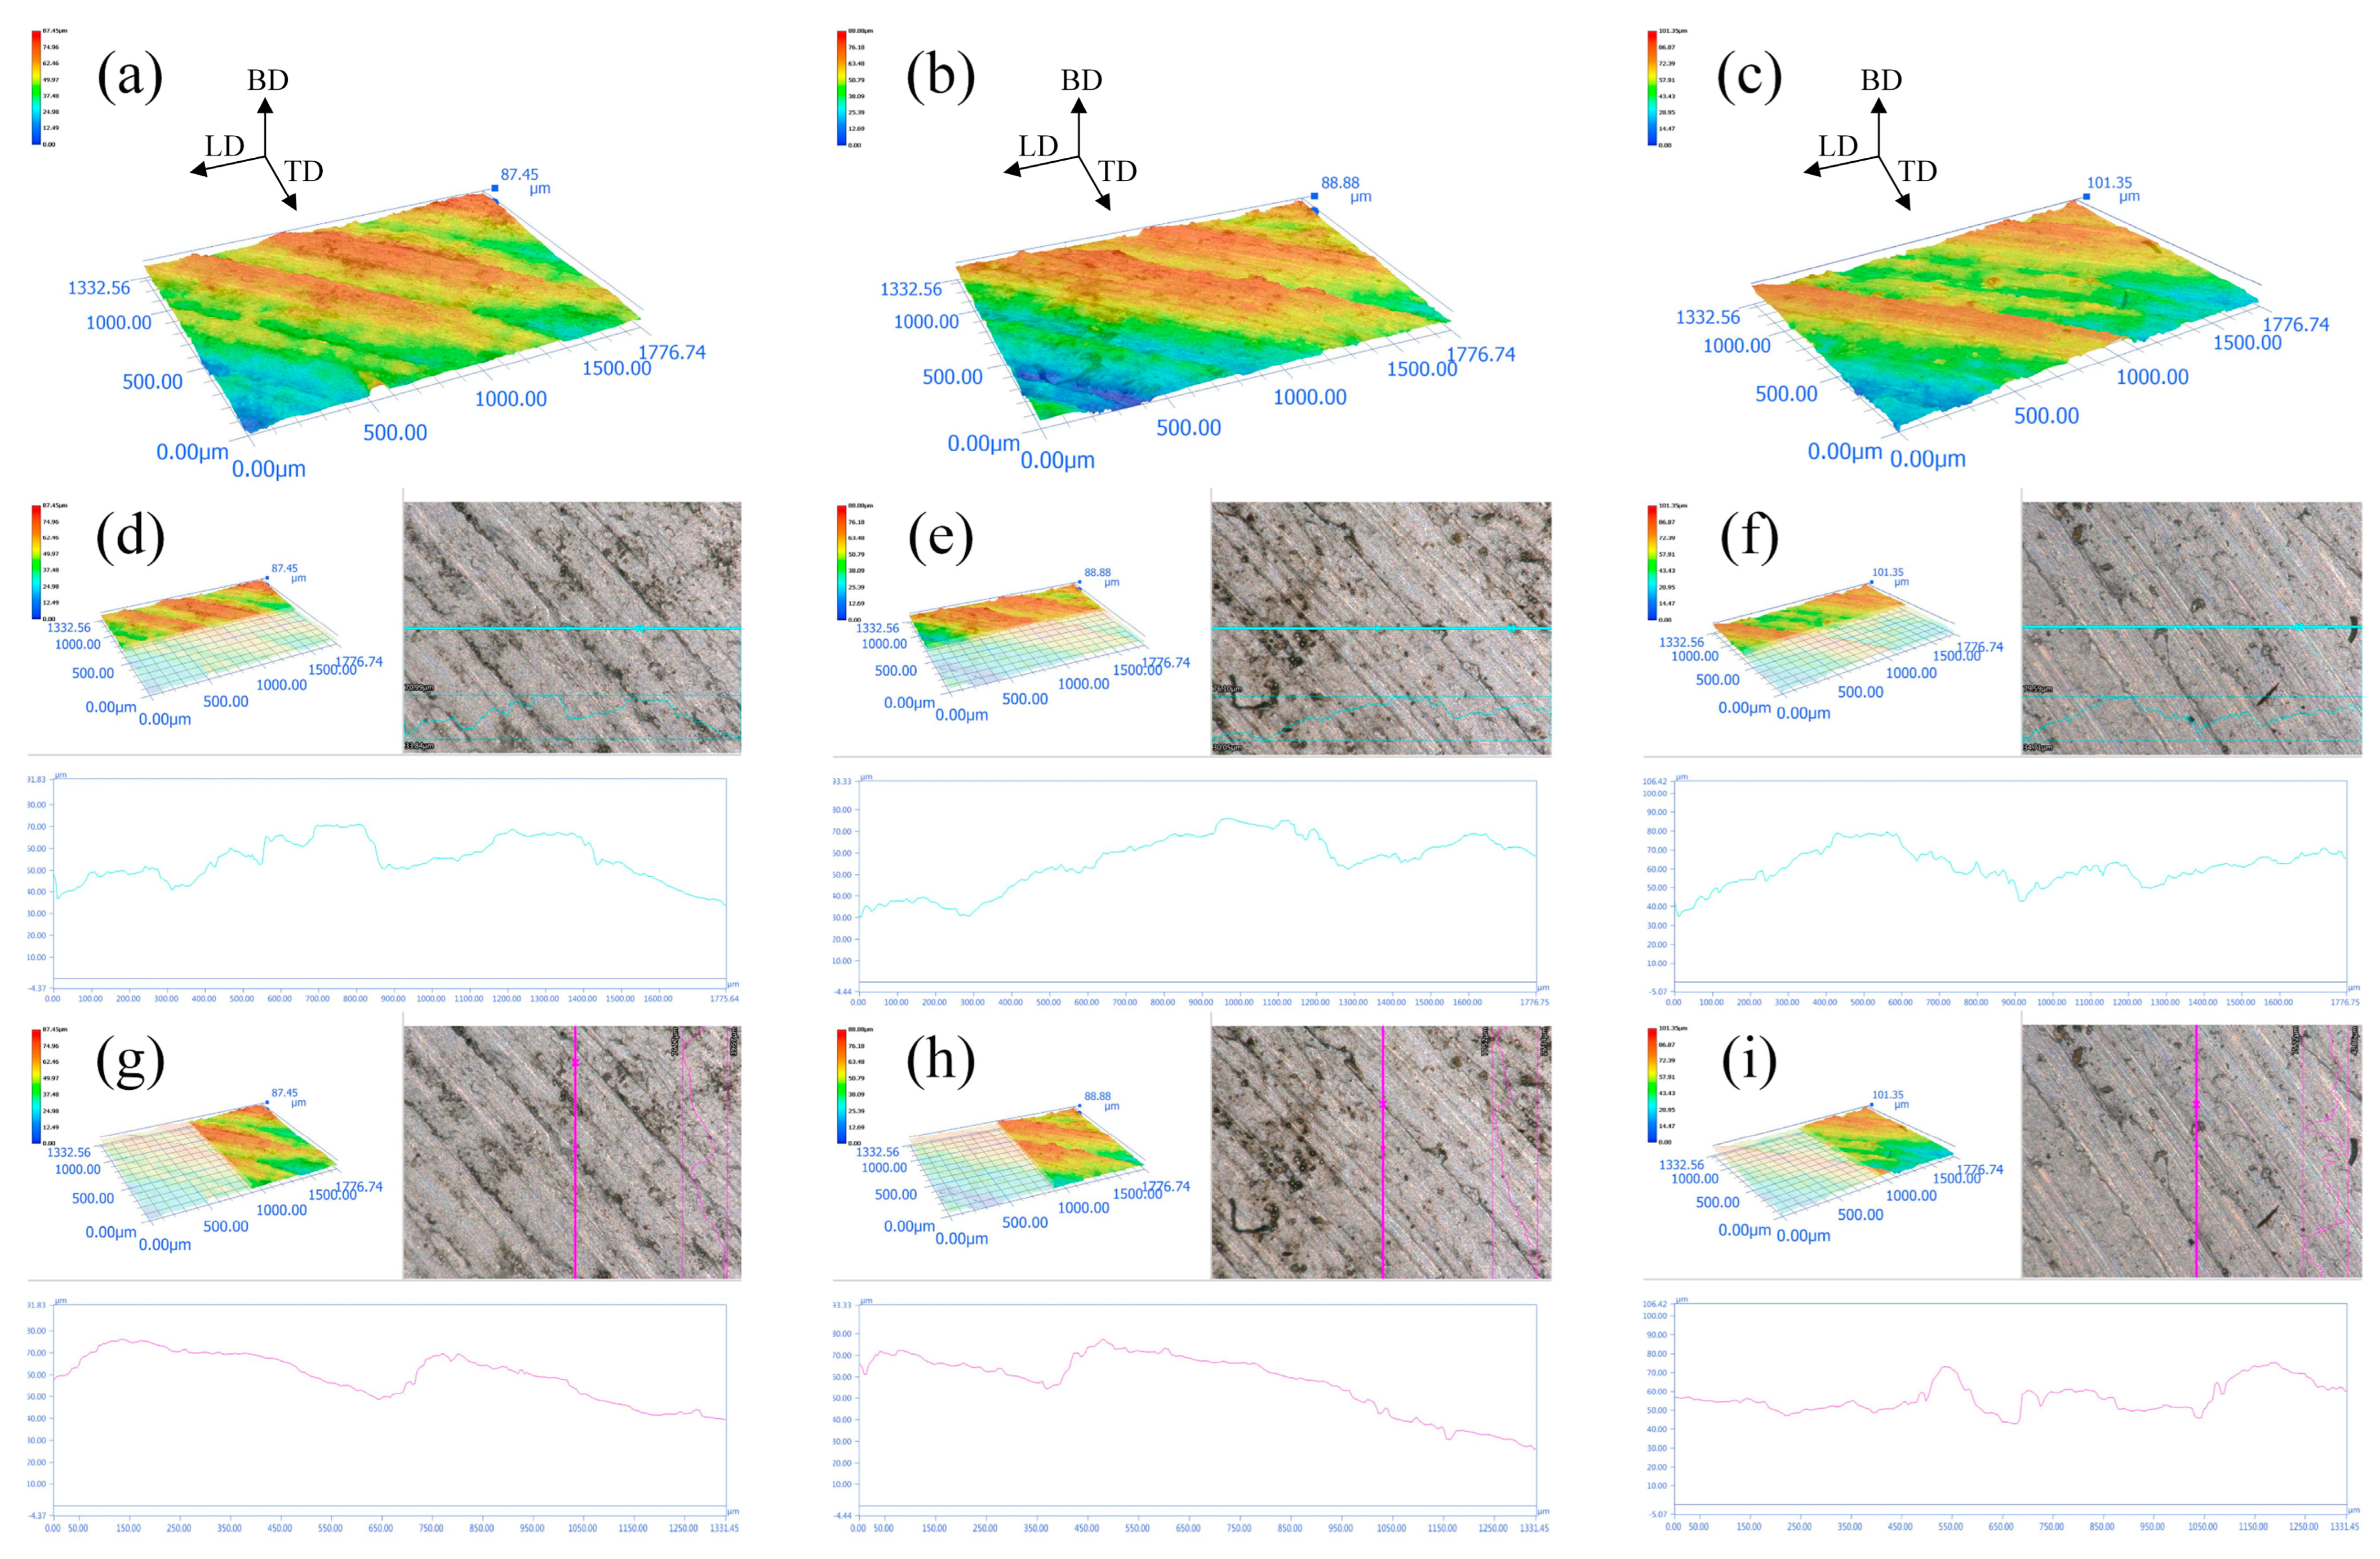
The roughness results are shown below in Figure 6. In Figure 6a–c, the roughness and protruding areas of the AFSD monolayer deposited samples under 100 μm magnification conditions are analysed for the parametric conditions NO.1, NO.2, and NO.3. It can be noticed that there are significant peaks in all three samples, which are due to the deformation of the material during rotation to produce onion lines. The highest surface protrusion is 87.45 μm in Figure 6a, 88.88 μm in Figure 6b, and 101.35 μm in Figure 6c, which shows that the increase in the additive speed leads to the rise in the unevenness of the surface of the additive, resulting in the emergence of sharper particle protrusions. In Figure 6d–f, the line roughness of the three sample surfaces in the LD direction under 100 μm magnification conditions is analysed. In the roughness curves, it can be observed that there are undulations in all three figures. The ups and downs are most evident in Figure 6d, while Figure 6f has the flattest curve. This is due to the small spacing between onion lines in the transverse direction of the additive surface at 1000 rpm and the smaller spacing of the roughness peaks, reducing the roughness differences in adjacent areas. The transverse direction on the surface of the additive produces onion lines at 600 rpm in the low rotational speed at considerable intervals, resulting in a sizeable high–low dropout. The roughness curves in Figure 6e are gentler, without dramatic high and low waves. In Figure 6g–i, the line roughness of the three sample surfaces in the TD direction under 100 μm magnification conditions is analysed. It can be found that, contrary to the longitudinal direction, the roughness curves are flatter in Figure 6g,h. The roughness curves undulate sharply in Figure 6i, which aligns with the previous analysis. Surface finish preservation in the longitudinal direction is better at a low rpm, while at a high rpm, it scratches the surface of the deposition.

Figure 6.
Experimental analysis of the surface roughness of a single layer: (a–g) NO.1, (b–h) NO.2, (c–i) NO.3.
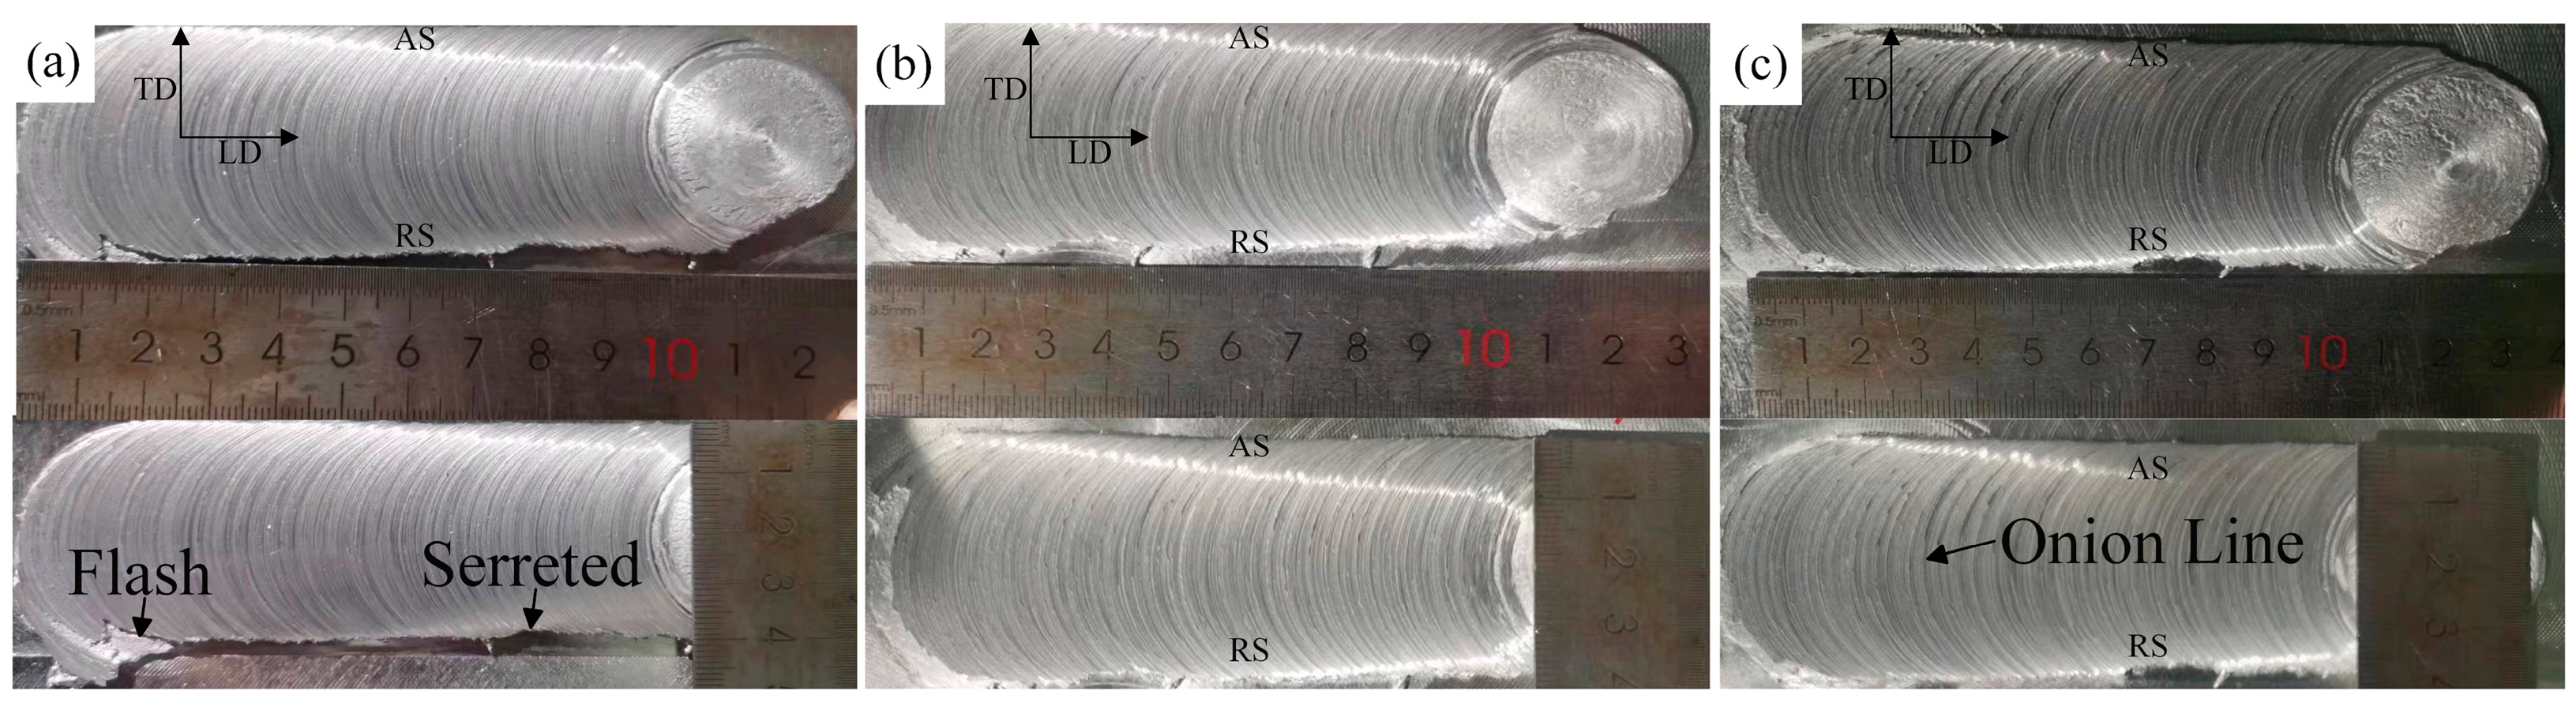
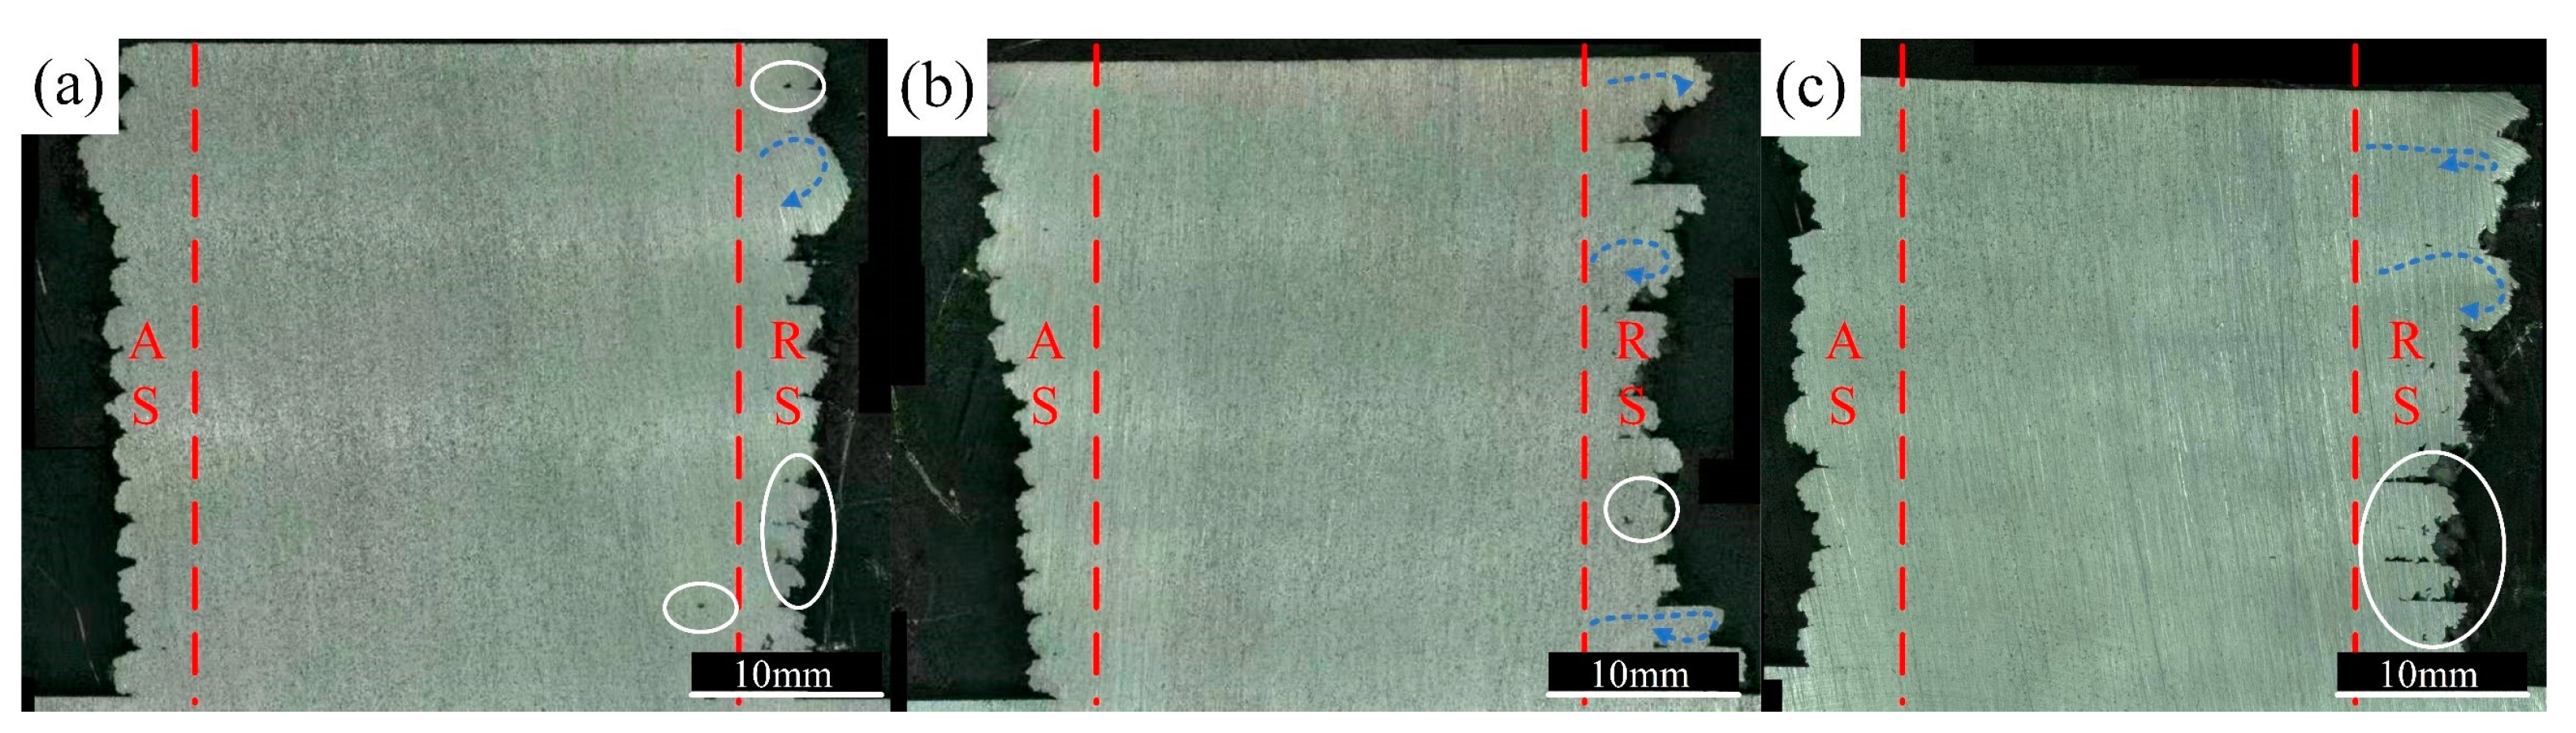
Figure 7 presents the cross-section of the deposition layer formed by AFSD under varying rotational speeds. The specific location selected for analysis corresponds to the A-A cross-section depicted in Figure 3b.
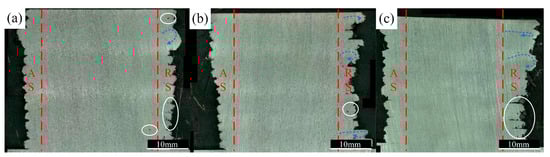
Figure 7.
Cross-section of 15 sedimentary layers: (a) NO.1, (b) NO.2, and (c) NO.3.
Tilting to the side occurred in the NO.2 and NO.3 deposited layers. The difference in the flow ability of the material during the AFSD process is obvious at different rotational speeds. The blue arrows in Figure 7 indicate the flow path and direction of the material during AFSD. As the rotational speed increases, the material flow becomes more intense, predominantly concentrating on the RS side. This flow is driven by the plasticising shear of the material induced by the spindle. The material’s plastic deformation intensifies with an increase in the shoulder’s rotational speed. The formation of a new interface subjects the underlying metal to secondary frictional shear, resulting in the development of an arcuate feature. In Figure 7, numerous holes and interlayer joint defects, circled in white elliptical coils, are observed. These defects are positively correlated with the degree of roughness shown in Figure 6; a higher roughness results in the appearance of more holes. Such holes and interlaminar defects are particularly evident under high rotational speed conditions, as seen in Figure 7c. This phenomenon arises because the material flows violently towards the edges at high rotational speeds. The flowing material contacts the surface of the lower laminar level, which curls under friction, forming a ring feature with holes retained at the centre of the ring.
3.2. Compositional Analysis
Figure 8 presents the XRD characterisation results of NO.1, NO.2, NO.3, and the parent material. The primary peaks of all samples are in the FCC-Al phase, indicating that the Al phase of the parent material undergoes transformation during the AFSD process. Weak diffraction peaks of the Mg2Si phase were present in all three AFSD samples near the diffraction angle of 40.2°, whereas there were no diffraction peaks of this phase in the 6061 parent material. The FCC-Al (220) and FCC-Al (311) diffraction peaks of the AFSD samples show migration to higher diffraction angles compared to those of the parent material, and according to Bragg’s equation, the diffraction angle increases the interplanar spacing, and the lattice decreases.
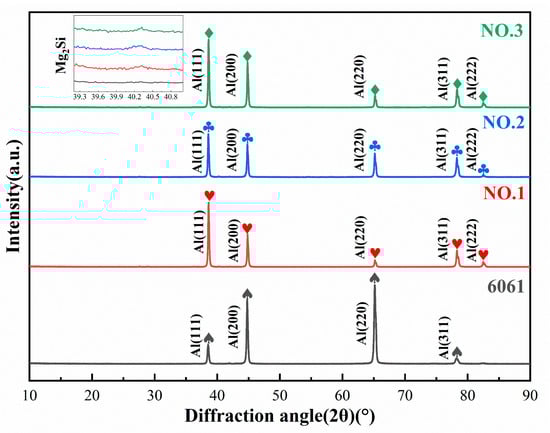
Figure 8.
XRD analysis results for NO.1, NO.2, NO.3, and base material. Al-phase diffraction peaks with specific orientations are labelled.
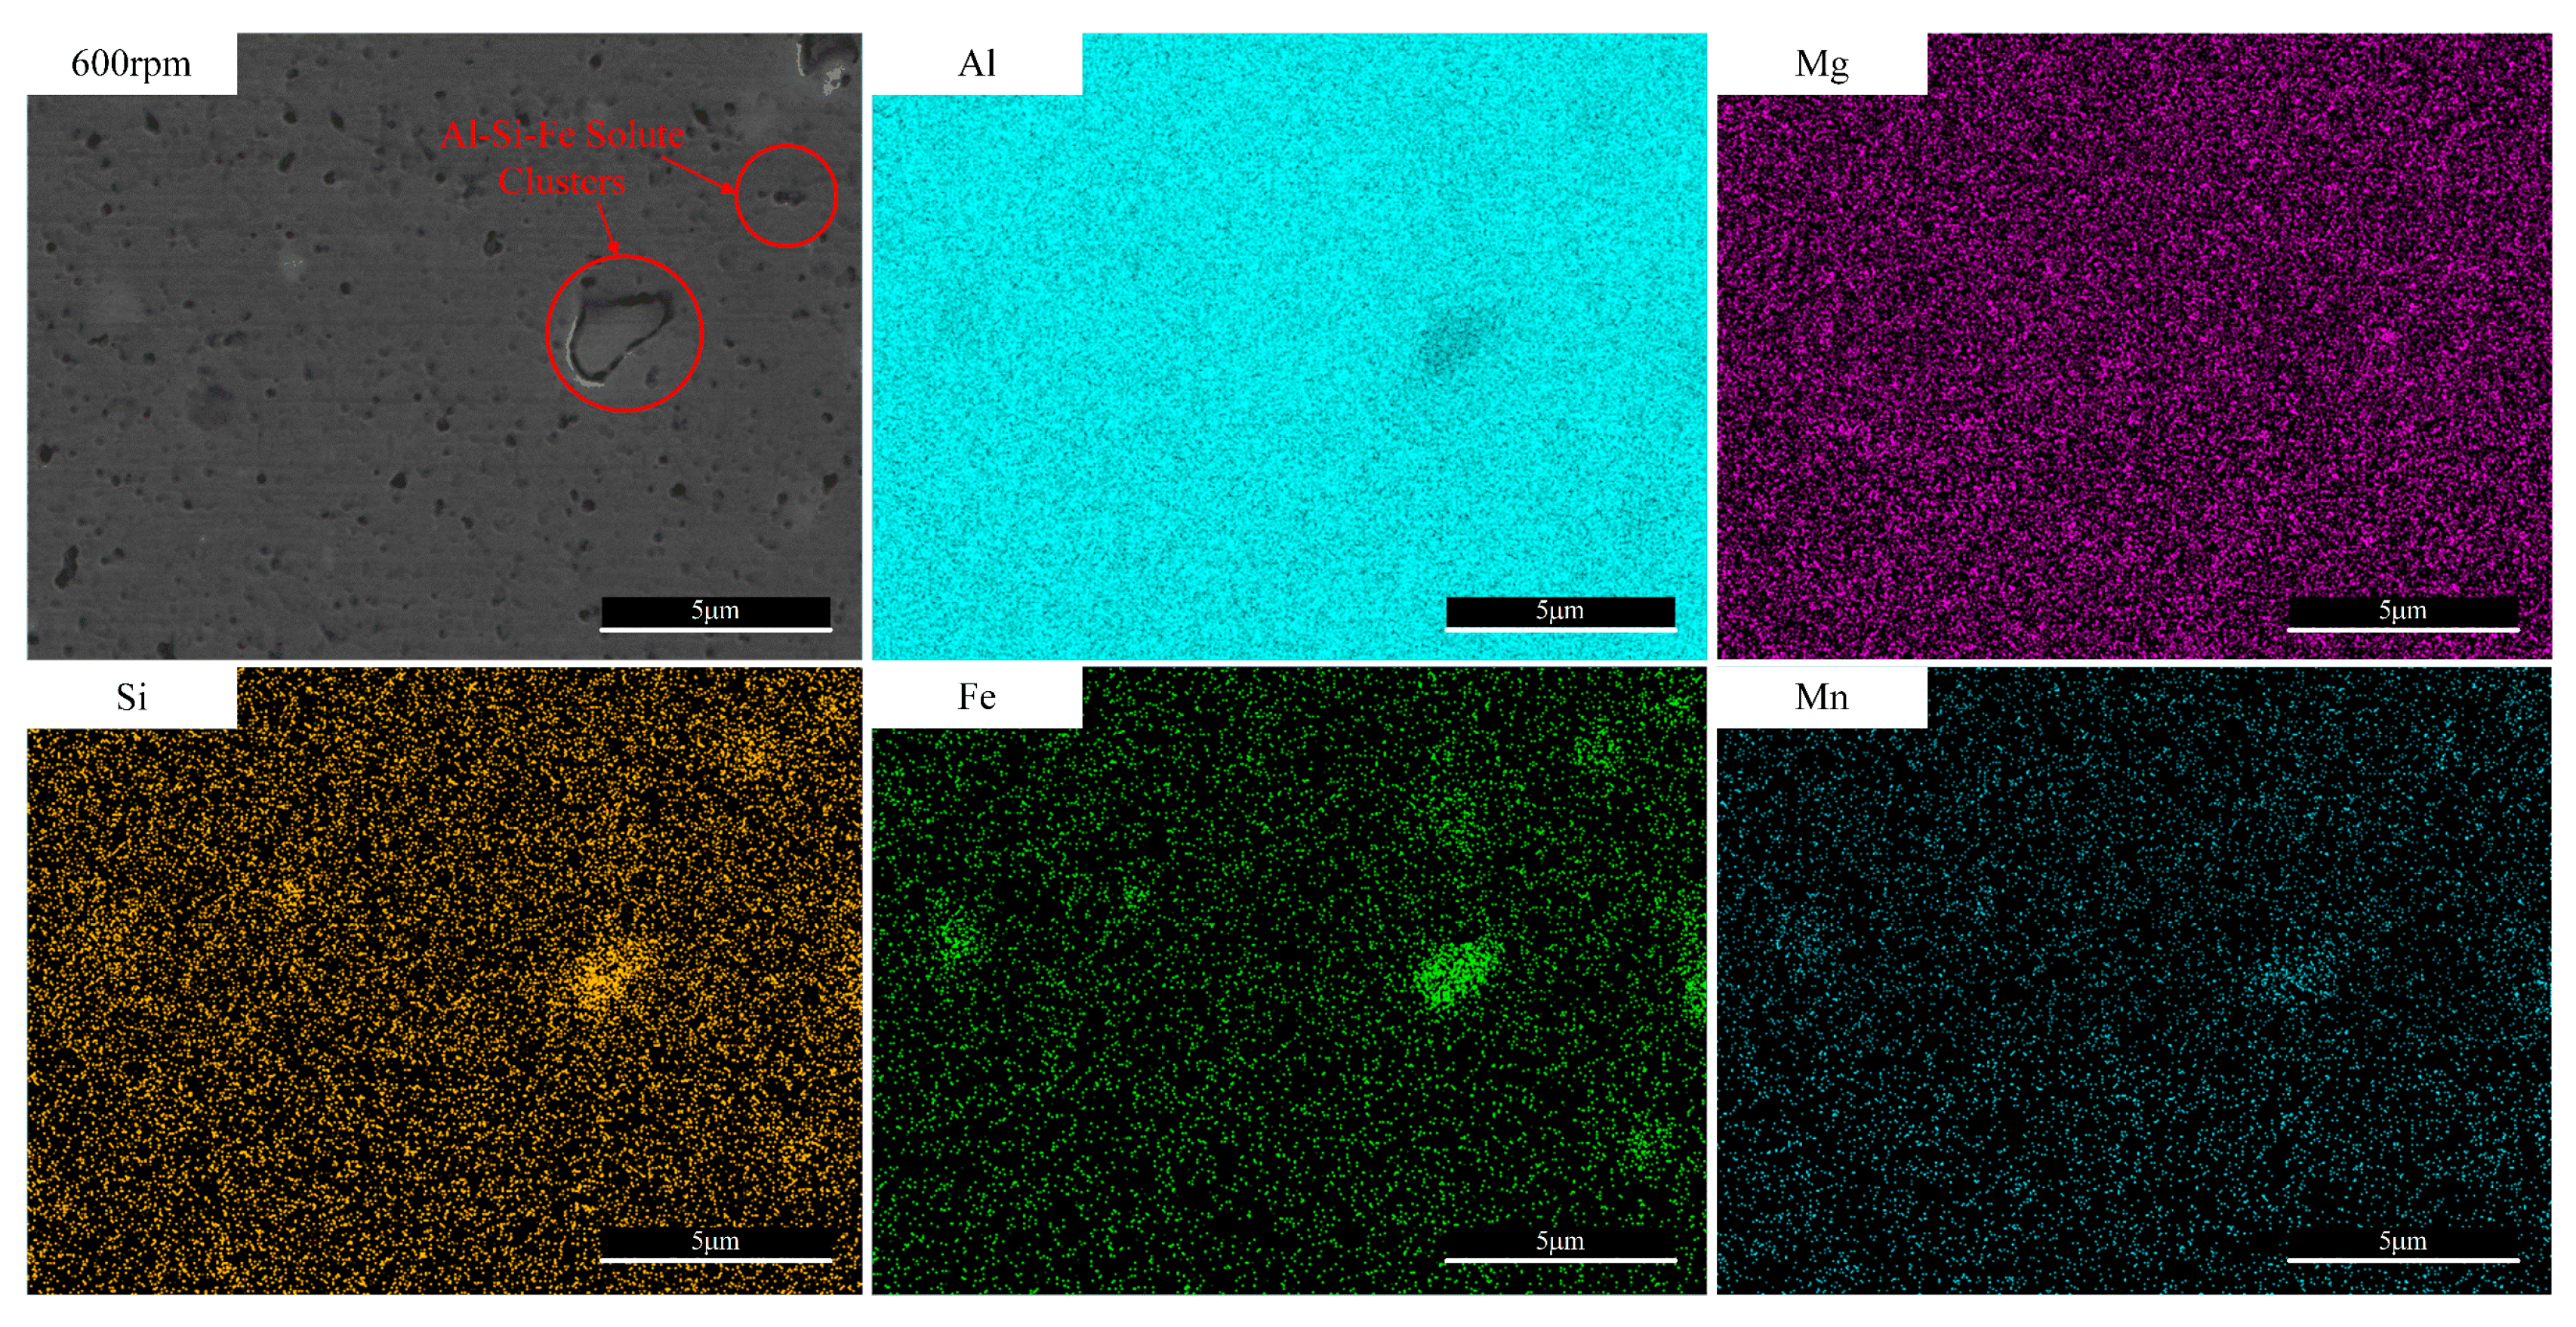
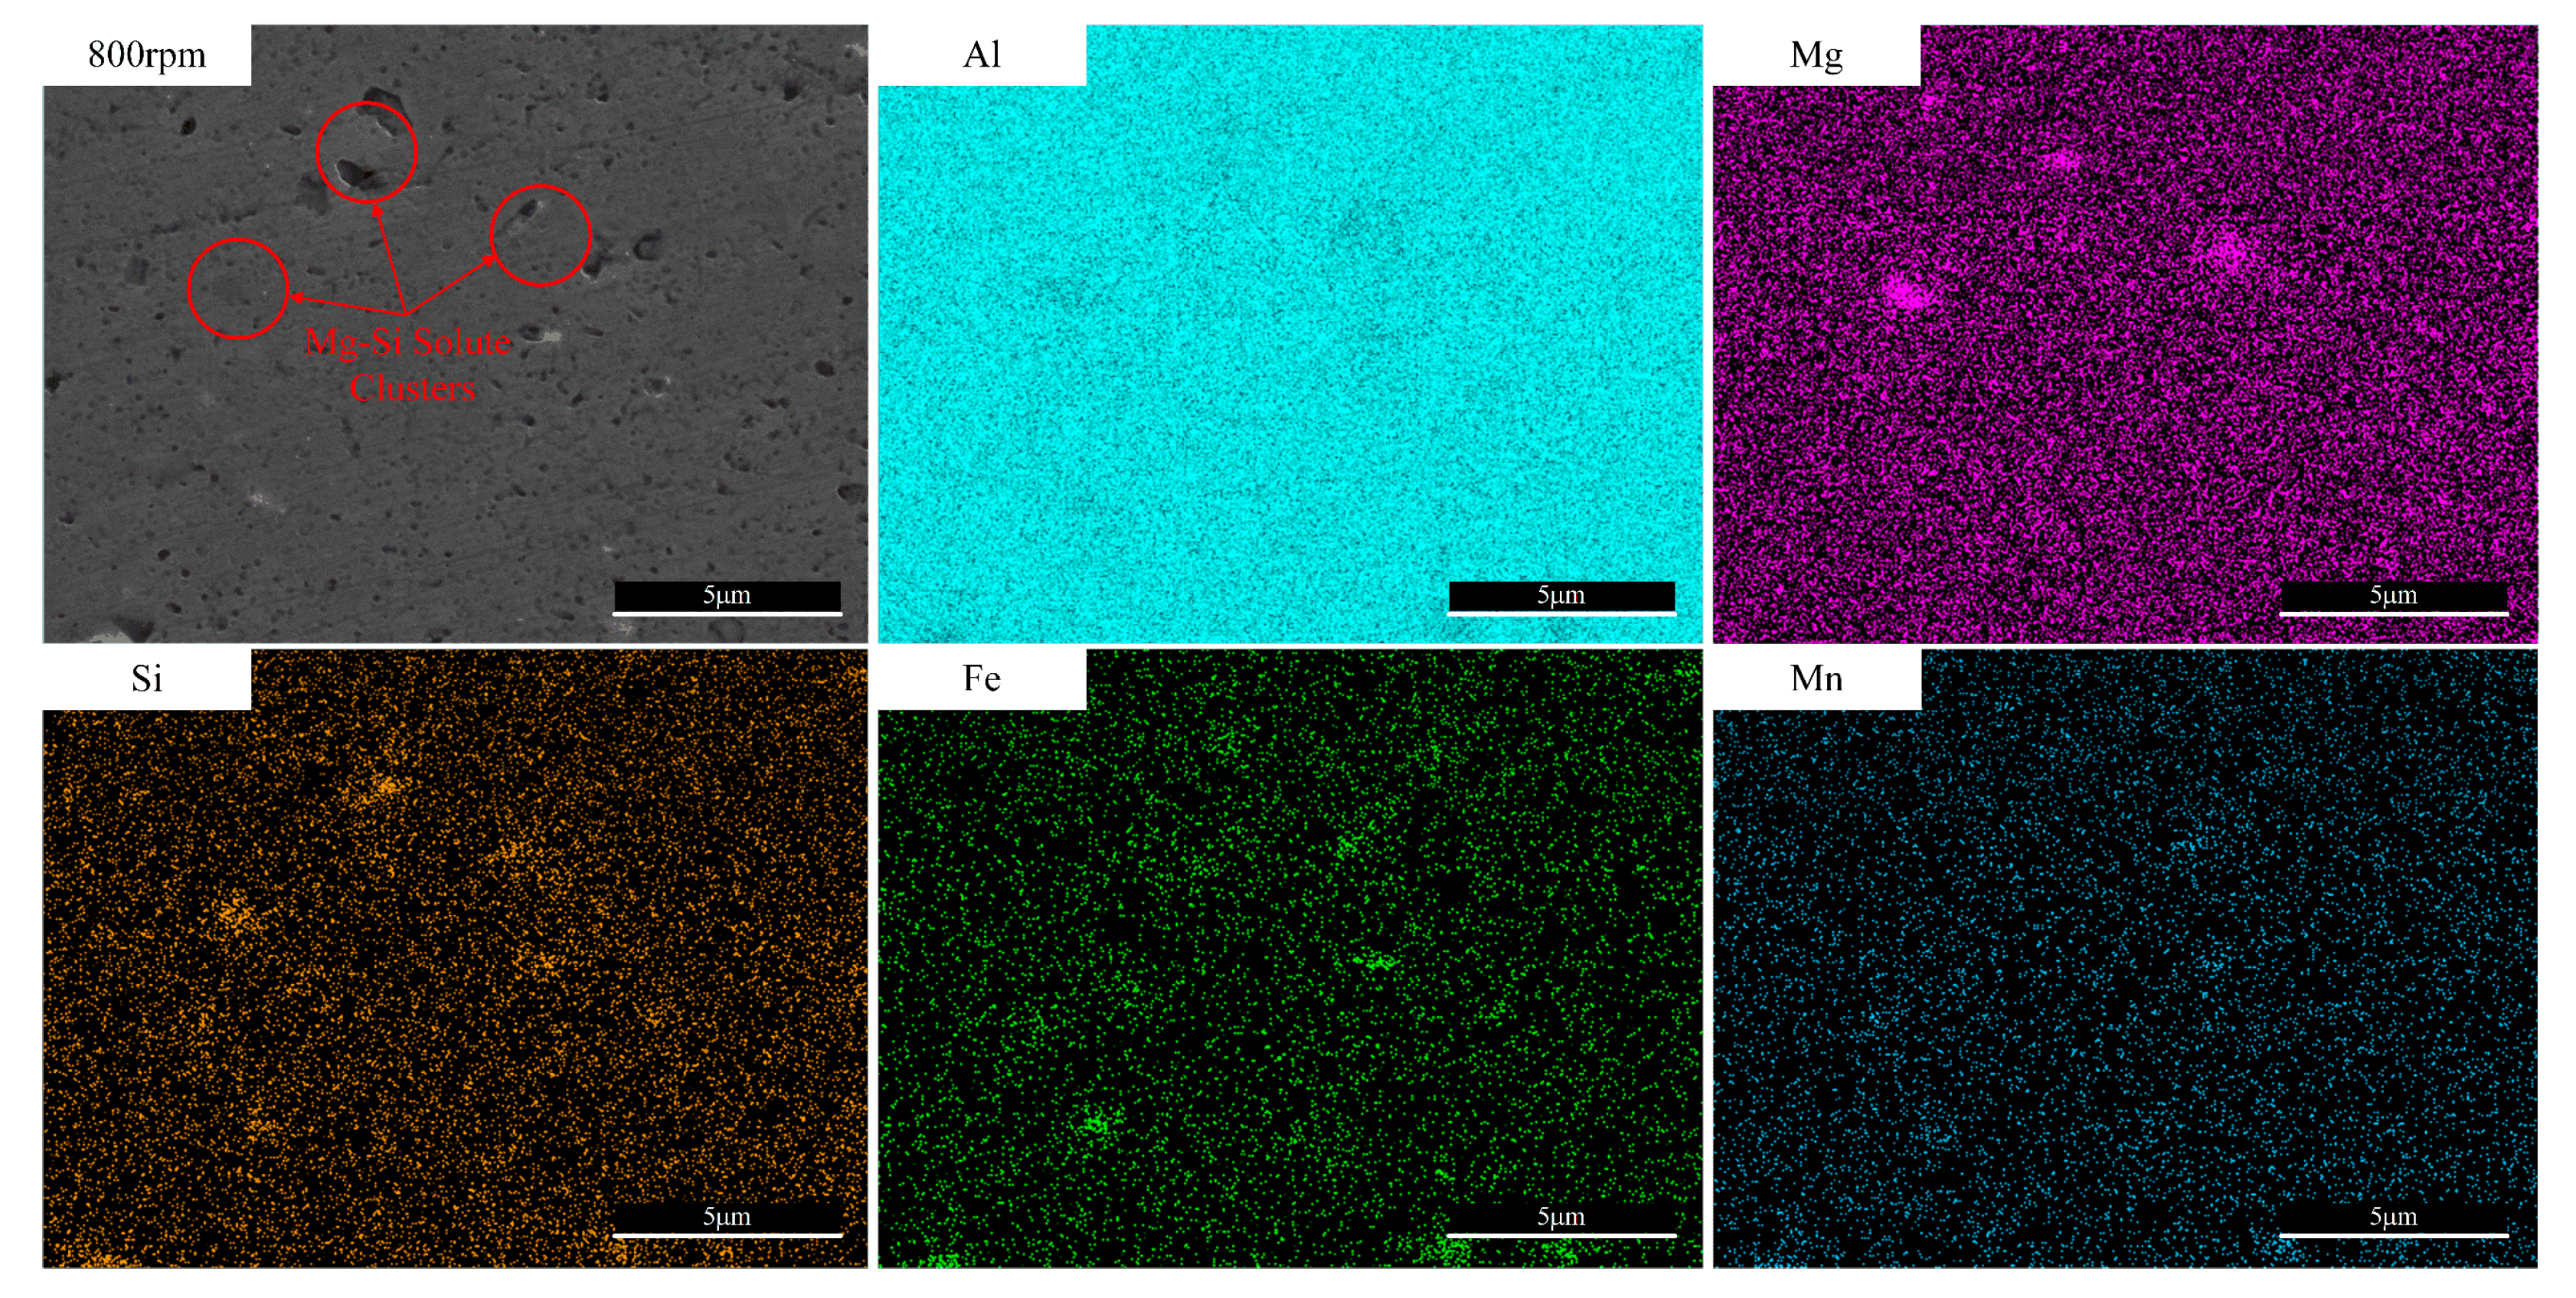
Figure 9, Figure 10 and Figure 11 depict the surface compositions of the AFSD samples evaluated and compared for the parametric conditions. The sequence of precipitation phases for the 6061 aluminium alloy is saturated solid solution → MgSi solid solution/GP zone → β″ → β′ → β [42,46]. Some coarse metal phases were identified as Al7Cu2Fe among the metal phases formed. The sample composition distribution is shown in Figure 9 and Figure 11. The presence of Al as a collective element of the deposited layer can be found in Figure 9, Figure 10 and Figure 11. Mg and Si are present in AFSD in the form of Mg2Si or T phases, as shown by the results in Figure 8, and this type of precipitation has a relatively better strengthening effect on 6061 aluminium alloys. Iron phases often form new phases with other elements—commonly, AlFeSi compounds. AlFeSi phases provide better die-casting properties and flexibility for aluminium alloys but can lead to the material’s brittle behaviour. It can be noticed from Figure 9 that at 600 rpm working conditions, there are residues enriched with Si, Mn, and Fe inside the sample with a size of about 1 μm, and the strengthening of the AlMnSi phase is greater than that of Mg2Si [47]. In Figure 10, it can be found that at 800 rpm, there is a residue of about 1 μm in size, which is mainly composed of Mg and Si precipitates and some finer Fe, Si, Mn precipitates.
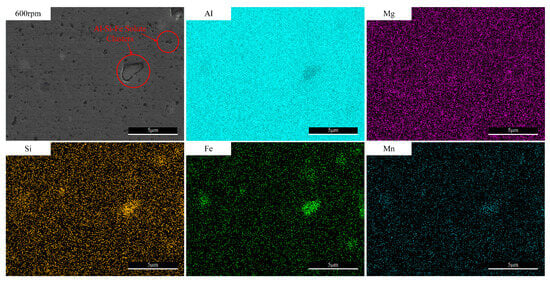
Figure 9.
EDS mapping results showing the elemental distribution of NO.1 AFSD samples.
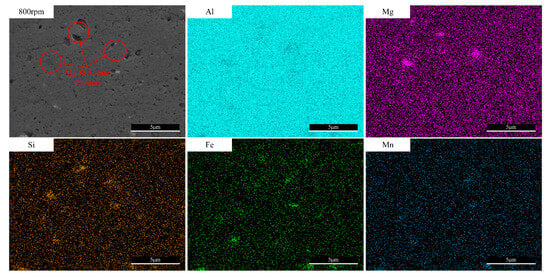
Figure 10.
EDS mapping results showing the elemental distribution of NO.2 AFSD samples.
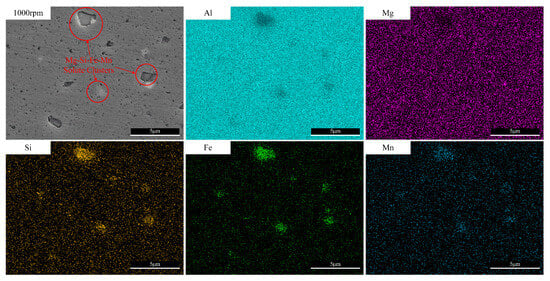
Figure 11.
EDS mapping results showing the elemental distribution of NO.3 AFSD samples.
In Figure 11, multiple Si, Fe, and Mn precipitates, ranging in size from approximately 1 to 3 μm, were observed within the sample at 1000 rpm. The deposition temperature during AFSD ranges from about 60% to 90% of the melting temperature of the Al substrate. As the rotational speed increases, the temperature also rises gradually. The shearing effect of AFSD on the second-phase particles is significant, leading to more precipitated phases and larger particle sizes. Although the AFSD temperature is insufficient to dissolve AlFeSi into a solid solution, it effectively reduces the size of these intermetallic compounds and distributes them more evenly throughout the material.
3.3. Analysis of Microstructure
The scanning area was selected as shown in Figure 5. Selected specimens underwent polishing and corrosion by 0.3 mm to ensure that the positioning of the specimens remained unaffected by the onion pattern on the surface of the deposition layer. EBSD scanning was conducted for a single deposition layer to further analyse the microstructure evolution of the AFSD samples, specifically focusing on microbonding and microstructure evolution. According to Perry et al. [48], the action of AFSD leads to grain refinement, primarily attributed to recrystallisation. Recrystallisation can be categorised into continuous dynamic recrystallisation and discontinuous dynamic recrystallisation. Continuous dynamic recrystallisation entails the recrystallisation of grains occurring concurrently with the plastic deformation of the material. Operating under high-temperature conditions, AFSD induces significant plastic deformation within the material, resulting in dynamic recrystallisation within the grains and the formation of new refined grains.
In Figure 12a,d,g, the Inverse Pole Figure (IPF) of AFSD samples for NO.1, NO.2, and NO.3 parameter conditions is shown, respectively. Throughout the AFSD process, the material undergoes significant shear deformation, transforming grains from their original form in the feedstock into equiaxed grains. Notably, the grains in samples NO.2 and NO.3 regained their orientation, indicating secondary deformation subsequent to recrystallisation. Figure 12b,e,h show the grain size distributions of the AFSD samples for the parametric conditions of NO.1, NO.2, and NO.3, respectively, with the average grain sizes of 2.32 μm, 2.37 μm, and 3.04 μm, The degree of grain refinement is about 6.7–8.8% (34.4 μm [49]) of the depletable substrate, and most of the grains are smaller than 10 μm. Significant grain refinement occurred during the AFSD process. Notably, grain growth was observed at a rotational speed of 1000 rpm, resulting in larger grains compared to those observed in samples subjected to 600 rpm and 800 rpm conditions. Figure 12c,f,i, illustrate the grain boundary orientation angle distributions of the AFSD samples for the NO.1, NO.2, and NO.3 parameter conditions, respectively. A grain boundary orientation angle distribution ranging from 2° to 15° indicates the presence of low-angle grain boundaries (LAGBs), while a distribution between 15° and 60° suggests high-angle grain boundaries (HAGBs).
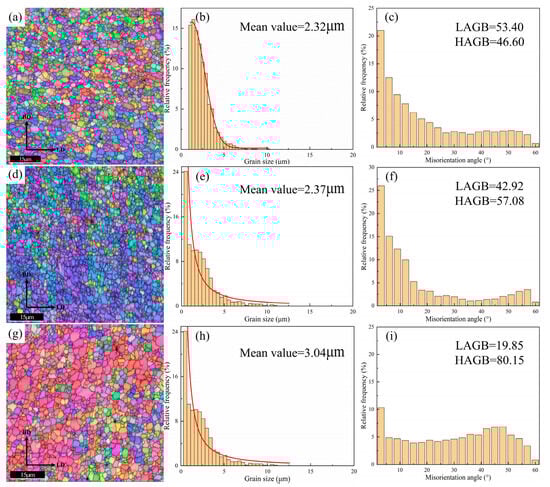
Figure 12.
AFSD single-layer EBSD analysis: (a–c) NO.1, (d–f) NO.2, (g–i) NO.3.
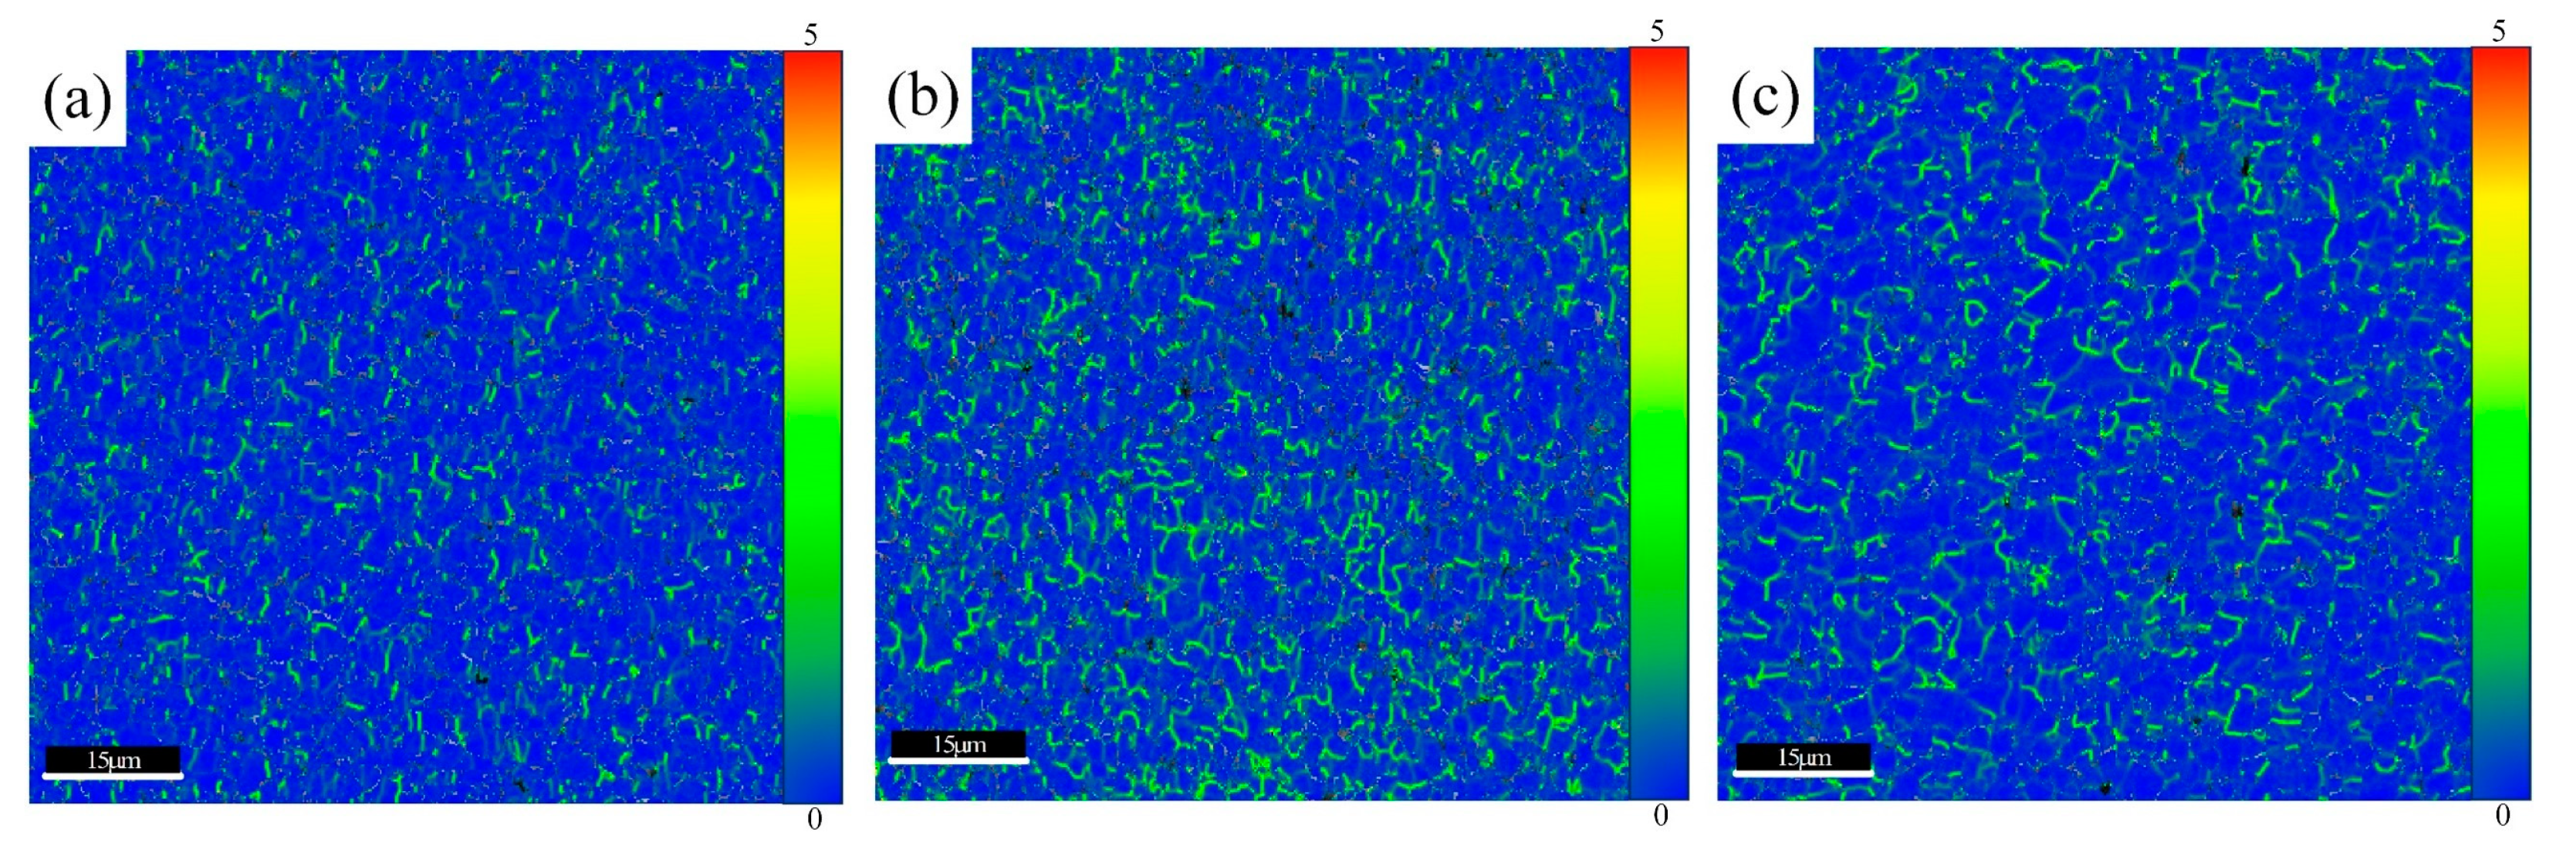
Numerous high-angle grain boundary (HAGB) formations are observed across all AFSD-deposited materials. This occurrence is attributed to the deformation experienced by grains during the AFSD process. The grain boundaries manifest a serrated shape, leading to localised orientation discrepancies among grains and the accumulation of high- strain energy, as illustrated in Figure 13. In Figure 13b,c, substantial localised orientation disparities between grains are evident, accompanied by residual stresses and a proclivity towards growth. The presence of a serrated grain boundary vicinity induces the formation of numerous small, dynamically recrystallised grains, thereby reducing the energy disparity between large grains and recrystallised grains. Consequently, the original grains undergo grain boundary migration, leading to dislocation rearrangement and a significant conversion of low-angle grain boundaries (LAGBs) to HAGBs [50]. As shown in Figure 12c,f,i, HAGB accounted for 46.60%, 57.08%, and 80.15%, respectively, indicating a higher proportion of LAGBs converting to HAGBs with an increased rotational speed-generated heat input. The temperature during AFSD typically ranges from about 60% to 90% of the material’s melting point. Under thermal cycling, the material temperature consistently surpasses its recrystallisation temperature (T ≥ Tm). This perpetuates the dynamic recovery of grains, retains LAGBs to some extent, and directionally promotes grain growth, thereby mitigating the proportion of HAGBs [50,51].
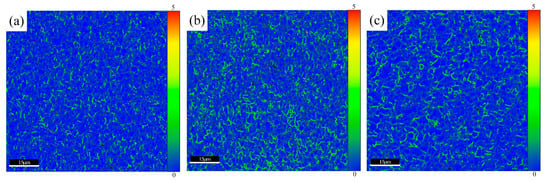
Figure 13.
Kernel average misorientation analysis: (a) NO.1, (b) NO.2, (c) NO.3.
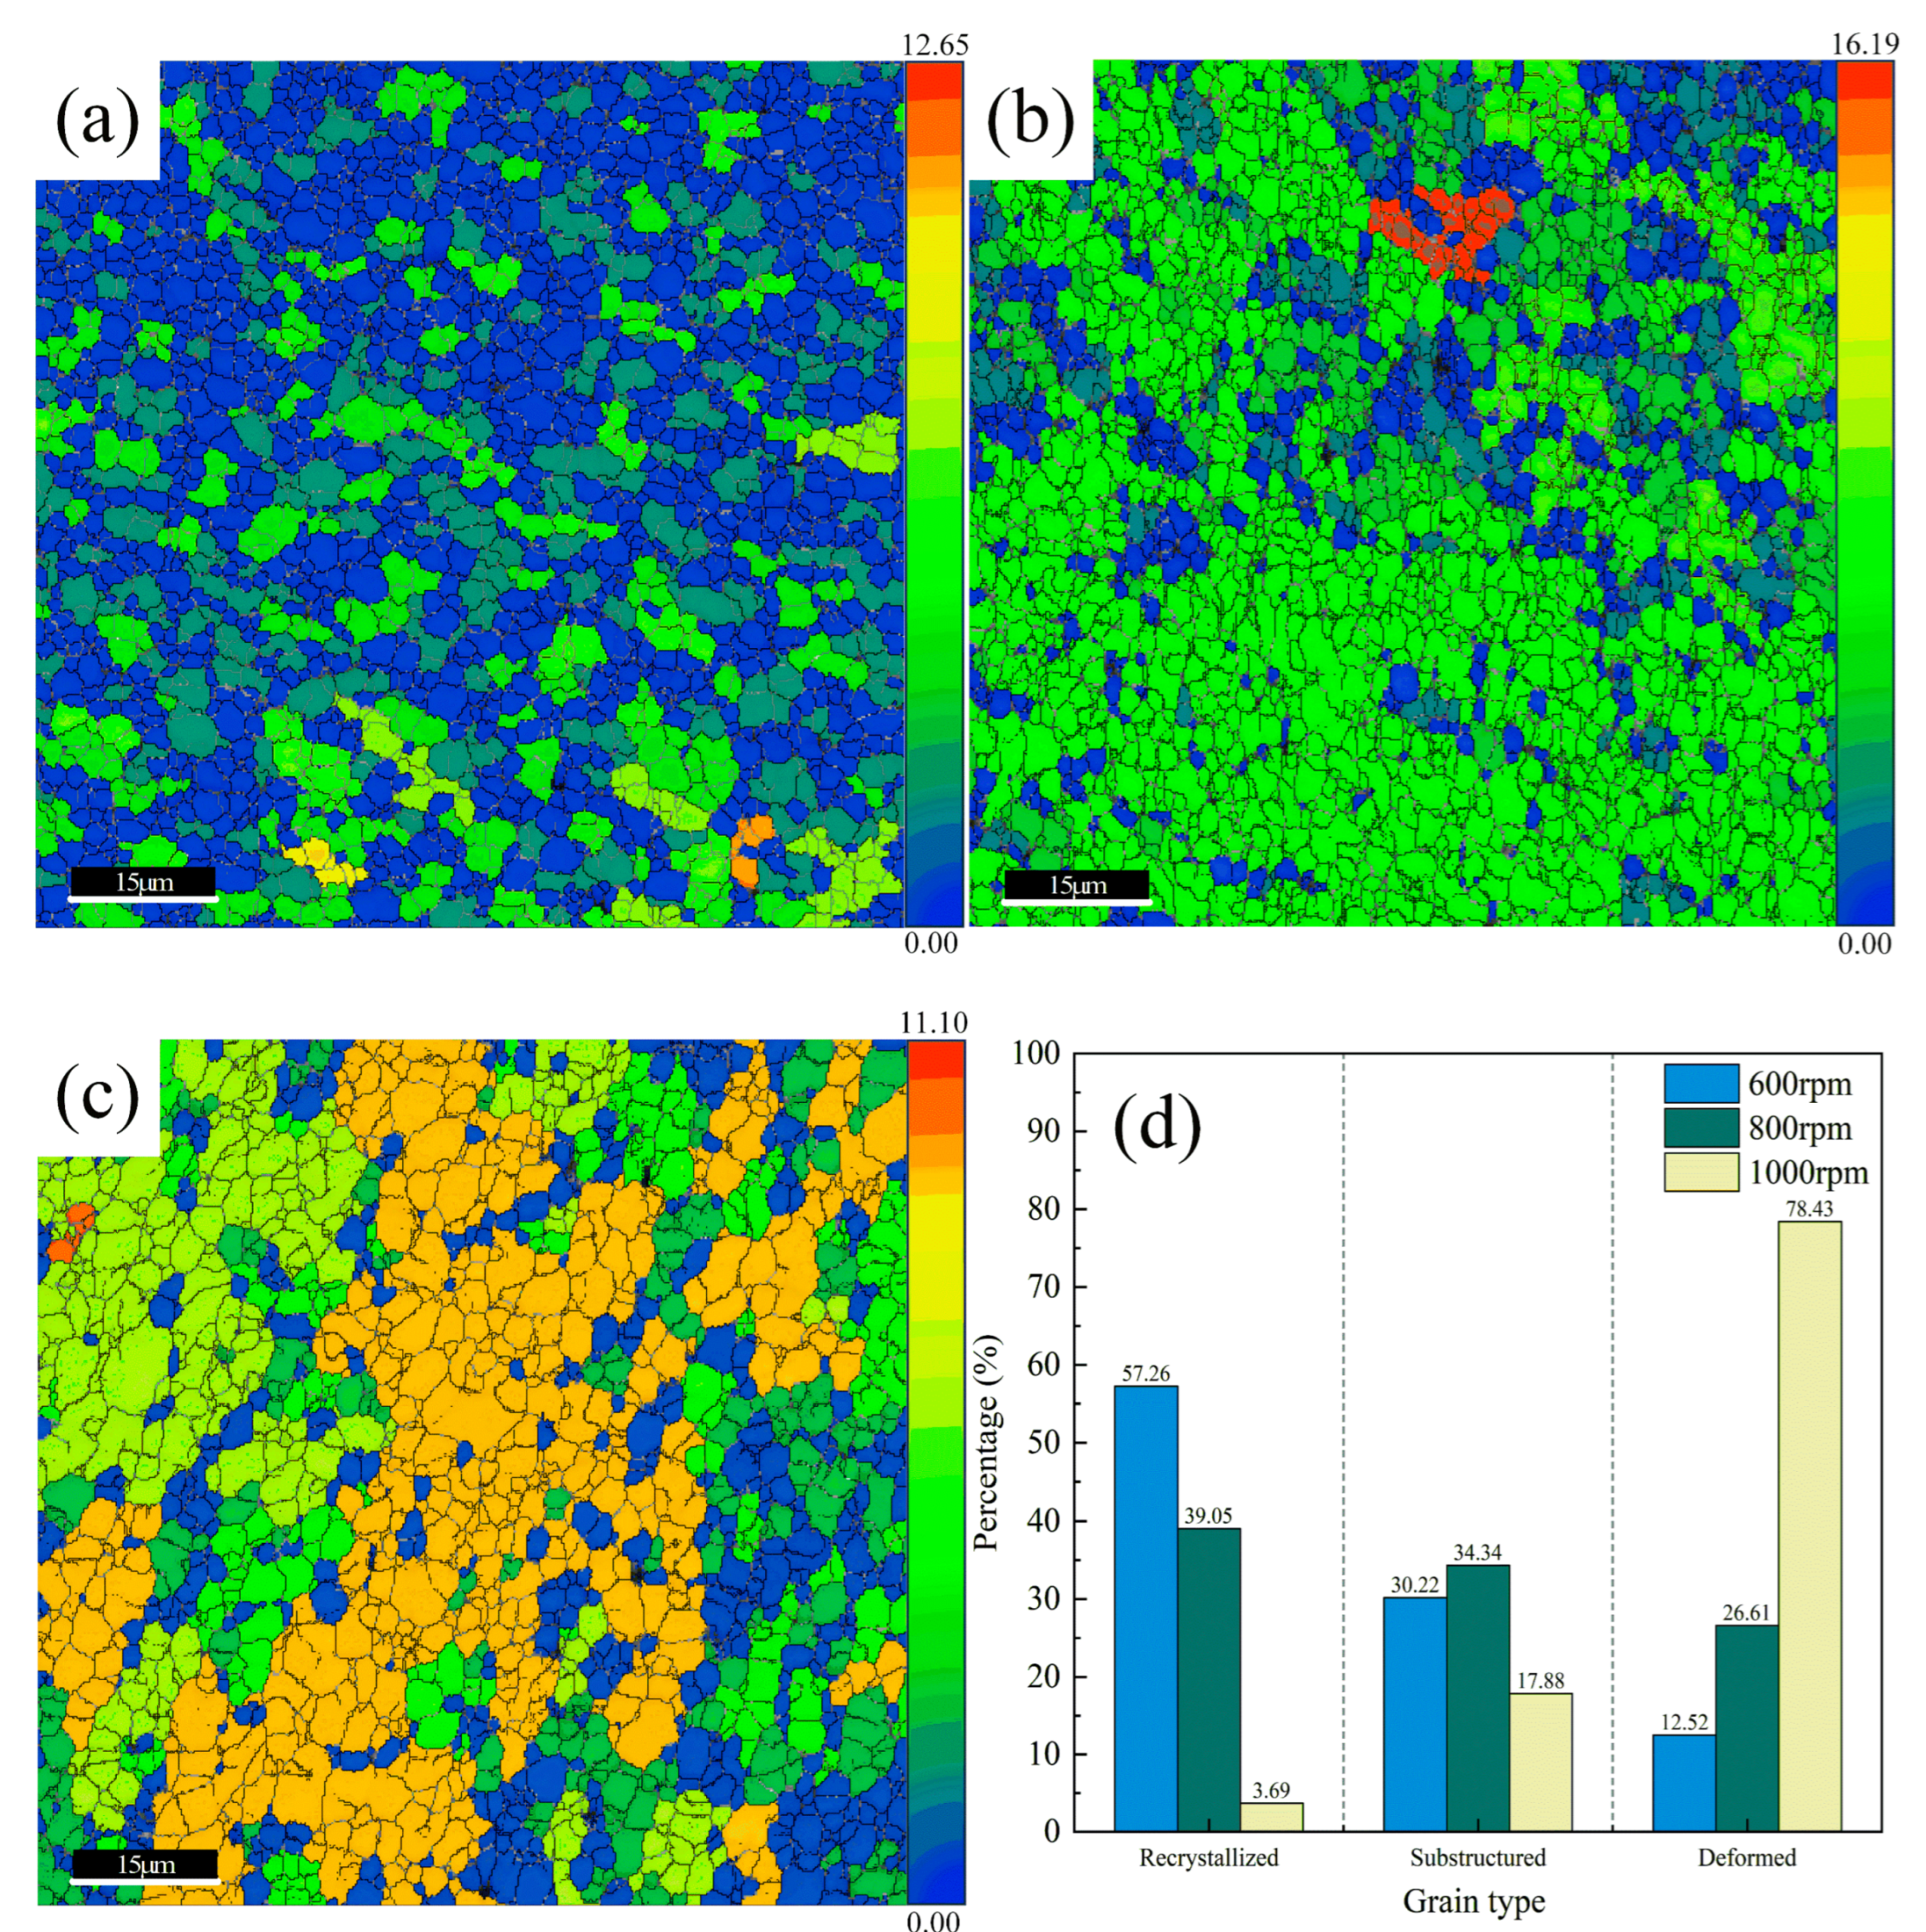
According to the above analysis, continuous dynamic recrystallisation was generated within the material during the AFSD process, as shown in Figure 14d, and the percentages of recrystallised grains in AFSD samples under NO.1, NO.2, and NO.3 parameter conditions were 57.26%, 39.05%, and 3.69%, respectively. Plastic deformation and dynamic restitution occur concurrently throughout continuous dynamic recrystallisation, leading to the gradual accumulation, disappearance, and reappearance of dislocations. A substructural grain size experiences a significant increase during the restitution phase, approaching the recrystallisation temperature. Figure 14a–c show that substructural grains are generated during the AFSD process with 30.22%, 34.34%, and 17.88%, respectively, and the substructural grains have significant internal stresses and localised orientations. The proportion of substructural grains is consistent with the results found in Figure 13, where most substructural grains under the NO.2 parameter condition lead to a sizeable local orientation difference. It is also worth noting that deformed grains appear in Figure 14a–c, with percentages of 12.52%, 26.61%, and 78.43%, respectively. This phenomenon is inconsistent with the almost-no-deformed-grains phenomenon described by Chen et al. [52] for 6061 aluminium alloy during the AFSD process. The likely explanation for this is the significantly larger bar size used in this study, resulting in an elevated heat input, higher heating temperature, and prolonged holding time. Consequently, grain growth and deformation occur through grain swallowing. Particularly pronounced grain growth is observed at 1000 rpm, further indicating the secondary deformation of grains due to rotary stirring.

Figure 14.
Grain orientation spread: (a) NO.1, (b) NO.2, (c) NO.3, (d) Percentage of different grain types. Notes: Grain orientation extensions less than 2° are considered recrystallised grains, extensions of 2–5° are considered substructured grains, and extensions greater than 5° are considered deformed grains [53,54].
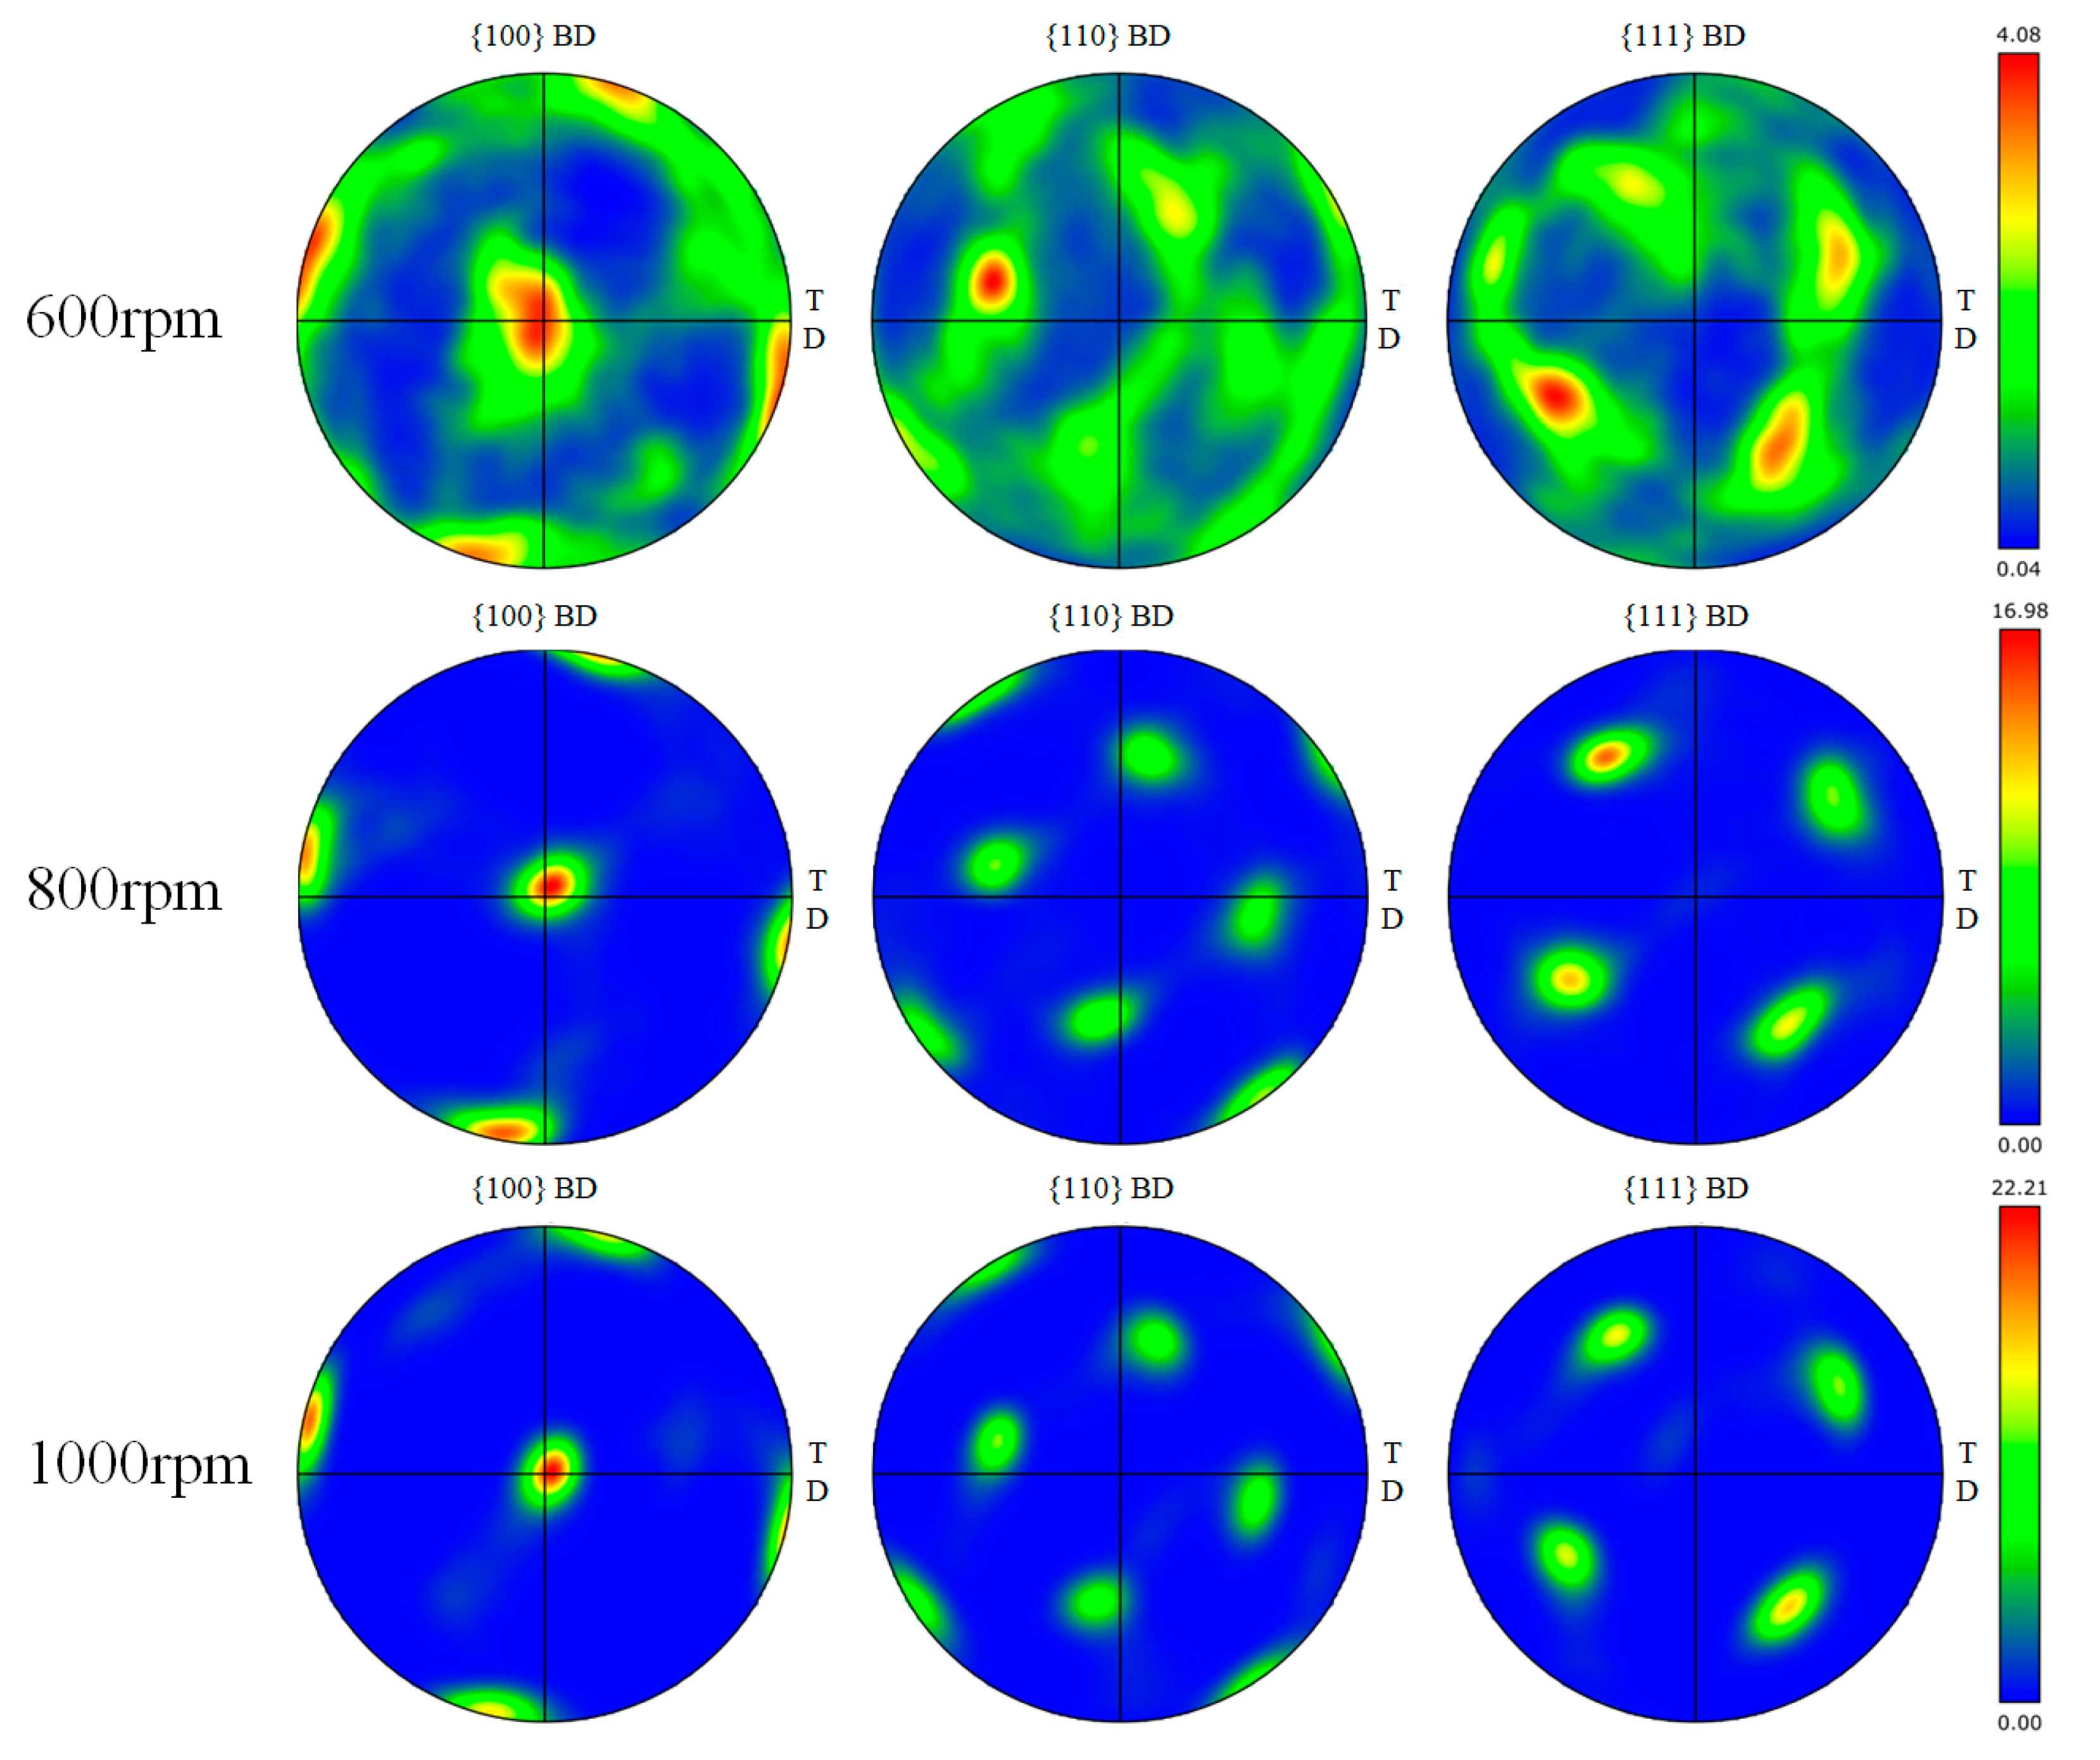
The optimal orientation of grains in polycrystalline materials is known as texture, which results in the appearance of certain anisotropies in the material, and the strengthening of the fabric results in a change in the strength of the material [53]. Figure 15 shows the polar plots of the <100>, <110>, and <111> planes in the LD direction of the AFSD samples for the NO.1, NO.2, and NO.3 parameter conditions, and it can be found that the texture distributions are in good agreement under different rotational speed conditions. At low rotational speeds, the texture distribution was more homogeneous, which may be due to the dynamic recrystallisation that took place. As the rotational speed increases, there is a discernible trend towards an enhanced texture strength, particularly evident at 1000 rpm, where the texture strength peaks at 22.21. The material demonstrates significant textural orientation at this rotational speed due to plastic deformation and solid solution strengthening. The textile strength exhibits a positive correlation with the rotational speed, with an increase in the rotational speed resulting in the production of numerous deformed grains, thereby augmenting the textile strength. Consequently, the disparity in the textile strength between different rotational speeds becomes pronounced. However, quantifying the enhancement in material strength properties is challenging.
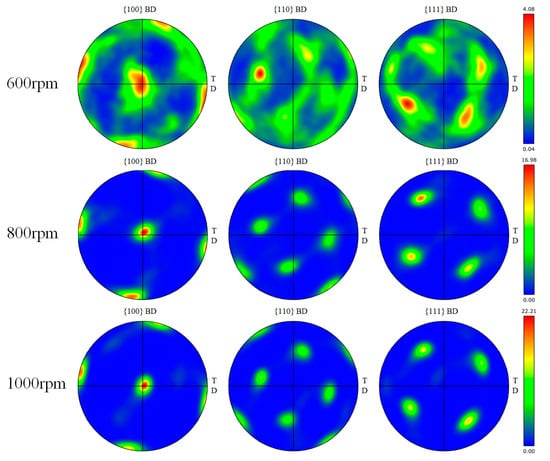
Figure 15.
NO.1, NO.2, and NO.3 polar diagrams.
3.4. Mechanical Property
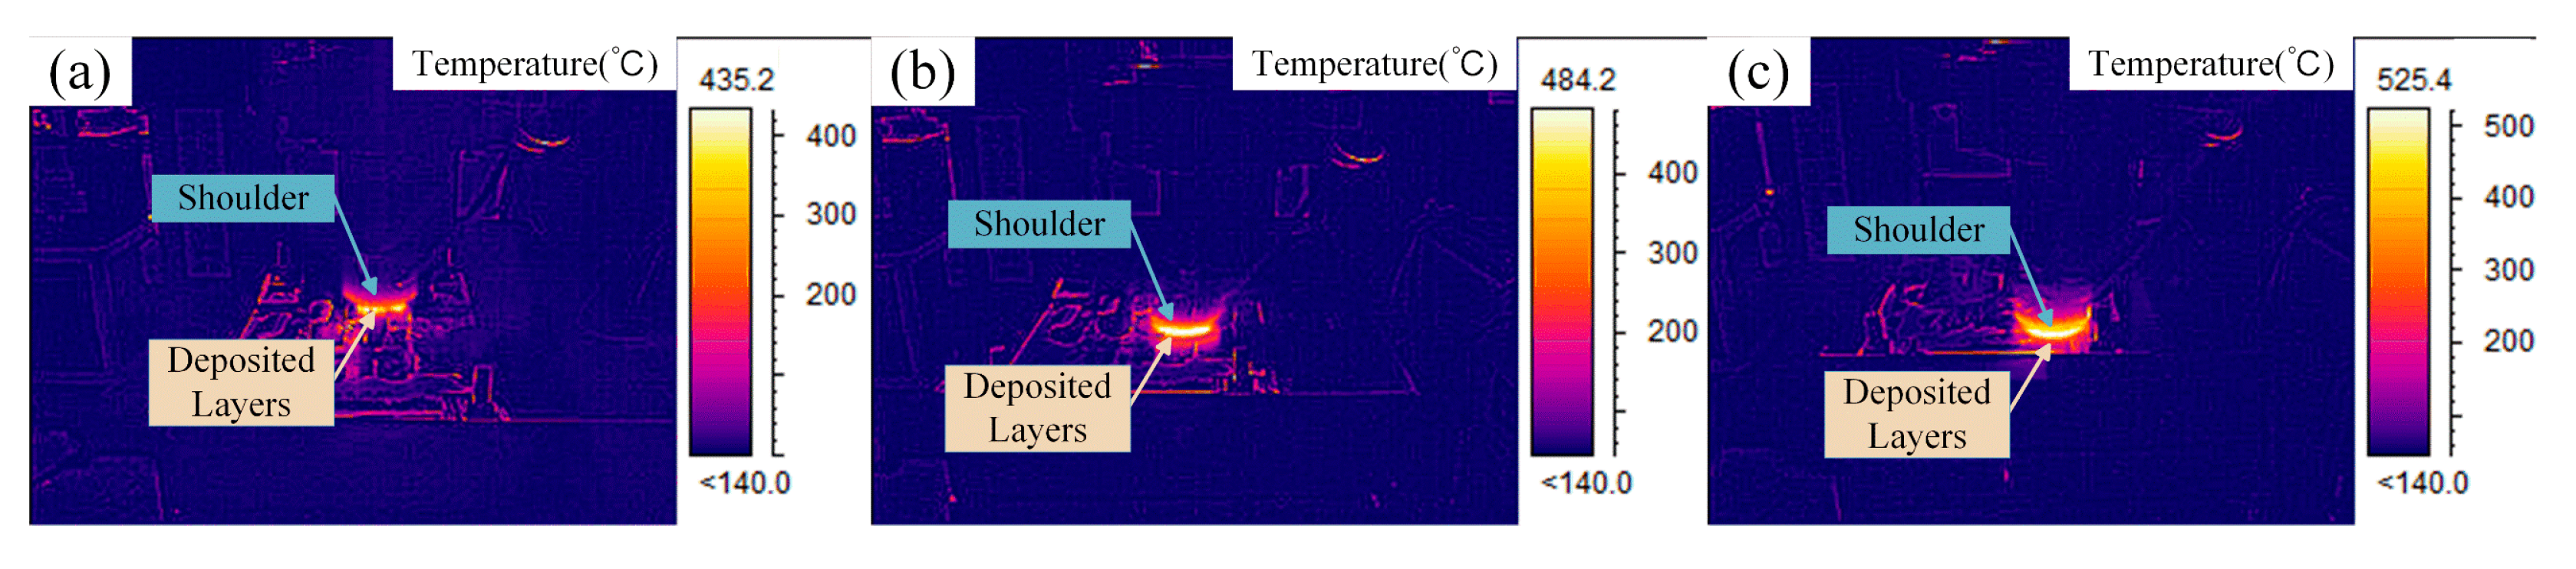
In the AFSD process, the primary source of heat input is frictional heat, which exhibits a positive correlation with the rotational speed, assuming a constant downforce and traverse velocity. The maximum temperature of the single deposited layer at different rotational speeds was measured using a thermal imaging camera, as shown in Figure 16, and the maximum temperature of the heat input was 435.2 °C, 484.2 °C, and 525.4 °C for the parameter conditions of NO.1, NO.2, and NO.3, respectively.
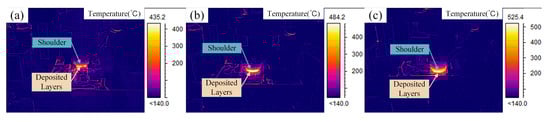
Figure 16.
Thermal imaging camera photographs taken during AFSD: (a) NO.1, (b) NO.2, (c) NO.3.
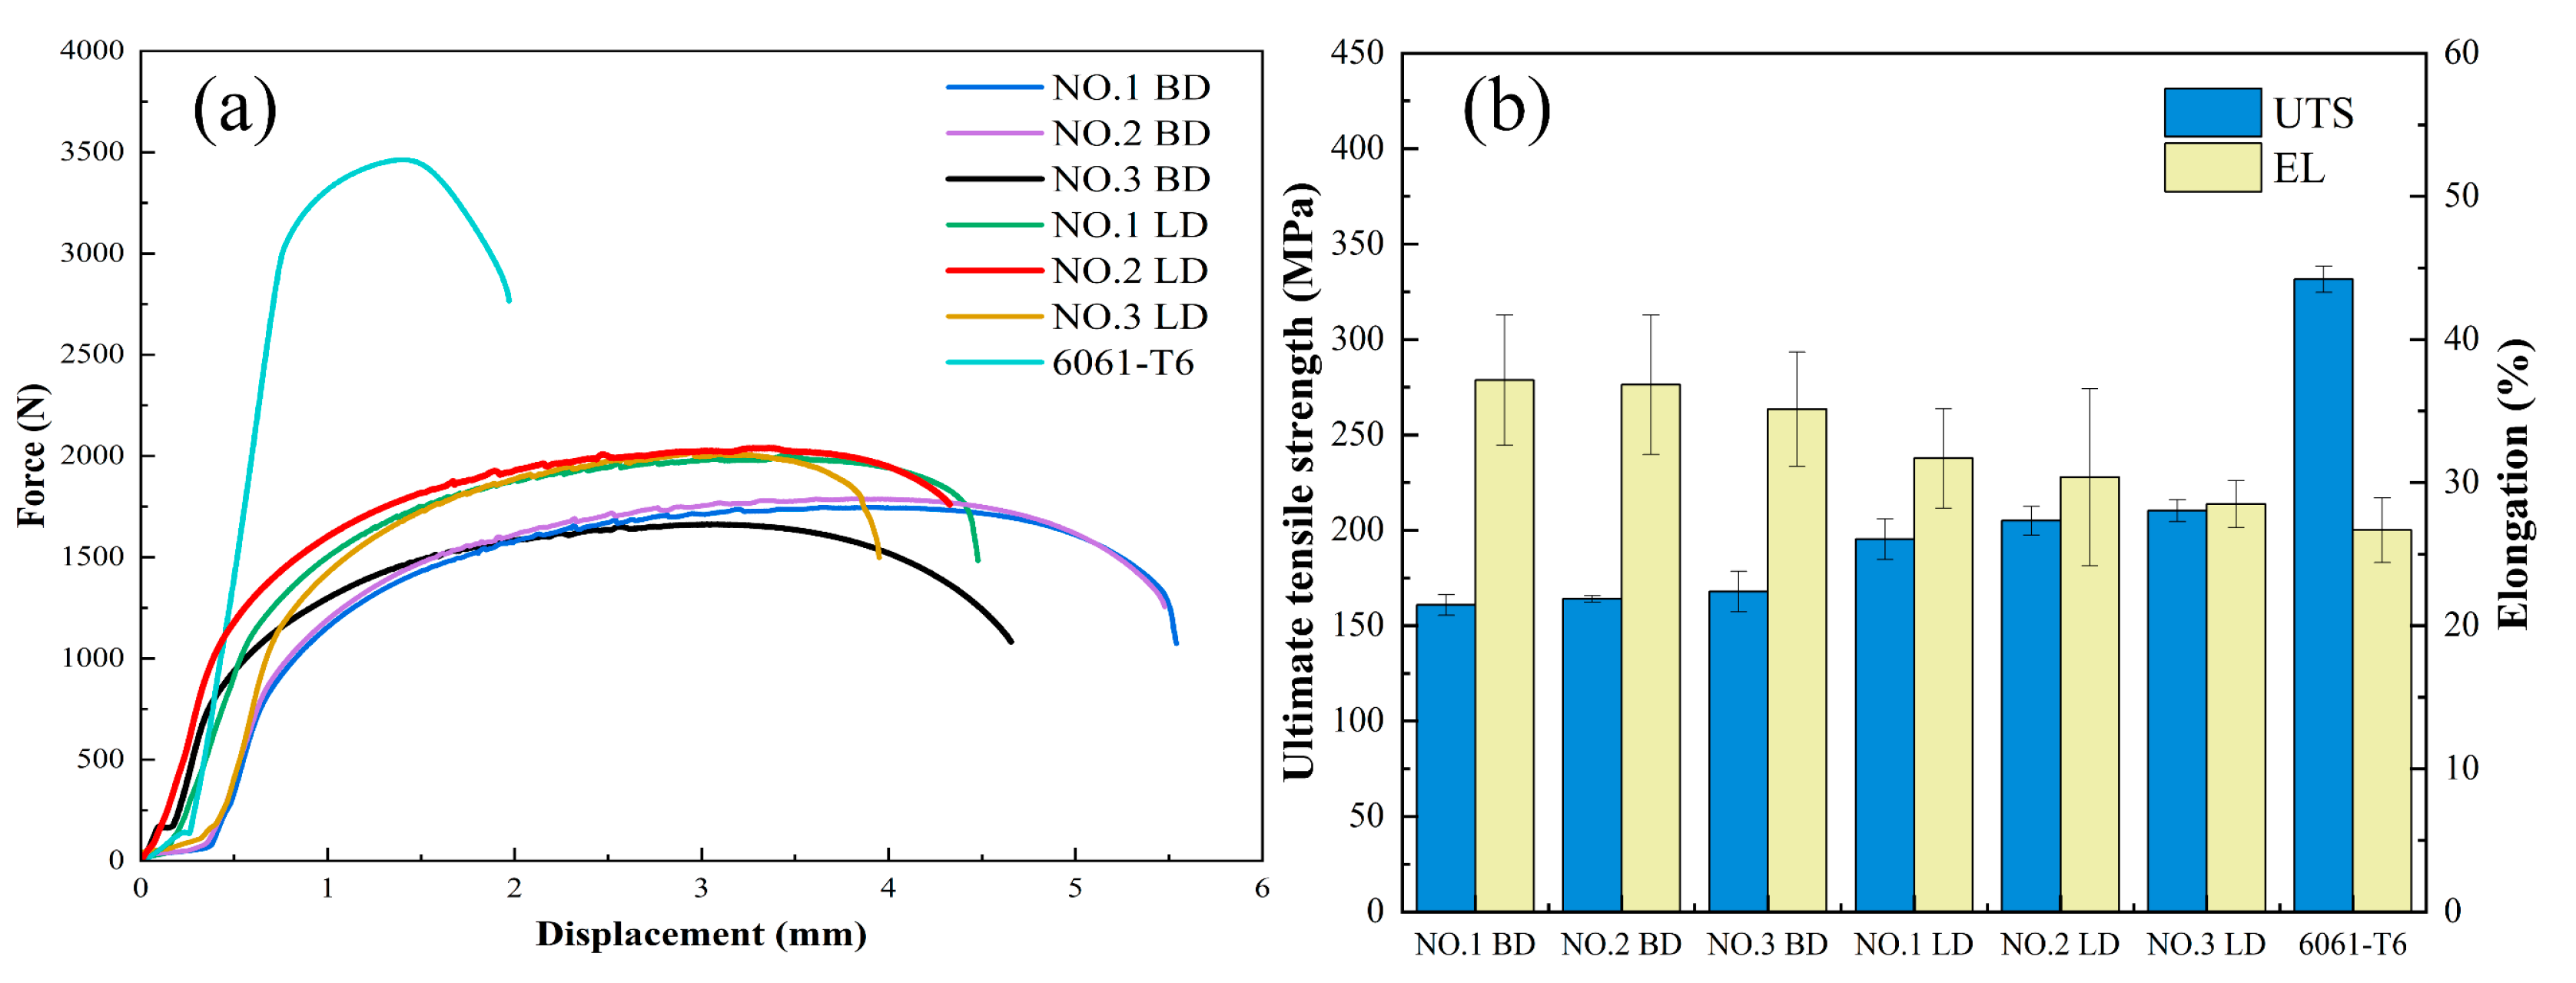
Figure 17a shows the tensile force curves of AFSD specimens in the LD direction and BD direction under different rotational speed conditions. In general, the tensile force in the LD direction will be higher than that in the BD direction, and the tensile elongation in the BD direction will be higher than that in the LD direction. The maximum tensile forces of the AFSD specimens at 600 rpm, 800 rpm, and 1000 rpm in the LD direction were 2169 N, 2021 N, and 2008 N, respectively, and the displacement lengths were 4.55 mm, 4.48 mm, and 3.95 mm, respectively. As shown in Figure 14 and Figure 16, the material recrystallised to a higher degree at 600 rpm, resulting in stronger bonding between grains and enhanced plasticity. In contrast, the rotational speed exerts a minimal influence on the maximum tensile force for the BD direction, with the curves for the 600 rpm and 800 rpm conditions nearly overlapping. The reduced displacement at 1000 rpm can be attributed to grain coarsening and secondary deformation, consequently diminishing plasticity.
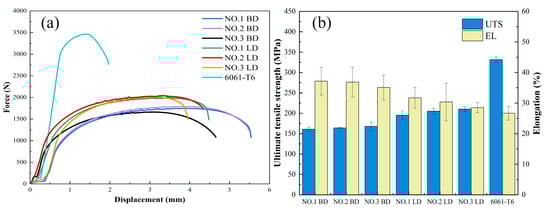
Figure 17.
AFSD tensile results: (a) Comparison of tensile curves; (b) Comparison of UTS and elongation.
Figure 17b depicts the UTS and elongation in the BD and LD directions for different rotational speed conditions. In the BD direction, the UTS of NO.1, NO.2, and NO.3 are 161 MPa, 164 MPa, and 167 MPa, respectively. In the LD direction, the UTS of NO.1, NO.2, and NO.3 are 197 MPa, 206 MPa, and 211 MPa, respectively, which shows that the UTS increases with the increase in rotational speed and the elongation is negatively correlated with the rotational speed. Based on the preceding analysis, the UTS strength may be associated with strengthening phases, such as precipitated Mn elements and fabrication strengthening, as observed in Figure 15. Smaller grain sizes of the material tend to enhance plastic properties, ultimately resulting in higher elongation. Sample NO.3 demonstrates the highest UTS and the lowest elongation in both the BD and LD directions, indicating a strong interlayer bonding capability at high rotational speeds. However, excessive heat input leads to grain growth and diminished plasticising ability. In summary, the deposited layer exhibits high UTS in the LD direction and high plasticising ability in the BD direction.
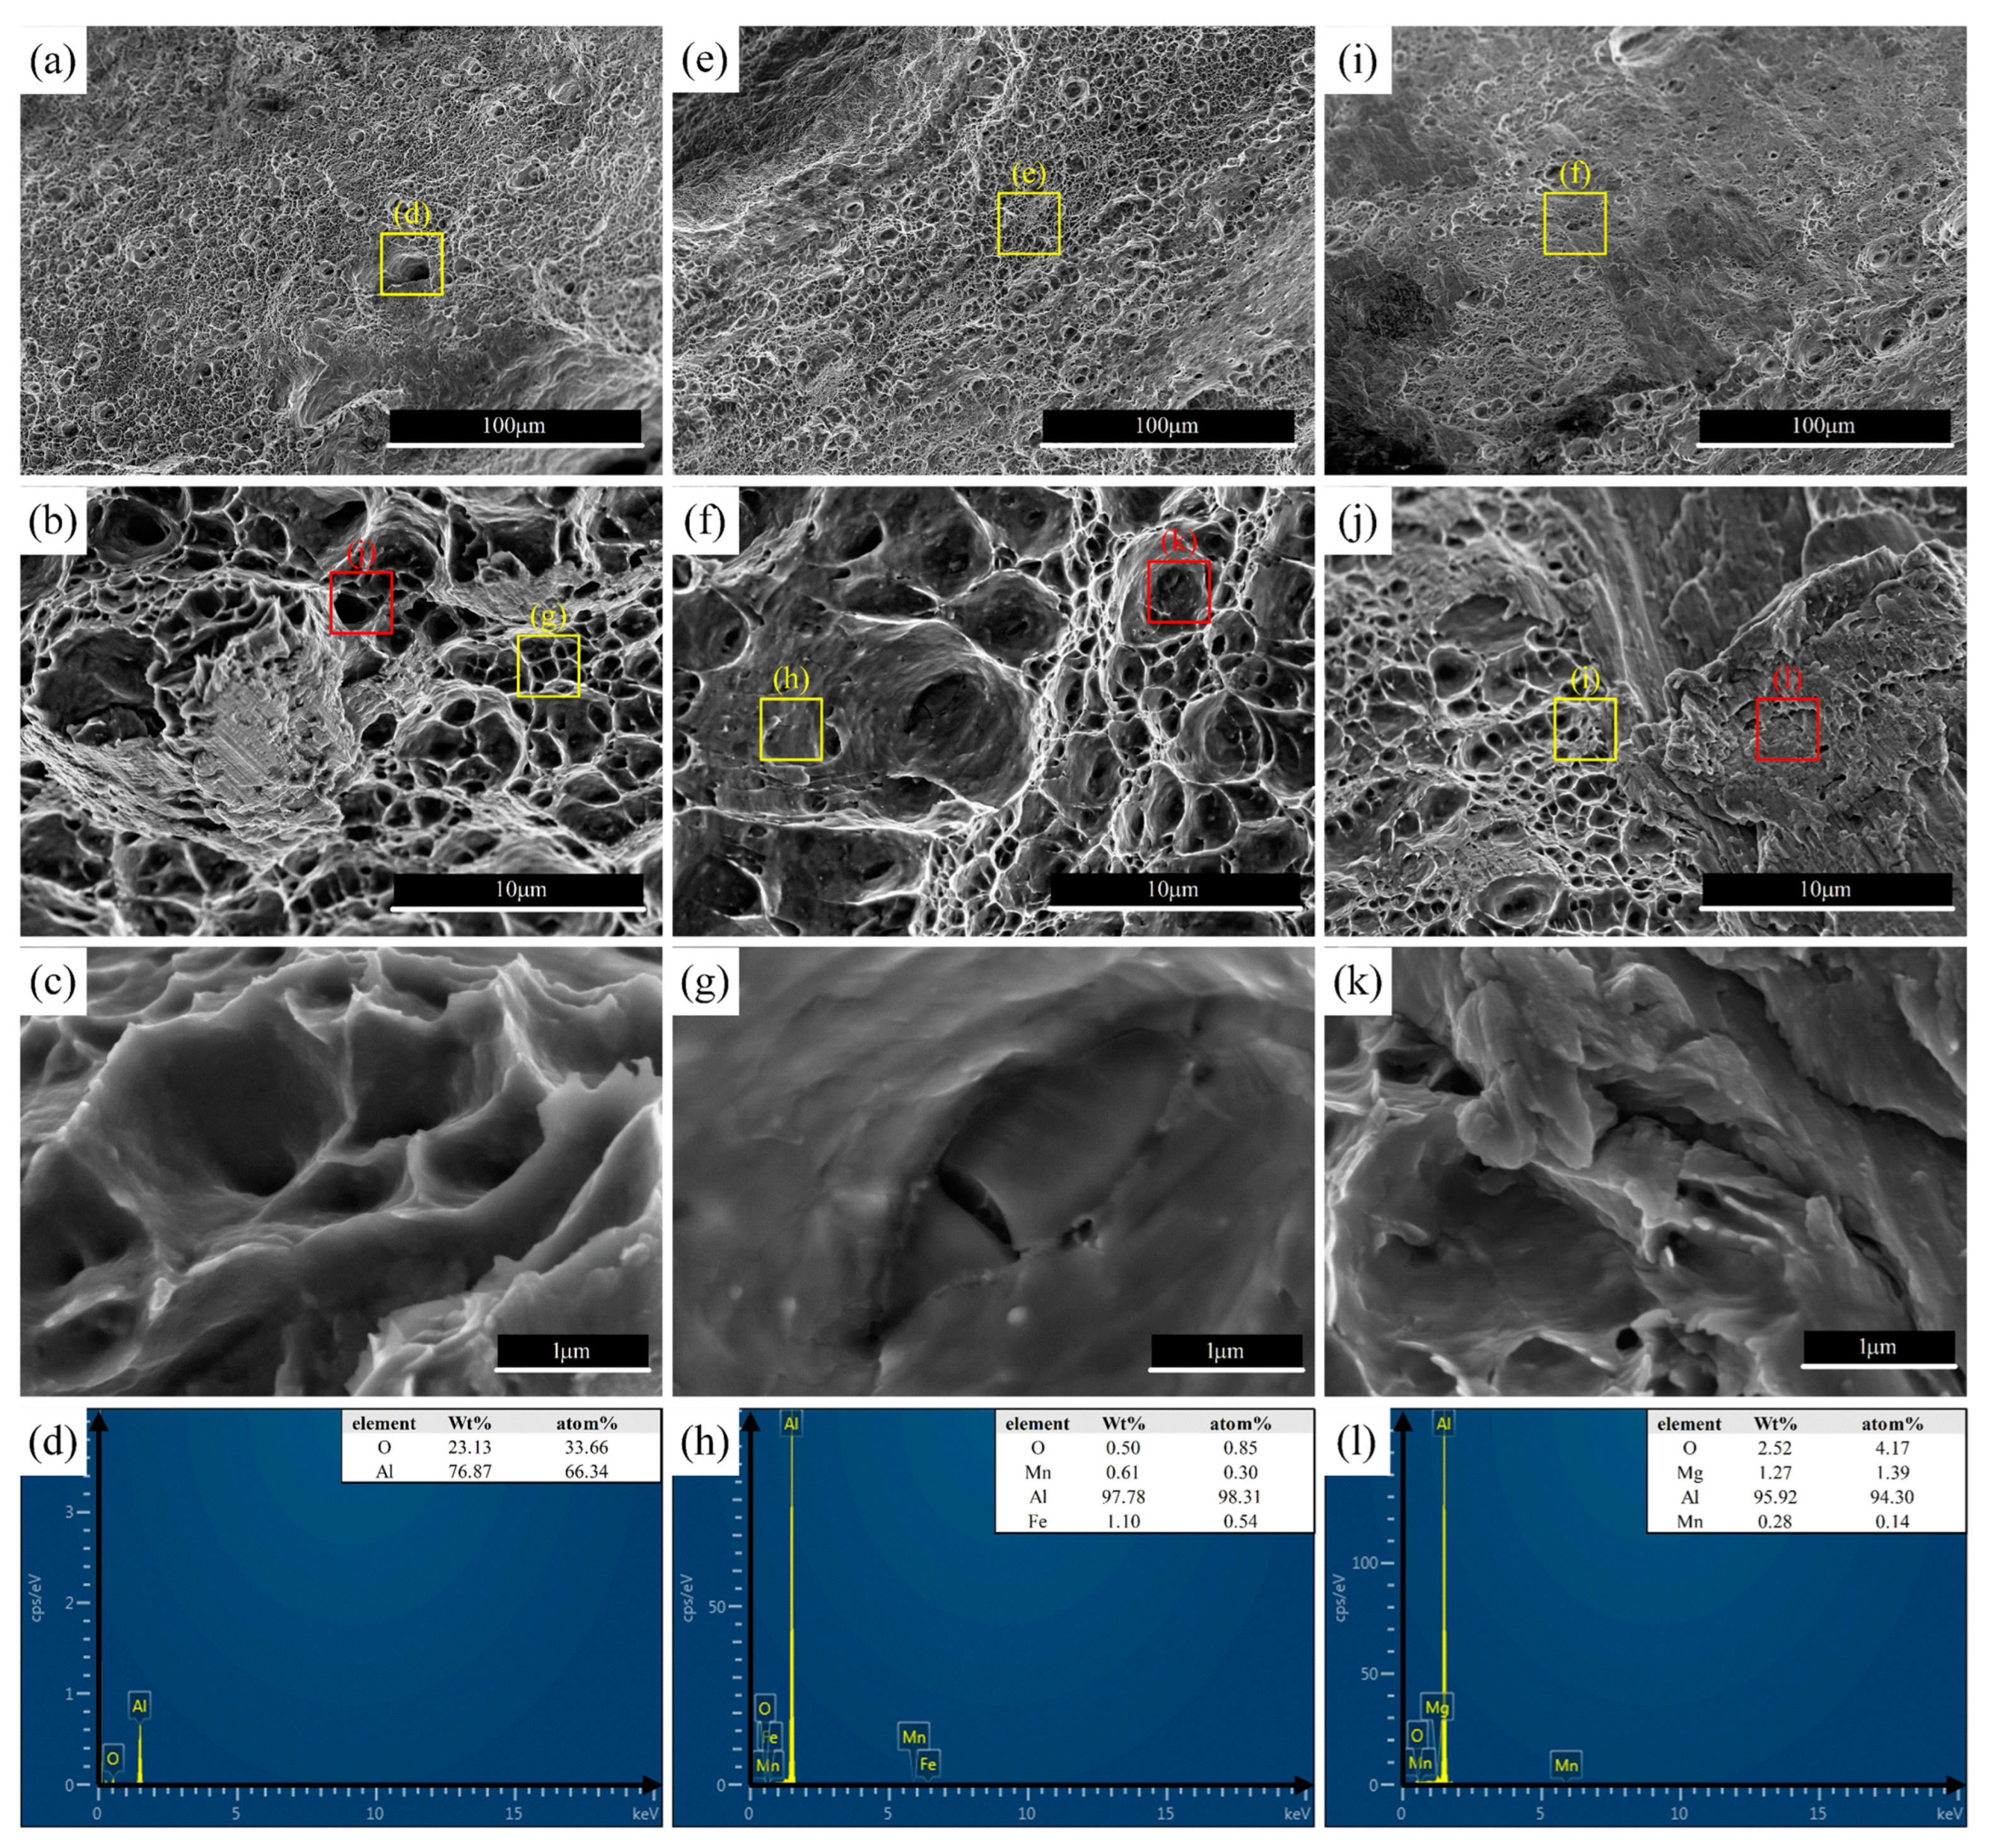
The LD direction tensile fracture morphology was analysed for AFSD samples with NO.1, NO.2, and NO.3 parametric conditions. The fully metallurgically bonded tensile specimen, as shown in Figure 18, exhibits ductile fracture characteristics. Figure 18a–c shows the surface morphology of transverse tensile fracture at different magnification conditions under the NO.1 parameter. Similarly, Figure 18e–g and Figure 18i–k show the surface morphology of transverse tensile fracture at different magnification conditions under NO.2 and NO.3 conditions, respectively. Figure 18d,h,l show the compositional analysis of the tough nests in the tensile fracture at different rotational speeds. From the surface morphology of the tensile fracture, it can be found that there are relatively uniform toughness holes in Figure 18a,e. Figure 18b,f found that the occurrence of tough holes is more obvious. The tough holes’ size and degree of uniformity are highly correlated with the plasticity of the material. In Figure 18b,c, small and deep tough holes are found at the fracture; the larger and deeper the tough holes, the greater the second phase, and the better the plastic deformation ability of the material. According to Chen et al. [52], this formation of tough holes is likely to result from strong bonding between the materials to produce plastic tensile deformation, which indicates that the material has good elongation, as shown in Figure 17a. Meanwhile, in Figure 18d, the compositional analysis for the tough holes only found Al and O elements, which may be due to the small heat input at 600 rpm; the solid solution phases inside the material have not been precipitated yet, along with the pinning phenomenon inside the crystals. In Figure 18h, the presence of elemental precipitates such as Fe and Mn at the tough holes is shown, and such residues were identified as second-phase debris particles, which suggests that the heat input at 800 rpm can produce a large number of reinforcing phases. In Figure 18j, it can be seen that there is a high density of tear ridges and a small number of secondary crack shapes at the fracture, which is considered to be characteristic of mechanical sliding, which seriously affects the plastic properties of the material. These edges are more lined up randomly and more pronounced in Figure 18k. Combined with the compositional analysis at the tough nest in Figure 18l, it can be hypothesised that the material is embrittled at 1000 rpm due to an excessive heat input, resulting in an edged fracture, which is one of the reasons for the low plasticity of the material in Figure 17b.
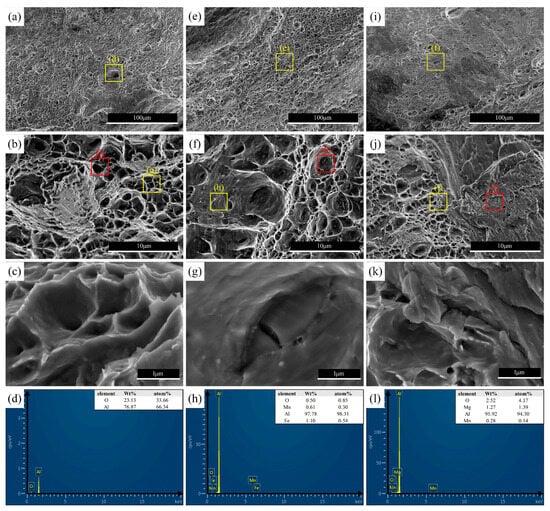
Figure 18.
SEM tensile fracture morphology and EDS point scan: NO.1 (a–d), NO.2 (e–h), NO.3 (i–l).
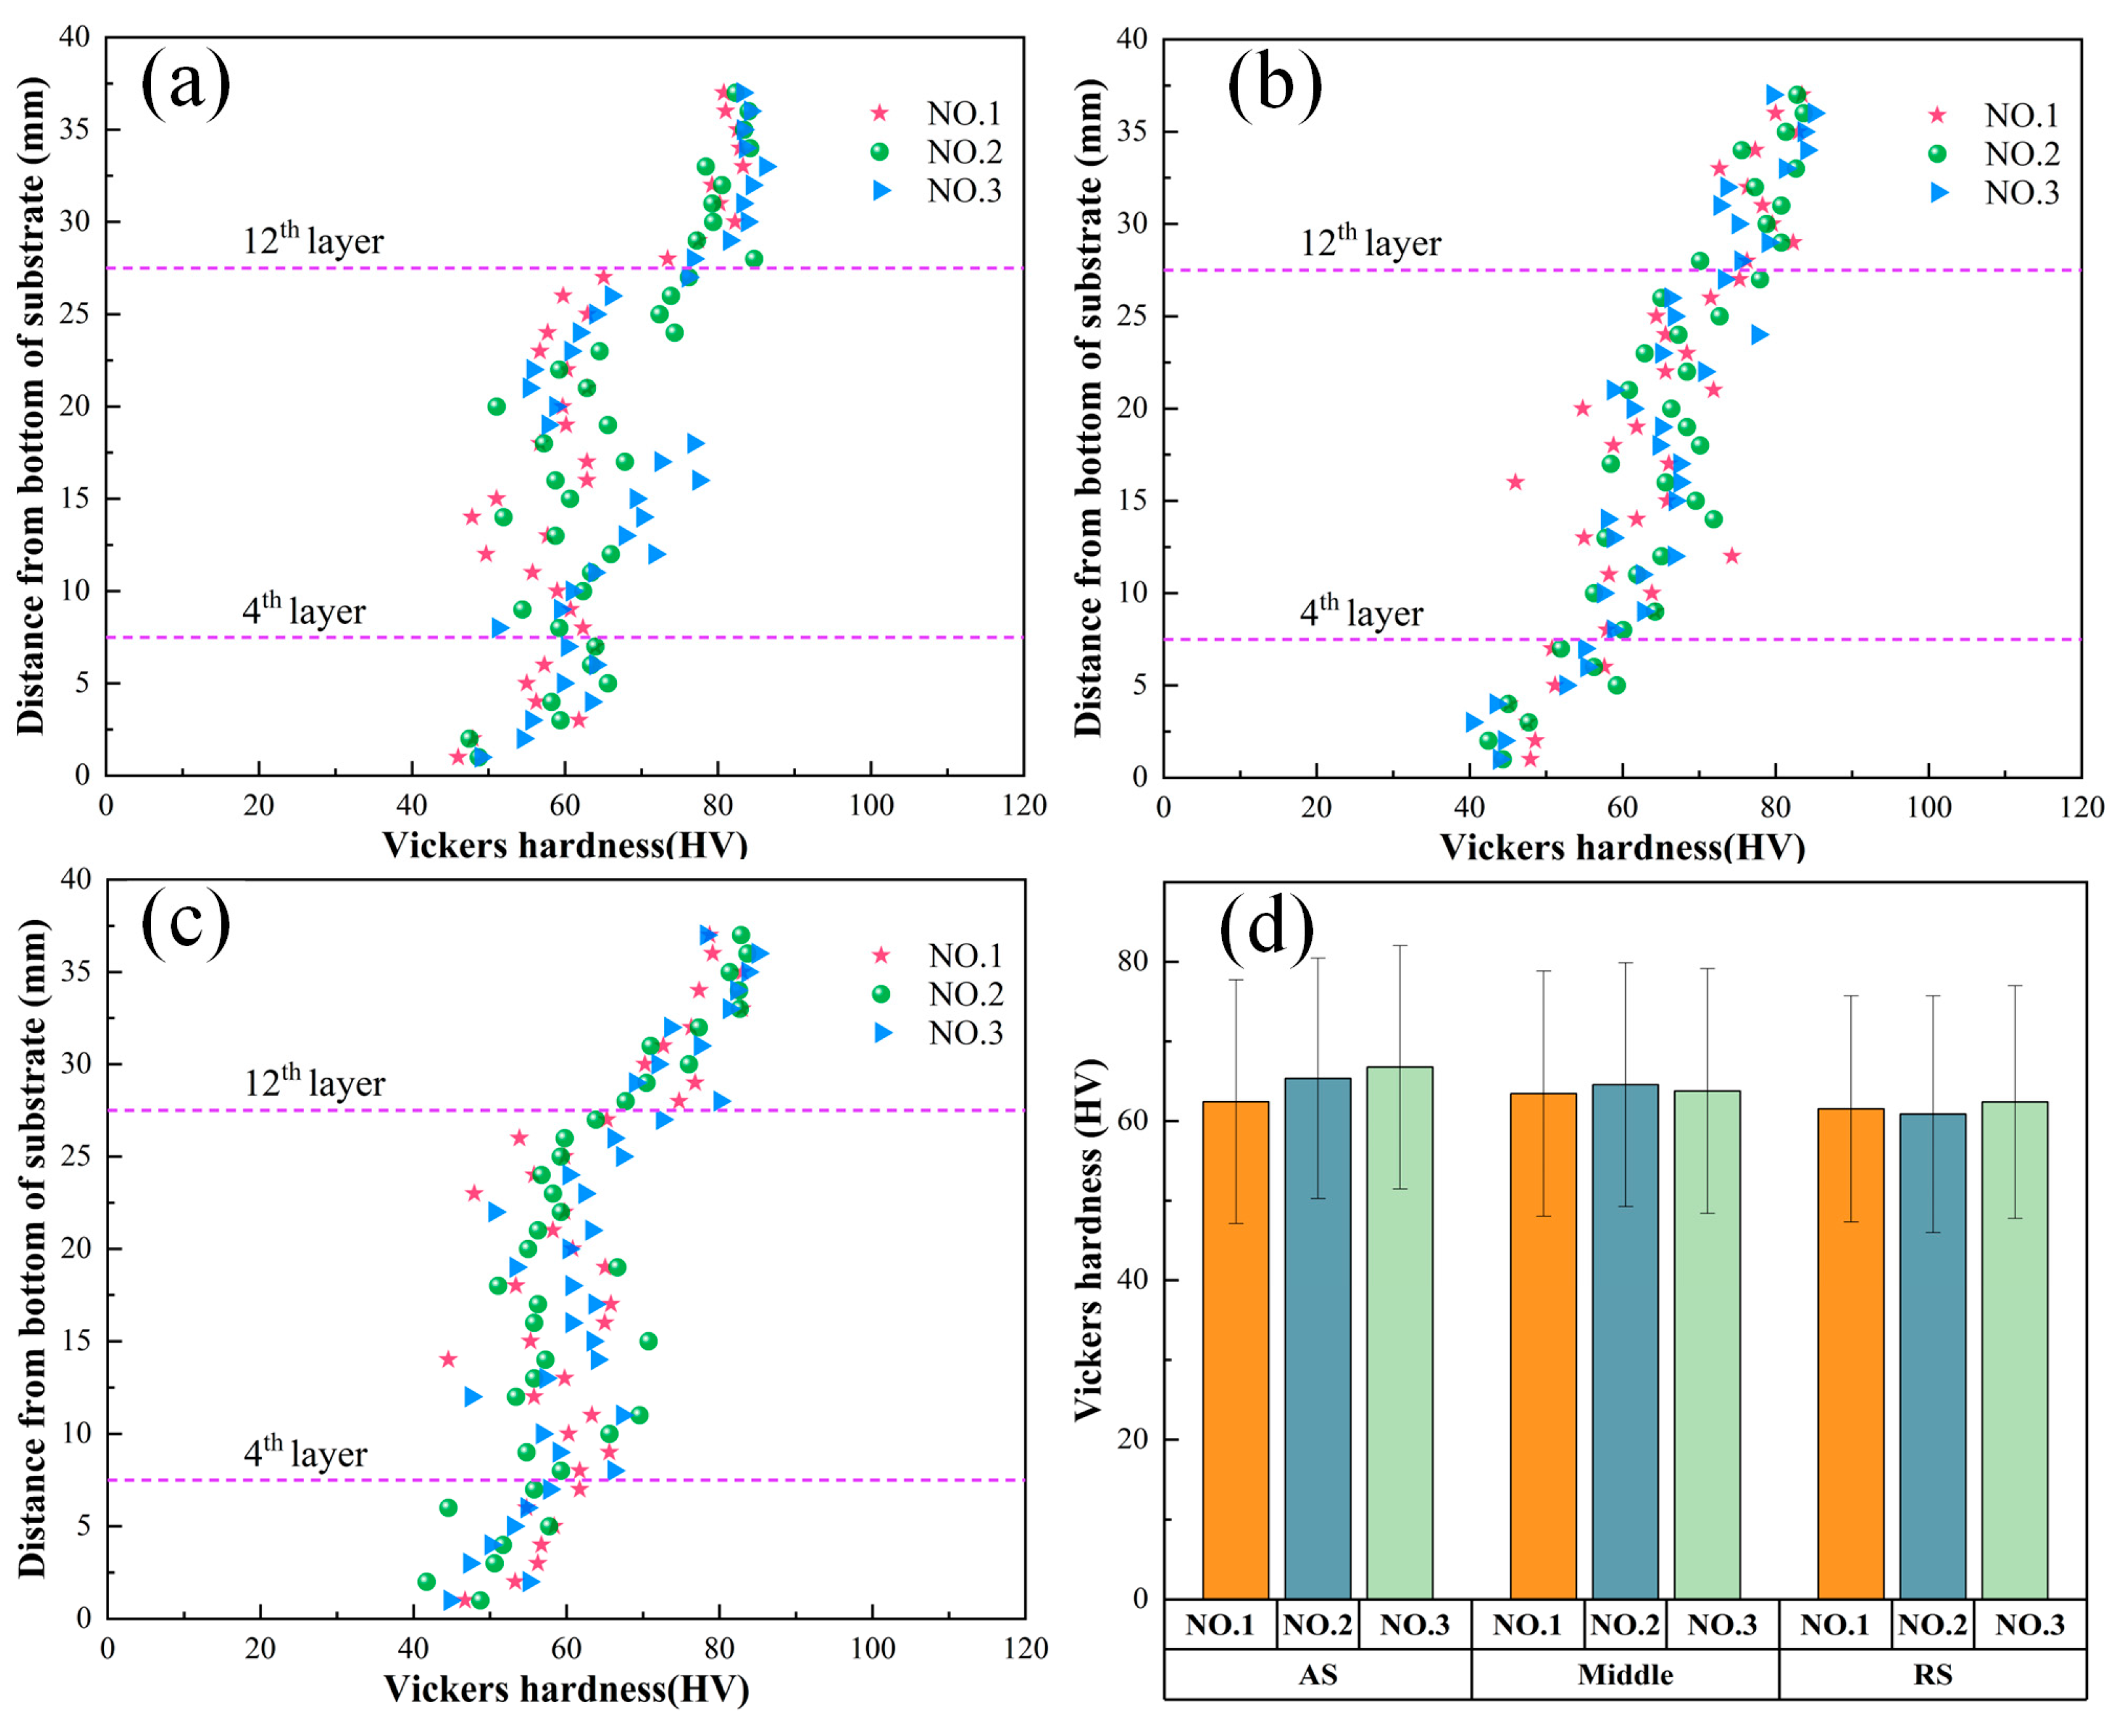
The microhardness distributions and statistical results of the 15-layer specimens under the parametric conditions of NO.1, NO.2, and NO.3 are shown in Figure 19, and the test section was selected as the B-B section of Figure 3b. The hardness test values generally decrease from top to bottom, with a Z-shaped distribution, as shown in Figure 19a–c. The hardness variation is higher in additive layers of 12 and more layers. This phenomenon arises due to the significant role played by the number of thermal cycles in the newly deposited layers, leading to a more significant disparity in hardness. In contrast, there is a minimal difference in the hardness change between 4 and 12 layers, indicating that the material exhibits less sensitivity to hardness with a certain number of thermal cycles. However, between the four layers and the substrate, a significant decrease in hardness is observed. This is primarily attributed to the lower layer’s contact with the substrate, experiencing repeated heat accumulation and dissipation, resulting in a notable reduction in material hardness due to thermal cycling. In Figure 19d, it can be seen that the hardness in the middle does not vary much under different parametric conditions, and NO.1, NO.2, and NO.3 can reach 58.4%, 58.5%, and 55.2% of the hardness of the parent material (113.1 HV [49]) at the middle, respectively. The hardness of NO.3 is higher at AS and RS, reaching 59.8% and 56.6% of the base material, respectively, which may be due to the combined effect of the increased precipitation of Mn elemental compounds, as shown in Figure 11, the deformed grains with an orientation distribution, as shown in Figure 14, and the texture enhancement, as shown in Figure 15. The hardness averages at AS and RS of NO.1 are 55.7% and 55.8% of that of the base material, respectively. The average hardness values at AS and RS for NO.2 are 58.5% and 55.2% of the parent material, respectively.
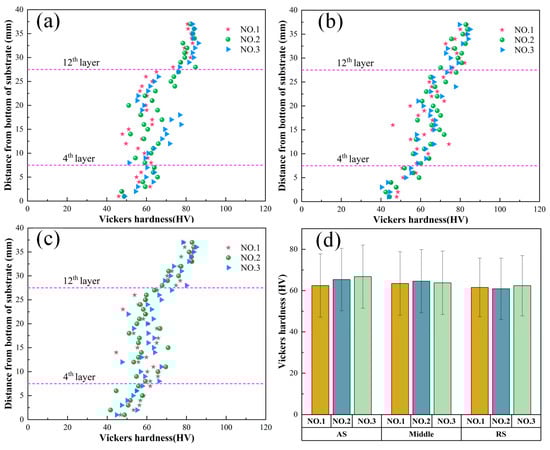
Figure 19.
Microhardness distributions of NO.1, NO.2, and NO.3 multilayer additive sections: (a) AS, (b) Middle, (c) RS, (d) Average of BD orientation.
4. Discussion
- When employing AFSD at NO.3 with 6061 aluminium alloy bars measuring 28 mm × 28 mm, the surface roughness measures 101.35 μm. With an increase in rotational speed for multilayer additive materials, there is an escalation in the outward flow of material at the edges. This intensifies the non-uniformity of material flow, consequently resulting in weak bonding between layers and the emergence of holes.
- The solid solution strengthening of the deposited layer by the precipitation of Mg2Si, etc. exists in AFSD at different rotational speeds. As the rotational speed rises, it prompts the solid solution of Mg elements to return to the matrix and augments the proportion of precipitated Mn elements. These Mn elemental precipitates serve to enhance the material’s tensile strength properties. Additionally, the size of the precipitated phase increases with the escalation of the rotational speed.
- The primary crystallisation mechanism in the AFSD process is continuous dynamic recrystallisation. Elevated rotational speeds facilitate grain growth while also intensifying the transition from low-angle grain boundaries (LAGB) to high-angle grain boundaries (HAGB). Moreover, higher rotational speeds induce the secondary deformation of the recrystallised grains and augment the proportion of deformed grains.
- The UTS of the deposited layer during AFSD is positively correlated with the rotational speed. Conversely, the elongation of the deposited layer via AFSD exhibits a negative correlation with the rotational speed. An analysis of fracture morphology reveals that ductile fracture is the primary fracture mechanism, as indicated by the presence of holes. Additionally, the hardness of the material exhibits a decreasing trend from top to bottom, with the number of thermal cycles emerging as the primary factor affecting hardness.
Author Contributions
Conceptualisation, X.Z. and R.W.; methodology, X.Z.; software, X.Z.; validation, L.W. and M.L.; formal analysis, X.Z.; investigation, R.W.; resources, S.L.; data curation, S.L.; writing—original draft preparation, X.Z.; writing—review and editing, X.Z.; visualisation, R.W.; supervision, R.W.; project administration, L.W.; funding acquisition, L.W. All authors have read and agreed to the published version of the manuscript.
Funding
This research was funded by the National Key Research and Development Program of China (NO.2023YFB3300081) and the Equipment Pre-research Key Laboratory Foundation of China (NO.61420052022KJW02).
Data Availability Statement
The original contributions presented in the study are included in the article, further inquiries can be directed to the corresponding author/s.
Conflicts of Interest
The authors declare no conflicts of interest.
References
- Frazier, W.E. Metal Additive Manufacturing: A Review. J. Mater. Eng. Perform. 2014, 23, 1917–1928. [Google Scholar] [CrossRef]
- Bandyopadhyay, A.; Heer, B. Additive manufacturing of multi-material structures. Mater. Sci. Eng. R Rep. 2018, 129, 1–16. [Google Scholar] [CrossRef]
- Sefene, E.M.; Hailu, Y.M.; Tsegaw, A.A. Metal hybrid additive manufacturing: State-of-the-Art. Prog. Addit. Manuf. 2022, 7, 737–749. [Google Scholar] [CrossRef]
- Kanishka, K.; Acherjee, B. A systematic review of additive manufacturing-based remanufacturing techniques for component repair and restoration br. J. Manuf. Process. 2023, 89, 220–283. [Google Scholar] [CrossRef]
- Li, H.Z.; Wang, C.M.; Zhang, H.; Zhang, J.J.; He, P.; Shao, M.H.; Zhu, X.T.; Fu, Y.Q. Research Progress of Friction Stir Additive Manufacturing Technology. Acta Metall. Sin. 2023, 59, 106–124. [Google Scholar] [CrossRef]
- Montero-Sistiaga, M.L.; Mertens, R.; Vrancken, B.; Wang, X.; Van Hooreweder, B.; Kruth, J.-P.; Van Humbeeck, J. Changing the alloy composition of Al7075 for better processability by selective laser melting. J. Mater. Process. Technol. 2016, 238, 437–445. [Google Scholar] [CrossRef]
- Peng, L.M.; Deng, Q.C.; Wu, Y.J.; Fu, P.H.; Liu, Z.Y.; Wu, Q.Y.; Chen, K.; Ding, W.J. Additive Manufacturing of Magnesium Alloys by Selective Laser Melting Technology: A Review. Acta Metall. Sin. 2023, 59, 31–54. [Google Scholar] [CrossRef]
- Kathiresan, M.; Karthikeyan, M.; Immanuel, R.J. A short review on SLM-processed Ti6Al4V composites. Proc. Inst. Mech. Eng. Part E J. Process Mech. Eng. 2023, 01, 16. [Google Scholar] [CrossRef]
- Anand, M.; Das, A.K. Issues in fabrication of 3D components through DMLS Technique: A review. Opt. Laser Technol. 2021, 139, 106914. [Google Scholar] [CrossRef]
- Samantaray, M.; Sahoo, S.; Thatoi, D. Computational modeling of heat transfer and sintering behavior during direct metal laser sintering of AlSi10Mg alloy powder. C. R. Mec. 2018, 346, 1043–1054. [Google Scholar] [CrossRef]
- Fan, Y.X.; Lin, Y.; Ao, Q.B.; Wang, J.Z. Research Progress on Additive Manufactured Ti-6Al-4V Lattice Materials. Rare Met. Mater. Eng. 2023, 52, 3630–3639. [Google Scholar] [CrossRef]
- Körner, C. Additive manufacturing of metallic components by selective electron beam melting—A review. Int. Mater. Rev. 2016, 61, 361–377. [Google Scholar] [CrossRef]
- Blakey-Milner, B.; Gradl, P.; Snedden, G.; Brooks, M.; Pitot, J.; Lopez, E.; Leary, M.; Berto, F.; du Plessis, A. Metal additive manufacturing in aerospace: A review. Mater. Des. 2021, 209, 110008. [Google Scholar] [CrossRef]
- Fang, Z.C.; Wu, Z.L.; Huang, C.G.; Wu, C.W. Review on residual stress in selective laser melting01ditive manufacturing of alloy parts. Opt. Laser Technol. 2020, 129, 106283. [Google Scholar] [CrossRef]
- Moghaddam, A.O.; Shaburova, N.A.; Samodurova, M.N.; Abdollahzadeh, A.; Trofimov, E.A. Additive manufacturing of high entropy alloys: A practical review. J. Mater. Sci. Technol. 2021, 77, 131–162. [Google Scholar] [CrossRef]
- Gottwald, R.B.; Griffiths, R.J.; Petersen, D.T.; Perry, M.E.J.; Yu, H.Z. Solid-State Metal Additive Manufacturing for Structural Repair. Acc. Mater. Res. 2021, 2, 780–792. [Google Scholar] [CrossRef]
- Dong, H.R.; Li, X.Q.; Xu, K.; Zang, Z.Y.; Liu, X.; Zhang, Z.J.; Xiao, W.L.; Li, Y. A Review on Solid-State-Based Additive Friction Stir Deposition. Aerospace 2022, 9, 565. [Google Scholar] [CrossRef]
- Prabhakar, D.A.P.; Shettigar, A.K.; Herbert, M.A.; Patel, G.C.M.; Pimenov, D.Y.; Giasin, K.; Prakash, C. A comprehensive review of friction stir techniques in structural materials and alloys: Challenges and trends. J. Mater. Res. Technol. 2022, 20, 3025–3060. [Google Scholar] [CrossRef]
- Yu, H.Z.; Mishra, R.S. Additive friction stir deposition: A deformation processing route to metal additive manufacturing. Mater. Res. Lett. 2021, 9, 71–83. [Google Scholar] [CrossRef]
- Srivastava, M.; Rathee, S.; Maheshwari, S.; Noor Siddiquee, A.; Kundra, T.K. A Review on Recent Progress in Solid State Friction Based Metal Additive Manufacturing: Friction Stir Additive Techniques. Crit. Rev. Solid State Mater. Sci. 2018, 44, 345–377. [Google Scholar] [CrossRef]
- Patel, M.; Chaudhary, B.; Murugesan, J.; Jain, N.K. Additive Manufacturing of AA6063-ZrO2 Composite Using Friction Stir Surface Additive Manufacturing. Trans. Indian Inst. Met. 2023, 76, 581–588. [Google Scholar] [CrossRef]
- Chaudhary, B.; Jain, N.K.; Murugesan, J. Experimental investigation and parametric optimization of friction stir powder additive manufacturing process for aerospace-grade Al alloy. Int. J. Adv. Manuf. Technol. 2022, 123, 603–625. [Google Scholar] [CrossRef]
- Chen, H.Z.; Meng, X.C.; Chen, J.L.; Xie, Y.M.; Wang, J.Q.; Sun, S.M.; Zhao, Y.B.; Li, J.C.; Wan, L.; Huang, Y.X. Wire-based friction stir additive manufacturing. Addit. Manuf. 2023, 70, 9. [Google Scholar] [CrossRef]
- Tang, W.; Yang, X.; Tian, C. Influence of rotation speed on interfacial bonding mechanism and mechanical performance of aluminum 6061 fabricated by multilayer friction-based additive manufacturing. Int. J. Adv. Manuf. Technol. 2023, 126, 4119–4133. [Google Scholar] [CrossRef]
- Hartley, W.D.; Garcia, D.; Yoder, J.K.; Poczatek, E.; Forsmark, J.H.; Luckey, S.G.; Dillard, D.A.; Yu, H.Z. Solid-state cladding on thin automotive sheet metals enabled by additive friction stir deposition. J. Mater. Process. Technol. 2021, 291, 103557. [Google Scholar] [CrossRef]
- Luo, T.; Tang, W.S.; Wang, R.L.; Wang, S.W.; Xiao, L.; Yang, X.Q. Microstructure heterogeneity and mechanical properties of Mg-Gd-Y-Zr alloy fabricated by force-controlled additive friction stir deposition. Mater. Lett. 2023, 340, 134164. [Google Scholar] [CrossRef]
- Perry, M.E.J.; Griffiths, R.J.; Garcia, D.; Sietins, J.M.; Zhu, Y.H.; Yu, H.Z. Morphological and microstructural investigation of the non-planar interface formed in solid-state metal additive manufacturing by additive friction stir deposition. Addit. Manuf. 2020, 35, 101293. [Google Scholar] [CrossRef]
- Avery, D.Z.; Phillips, B.J.; Mason, C.J.T.; Palermo, M.; Williams, M.B.; Cleek, C.; Rodriguez, O.L.; Allison, P.G.; Jordon, J.B. Influence of Grain Refinement and Microstructure on Fatigue Behavior for Solid-State Additively Manufactured Al-Zn-Mg-Cu Alloy. Metall. Mater. Trans. A 2020, 51, 2778–2795. [Google Scholar] [CrossRef]
- Griffiths, R.J.; Petersen, D.T.; Garcia, D.; Yu, H.Z. Additive Friction Stir-Enabled Solid-State Additive Manufacturing for the Repair of 7075 Aluminum Alloy. Appl. Sci. 2019, 9, 3486. [Google Scholar] [CrossRef]
- Elshaghoul, Y.G.Y.; Seleman, M.; Bakkar, A.; Elnekhaily, S.A.; Albaijan, I.; Ahmed, M.M.Z.; Abdel-Samad, A.; Reda, R. Additive Friction Stir Deposition of AA7075-T6 Alloy: Impact of Process Parameters on the Microstructures and Properties of the Continuously Deposited Multilayered Parts. Appl. Sci. 2023, 13, 10255. [Google Scholar] [CrossRef]
- Phillips, B.J.; Williamson, C.J.; Kinser, R.P.; Jordon, J.B.; Doherty, K.J.; Allison, P.G. Microstructural and Mechanical Characterization of Additive Friction Stir-Deposition of Aluminum Alloy 5083 Effect of Lubrication on Material Anisotropy. Materials 2021, 14, 6732. [Google Scholar] [CrossRef]
- Shen, Z.; Zhang, M.; Li, D.; Liu, X.; Chen, S.; Hou, W.; Ding, Y.; Sun, Z.; Su, Y.; Li, W.; et al. Microstructural characterization and mechanical properties of AlMg alloy fabricated by additive friction stir deposition. Int. J. Adv. Manuf. Technol. 2023, 125, 2733–2741. [Google Scholar] [CrossRef]
- Li, Y.D.; Yang, B.B.; Zhang, M.; Wang, H.; Gong, W.; Lai, R.L.; Li, Y.P.; Teng, J.W. The corrosion behavior and mechanical properties of 5083 Al-Mg alloy manufactured by additive friction stir deposition. Corros. Sci. 2023, 213, 110972. [Google Scholar] [CrossRef]
- Ghadimi, H.; Ding, H.; Emanet, S.; Talachian, M.; Cox, C.; Eller, M.; Guo, S.M. Hardness Distribution of Al2050 Parts Fabricated Using Additive Friction Stir Deposition. Materials 2023, 16, 1278. [Google Scholar] [CrossRef]
- Rivera, O.G.; Allison, P.G.; Brewer, L.N.; Rodriguez, O.L.; Jordon, J.B.; Liu, T.; Whittington, W.R.; Martens, R.L.; McClelland, Z.; Mason, C.J.T.; et al. Influence of texture and grain refinement on the mechanical behavior of AA2219 fabricated by high shear solid state material deposition. Mater. Sci. Eng. A 2018, 724, 547–558. [Google Scholar] [CrossRef]
- Joshi, S.S.; Patil, S.M.; Mazumder, S.; Sharma, S.; Riley, D.A.; Dowden, S.; Banerjee, R.; Dahotre, N.B. Additive friction stir deposition of AZ31B magnesium alloy. J. Magnes. Alloys 2022, 10, 2404–2420. [Google Scholar] [CrossRef]
- Mason, C.J.T.; Rodriguez, R.I.; Avery, D.Z.; Phillips, B.J.; Bernarding, B.P.; Williams, M.B.; Cobbs, S.D.; Jordon, J.B.; Allison, P.G. Process-structure-property relations for as-deposited solid-state additively manufactured high-strength aluminum alloy. Addit. Manuf. 2021, 40, 101879. [Google Scholar] [CrossRef]
- Griffiths, R.J.; Garcia, D.; Song, J.; Vasudevan, V.K.; Steiner, M.A.; Cai, W.; Yu, H.Z. Solid-state additive manufacturing of aluminum and copper using additive friction stir deposition: Process-microstructure linkages. Materialia 2021, 15. [Google Scholar] [CrossRef]
- Agrawal, P.; Haridas, R.S.; Yadav, S.; Thapliyal, S.; Dhal, A.; Mishra, R.S. Additive friction stir deposition of SS316: Effect of process parameters on microstructure evolution. Mater. Charact. 2023, 195, 112470. [Google Scholar] [CrossRef]
- Alzahrani, B.; Seleman, M.; Ahmed, M.M.Z.; Elfishawy, E.; Ahmed, A.M.Z.; Touileb, K.; Jouini, N.; Habba, M.I.A. The Applicability of Die Cast A356 Alloy to Additive Friction Stir Deposition at Various Feeding Speeds. Materials 2021, 14, 6018. [Google Scholar] [CrossRef]
- Chen, G.; Wu, K.; Wang, Y.; Zhu, Z.; Nie, P.; Hu, F. Effect of rotational speed and feed rate on microstructure and mechanical properties of 6061 aluminum alloy manufactured by additive friction stir deposition. Int. J. Adv. Manuf. Technol. 2023, 127, 1165–1176. [Google Scholar] [CrossRef]
- Chen, L.; Lu, L.K.; Zhu, L.; Yang, Z.W.; Zhou, W.F.; Ren, X.D.; Zhang, X.Z. Microstructure Evolution and Mechanical Properties of Multilayer AA6061 Alloy Fabricated by Additive Friction Stir Deposition. Metall. Mater. Trans. A 2024, 55, 1049–1064. [Google Scholar] [CrossRef]
- Babaniaris, S.; Jiang, L.; Varma, R.K.; Farabi, E.; Dorin, T.; Barnett, M.; Fabijanic, D. Precipitation in AA6063 produced from swarf using additive friction stir deposition. Addit. Manuf. Lett. 2022, 3, 100096. [Google Scholar] [CrossRef]
- GB/T16865-2023; Test Pieces and Methods for Tensile Test for Wrought Aluminium, Magnesium and Their Alloy Products. Standardization Administration of China: Beijing, China, 2023.
- Chen, L.; Zhu, L.; Lu, L.; Yang, Z.; Ren, X.; Zhang, X. The effect of heat treatment on the microstructure and electrochemical corrosion behavior of multilayer AA6061 alloy fabricated by additive friction stir deposition. Appl. Surf. Sci. 2024, 650, 159167. [Google Scholar] [CrossRef]
- Aruga, Y.; Kozuka, M.; Takaki, Y.; Sato, T. Evaluation of Solute Clusters Associated with Bake-Hardening Response in Isothermal Aged Al-Mg-Si Alloys Using a Three-Dimensional Atom Probe. Metall. Mater. Trans. A 2014, 45, 5906–5913. [Google Scholar] [CrossRef]
- Sun, Y.C.; Zhang, B.; Xu, Z.; Wang, H.B.; Li, S.L.; Tian, S.Y. Microstructure evolution and recrystallization behavior of hot rolled AA6061 twin-roll casting plate with different manganese contents. J. Alloys Compd. 2022, 918, 165618. [Google Scholar] [CrossRef]
- Perry, M.E.J.; Rauch, H.A.; Griffiths, R.J.; Garcia, D.; Sietins, J.M.; Zhu, Y.; Zhu, Y.; Yu, H.Z. Tracing plastic deformation path and concurrent grain refinement during additive friction stir deposition. Materialia 2021, 18, 101159. [Google Scholar] [CrossRef]
- Tang, W.; Yang, X.; Tian, C.; Xu, Y. Microstructural heterogeneity and bonding strength of planar interface formed in additive manufacturing of Al−Mg−Si alloy based on friction and extrusion. Int. J. Miner. Metall. Mater. 2022, 29, 1755–1769. [Google Scholar] [CrossRef]
- Peng, Y.; Huang, B.; Zhong, Y.; Su, C.; Tao, Z.; Rong, X.; Li, Z.; Tang, H. Electrochemical corrosion behavior of 6061 Al alloy under high rotating speed submerged friction stir processing. Corros. Sci. 2023, 215, 111029. [Google Scholar] [CrossRef]
- Zhu, X.Y.; Fan, Y.X.; Xie, L.W.; Xiao, X.; Wang, P.; Yang, S.; Jiang, C. Effect of Rotation Speed on Microstructure and Mechanical Properties of Continuous Drive Friction Welded Dissimilar Joints of 6061-T6 Al and Copper. Metals 2022, 12, 1173. [Google Scholar] [CrossRef]
- Chen, G.; Wu, K.; Wang, Y.; Sun, Y.; Wang, X.; Zhu, Z.; Hu, F. Quantitative study on the correlation between microstructure and mechanical properties of additive friction stir deposited 6061-T6 Al-Mg-Si alloy. J. Mater. Res. Technol. 2023, 25, 6725–6736. [Google Scholar] [CrossRef]
- Barrett, C.D.; Imandoust, A.; Oppedal, A.L.; Inal, K.; Tschopp, M.A.; El Kadiri, H. Effect of grain boundaries on texture formation during dynamic recrystallization of magnesium alloys. Acta Mater. 2017, 128, 270–283. [Google Scholar] [CrossRef]
- Basu, I.; Al-Samman, T. Twin recrystallization mechanisms in magnesium-rare earth alloys. Acta Mater. 2015, 96, 111–132. [Google Scholar] [CrossRef]


Disclaimer/Publisher’s Note: The statements, opinions and data contained in all publications are solely those of the individual author(s) and contributor(s) and not of MDPI and/or the editor(s). MDPI and/or the editor(s) disclaim responsibility for any injury to people or property resulting from any ideas, methods, instructions or products referred to in the content. |
© 2024 by the authors. Licensee MDPI, Basel, Switzerland. This article is an open access article distributed under the terms and conditions of the Creative Commons Attribution (CC BY) license (https://creativecommons.org/licenses/by/4.0/).