
Simultaneous Double Dose Measurements Using TLD-100H


Abstract
1. Introduction
2. Materials and Methods
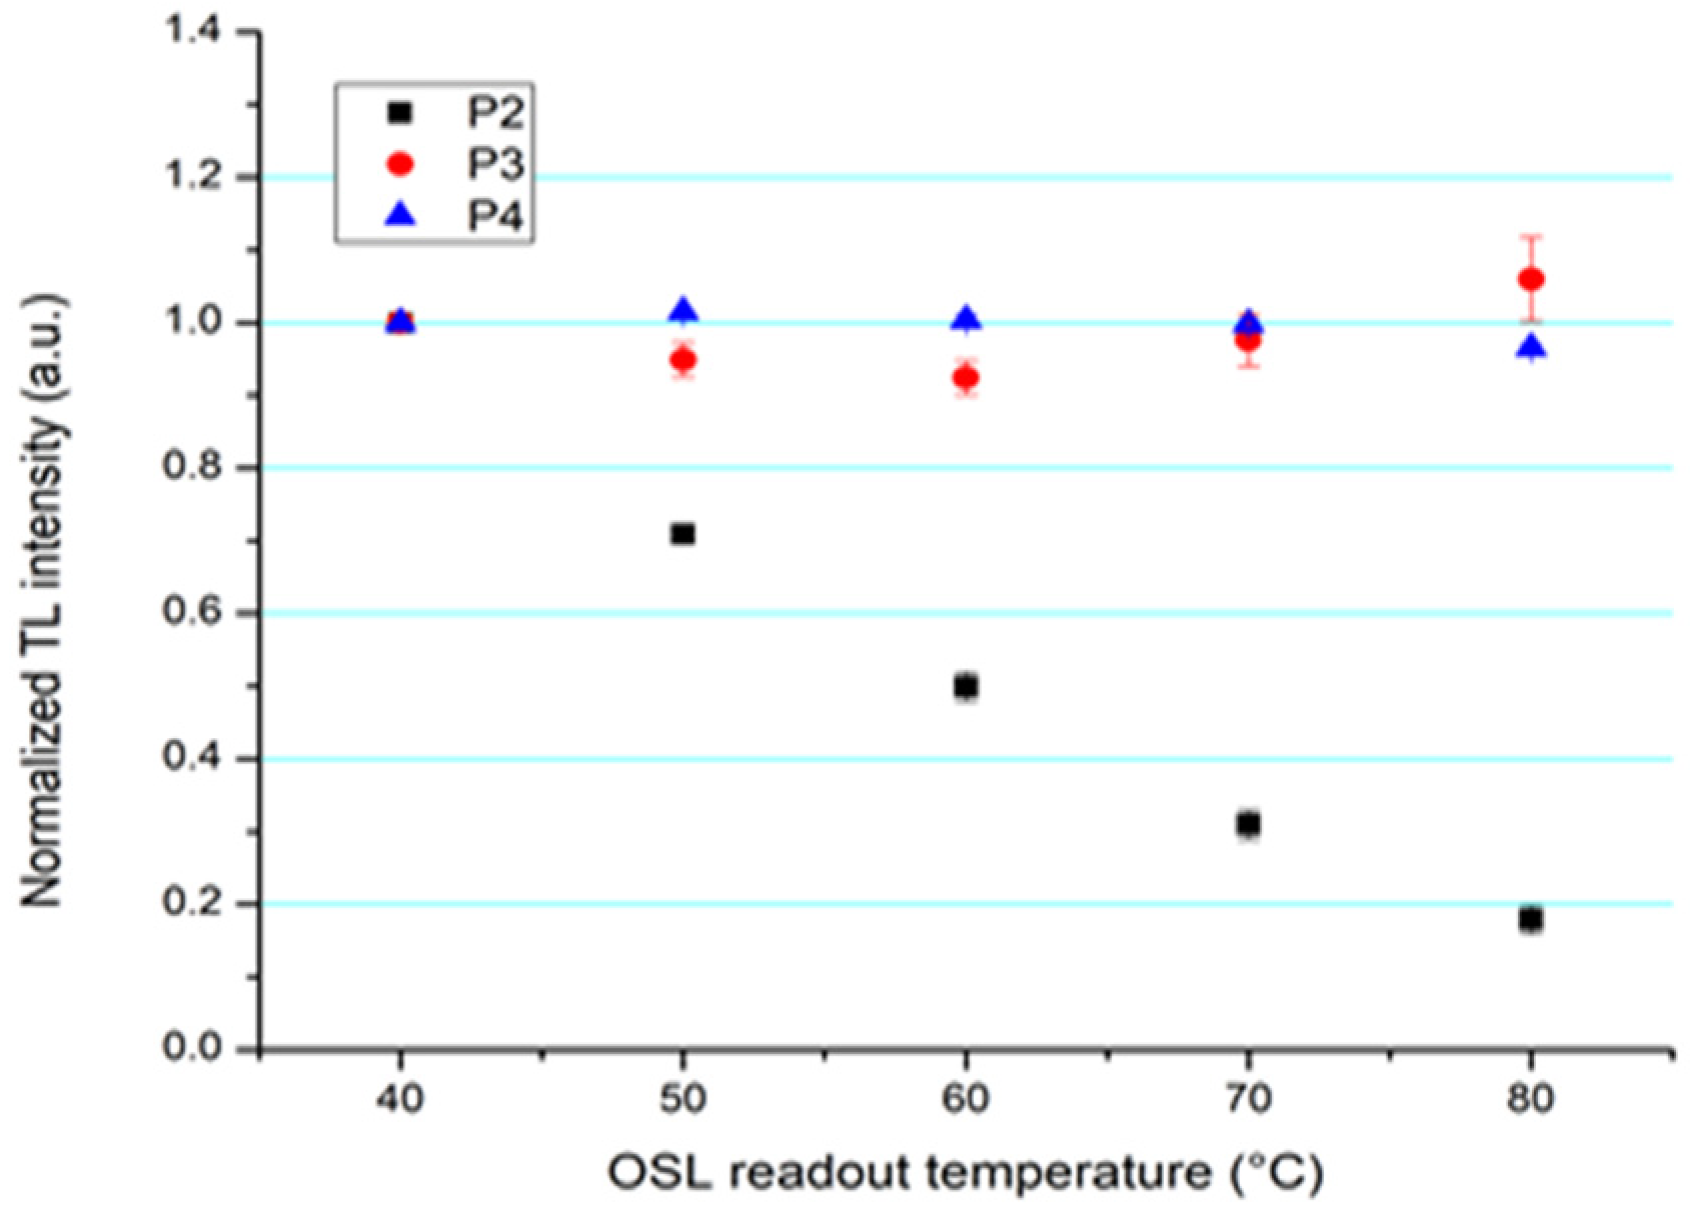
2.1. Effect of Temperature OSL Readout on ResTL
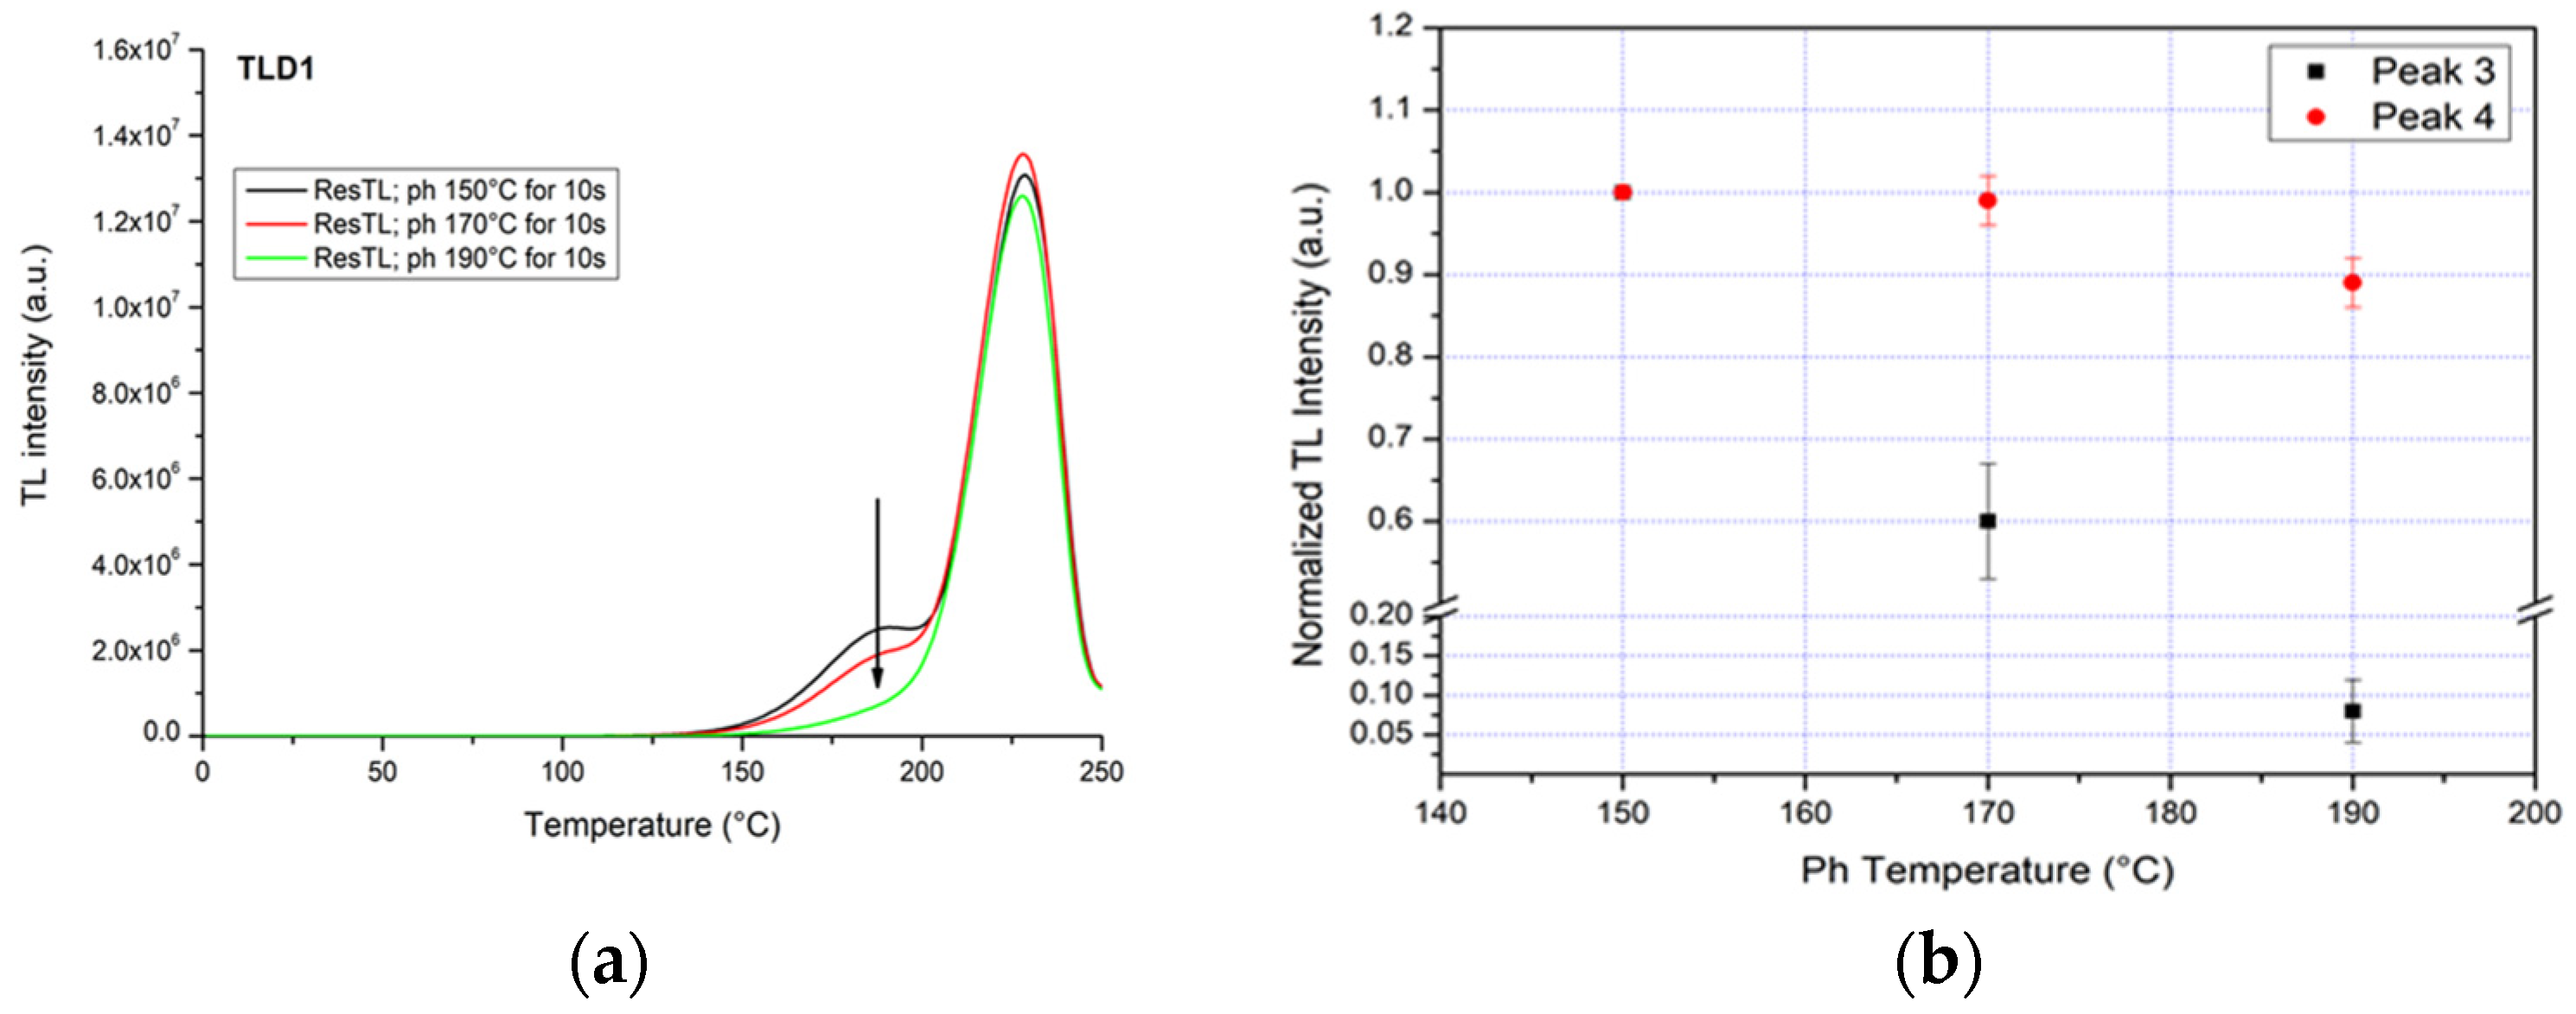
2.2. Pre-Heat Temperature in OSL and ResTL
2.3. Fading and Calibration Curves
3. Results and Discussion
3.1. Effect of Temperature OSL Readout on ResTL
3.2. Pre-Heat Temperature in OSL and ResTL
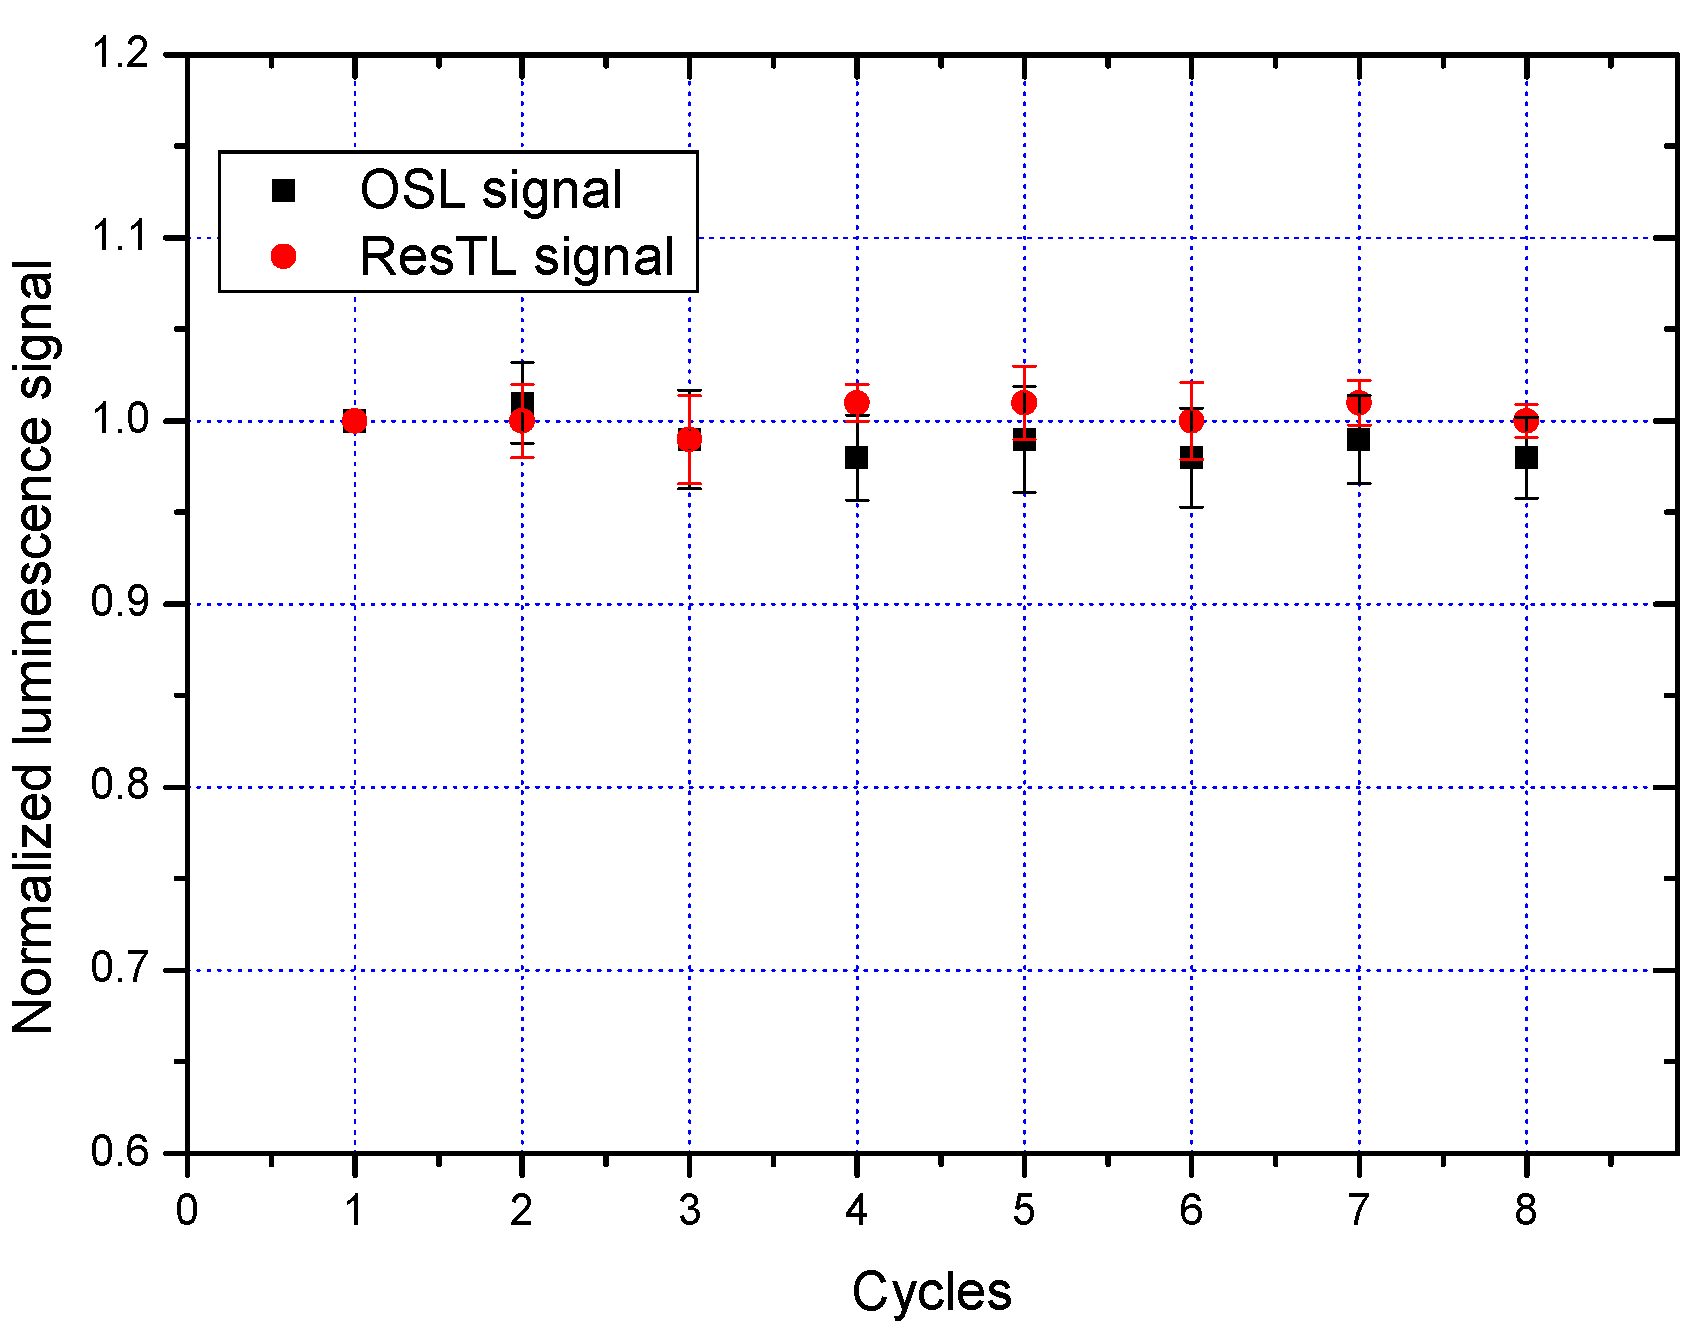
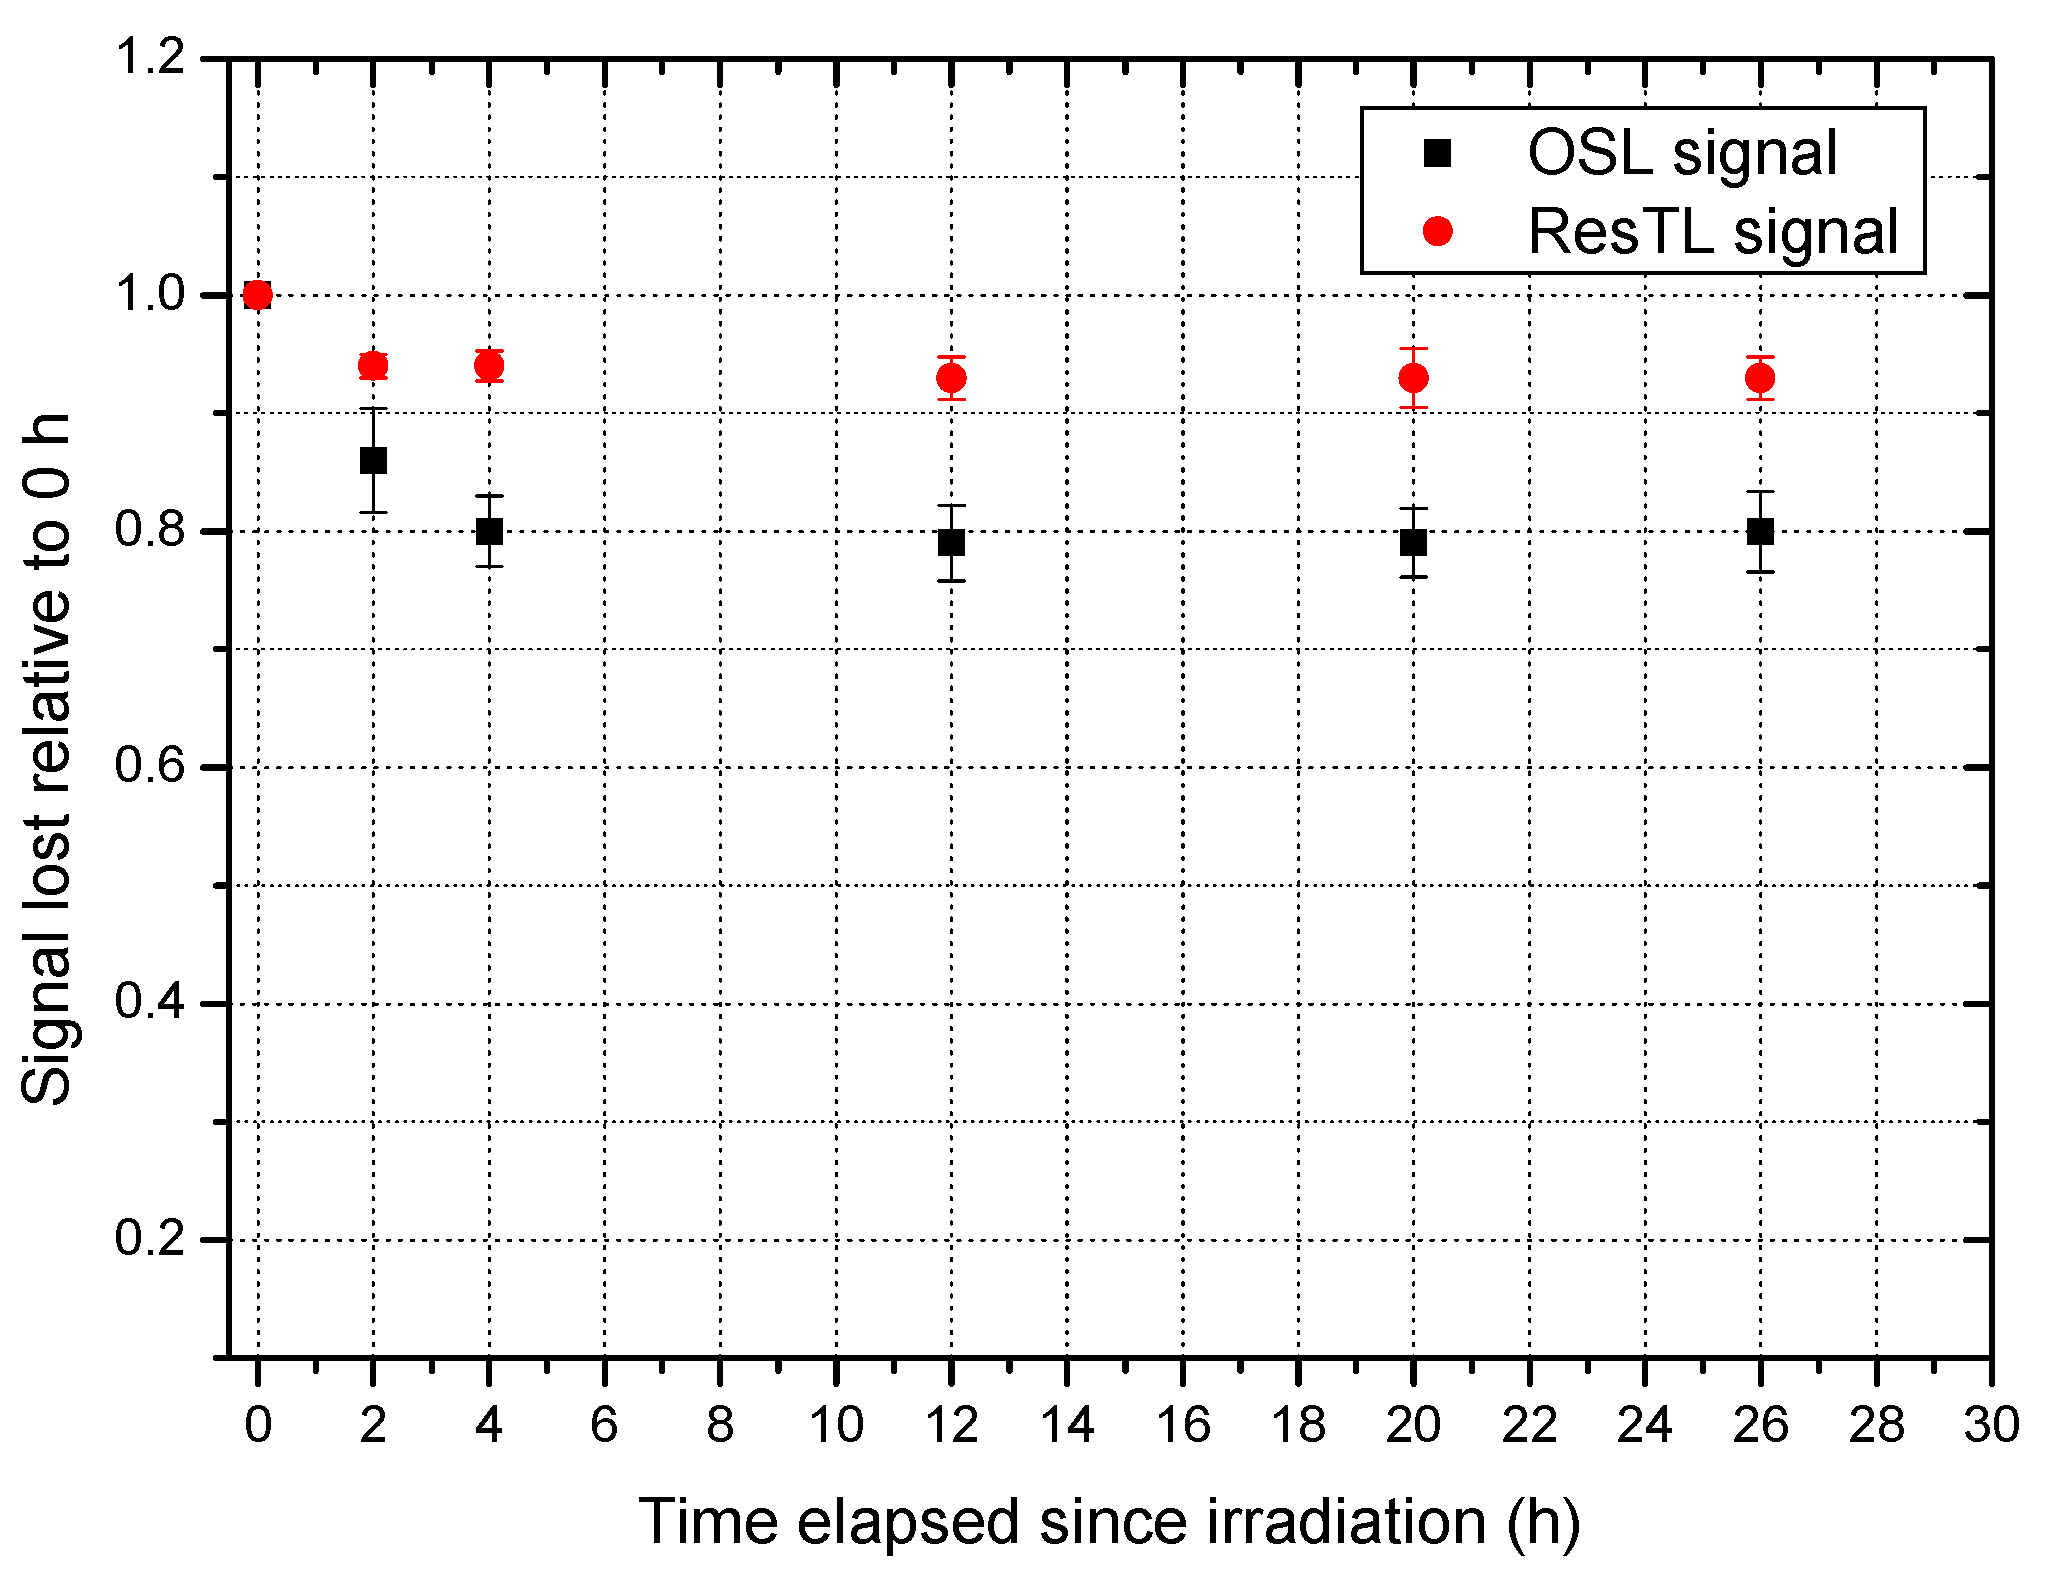
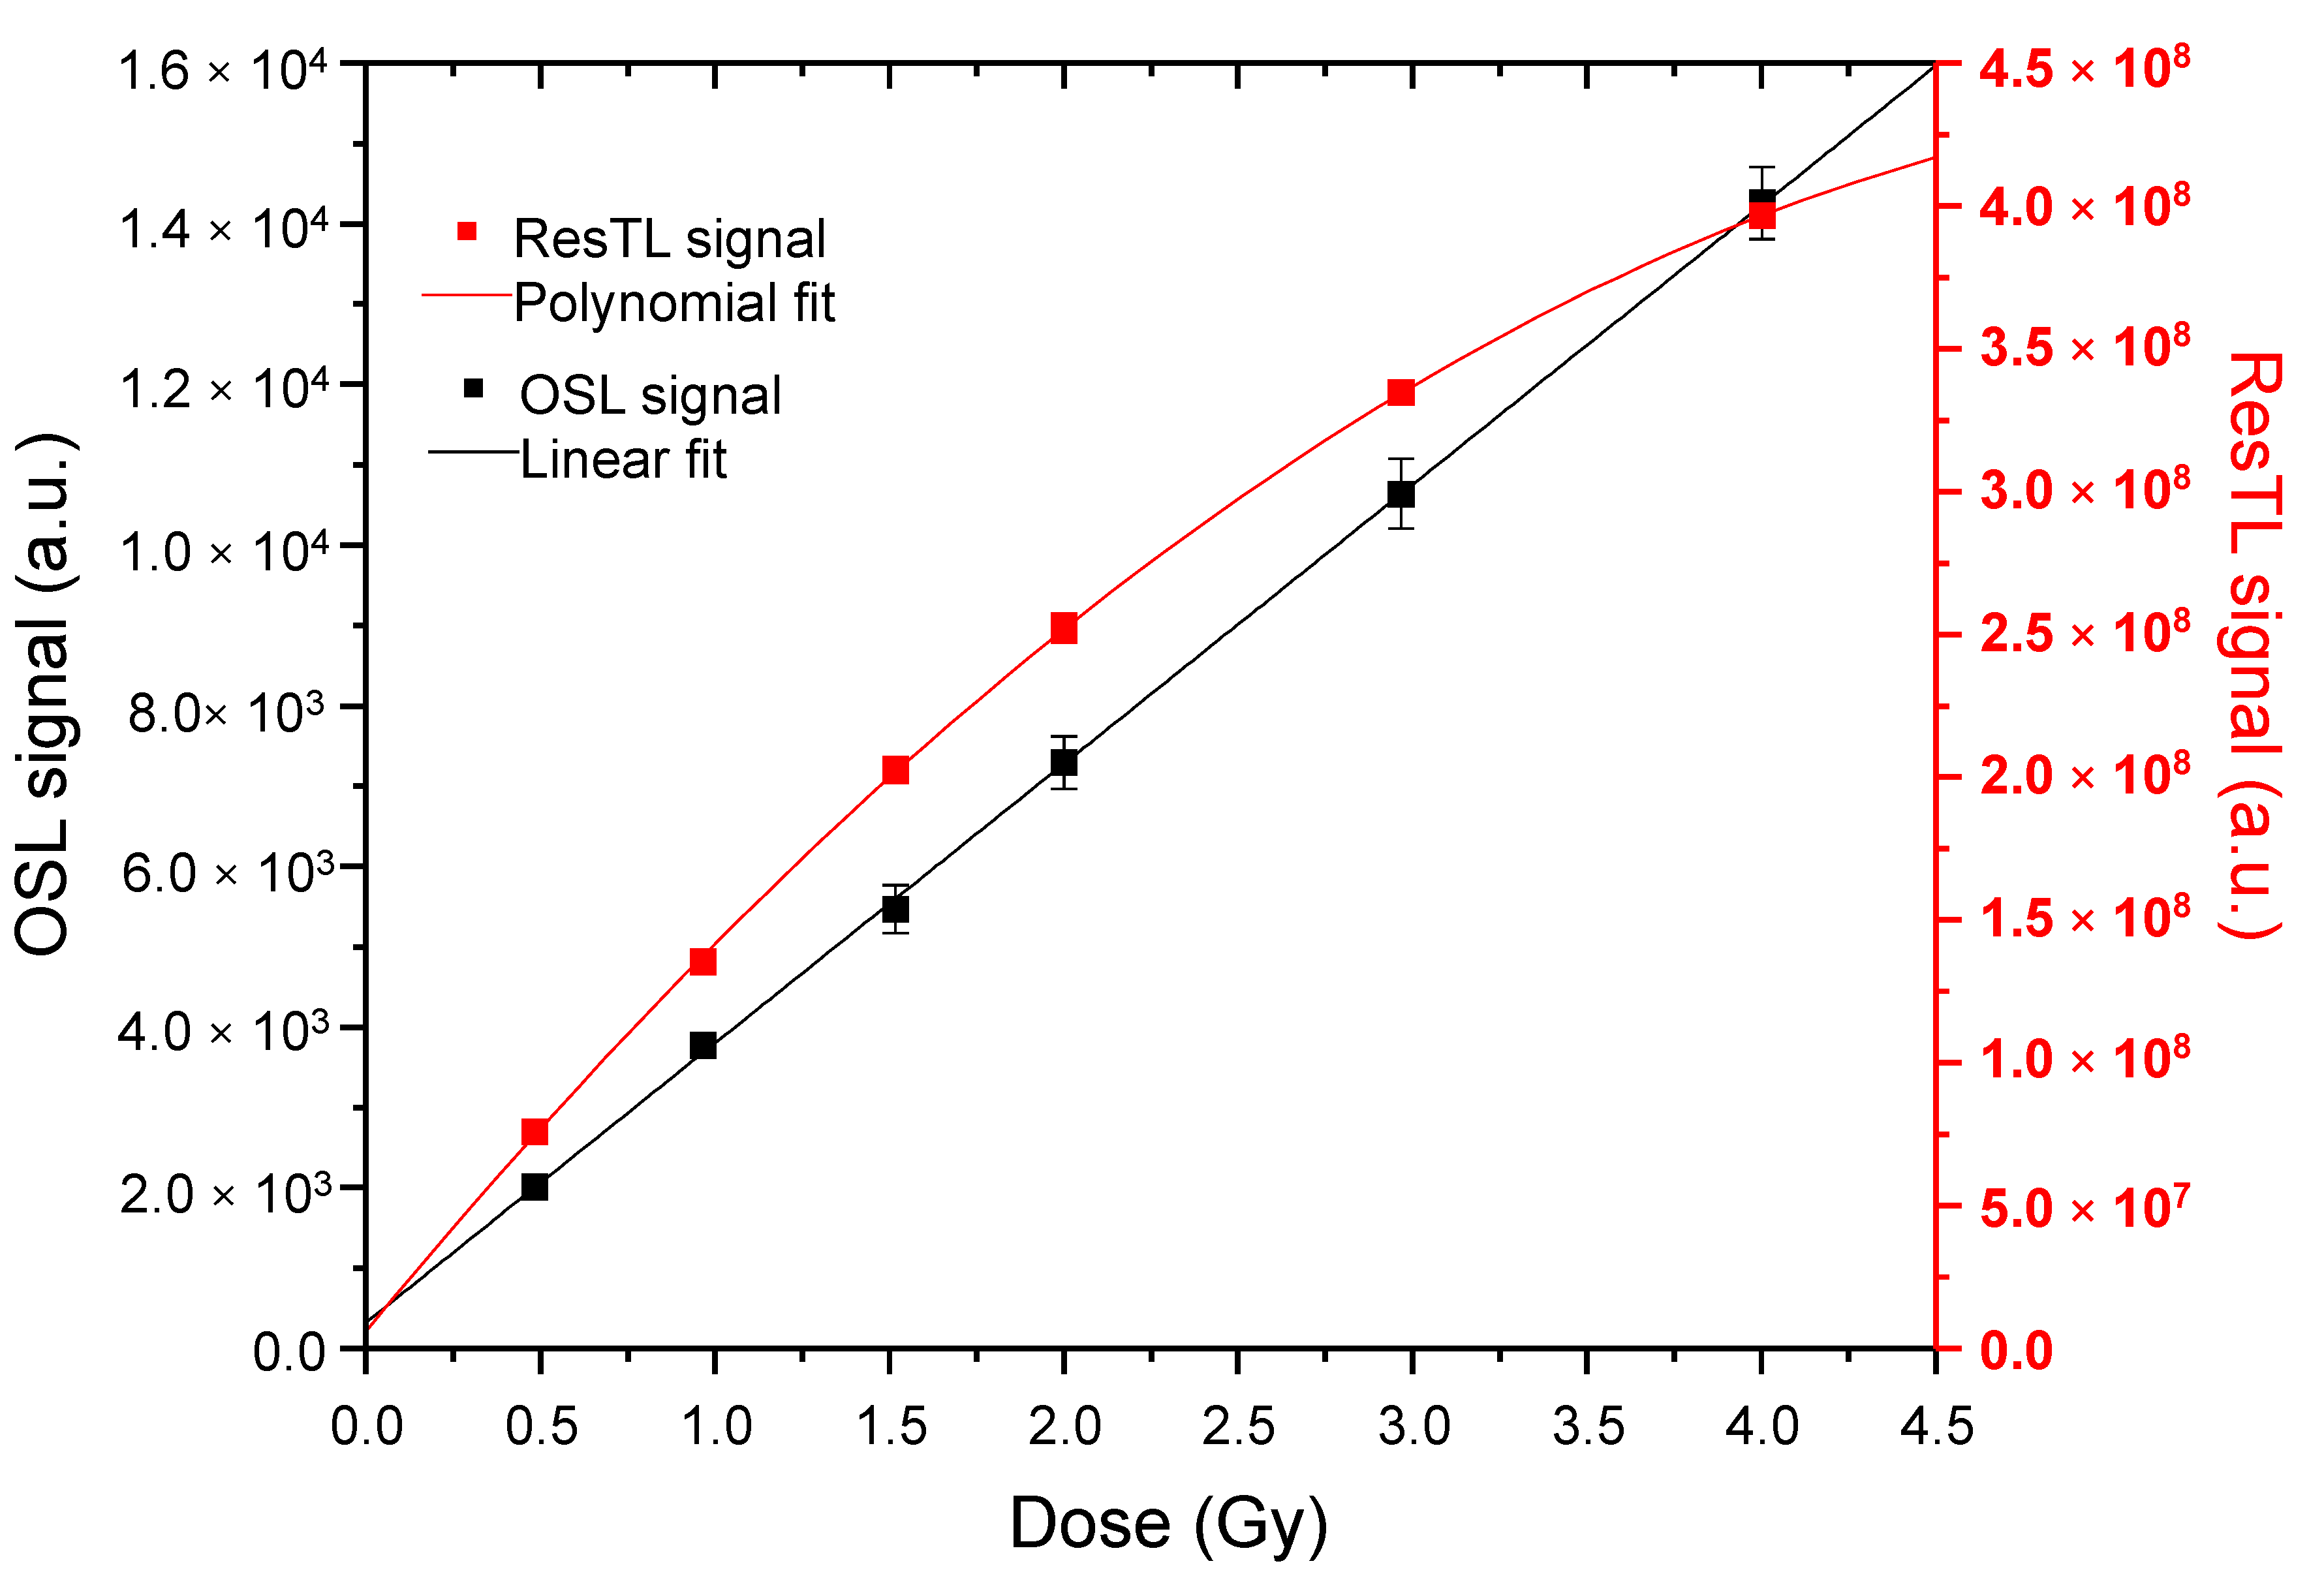
3.3. Fading and Calibration Curves
4. Conclusions
Author Contributions
Funding
Data Availability Statement
Conflicts of Interest
References
- Nakajima, T.; Murayama, Y.; Matsuzawa, T.; Koyano, A. Development of a new highly sensitive LiF thermoluminescence dosimeter and its applications. Nucl. Instrum. Methods 1978, 157, 155–162. [Google Scholar] [CrossRef]
- Moscovitch, M. Personnel dosimetry using LiF:Mg,Cu,P. Radiat. Prot. Dosim. 1999, 85, 49–56. [Google Scholar] [CrossRef]
- Wu, D.K.; Sun, F.Y.; Dai, H.C. A high sensitivity LiF thermoluminescent dosimeter-LiF(Mg, Cu, P). Health Phys. 1984, 46, 1063–1067. [Google Scholar] [PubMed]
- Shoushan, W. The dependence of thermoluminescence response and glow curve structure of LiF(Mg, Cu, P) TL materials on Mg, Cu, P dopants concentration. Radiat. Prot. Dosim. 1988, 25, 133–136. [Google Scholar] [CrossRef]
- Horowitz, A.; Horowitz, Y.S. Optimisation of LiF:Cu,Mg,P for radiation protection dosimetry. Radiat. Prot. Dosim. 1990, 33, 267–270. [Google Scholar] [CrossRef]
- Kolotilin, V.V.; Hokhrekov, V.I.; Tarasova, L.M.; Zakhriapin, S.B. A high sensitivity LiF Mg, Cu, P thermoluminescent dosimeter. Nucl. Tracks Radiat. Meas. 1993, 21, 169–171. [Google Scholar] [CrossRef]
- Wang, S.; Wang, Y.; Cai, G.; Wang, S.; Zha, Z. A new TL detector developed for multiple applications. Radiat. Prot. Dosim. 1993, 47, 223–225. [Google Scholar] [CrossRef]
- Patil, R.R.; Moharil, S.V. On the role of copper impurity in LiF: Mg, Cu, P phosphor. J. Phys. Condens. Matter 1995, 7, 9925. [Google Scholar] [CrossRef]
- Bilski, P.; Budzanowski, M.; Olko, P. Dependence of LiF:Mg,Cu,P (MCP-N) glow-curve structure on dopant composition and thermal treatment. Radiat. Prot. Dosim. 1997, 69, 187–198. [Google Scholar] [CrossRef]
- Shinde, S.S.; Dhabekar, B.S.; Rao, T.G.; Bhatt, B.C. Preparation, thermoluminescent and electron spin resonance characteristics of LiF:Mg,Cu,P phosphor. J. Phys. D Appl. Phys. 2001, 34, 2683. [Google Scholar] [CrossRef]
- Moscovitch, M.; Horowitz, Y.S. Thermoluminescent materials for medical applications: LiF:Mg,Ti and LiF:Mg,Cu,P. Radiat. Meas. 2006, 41, S71–S77. [Google Scholar] [CrossRef]
- Ben-Shachar, B.; Weinstein, M.; German, U. Li:Mg,Cu,P versus LiF:Mg,Ti: A comparison of Some dosimetric properties. Isr. Nucl. Soc. 1999, 31, 181–184. [Google Scholar]
- Stella, G.; Mazzaglia, S.; Pace, M.; Tonghi, L.B.; Tuvè, C.; Gueli, A.M. QA for calibration procedures of TLDs 100H in low doses range. J. Instrum. 2019, 14, P06023. [Google Scholar] [CrossRef]
- Pace, M.; Stella, G.; Tonghi, L.B.; Mazzaglia, S.; Gueli, A.M. CT-dose measurement of the spinal cord region using XR-QA2 radiochromic films and TLD 100H dosimeters. Instruments 2020, 4, 19. [Google Scholar] [CrossRef]
- Jursinic, P.A. Characterization of optically stimulated luminescent dosimeters, OSLDs, for clinical dosimetric measurements. Med. Phys. 2007, 34, 4594. [Google Scholar] [CrossRef] [PubMed]
- McKeever, S.W.S.; Moscovitch, M. On the advantages and disadvantages of optically stimulated luminescence dosimetry and thermoluminescence dosimetry. Radiat. Prot. Dosim. 2003, 104, 263. [Google Scholar] [CrossRef] [PubMed]
- Olko, P. Advantages and disadvantages of luminescence dosimetry. Radiat. Meas. 2010, 45, 506. [Google Scholar] [CrossRef]
- Stella, G.; Cavalli, N.; Marino, C.; Mazzaglia, S.; Gueli, A.M. Dosimetry from OSL and Residual TL with TLD 400. J. Instrum. 2019, 14, P12014. [Google Scholar] [CrossRef]
- Kafadar, V.E.; Yazici, A.N.; Yildirim, R.G. The effects of heating rate on the dose response characteristics of TLD-200, TLD-300 and TLD-400. Nucl. Instrum. Meth. B 2009, 267, 3337–3346. [Google Scholar] [CrossRef]
- Akselrod, M.S.; Bøtter-Jensen, L.; McKeever, S.W.S. Optically stimulated luminescence and its use in medical dosimetry. Radiat. Meas. 2007, 41, S78. [Google Scholar] [CrossRef]
- Kearfott, K.J.; West, W.G.; Rafique, M. The optically stimulated luminescence (OSL) properties of LiF:Mg,TI, Li2B4O7:CU, CaSO4:Tm, and CaF2:MN thermoluminescent (TL) materials. Appl. Radiat. Isot. 2015, 99, 155. [Google Scholar] [CrossRef] [PubMed]
- Bonanno, E.; Cavalli, N.; Stella, G.; D’Agostino, A.; Girlando, A.; Pisasale, G.; Ricottone, N.; Marino, C. Commissioning of a new commercial Optically Stimulated Luminescence (OSL) dosimetry system for VMAT treatments verifications. J. Instrum. 2020, 15, P05027. [Google Scholar] [CrossRef]
- Kry, S.F.; Alvarez, P.; Cygler, J.E.; DeWerd, L.A.; Howell, R.M.; Meeks, S.; O’Daniel, J.; Reft, C.; Sawakuchi, G.; Yukihara, E.G. AAPM TG 191: Clinical use of luminescent dosimeters: TLDs and OSLDs. Med. Phys. 2020, 47, 19–51. [Google Scholar] [CrossRef] [PubMed]
- Available online: https://www.thermofisher.com (accessed on 9 April 2023).
- Kitis, G.; Gomez-Ros, J.M.; Tuyn, J.W.N. Computerised glow curve deconvolution using general and mixed order kinetics. J. Phys. D Appl. Phys. 1998, 31, 2636–2641. [Google Scholar] [CrossRef]
- Aitken, M.J. An Introduction to Optical Dating: The Dating of Quaternary Sediments by the Use of Photon Stimulated Luminescence; Oxford University Press: Oxford, UK, 1998. [Google Scholar]
- Galbraith, R.F.; Roberts, R.G. Statistical aspects of equivalent dose and error calculation and display in OSL dating: An overview and some recommendations. Quat. Geochronol. 2012, 11, 1. [Google Scholar] [CrossRef]
- Knoll, G.F. Radiation Detection & Measurement; John Wiley & Sons: Milan, MI, USA, 2010. [Google Scholar]
- Bilski, P.; Marczewska, B.; Twardak, A.; Mandowska, E.; Mandowski, A. OSL signal of Lithium fluoride and its relationship with TL glow-curves. Radiat. Meas. 2014, 71, 61–64. [Google Scholar] [CrossRef]
- Sądel, M.; Bilski, P.; Kłosowski, M. Optically stimulated luminescence of LiF:Mg,Cu,P powder—Influence of thermal treatment. Radiat. Prot. Dosim. 2019, 186, 488–495. [Google Scholar] [CrossRef]
- Bos, A.J.J. Theory of thermoluminescence. Radiat. Meas. 2007, 41, 45–56. [Google Scholar] [CrossRef]
- Mckeever, S.W.S.; Moscovitch, M.; Townsend, P.D. Thermoluminescence Dosimetry Materials: Properties and Uses; Nuclear Technology Publishing: Ashford, UK, 1995. [Google Scholar]


| Property | Values |
|---|---|
| Density, ρ (g/cm3) | 2.5 |
| Effective atomic number, Zeff | 8.31 |
| Temperature of the main TL peak (°C) | ≈210 |
| Emission Spectra (nm) | ≈370 |
| Sensitivity | 1 pGy–10 Gy |
| Sensitivity relative to LiF | 30 |
| Depth × Width × Height (mm) | 3.16 × 3.16 × 0.89 |
| Step | Treatment | Observed |
|---|---|---|
| 1 | Annealing (Heating @ 250 °C for 60 s) | |
| 2 | Annealing (Heating @ 250 °C for 60 s) | |
| 3 | -irradiation (2 Gy) | |
| 4 | CW-OSL with Blue LEDs at X °C (40.00 s, 90% power) | OSLx |
| 5 | Heating@250 °C, 1 °C/s | ResTLx |
| Step | Treatment | Observed |
|---|---|---|
| 1 | Annealing (Heating @ 250 °C for 60 s) | |
| 2 | Annealing (Heating @ 250 °C for 60 s) | |
| 3 | -irradiation (2 Gy) | |
| 4 | Pre-heat (X °C for 10 s) | |
| 5 | Heating@250 °C, 1 °C/s | TLx |
| 6 | Annealing (Heating @ 250 °C for 60 s) | |
| 7 | Annealing (Heating @ 250 °C for 60 s) | |
| 8 | -irradiation (2 Gy) | |
| 9 | Pre-heat (X °C for 10 s) | |
| 10 | CW-OSL with Blue LEDs at 40 °C (40.00 s, 90% power) | OSLx |
| 11 | Heating@250 °C, 1 °C/s | ResTLx |
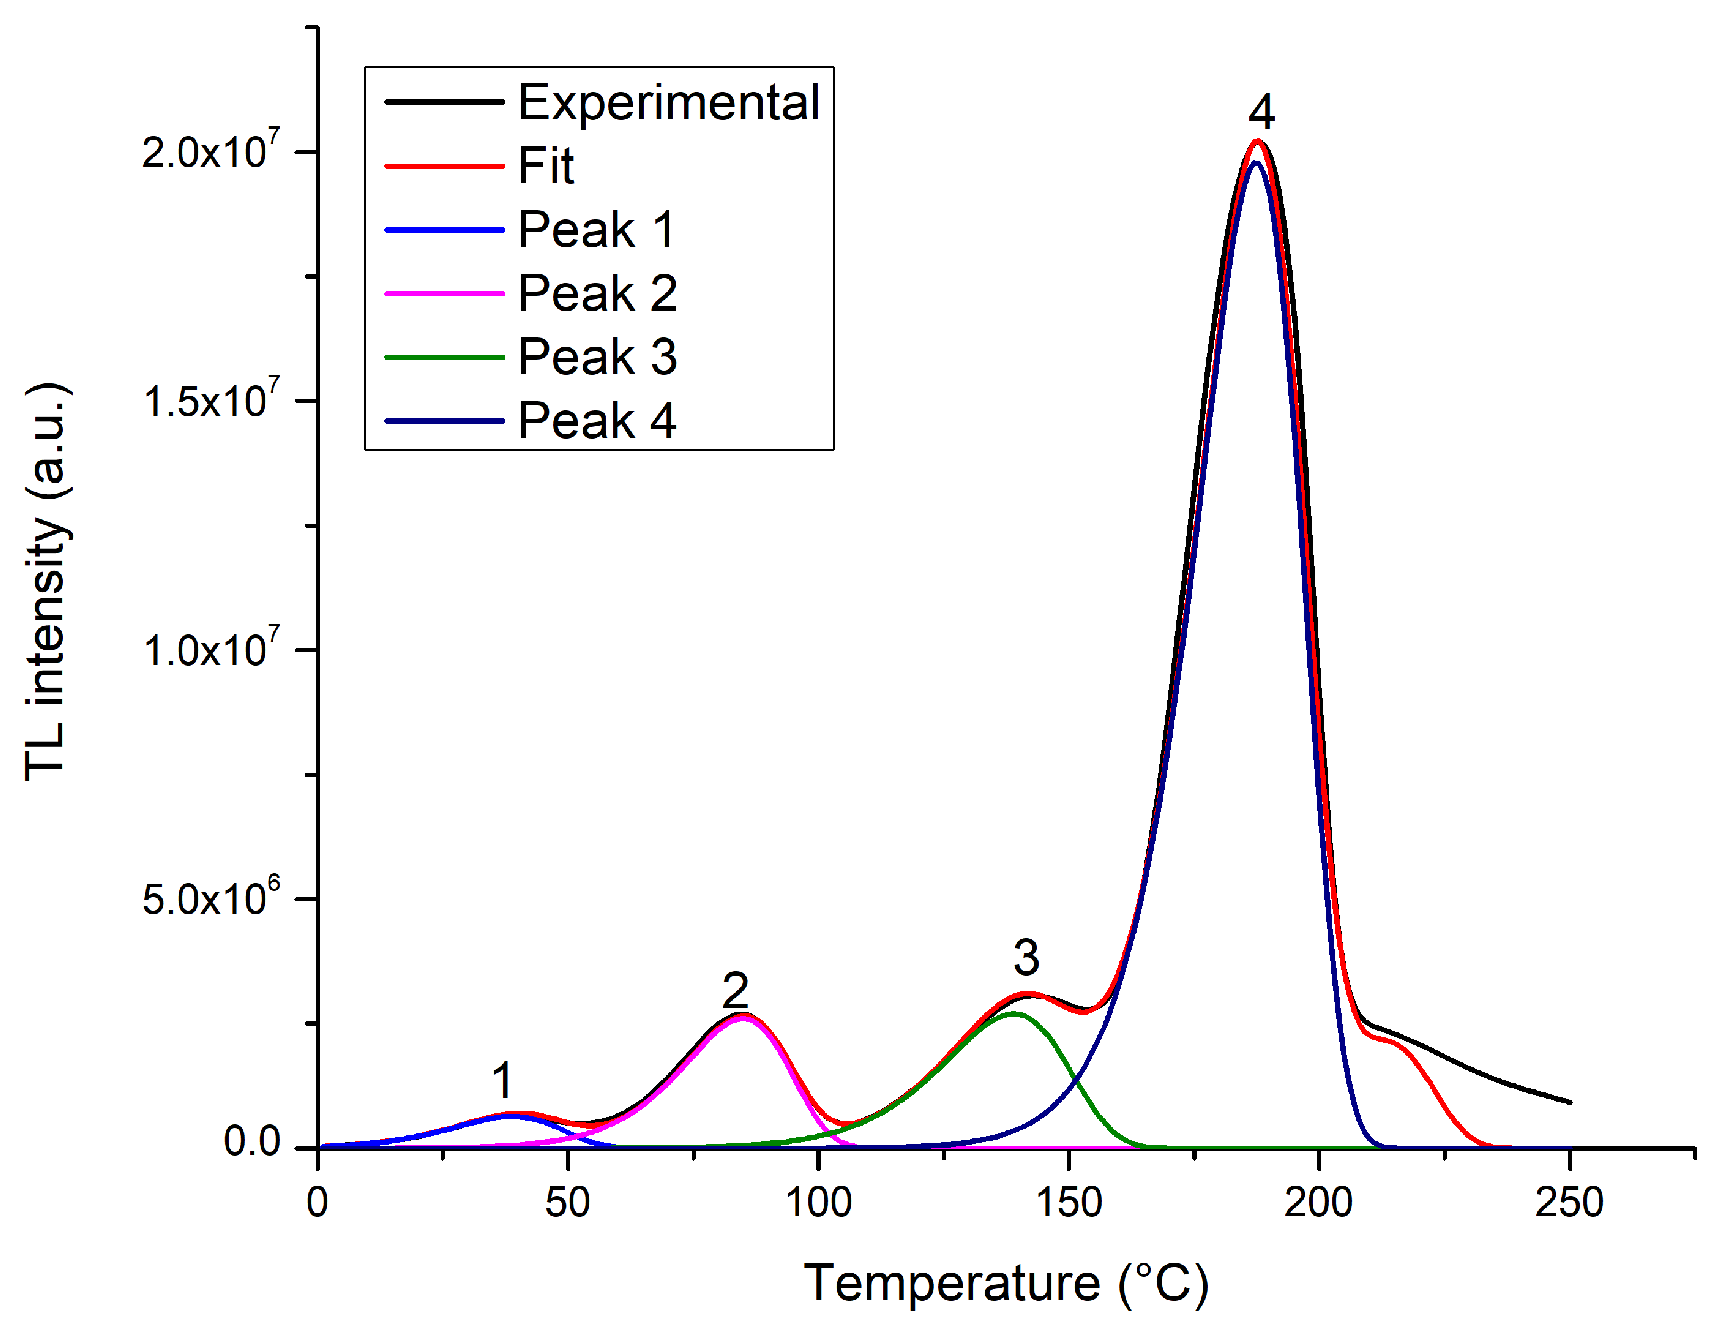
| Peak | (°C) | (eV) |
|---|---|---|
| 1 | 74 ± 2 | 0.93 ± 0.05 |
| 2 | 120 ± 3 | 1.22 ± 0.06 |
| 3 | 174 ± 3 | 1.35 ± 0.07 |
| 4 | 222 ± 4 | 1.97 ± 0.07 |
| OSL | Linear fit: y = a + bx | a = 3.24 × 10² ± 6.40 × 101 | R2 = 0.999 |
| b = 3.48 × 10³ ± 2.70 × 101 | |||
| ResTL | Pol fit: y = a + bx + cx2 | a = 6.08 × 10⁶ ± 1.98 × 10⁶ | R2 = 0.999 |
| b = 1.48 × 10⁸ ± 2.12 × 10⁶ | |||
| c = −1.26 × 10⁶ ± 4.60 × 10⁵ |
Disclaimer/Publisher’s Note: The statements, opinions and data contained in all publications are solely those of the individual author(s) and contributor(s) and not of MDPI and/or the editor(s). MDPI and/or the editor(s) disclaim responsibility for any injury to people or property resulting from any ideas, methods, instructions or products referred to in the content. |
© 2024 by the authors. Licensee MDPI, Basel, Switzerland. This article is an open access article distributed under the terms and conditions of the Creative Commons Attribution (CC BY) license (https://creativecommons.org/licenses/by/4.0/).
Share and Cite
Stella, G.; Sallah, A.; Galvagno, R.; D’Anna, A.; Gueli, A.M. Simultaneous Double Dose Measurements Using TLD-100H. Crystals 2024, 14, 603. https://doi.org/10.3390/cryst14070603
Stella G, Sallah A, Galvagno R, D’Anna A, Gueli AM. Simultaneous Double Dose Measurements Using TLD-100H. Crystals. 2024; 14(7):603. https://doi.org/10.3390/cryst14070603
Chicago/Turabian StyleStella, Giuseppe, Antouman Sallah, Rosaria Galvagno, Alessia D’Anna, and Anna Maria Gueli. 2024. "Simultaneous Double Dose Measurements Using TLD-100H" Crystals 14, no. 7: 603. https://doi.org/10.3390/cryst14070603
APA StyleStella, G., Sallah, A., Galvagno, R., D’Anna, A., & Gueli, A. M. (2024). Simultaneous Double Dose Measurements Using TLD-100H. Crystals, 14(7), 603. https://doi.org/10.3390/cryst14070603